population dynamics chapter 35. population dynamics key concepts include: interactions within and...
TRANSCRIPT

Population Dynamics
Chapter 35

Population Dynamics
Key concepts include:
• interactions within and among populations including carrying capacities, limiting factors, and growth curves;

Population: all the individuals of a species that live together in an area

Three Key Features of Populations
Size Density Dispersion
(clumped, even/uniform, random)

Three Key Features of Populations 1. Size: number of individuals in
an area
Estimating PopulationMark – Recapture – used to estimate animal population

Mark Recapture Capture an initial sample,
count and mark them Release the marked individuals Capture and count another
sample count marked individuals
recaptured

Formula
(1st sample x 2nd sample)
Number recaptured

Example: Mark - Recapture
100 ants are captured, marked and released. 90 ants are captured in the 2nd sample. 8 of the ants in the 2nd sample were marked.
100 x 90 = 9000= 1125 ants 8 8

Sample Plot
– used to estimate plant populations

Sample PlotRandomlyRandomly chosen chosen plots are selected and plots are selected and populations counted populations counted and averaged.and averaged.
The The averageaverage is used is used to to estimate the estimate the total total populationpopulation

Example
6
4
8
2
3
8+4+6+3+2= 23
23 = 4.6 5
4.6 x 100 = 460

Three Key Features of Populations 2. Density: measurement of
population per unit area or unit volume
Formula: Dp= N S
Pop. Density = # of individuals ÷ unit of space


Three Key Features of Populations 3. Dispersion: describes their
spacing relative to each other clumped even or uniform random

clumped
even (uniform)
random

Population Dispersion


Exponential Growth ideal, unregulated population growth Produces a J shaped curve

http://usrarecurrency.com/WebPgFl/C00015446A/1934$1000FRNSnC00015446A.jpg

After 4 days, $ 0.16 vs. $ 20,000

After 8 days, $ 2.55 vs. $ 40,000

9 2.56 5,000 10 5.12 5,000 11 10.24 5,000 12 20.48 5,000 TotalTotal $40.95$40.95 $60,000$60,000 13 40.96 5,000 14 81.92 5,000 15 163.84 5,000 16 327.68 5,000 TotalTotal $655.35$655.35 $80,000$80,000

17 655.36 5,000 18 1310.72 5,000 19 2621.44 5,000 20 5242.88 5,000 TotalTotal $10,485.75$10,485.75
$100,000$100,000

21 10,485.76 5,000 22 20,971.52 5,000 23 41,943.04 5,000 24 83,886.08 5,000 Total Total $167,772.15$167,772.15
$120,000$120,000

25 167,772.16 5,000 26 335,544.32 5,000 27 671,088.64 5,000 28 1,342,177.28 5,000 29 2,684,354.56 5,000 30 5,368,709.12 5,000 TotalTotal $10,737,418.23$10,737,418.23
$150,000$150,000


Factors that affect populations
Limiting factor- any biotic or abiotic factor that restricts the existence of organisms in a specific environment.EX.- Amount of water
Amount of foodTemperature

Factors that limit populations
Density-dependent factors- Biotic factors in the environment that have an increasing effect as population size increases
Ex. disease
competition (food supply) parasites
predators

Density-independent factors- Abiotic factors in the environment that affect populations regardless of their density
Ex. temperature
fire habitat destruction
drought
Factors that affect density

Carrying Capacity-
the maximum population size that can be supported by the available resources
There can only be as many organisms as the environmental
resources can support

Logistic Growth
Ideal growth that is slowed by limiting factors as the population increases
Produces an S shaped curve

Carrying Capacity
Carrying Capacity (k)
Nu
m
b
e
r
Time
J-shaped curve (exponential growth)
S-shaped curve (logistic growth)


Boom and Bust Cycles
Some populations fluctuate with regularity


Life History
The series of events from birth, through reproduction to death

2 Life History Patterns
1. R Strategists short life span small body size reproduce quickly have many offspring little parental care Ex: cockroaches,
weeds, bacteria

R strategist
These organisms produce as many offspring as possible.
Invest little in each offspring. In good conditions, populations
explode Good strategy for unpredictable
environments


2 Life History Patterns
2. K Strategists long life span large body size reproduce slowly have few young provides parental
care Ex: humans,
elephants

K strategists
These organisms produce few offspring and invest resources, time and their own safety to ensure survival of offspring
Good strategy for stability K= carrying capacity


Demography
the statistical study of populations, make predictions about how a population will change

1. Immigration- movement of individuals into a population
2. Emigration- movement of individuals out of a population
Movement of Populations
Immigration
Emigration
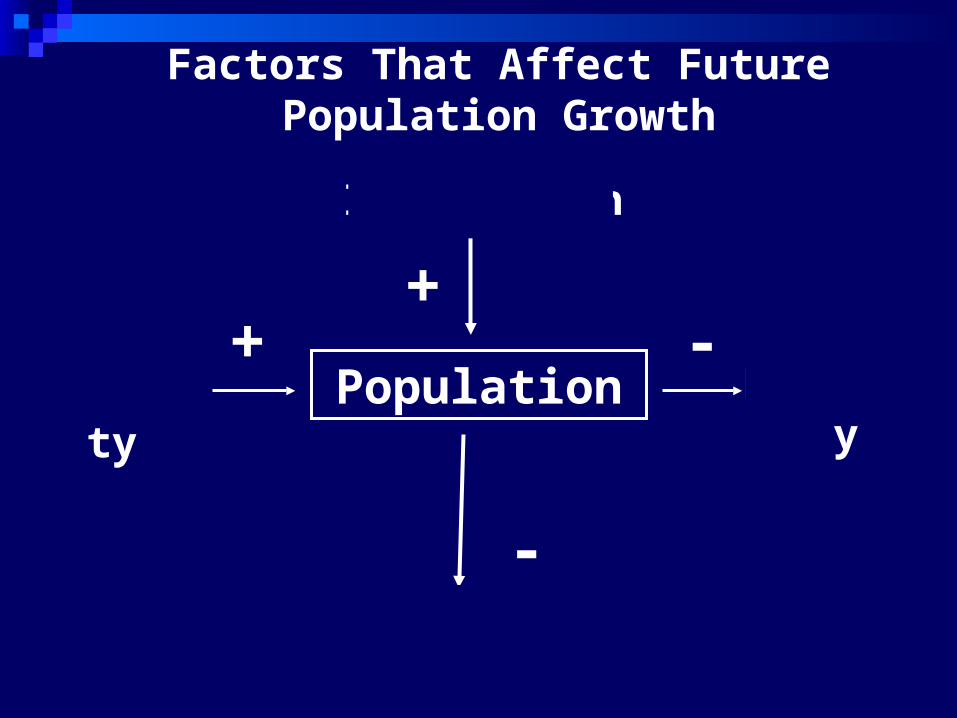
Natality MortalityPopulation+
+
-
-
Factors That Affect Future Population Growth

Key Features of Populations Growth Rate: Birth Rate
(natality) - Death Rate (mortality)
How many individuals are born vs. how many die
Birth rate (b) − death rate (d) = rate of natural increase (r).

PRE-REPRODUCTIVE
REPRODUCTIVE
POST-REPRODUCTIVE

Population of a Stable Country


Demographic Transition The movement from high birth and
high death rate to low death rate then lower birth rate

Human Population Growth


Human Population Growth

Time unit Births DeathsNatural
increase
Year 130,013,274 56,130,242
73,883,032
Month 10,834,440 4,677,520 6,156,919
Day 356,201 153,781
202,419
Hour 14,842 6,408 8,434
Minute 247
107 141
Second 4.1
1.8 2.3

************************************
*********************************************************

Chapter 36 Ecosystem Structure and Dynamics

Biodiversity
The number of different species in a community

Competition
Interspecific competition – two species compete for the same resource

Niche
is how an organism makes its living, or how it uses resourcesWhat it eats Its habitat

Competitive Exclusion
When two species occupy the same niche, one is displaced

Resource partitioning
In order for two species to inhabit the same area, they divide resources

Symbiotic Relationships
Symbiosis- two species living together
3 Types of
1. Commensalism
2. Parasitism
3. Mutualism

Symbiotic Relationships
Commensalism- one species benefits and the other is neither harmed nor helped
Ex. orchids on a tree

Symbiotic Relationships
Commensalism- one species benefits and the other is neither harmed nor helped
Ex. polar bears and cyanobacteria

Symbiotic Relationships
Parasitism- one species benefits (parasite)
and the other is harmed (host)
Parasite-Host relationship

Symbiotic Relationships
Parasitism- parasite-hostEx. lampreys, leeches, fleas,ticks,tapeworm

Symbiotic Relationships
Mutualism- beneficial to both species
Ex. cleaning birds and cleaner shrimp

Symbiotic Relationships
Mutualism- beneficial to both species
Ex. lichen


Type of relationship
Species harmed
Species benefits
Species neutral
Commensalism
Parasitism
Mutualism
= 1 species

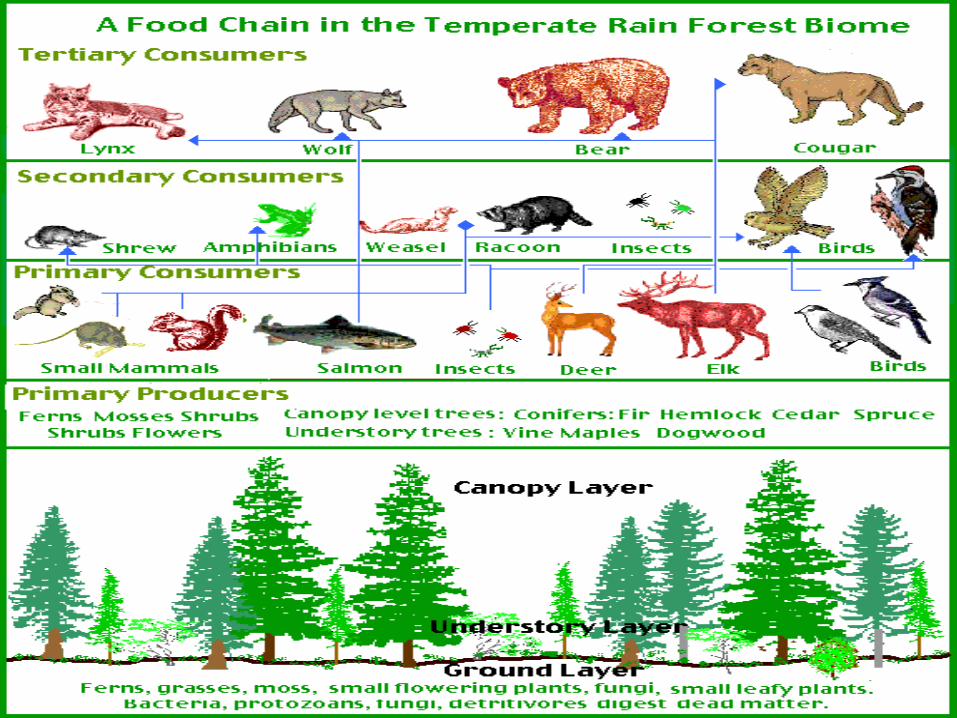
Trophic Levels
Each link in a food chain is known as a trophic level.
Trophic levels represent a feeding step in the transfer of energy and matter in an ecosystem.

Herbivores – eat only producers
Cows, Deer, Horses, Grasshoppers
Carnivores – eat only the flesh of other animalsWolves, Tigers, Bass, Orca

Detritovores – eat only dead organisms or wastes
Vultures, Carrion Beetles
Omnivores – eat both animals and plants
Bears, Pigs, Humans

Trophic Levels
Biomass- the amount of organic matter comprising a group of organisms in a habitat.
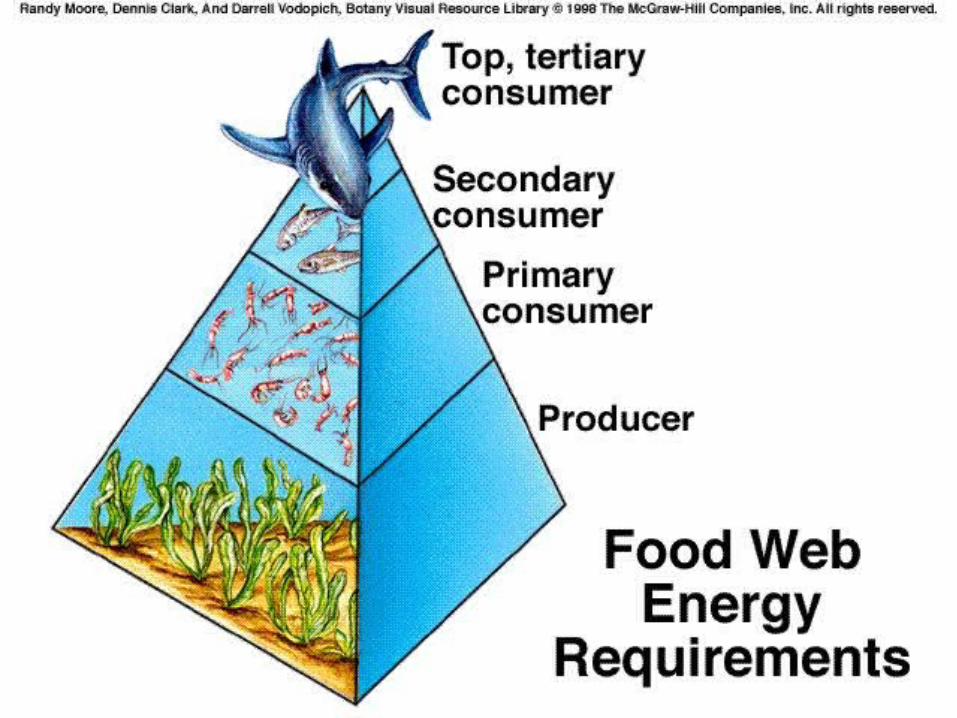
As you move up a food chain, both available energy and biomass decrease.
Energy is transferred upwards but is diminished with each transfer.

Energy Lost
90% is lost as heat
10% is passed on to the next level

Trophic Levels
Producers- Autotrophs
Primary consumers- Herbivores
Secondary consumers-small
carnivores
Tertiary consumers-
top carnivores
E
N
E
R
G
Y
EE
EE
EE


Trophic LevelsFood chain- simple model that
shows how matter and energy move through an ecosystem


Trophic Levels
Food web- shows all possible feeding relationships in a community at each trophic level
Represents a network of interconnected food chains

Food chain Food web(just 1 path of energy) (all possible energy
paths)


Nutrient Cycles
Cycling maintains homeostasis (balance) in the environment.
3 cycles to investigate:1. Water cycle2. Carbon cycle3. Nitrogen cycle

Water cycle-
Evaporation – liquid to gas Transpiration- evaporation through
leaves of plants Condensation- gas to liquid Precipitation- snow, rain, etc.

Water cycle-

Carbon cycle-
Photosynthesis and respiration cycle carbon and oxygen through the environment.

Carbon cycle-
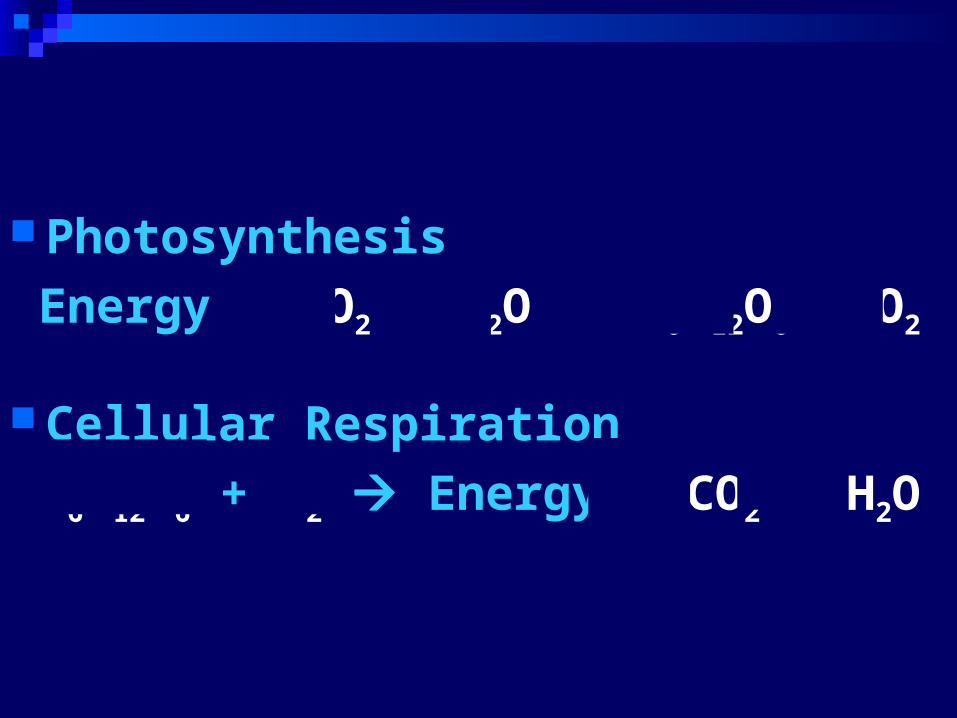
Photosynthesis
Energy + CO2 + H2O C6H12O6 + O2
Cellular Respiration
C6H12O6 + O2 Energy + CO2 + H2O

Nitrogen cycle- Atmospheric nitrogen (N2) makes up
nearly 78%-80% of air. Organisms can not use it in that form. Lightning and bacteria convert nitrogen
into usable forms.

Nitrogen cycle-
Only in certain bacteria and industrial technologies can fix nitrogen.
Nitrogen fixation -convert atmospheric nitrogen (N2) into ammonium (NH4
+) which can be used to make organic compounds like amino acids.
N2 NH4+

Nitrogen cycle-
Nitrogen-fixing bacteria:
Some live in a symbiotic relationship with plants of the legume family (e.g., soybeans, clover, peanuts).

Some nitrogen-fixing bacteria live free in the soil.
Nitrogen-fixing cyanobacteria are essential to maintaining the fertility of semi-aquatic environments like rice paddies.


Atmospheric nitrogenLightning
Nitrogen fixing
bacteria
Ammonium Nitrification by bacteria
Nitrites Nitrates
Denitrification by bacteria
Plants
Animals
Decomposers
Nitrogen Cycle

Toxins in food chains- While energy decreases as it moves up
the food chain, toxins increase in potency.
This is called biological magnification

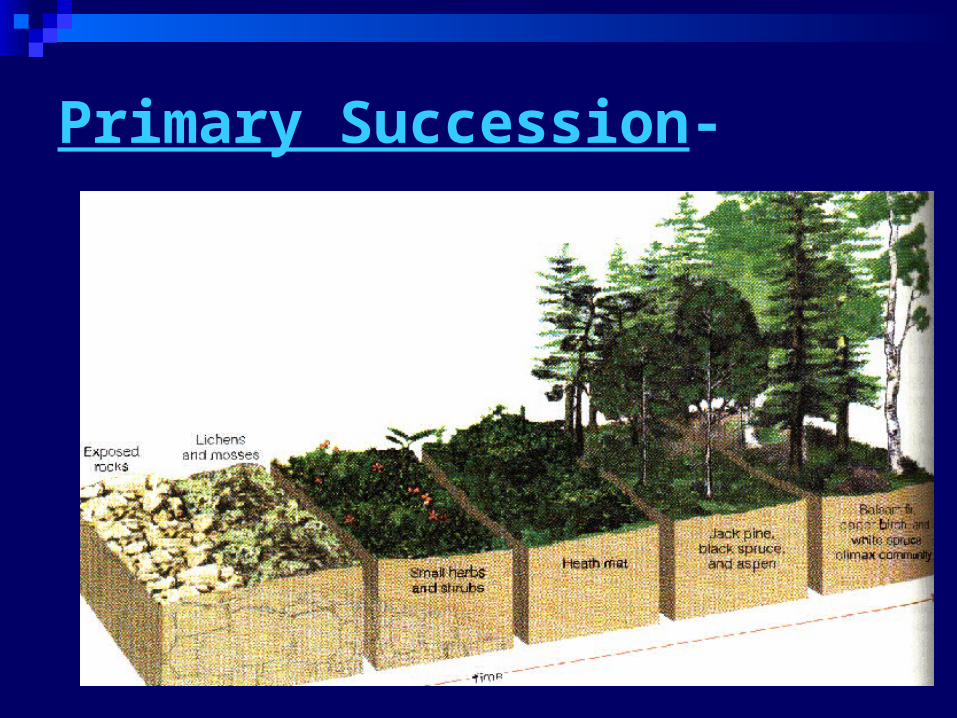
Succession- a series of changes in a
community in which new populations of organisms gradually replace existing ones

Primary succession-
colonization of new sites by communities of organisms – takes place on bare rock

Primary succession- New bare rock comes from 2
sources: 1. volcanic lava flow cools and
forms rock

Primary succession- New bare rock comes from 2
sources: 2. Glaciers retreat and expose
rock

Pioneer species- the first organisms to colonize a
new site Ex: lichens are the first to colonize
lava rocks
Primary Succession-
Rock

Climax community- a stable, mature community that
undergoes little or no succession

Primary succession-

Secondary succession- sequence of community changes
that takes place when a community is disrupted by natural disaster or human actions – takes place on existing soil

Secondary succession- Ex:
fire

Secondary succession- Ex:
farming

Secondary succession-

Secondary succession-