population ecology notes
TRANSCRIPT
Population Ecology

What is Population?
A group of the same species
that lives in one area

5 Characteristics of Population
1. Geographic Distribution
2. Density
3. Dispersion
4. Growth Rate
5. Age Structure
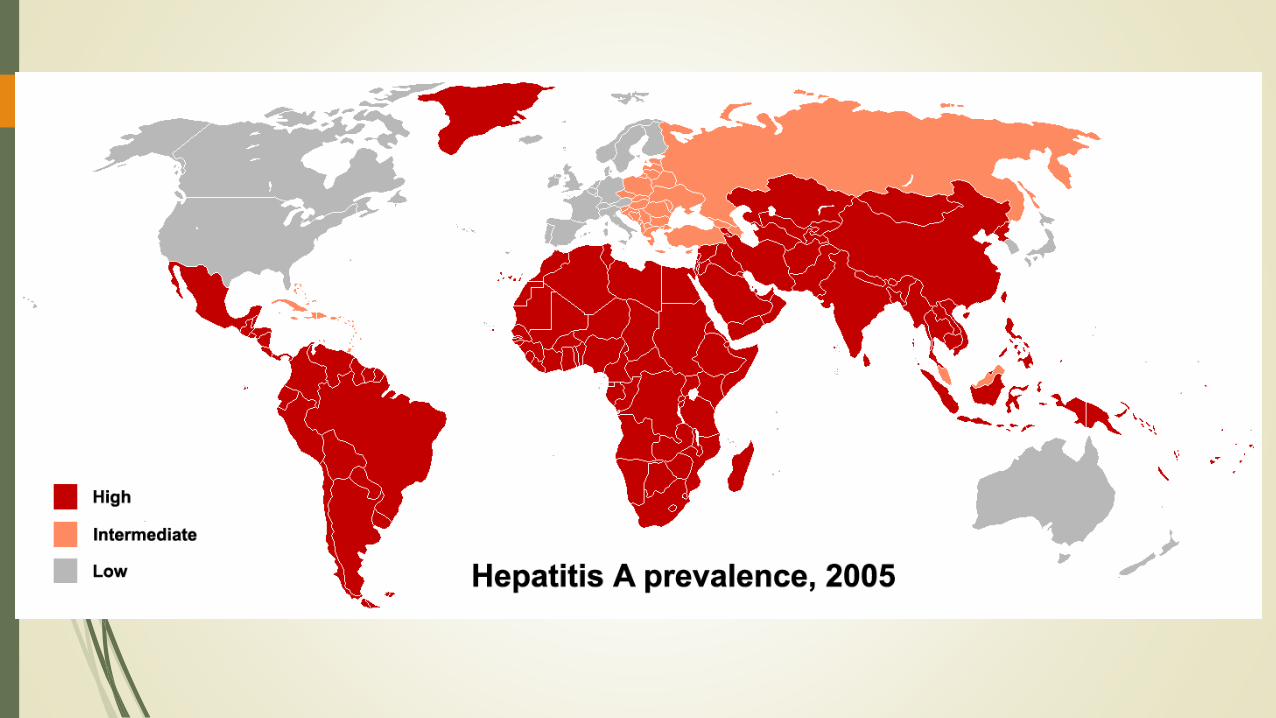
Geographic Distribution
The range of the population
Describes the area that is inhabited
by the population
Such as:
The mold on a piece of bread
The migration area of whales
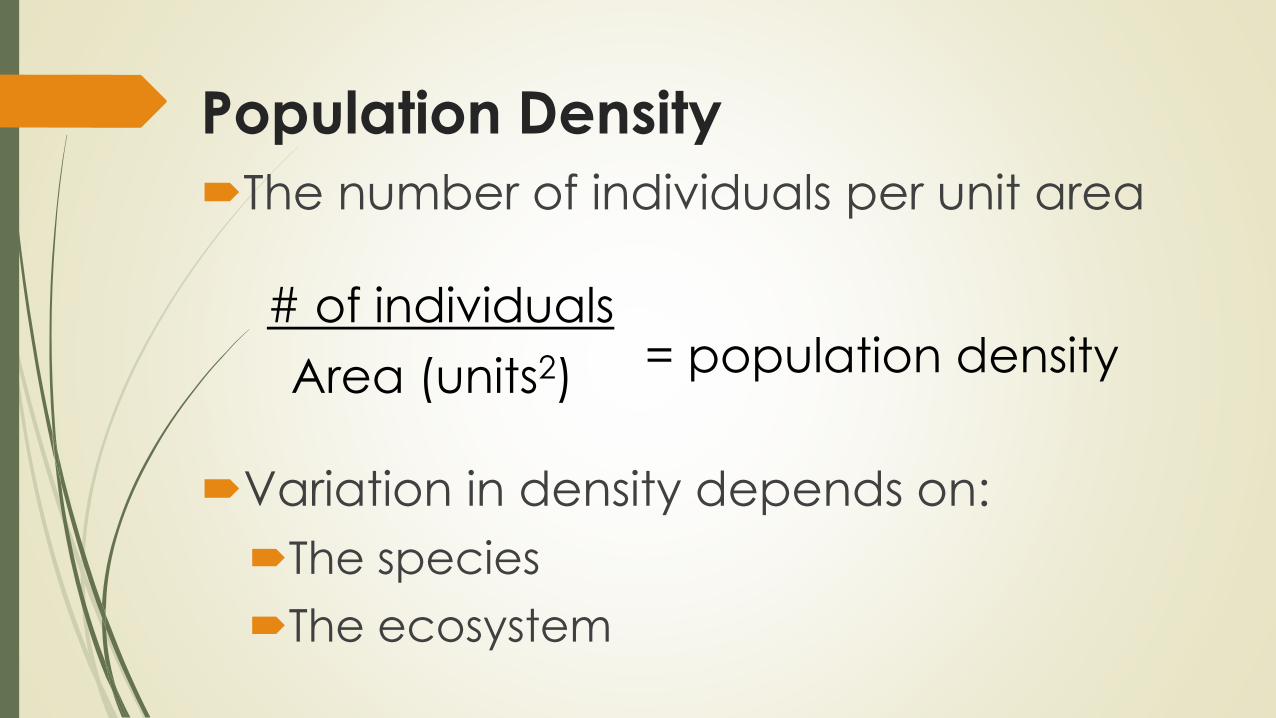
Population Density
The number of individuals per unit area
# of individuals
Area (units2)
Variation in density depends on:
The species
The ecosystem
= population density

Practice Problem
If scientists sampling a population of
deer counted 200 individuals in an
area of 10 square kilometers, what is
the density of this deer population per
square kilometer?
A: 20 deer per square kilometer
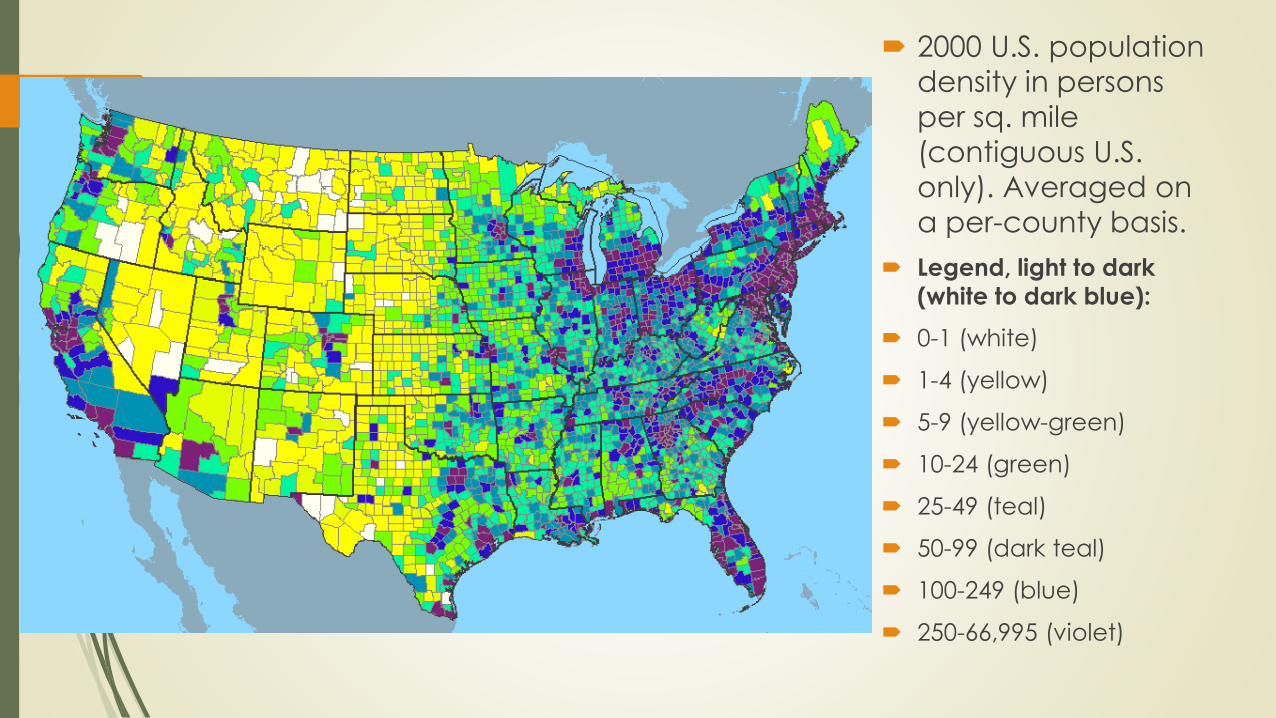
2000 U.S. population
density in persons
per sq. mile
(contiguous U.S.
only). Averaged on
a per-county basis.
Legend, light to dark
(white to dark blue):
0-1 (white)
1-4 (yellow)
5-9 (yellow-green)
10-24 (green)
25-49 (teal)
50-99 (dark teal)
100-249 (blue)
250-66,995 (violet)

Dispersion
The spatial distribution of individuals
within the population
Three types:
Clumped Dispersion
Even Dispersion
Random Dispersion
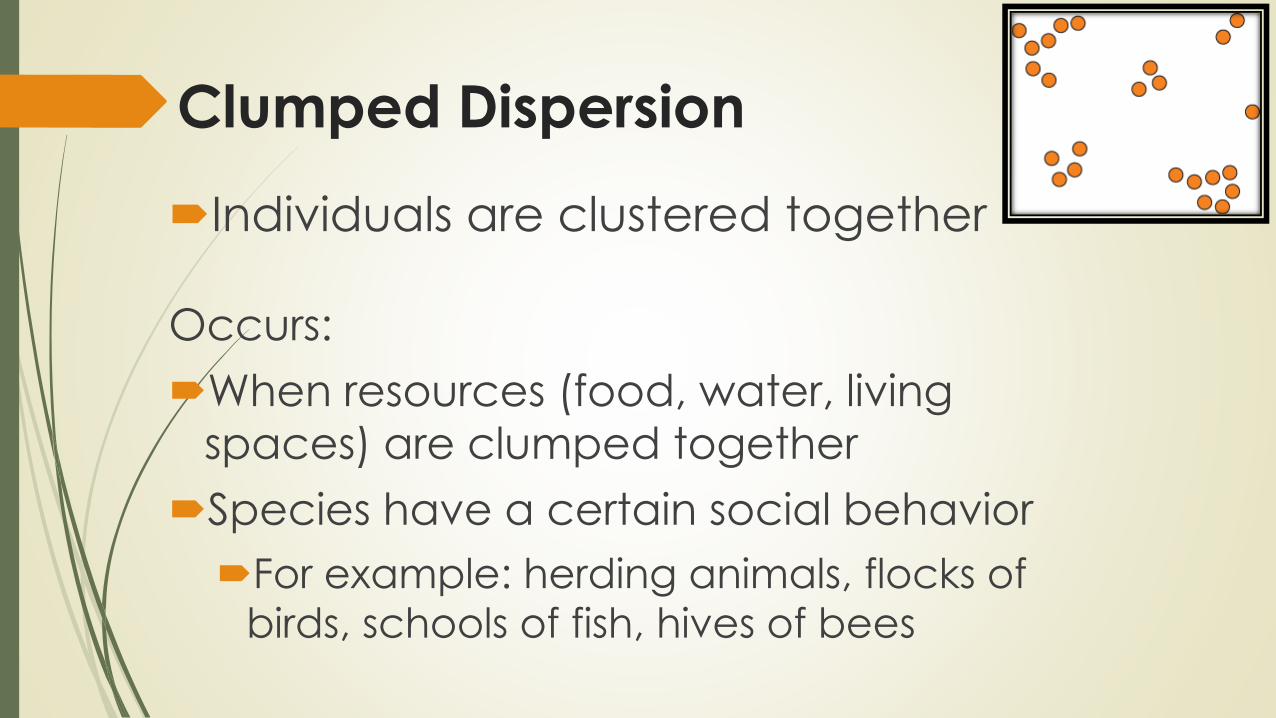
Clumped Dispersion
Individuals are clustered together
Occurs:
When resources (food, water, living
spaces) are clumped together
Species have a certain social behavior
For example: herding animals, flocks of
birds, schools of fish, hives of bees

Even Dispersion (a.k.a Uniform Dispersion)
Individuals are separated by a fairly
even distance.
Occurs:
As a result of social interaction
Individuals trying to get as far
away from each other as possible.
Limited resources, competition,
nesting

Random Dispersion
Location of one individual is
independent of the location of the
other individuals
Examples:
Seed dispersal by the wind or animals
Growth Rate
The amount by which a population’s size
changes in a given time.
A measure of the speed of reproduction

Factors affecting population size
1. The number of births.
2. The number of deaths.
3. Migration
The movement of individuals into
and out of a population
Immigration
Emigration

Types of Migration
Immigration
The movement of individuals into an area
Emigration
The movement of individuals out of an area

Population Dynamics
Population are dynamic, meaning that they:
Change in size and composition over time!
Considerations:1. Birth rate: the number of births occurring in a given
period of time
2. Death rate or mortality rate: the number of deaths in a given period of time
3. Life expectancy: the length of time an individual is expected to live

If more individuals are being born than die in a given period of time, the population size will ___________.
If birthrate is equal to death rate, the population size will ______________.
If the death rate is greater than the birthrate, the population will ______.
increase
remain stable
decrease

Studying Population Density
Questions to be answered:
Why is the birth rate unusually high
(or low)?
Why are more individuals dying than
normal?
Is there a reason for an unusually high
immigration or emigration?
Factors affecting population
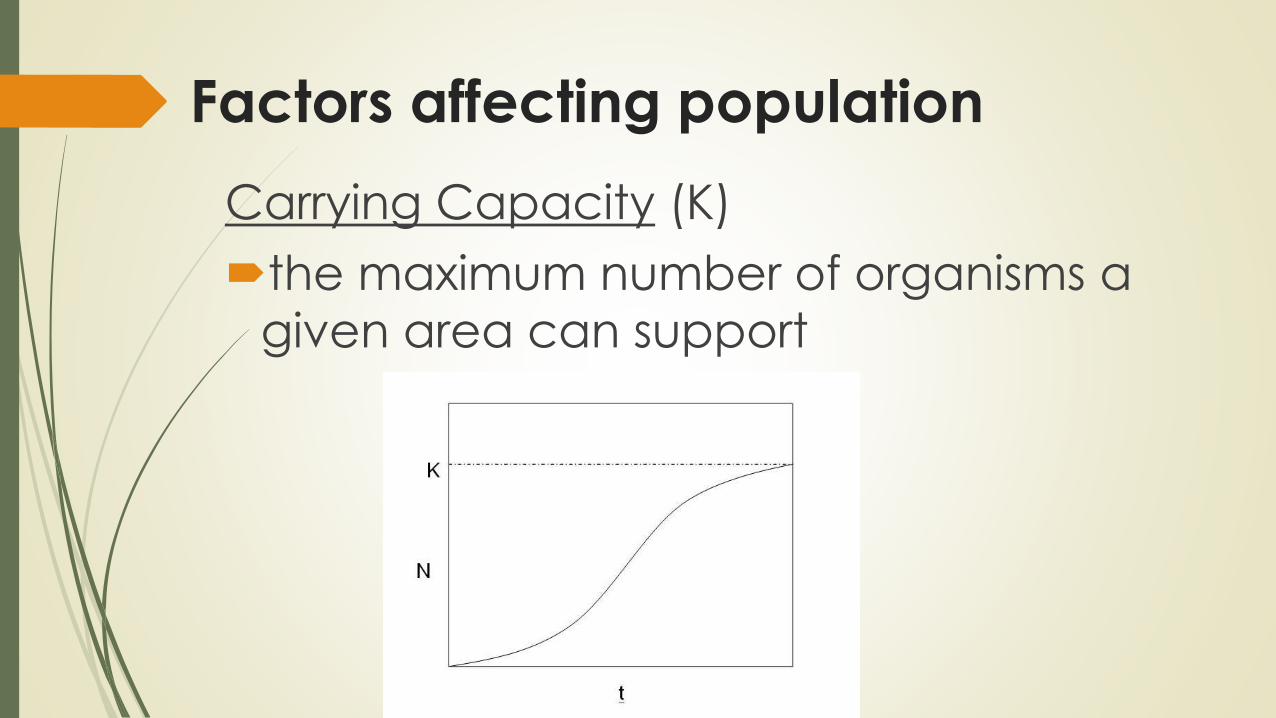
Carrying Capacity (K)
the maximum number of organisms a
given area can support
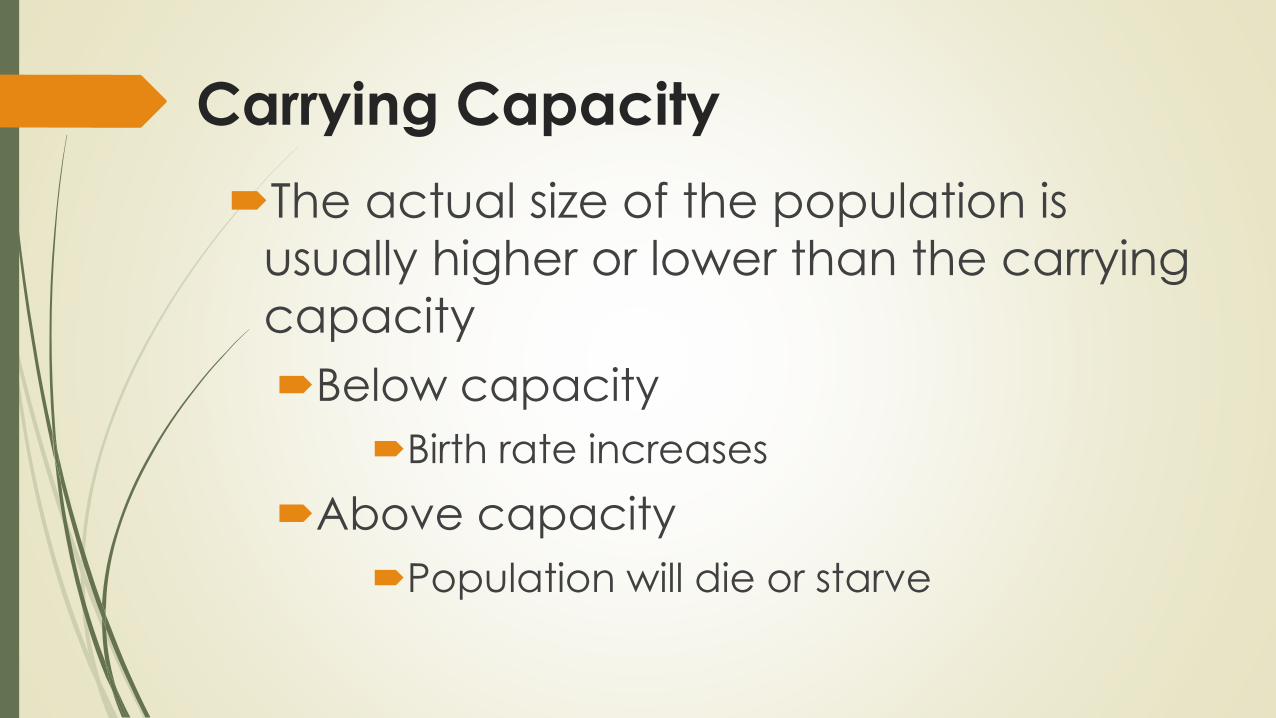
Carrying Capacity
The actual size of the population is
usually higher or lower than the carrying
capacity
Below capacity
Birth rate increases
Above capacity
Population will die or starve

Factors Limiting PopulationLimiting Factor – the resource that runs
out first Helps to determine carrying capacity
Examples include:
1. Competition
2. Predation
3. Parasitism and disease
4. Drought and other climate extremes
5. Human disturbances

Types of Limiting Factors
1. Density-Dependent Factors
Only when the population density reaches a certain level.
2. Density-Independent Factors
Unusual weather or natural disasters
Floods and fires
Human activities
Clear-cutting a forest or damning a river
What limits population growth?

R-StrategistsThink “R” for “reproduction”
Population usually NOT near carrying capacity
J-curve growth (high growth rate)
Exponential Growth
Highly affected by abiotic factors like weather
Small body size and short life span
Have many offspring in a short time

R-strategist make lots of babies!

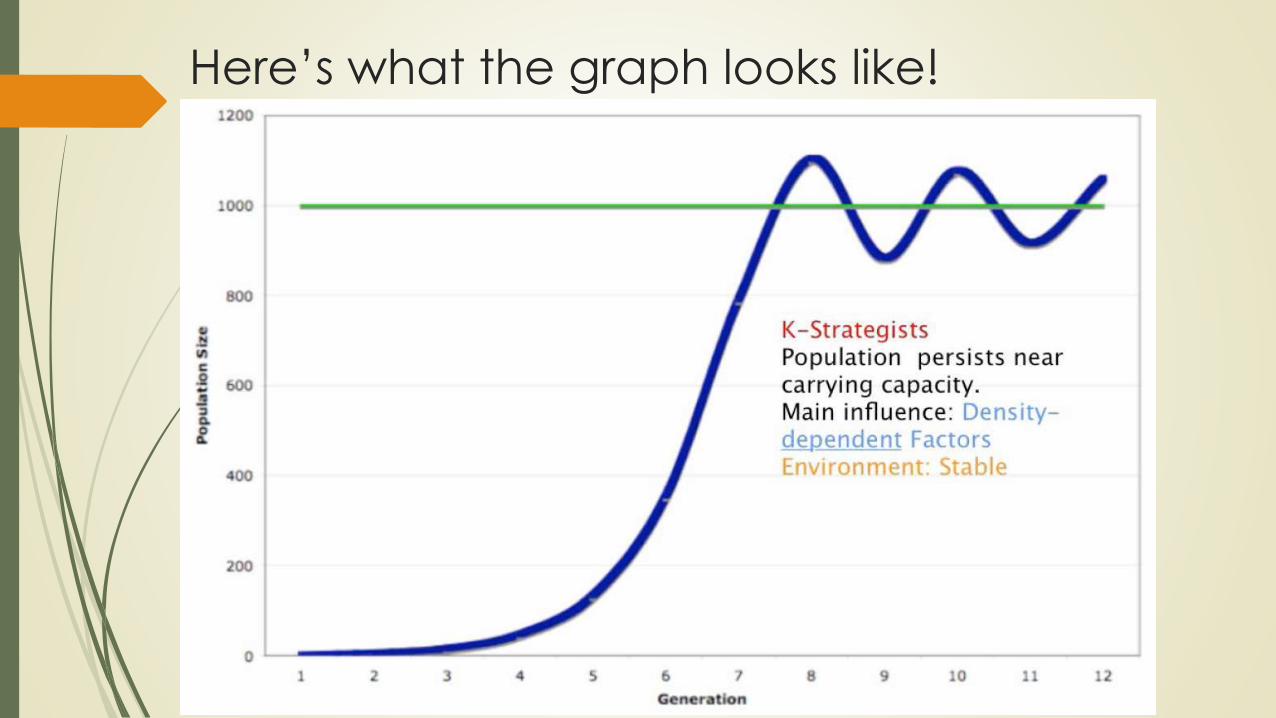
Here’s what the graph looks like!
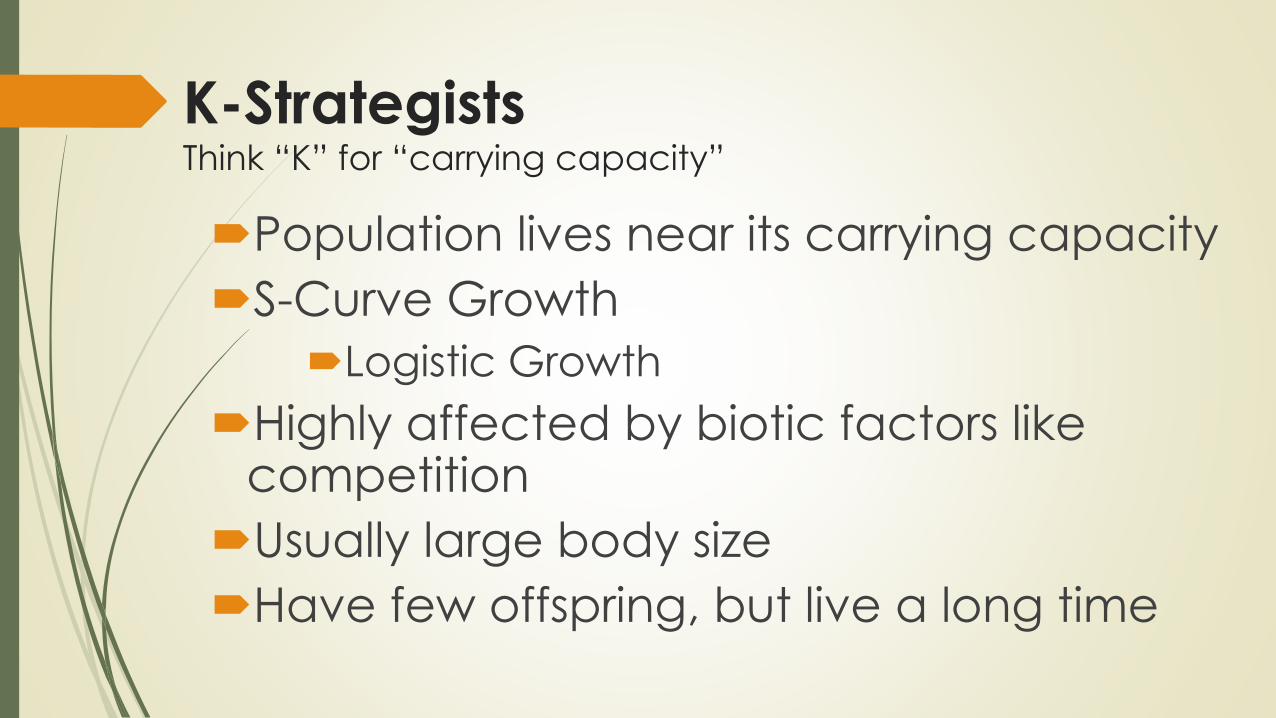
K-StrategistsThink “K” for “carrying capacity”
Population lives near its carrying capacity
S-Curve Growth
Logistic Growth
Highly affected by biotic factors like competition
Usually large body size
Have few offspring, but live a long time

Kangaroos are K-Strategists!
Here’s what the graph looks like!
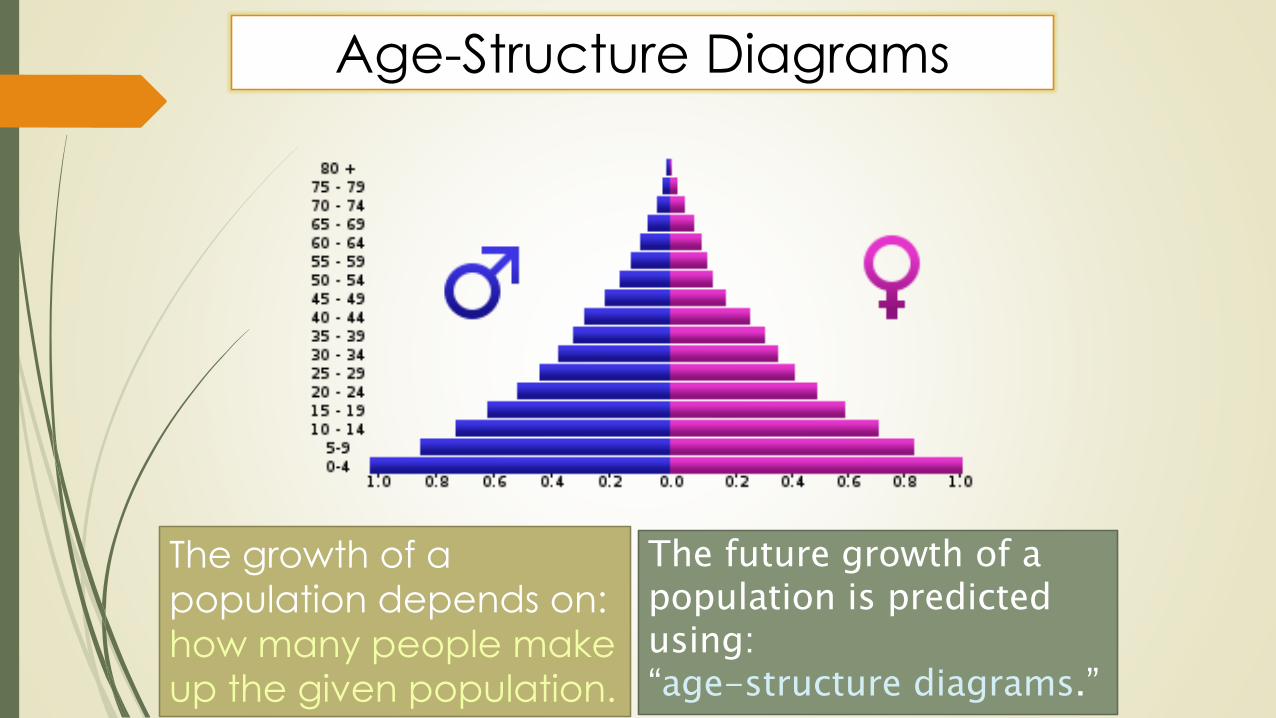
Age-Structure Diagrams
The growth of a
population depends on:
how many people make
up the given population.
The future growth of a population is predicted using:“age-structure diagrams.”
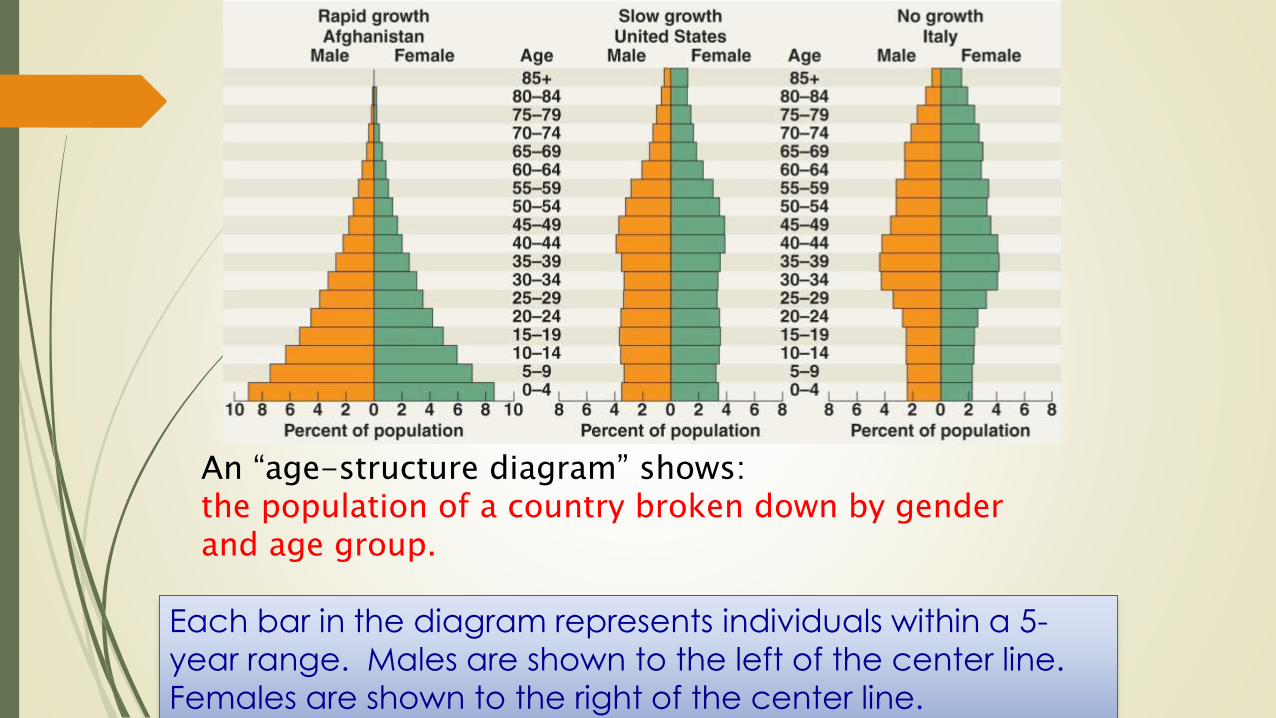
An “age-structure diagram” shows:the population of a country broken down by gender and age group.
Each bar in the diagram represents individuals within a 5-
year range. Males are shown to the left of the center line.
Females are shown to the right of the center line.

Look at the age structure of population A.
There are many more _________ than ______ groups. In each higher age group, there are fewer and fewer individuals.It can reasonably be predicted that population A will experience:rapid growth in the future as the large number of children reach adulthood.
children older

Human Population Growth
For most of human existence, the population grew very slowly. There were many limiting factors that kept the human population low:1. Food was not always
readily available.2. Diseases were rampant.

About 500 years ago, the human population began to
grow at a staggering rate. Reasons for this include:
1. The beginning of agriculture and industry made life much easier and much safer.
2. Food is available on a regular basis.
3. Goods can be shipped around the world.
4. Improved sanitation and living conditions eliminated the high levels of diseases.
5. Death rate dropped while birth rate increased.
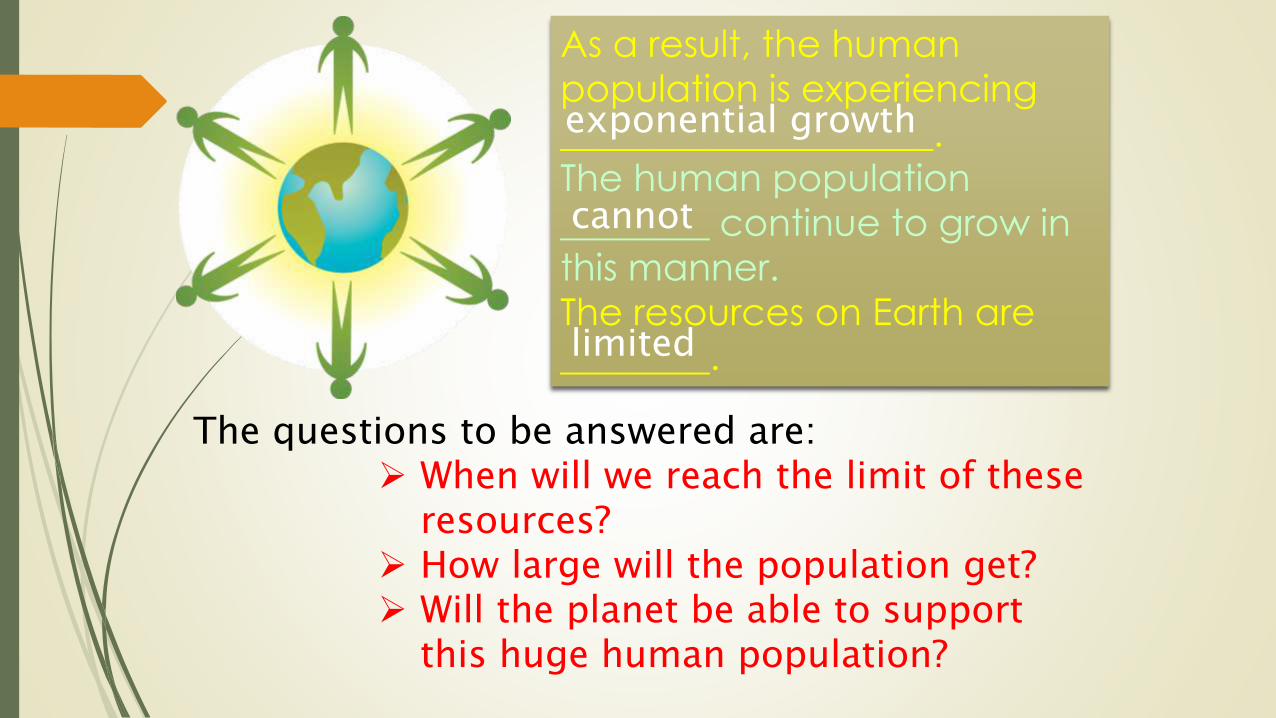
As a result, the human
population is experiencing
____________________.
The human population
________ continue to grow in
this manner.
The resources on Earth are
________.
exponential growth
cannot
limited
The questions to be answered are: When will we reach the limit of these
resources? How large will the population get? Will the planet be able to support
this huge human population?

Demography is the scientific study:of human populations.
Some countries today have a much higher growth rate than other countries. Birthrates, death rates, and the age structure of a population help predict why some countries have a higher growth rate than other countries.