population estimation for local municipalities in south … · population estimation for local...
TRANSCRIPT

Population Estimation for Local Municipalities in South Africa
Diego Iturralde, Louis van Tonder, and Chantal Munthree
Demography Division, Statistics SA
Introduction
Internationally, the Mid-year population estimates are designed to provide population and
demographic information between censuses, and are done annually to compare population
trends over time. Population estimates are typically based on a variety of administrative
records such as births, deaths, school enrolment, housing etc., to detect population changes
since the most recent decennial census (Bryan, 2004). Population estimates are an
important output of any modern day society. In an effort to plan, budget, and cater for the
needs of the population, a spectrum of government agencies ranging from transport to
education and health, require population estimates (Smith and Cody, 2013). International
institutions as well as those within the private sector of the country will also require
population estimates to monitor; plan; budget and allocate resources (Lomahoza,
Brockerhoff and Frye, 2013). Estimates are also used as a uniform denominator for surveys
as well as reporting on population based indicators (Lymer and Brown, 2012).
When planning services at a local level, current population numbers down to local
municipality level are fundamental; however this type of information is not readily available.
Stakeholders be they international, national, public or private sector, require lower level
estimates to make better informed decisions regarding an array of sectors including health,
education, employment, wage dispensation, and skill development; such that the
appropriate services, recourses and infrastructure are provided to their constituents (Rayer,
2015 ; Smith and Cody, 2013; Jiang and Lahiri, 2006) . In South Africa, the most recent
population numbers available at Local municipality level are those of the 2011 national
census. Census generally provides faily accurate data at fine geographical detail, however it
is rather costly and not frequently updated. Thus many countries including South Africa, are
opting for the utilization of estimation techniques using various data sources to produce
estimates at lower levels over a series of time (Smith and Morrison, 2005) However in South
Africa more recent population estimates at local municipality level are not available. For

planning it is imperative that current and if possible, future local municipality population
numbers are available.
In an effort to produce small area estimates it is essential to understand the spatial
demarcation that exists in South Africa. South Africa’s geographic hierarchy is such that the
country is divided into 9 provinces (Figure 1 below). Each province is divided into district
municipalities or metropolitan municipalities (52 districts in total). There are currently 8
metropolitan municipalities spread out across 5 of the provinces. Each district in turn is
divided into local municipalities which is the subject of the estimates of this paper. Inclusive
of the metro municipalities, there are 234 local municipalities in South Africa. Below local
municipality the geographical hierarchy is broken down into main place, sub place, wards
and a small area layer respectively (Statistics SA 2011). Given the dependency of small area
estimates on the demarcation of South Africa, changes in demarcation over time will affect
processes in producing not only small area estimates but also estimates at other aggregate
levels (Rayer, 2015).
Figure 1: Nested Hierarchy for the Census of 2011
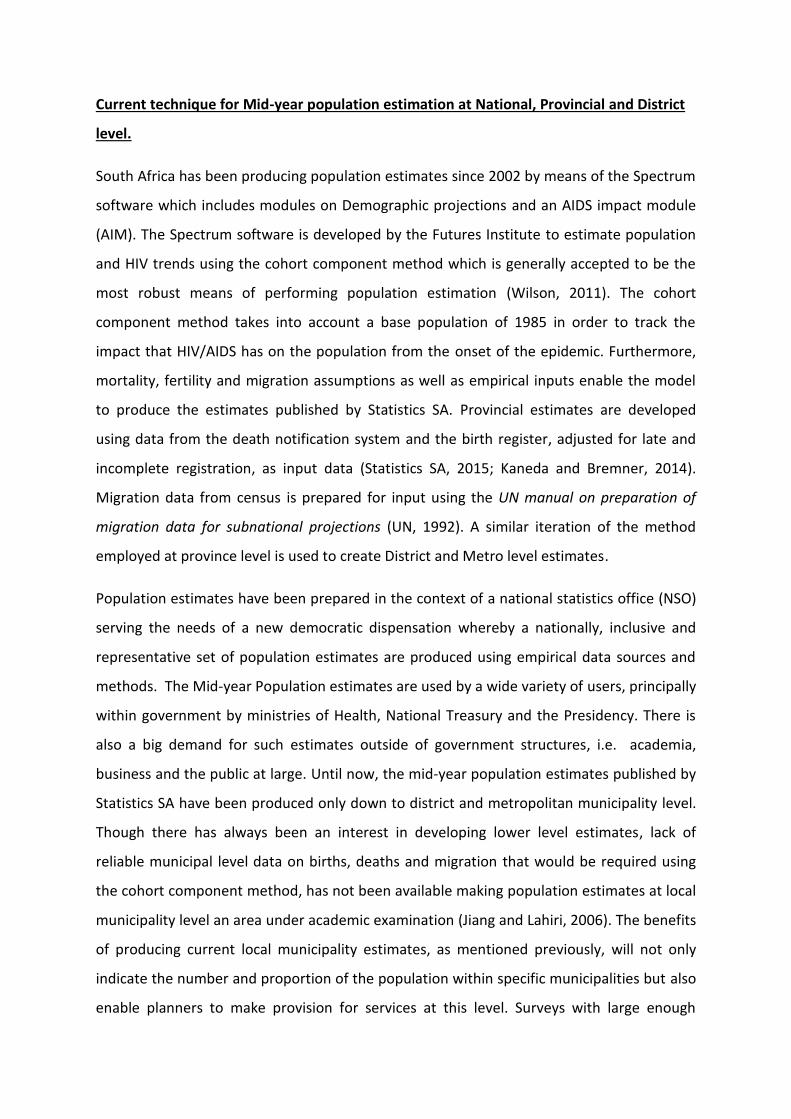
Current technique for Mid-year population estimation at National, Provincial and District
level.
South Africa has been producing population estimates since 2002 by means of the Spectrum
software which includes modules on Demographic projections and an AIDS impact module
(AIM). The Spectrum software is developed by the Futures Institute to estimate population
and HIV trends using the cohort component method which is generally accepted to be the
most robust means of performing population estimation (Wilson, 2011). The cohort
component method takes into account a base population of 1985 in order to track the
impact that HIV/AIDS has on the population from the onset of the epidemic. Furthermore,
mortality, fertility and migration assumptions as well as empirical inputs enable the model
to produce the estimates published by Statistics SA. Provincial estimates are developed
using data from the death notification system and the birth register, adjusted for late and
incomplete registration, as input data (Statistics SA, 2015; Kaneda and Bremner, 2014).
Migration data from census is prepared for input using the UN manual on preparation of
migration data for subnational projections (UN, 1992). A similar iteration of the method
employed at province level is used to create District and Metro level estimates.
Population estimates have been prepared in the context of a national statistics office (NSO)
serving the needs of a new democratic dispensation whereby a nationally, inclusive and
representative set of population estimates are produced using empirical data sources and
methods. The Mid-year Population estimates are used by a wide variety of users, principally
within government by ministries of Health, National Treasury and the Presidency. There is
also a big demand for such estimates outside of government structures, i.e. academia,
business and the public at large. Until now, the mid-year population estimates published by
Statistics SA have been produced only down to district and metropolitan municipality level.
Though there has always been an interest in developing lower level estimates, lack of
reliable municipal level data on births, deaths and migration that would be required using
the cohort component method, has not been available making population estimates at local
municipality level an area under academic examination (Jiang and Lahiri, 2006). The benefits
of producing current local municipality estimates, as mentioned previously, will not only
indicate the number and proportion of the population within specific municipalities but also
enable planners to make provision for services at this level. Surveys with large enough
samples will also be able to benchmark their surveys against such population totals. Most
importantly population numbers during inter-censal years will be readily available and will
not be the subject of much speculation (Smith and Morrison, 2005).
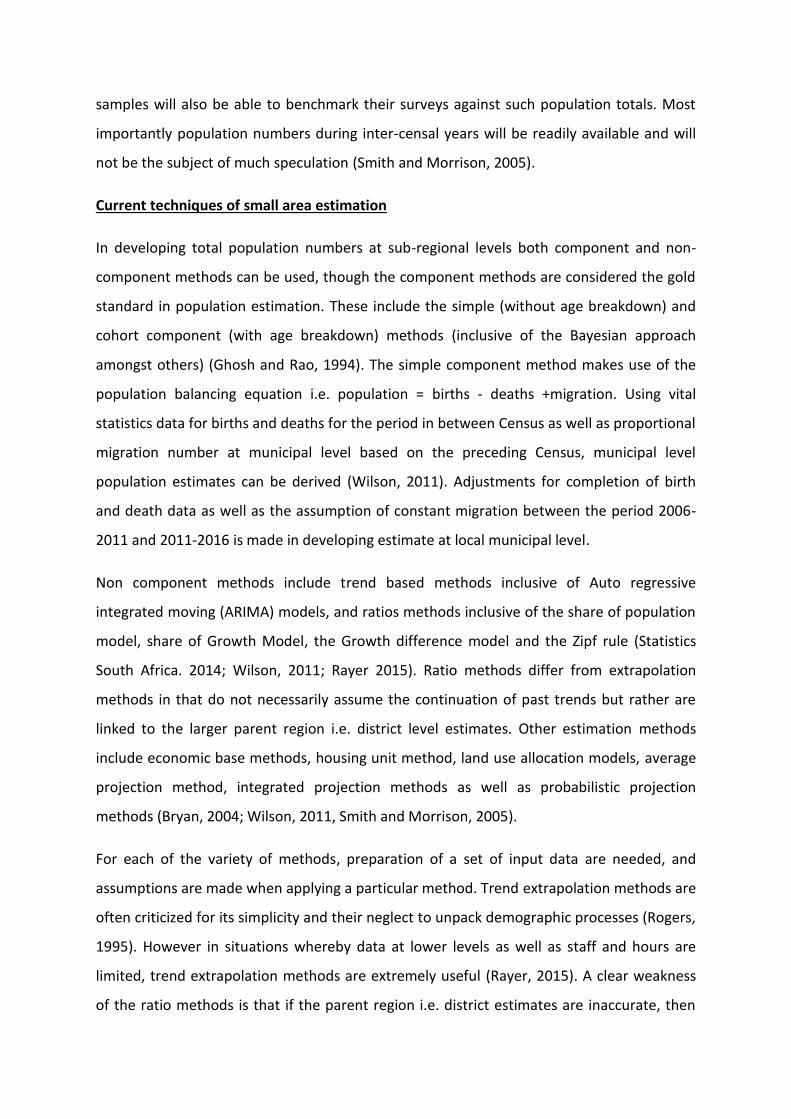
Current techniques of small area estimation
In developing total population numbers at sub-regional levels both component and non-
component methods can be used, though the component methods are considered the gold
standard in population estimation. These include the simple (without age breakdown) and
cohort component (with age breakdown) methods (inclusive of the Bayesian approach
amongst others) (Ghosh and Rao, 1994). The simple component method makes use of the
population balancing equation i.e. population = births - deaths +migration. Using vital
statistics data for births and deaths for the period in between Census as well as proportional
migration number at municipal level based on the preceding Census, municipal level
population estimates can be derived (Wilson, 2011). Adjustments for completion of birth
and death data as well as the assumption of constant migration between the period 2006-
2011 and 2011-2016 is made in developing estimate at local municipal level.
Non component methods include trend based methods inclusive of Auto regressive
integrated moving (ARIMA) models, and ratios methods inclusive of the share of population
model, share of Growth Model, the Growth difference model and the Zipf rule (Statistics
South Africa. 2014; Wilson, 2011; Rayer 2015). Ratio methods differ from extrapolation
methods in that do not necessarily assume the continuation of past trends but rather are
linked to the larger parent region i.e. district level estimates. Other estimation methods
include economic base methods, housing unit method, land use allocation models, average
projection method, integrated projection methods as well as probabilistic projection
methods (Bryan, 2004; Wilson, 2011, Smith and Morrison, 2005).
For each of the variety of methods, preparation of a set of input data are needed, and
assumptions are made when applying a particular method. Trend extrapolation methods are
often criticized for its simplicity and their neglect to unpack demographic processes (Rogers,
1995). However in situations whereby data at lower levels as well as staff and hours are
limited, trend extrapolation methods are extremely useful (Rayer, 2015). A clear weakness
of the ratio methods is that if the parent region i.e. district estimates are inaccurate, then

estimation of the local municipality is likely to be so too (Schmidt and Crosetti, 1951).
Similar to trend methods, they have also been criticised for not graphically representing the
demographic processes of births deaths and migration. , however if the district estimates
are based on a cohort component model then there is at least an indirect link to
demographic processes occurring within that region (Wilson, 2011). Despite the desire to
apply the cohort component method given the models ability to incorporate changes in
fertility, mortality and migration in developing estimates, the data inputs required
disaggregated by age are often limited at lower levels geography (Smith and Morrison,
2005). The economic methods, housing unit method and land use methods all make an
assumption that population change is related to changes in (as the method implied)
employment, housing and land usage. The method is thus not only reliant on the
assumptions but also availability of reliable data in the applicable sector (Bell and Cooper,
1986; Hooimeijer, 1996; Smith and Cody, 2013).
There is need to explore more innovative statistical and geospatial methodologies to
develop updated lower level estimates (Wang and Changshan, 2010; Rayer, 2015). Unit
record data from the population census and the Dwelling Frame can be used to estimate
local municipalities. Though Rayer (2015) suggests that “GIS and spatial techniques will only
remain useful as tools of distributing the population, rather than providing an alternative
projection approach” (Rayer, 2005 pp 21).Given that sub-municipal data is only available
from censuses, and the last census was conducted in 2011, coupled with the reality that
planners and other policy makers require updated information, Statistic SA's Dwelling Frame
undergoes continuous maintenance using data provided by local municipalities and other
sources such as satellite imagery. Deriving estimates for population by using dwelling
characteristics from the census and applying it to the updated dwelling frame, estimates are
rolled-up to the various levels of geography, including municipal level (Smith and Cody,
2013; Zhang et al, 2013) .
Objectives of the study
Given the array of methods available in developing lower level estimates, the objective of
this paper is to explore the applicability of some of these methods in developing local
municipal population numbers in South Africa. This by no means is an exhaustive list of

available methods. A limited number of methods can be used to estimate populations at
municipal level given the limitations of, unavailability and lack of robust data at these levels.
The methods analysed include the (a) geographical ratio method, (b) population growth
extrapolation method and the (c) Zipf rule method. In an effort to develop the most robust
local municipal level population estimate, the various methods are interrogated and
evaluated by comparing the estimates produced.
Data
The only data available at local municipality level are the Censuses of 1996, 2001 and 2011.
Although a Community survey was conducted in 2007 a review of this data at local
municipality level shows that when compared to the aforementioned Census prior to and
after the survey that these data points are not consistently aligned. Bearing in mind that the
Community Survey 2007 is a sample survey it was decided that for the purpose of this
exercise only Census points would be used. In addition to Census data at local municipality
level, Statistics SA is able to use District Municipality estimates from 2002-2015 as part of
the suite of products emanating from the Mid-Year Population Estimates. As a result of
using the mid-year estimates all projections in this paper are dated to the 30th of June of the
year in question.
Methodology
The major challenge in producing population estimates at the Local Municipality level is to
deal with the limitation that data is either not available or is not sufficiently robust at that
level of geographic disaggregation to enable a cohort-component method to be applied.
Notwithstanding the availability of data on mortality and fertility and the differing levels of
completeness that such data may enjoy on an annual basis from a vital registration system,
when it comes to migration the daunting task of creating migration streams to and from
each of the 234 local and metropolitan municipalities renders the possibility of using the
cohort component method as an unsustainable approach to follow. Given the difficulties
mentioned, , alternative small area estimation techniques had to be considered for the task
of producing small area estimates at the level of local municipality. Such methods include a
ratio method inclusive of the Zipf rule as well as a growth method. It should be noted that
for the purpose of this paper total population only will be considered but that ultimately
these numbers will need to be produced for various purposes by sex and specific age
groups.
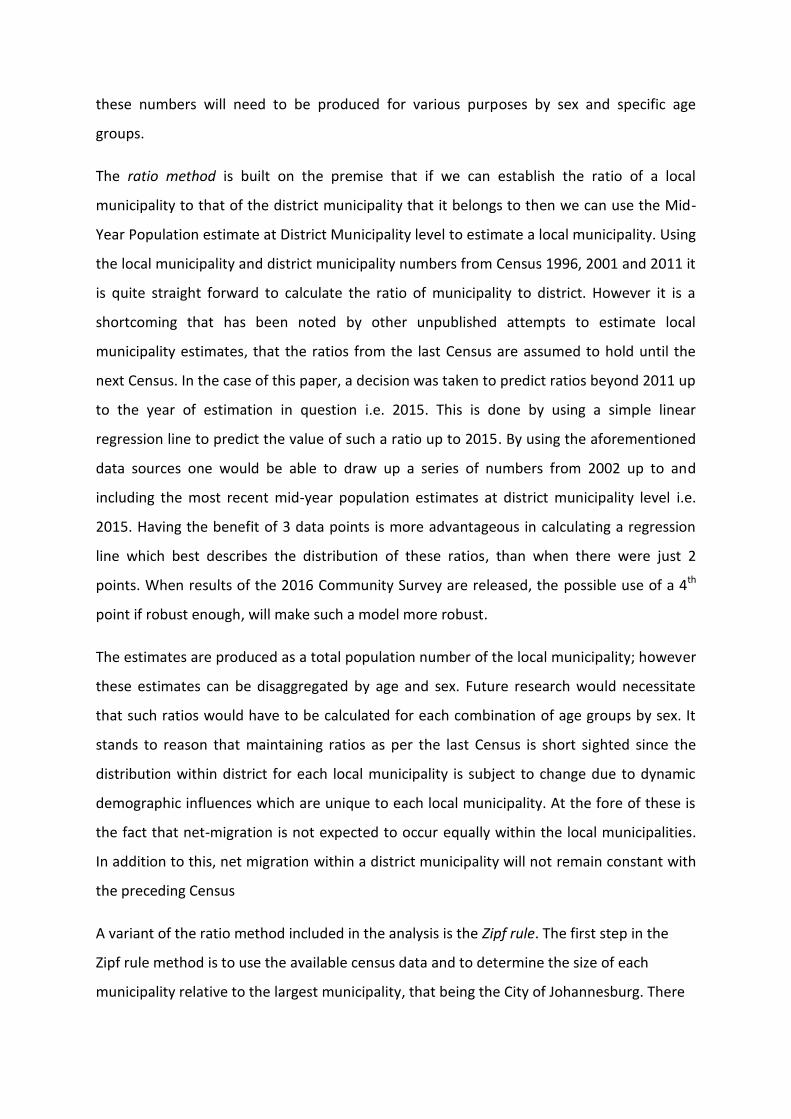
The ratio method is built on the premise that if we can establish the ratio of a local
municipality to that of the district municipality that it belongs to then we can use the Mid-
Year Population estimate at District Municipality level to estimate a local municipality. Using
the local municipality and district municipality numbers from Census 1996, 2001 and 2011 it
is quite straight forward to calculate the ratio of municipality to district. However it is a
shortcoming that has been noted by other unpublished attempts to estimate local
municipality estimates, that the ratios from the last Census are assumed to hold until the
next Census. In the case of this paper, a decision was taken to predict ratios beyond 2011 up
to the year of estimation in question i.e. 2015. This is done by using a simple linear
regression line to predict the value of such a ratio up to 2015. By using the aforementioned
data sources one would be able to draw up a series of numbers from 2002 up to and
including the most recent mid-year population estimates at district municipality level i.e.
2015. Having the benefit of 3 data points is more advantageous in calculating a regression
line which best describes the distribution of these ratios, than when there were just 2
points. When results of the 2016 Community Survey are released, the possible use of a 4th
point if robust enough, will make such a model more robust.
The estimates are produced as a total population number of the local municipality; however
these estimates can be disaggregated by age and sex. Future research would necessitate
that such ratios would have to be calculated for each combination of age groups by sex. It
stands to reason that maintaining ratios as per the last Census is short sighted since the
distribution within district for each local municipality is subject to change due to dynamic
demographic influences which are unique to each local municipality. At the fore of these is
the fact that net-migration is not expected to occur equally within the local municipalities.
In addition to this, net migration within a district municipality will not remain constant with
the preceding Census
A variant of the ratio method included in the analysis is the Zipf rule. The first step in the
Zipf rule method is to use the available census data and to determine the size of each
municipality relative to the largest municipality, that being the City of Johannesburg. There

are three points for each municipality i.e. 1996, 2001 and 2011. The next step will then to
fit a line to these points for each municipality. It is then possible to Interpolate between
2001 and 2011 and extrapolate for 4 years up to 2015.
From the Stats SA mid-year estimates we have estimates for the City of Johannesburg for
2001 up to 2015 (latest release July 2015) (Statistics SA, 2015). It is now a simple procedure
to apply the calculated rates to the population estimates of the City of Johannesburg. The
calculated municipality numbers in a specific District Council should add up to the numbers
in Stats SA midyear report. Municipality numbers will be adjusted if necessary.
Another method being used is the comparative growth method which essentially compares
growth across geographic domains and then adjusts projected population numbers based
on the exponential population growth equation:
P1 =P0ert (1)
Where P1 is population at time 1
P0 is the population at an earlier time 0
t is time measured in years
e is a constant
r is the growth rate, calculated by making r the subject of the above formula into
r = ln(P1/P0)/t (2)
Having calculated the growth in (2), one can then apply it to (1) to calculate the population
of a local municipality to a date beyond the date of the last Census. The same process is
performed at district municipality level such that past growth from Census point 0 and
census point 1 is able to predict a population into a future beyond Census for both district
and local municipality. However, it is not correct to assume that the same factors driving
past growth will persist in driving growth beyond the most recent Census. Hence there is a
need to adjust such numbers to reflect changing demographics where data of such changes
exist in the period since the last Census. The mid-year population estimate at district
municipality level provide exactly that, using civil registration data on births and deaths, to

update the mid-year estimates series up to the most current year up to district/metro
municipality level. The issue of migration is covered by the most recent Census data and
applying migration rates to current population figures in the absence of more regular data
or administrative data in this regard.
The process of adjusting the projected population numbers then occurs by comparing the
forward projected district municipality numbers (projected using the growth method) with
those from the mid-year estimates. The latter is divided by the former to create an
adjustment rate which is then applied to the forward projected local municipality number
for a final adjusted estimate which can be said to represent changes based on demographic
dynamics from within the district that it belongs to for the current year.
Results of Local municipal population estimates in the Sarah Baartman District, in the
Eastern Cape Province
Figure 2 Map of the Republic of South Africa
The estimation of all local municipalities using the geographic ratio method, the exponential
growth method, the Zipf rule were done, however for the purpose of this paper, only the

estimated total population numbers for each of the 9 Local municipalities within the Sarah
Baartman district was randomly selected for discussion. Also, an estimate of the local
municipality gathered from an external source is also used in the review of the estimates
produced as is recommended by Bryan. (2004). The Sarah Baartman municipality lies in the
Eastern Cape province of South Africa as shown in Figure 2.
Table 1: Local population estimates in the Camdeboo Local Municipality
Table 2: Local population estimates in the Blue Crane Route Local Municipality
2011 2012 2013 2014 2015
Census 50993
Ratio 50332 50825 51333 51857
Growth 50632 51115 51617 52135
Zipf 49706 49969 50208 50417
Other 51774 52268 52750 53220
4700048000490005000051000520005300054000
Camdeboo
2011 2012 2013 2014 2015
Census 36002
Ratio 35983 36186 36394 36607
Growth 35670 35903 36147 36401
Zipf 35446 35423 35365 35263
Other 36406 36492 36592 36707
34500
35000
35500
36000
36500
37000
Blue Crane Route
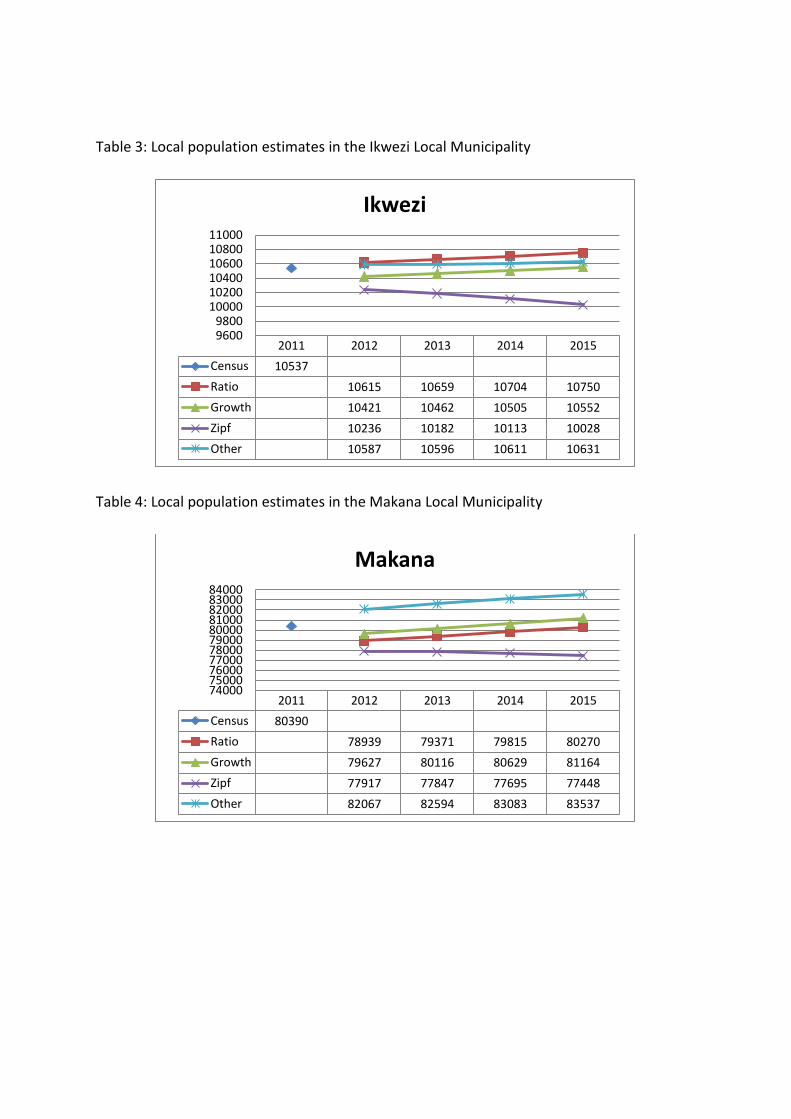
Table 3: Local population estimates in the Ikwezi Local Municipality
Table 4: Local population estimates in the Makana Local Municipality
2011 2012 2013 2014 2015
Census 10537
Ratio 10615 10659 10704 10750
Growth 10421 10462 10505 10552
Zipf 10236 10182 10113 10028
Other 10587 10596 10611 10631
96009800
100001020010400106001080011000
Ikwezi
2011 2012 2013 2014 2015
Census 80390
Ratio 78939 79371 79815 80270
Growth 79627 80116 80629 81164
Zipf 77917 77847 77695 77448
Other 82067 82594 83083 83537
7400075000760007700078000790008000081000820008300084000
Makana

Table 5: Local population estimates in the Ndlamba Local Municipality
Table 6: Local population estimates in the Sundays River Valley Local Municipality
2011 2012 2013 2014 2015
Census 61176
Ratio 62431 63725 65062 66443
Growth 61296 62664 64080 65543
Zipf 62950 64421 65962 67576
Other 62542 63158 63740 64296
5600058000600006200064000660006800070000
Ndlamba
2011 2012 2013 2014 2015
Census 54504
Ratio 53514 54424 55365 56335
Growth 54364 55230 56124 57046
Zipf 53272 54137 55027 55941
Other 55333 56288 57182 58021
50000510005200053000540005500056000570005800059000
Sundays River Valley

Table 7: Local population estimates in the Baviaans Local Municipality
Table 8: Local population estimates in the Kouga Local Municipality
2011 2012 2013 2014 2015
Census 17761
Ratio 17812 17932 18057 18185
Growth 17596 17708 17827 17950
Zipf 17313 17303 17276 17228
Other 20764 21062 21350 21629
0
5000
10000
15000
20000
25000
Baviaans
2011 2012 2013 2014 2015
Census 98558
Ratio 99314 102473 105738 109112
Growth 99559 102939 106463 110133
Zipf 100712 104627 108793 113228
Other 99916 102252 104430 106464
90000
95000
100000
105000
110000
115000
Kouga

Table 9: Local population estimates in the Kou-Kamma Local Municipality
A comparison of the above methods for local municipalities in the Sarah Baartman District
Municipality shows that there are slight variations in the estimates produced by the various
methods, however they fall within a close range. Over time the Sarah Baartman district
population increased between 2011 and 2015, and similarly so did the local municipalities
within the district.
Initial results show that the methods are robust and comparable for large municipalities
such as Makana Local Municipality and Kouga Local Municipality . It is found that variation
in estimates produced over time by the differing methodologies, is far greater when applied
to municipalities with smaller populations. There appear to be no discernible trend of one
method consistently over or underestimating local population estimates over time. The
ratio and growth method have a relationship to census, thus the population estimates
produced lie close to census values at the beginning of the series, whist the latter 2 methods
are not linked to census and thus may be further from the census population number at the
beginning of the series.
Limitations
A key limitation of the ratio method is that if a given geographical area shows a substantial
loss in population from one Census to another it causes the regression line to be steeply
negative, particularly if the area is small or if the method is being applied to wards. This
2011 2012 2013 2014 2015
Census 40663
Ratio 41516 42590 43701 44848
Growth 40923 42093 43309 44570
Zipf 42238 43557 44953 46429
Other 41844 42440 43010 43558
3700038000390004000041000420004300044000450004600047000
Kou-Kamma

negative regression line would cause the predicted value of the population in the future to
be a negative value, which it clearly can not be. The growth method tends to mask that
effect of rapid negative growth due to the method of calculation. It is hence recommended
that this method not be used for very small areas or for estimating sub-sections of the
population alone (Wilson, 2011).
A key requirement to be able to use the methods represented in this paper is to ensure that
data from various points in time are geographically harmonised to the most recent
geographic boundaries, so that results remain meaningful (Smith and Morrison, 2005).
Also, it must be noted that this paper represents a first attempt at creating population
estimates at such a small unit level in South Africa. These estimates should be compared
with estimates produced elsewhere to determine their usefulness in benchmarking surveys
at Statistics South Africa as well as other internal initiatives.
Conclusion
Whilst small area estimates and projections contain an element of uncertainty, when
derived with a careful selection of data sources and methods, it can produce a foundation
for suitable estimation. The results reveal that although the estimates are not necessarily
perfect as there is variation across methods, the estimates are plausible. Whilst this
research will continue to explore more elaborate methods such as the cohort component
method and spatial techniques, it would be short sighted to ignore the plausibility that
simpler methods may yield more accurate estimates.
Going forward, the challenge would be to extend these estimates to the rest of the country
and to be able to disaggregate them by sex and age groups to address the needs of different
stakeholders.
References
Bryan, T. 2004. Population estimates. In Siegel, J. S and Swanson, D.A. The Methods and
Materials of Demography (2nd edition) pp 9-41. San Diego, California: Elsevier /Academic
Press.
Ghosh, M. and Rai, J.N.K. 1994. Small area estimation: An Appraisal. Statistical Science. Vol 9
No 1 (feb) pp 55-76.
Jiang, J. and Lahiri, P. (2006) Mixed model prediction of small area estimation. An Official Journal of the Spanish Society of Statistics and Operations Research, Vol. 15, Issue 1, pp1-96. Kaneda, T. and Bremner, J. 2014. Understanding population projections: Assumptions
behind the numbers. Population Reference Bureau.
Lomahoza, K., Brockerhoff, S. and Frye, I. 2013. A review of National and Provincial
Government budgets in South Africa (2007/2008- 2011/2012) – Monitoring the progressive
realisation of Socio economic Rights project
Lymer , S. and Brown, L. 2012. Developing a Dynamic Microsimulation Model of the
Australian Health System: A Means to Explore Impacts of Obesity over the Next 50 Years.
Epidemiology Research International 2012:13
Rayer, S. 2015. Demographic Techniques: Small-area Estimates and Projections International Encyclopedia of the Social & Behavioural Sciences, 2nd Edition, edited by Wright, J.D., Vol 6, pp 162–169. Elsevier Rogers, A. 1995 Population forecasting, do simple models outperform complex models?.
Mathematical Population Studies Vol 5 No 3
Schmidtt, R.C. and Corsetti, A.H. 1951. Accuracy of the ratio method for forecasting city
populations. Land Economic Vol 27 No 4 (Nov) pp 346-348. University of Wisconsin
Smith, S.K. and Cody, S. 2013. Making the Housing Unit method work: an evaluation of 2010
population estimates in Florida. Population Residence Policy review Vol (32) pp 221-242.
Springer Publications.
Smith, S.K. and Morrison, P.A. 2005. Small Area and Business Demography. In Dudley, P. and
Micklen, M. (eds) Handbook of population. New York: Springer publications.
Statistics South Africa 2011. Census 2011 Spatial Metadata. Pretoria. Statistics South Africa
Statistics South Africa. 2014. Simulating key estimates for local municipality socio-economic
development models: applications of the rank-size rule from 2007 – 2012. Pretoria. Statistics
SA.
Statistics South Africa. 2015. Mid-year population estimates 2015. Pretoria. Statistics SA.

United Nations. 1992. Preparing Migration Data for Subnational Population Projections.
Department of International and Economic and Social Affairs. New York. United Nations.
Wang, L and Changshan, W. 2010. Preface: Population estimation using remote sensing and GIS
technologies, International Journal of Remote Sensing, Vol 31, No 21, pp 5569-5570.
Wilson, T. 2011. A Review of Sub-Regional Population Projection Methods. Queensland
Centre for Population research. The University of Queensland, Australia.
Zhang, S., Goetska, F. and Schneider, E. 2013. Estimating historic population data for small
geographies using census housing information. Journal of Population Research Vol 30 pp
305-317. Springer.