population genetic structure of salmon ...apc.ku.lt/en/wp-content/uploads/2018/05/asamuiloviene...6...
TRANSCRIPT

1
KLAIPĖDA UNIVERSITY
AURELIJA SAMUILOVIENĖ
POPULATION GENETIC STRUCTURE OF SALMON ( SALMO SALAR L.) AND SEA TROUT (SALMO TRUTTA L.) IN LITHUANIAN RIVERS
Doctoral dissertation Biomedical sciences, ecology and environmental sciences (03B),
Klaipėda, 2012

2
Dissertation was prepared in 2003–2012 at the Klaipėda University Coastal Research and Planning Institute. Supervisor: Prof. dr. Riho Gross (Estonian University of Life Sciences, Institute of Veterinary Medicine and Animal Science; Biomedical Sciences, Ecology and Environmental Science – 03B)

3
KLAIPĖDOS UNIVERSITETAS
AURELIJA SAMUILOVIENĖ
GENETINĖ LAŠIŠŲ (SALMO SALAR L.) IR ŠLAKI Ų (SALMO TRUTTA L.) POPULIACIJ Ų
STRUKTŪRA LIETUVOS UPĖSE
Daktaro disertacija Biomedicinos mokslai, ekologija ir aplinkotyra (03B)
Klaipėda, 2012

4
Disertacija rengta 2003 – 2012 metais Klaipėdos universiteto Baltijos pajūrio aplinkos tyrimų ir planavimo institute. Mokslinis vadovas: Prof. dr. Riho Gross (Estijos Gyvybės mokslų universitetas, Veterinarinės medicinos ir gyvūnų mokslų institutas, biomedicinos mokslai, ekologija ir aplinkotyra – 03B).

5
TABLE OF CONTENT 1. INTRODUCTION 2. LITERATURE REVIEW
2.1 Phylogeography of Atlantic salmon (Salmo salar) and brown trout (Salmo trutta) 2.1.1 Atlantic salmon 2.1.2 Brown trout
2.2 Factors affecting genetic differentiation of populations 2.3 Genetic markers 2.4 Genetic management of salmon and trout populations
2.4.1 Monitoring genetic diversity 2.4.2 Resolving spatio-temporal population structure
2.4.3 Identifying genetic effects of stocking 2.5 Current releases of salmon and brown trout in Lithuanian
rivers 3. STUDY AREA 4. MATERIAL AND METHODS
4.1. Fish samples 4.2. Microsatellite analysis 4.3. Statistical analysis
5. RESULTS 5.1 Sea trout 5.1.1 Hardy-Weinberg equilibrium and genotypic
linkage disequilibrium 5.1.2 Genetic diversity in wild and enhanced sea trout
populations 5.1.2.1 Within locus variability 5.1.2.2 Genetic diversity within populations 5.1.2.3 Genetic diversity among populations 5.1.2.4 Allele frequencies

6
5.1.3 Genetic differentiation and relationships among populations
5.1.4 Hierarchical analysis of genetic structure 5.1.5 Temporal stability of sea trout populations 5.1.6 Contemporary gene flow
5.2 Atlantic salmon 5.2.1 Genetic diversity in wild and farmed salmon populations
5.2.2 Allele frequencies in salmon populations 5.2.3 Genetic differentiation and relationships among salmon populations
6. DISCUSSION 6.1 Genetic diversity of sea trout and salmon populations 6.2 Genetic structure of sea trout populations 6.3 Temporal stability of sea trout populations 6.4 Impact of contemporary gene flow on fine scale
genetic structure of sea trout populations 6.5 Implications for management based on results of this
thesis 7. CONCLUSIONS 8. REFERENCES

7
1. INTRODUCTION
Scope of the study. Genetic variation constitutes the basis for biological evolution and consequently influences all levels of biodiversity (Laikre et al., 2010). Genetic components of biodiversity are essential for adaptation to environmental changes, sustainable use of recourses and ecosystem recovery (Luck et al., 2003; Frankham, 2005; Reusch et al., 2005). Species are not genetically homogeneous, but structured into groups of individuals (or populations) that are genetically differentiated (Laikre et al., 2005). Genetic population structure of the species is a pattern of distribution of genetic variation within and between populations and genetic differences between them. For a species like Atlantic salmon (Salmo salar L.) and sea trout (Salmo trutta L.), strong homing instinct (i.e., sexually mature individuals return to spawn to the river in which they were born) provides a possibility to genetically adapt to environmental conditions in their natal rivers and results in the formation of pronounced genetic structure, where each river system contains at least one genetically distinct population (Hansen et al., 2002; Koljonen et al., 2002; Fraser et al., 2007; Apostolidis et al., 2008; Ozerov et al., 2010). Ignoring or not knowing the genetic population structure may result in loss of genetic diversity, reduced productivity, and ecological damage (Laikre et al., 2005).
A large proportion of the natural habitat of the salmon and brown trout has been altered by various human activities (pollution, power plant construction, timber floating) (Parish et. al., 1998; Nilsson et al., 2005). Subsequently, large part of the intraspecific variability of the salmon and trout has been lost due to environmental degradation and harvesting (Laikre and Ryman, 1996). Furthermore, because of the species economic value, remaining populations are threatened by activities such as releases of translocated or hatchery bred individuals into natural rivers where wild populations of the same species occur (Laikre et al., 2010).
Hatchery produced and released salmon constitutes about 70% of the salmon in the Baltic Sea (ICES, 2011). More or less extensive
8
stocking programs of salmon and brown trout have been carried out for several decades in most of the rivers of the Baltic sea basin, including those which still harbor wild populations (ICES, 2011). It is evident from the many studies that introgression of hatchery reared individuals into the wild populations occurs and results in genetic changes in the wild populations. Moreover, these genetic changes are almost always detrimental to the fitness and survival of individual populations as well as to inter-population genetic variability (Hindar et al., 1991; Moran et al., 2005; Vasemägi et al., 2005b; Apostolidis et al., 2008; McGinnity et al., 2009; Hansen et al., 2010). Therefore, to enable sustainable use and conservation of natural salmon and brown trout populations it is essential to incorporate genetic aspects into the management (Allendorf et al., 1987).
Atlantic salmon and brown trout are genetically highly structured species. The brown trout has two alternative life stages: (i) resident form that spend their entire life in a river or a small stream, and often spawn in smaller tributaries of the area and (ii) anadromous form (sea trout) that migrate from the rivers or streams in which they were born to the sea where they forage until reaching sexual maturity and then return to their native rivers to spawn. (Elliott 1994). There is complete reproductive isolation between resident populations which are physically isolated (Moran et al., 1995; Bouza et al., 1999). Anadromous populations, because of homing behavior and restricted gene flow, are also partly isolated from each other (Hansen et al., 2002). Although Atlantic salmon and brown trout are generally well studied species in respect to genetic population structure, very little information on genetic variation and genetic population structure exists for these species in Lithuania. While the distribution, abundance and productivity of salmon and sea trout stocks in Lithuania have regularly been monitored since 1998, only mitochondrial DNA diversity of these species has been studied in Nemunas river basin (Leliūna and Virbickas, 2006; Leliūna, 2010) and the population genetic studies based on more informative nuclear DNA markers have not been carried out so far. This study is the first attempt to gather information on genetic structuring, relationships and dispersal among

9
Lithuanian salmonid populations based on microsatellite DNA analysis.
Objective and tasks of the study. The objective of this study
was to assess genetic diversity of Lithuanian salmon and sea trout populations, to investigate spatio-temporal population structure of sea trout and to provide recommendations for sustainable management of genetic resources.
The main tasks of the study were:
1. to estimate between-river and within-river genetic diversity in wild and enhanced salmon and trout populations;
2. to estimate genetic differences and relationships among populations;
3. to determine hierarchical structure of sea trout populations; 4. to assess temporal stability of the genetic diversity and
structure of sea trout populations; 5. to estimate the level and patterns of contemporary gene flow
among sea trout populations; 6. to develop guidelines for management of genetic resources.
Novelty of the study. It is the first study of genetic diversity
and population genetic structure of salmon and sea trout in Lithuanian rivers based on microsatellite DNA variation. It provides information on the patterns of contemporary natural and human mediated gene flow and the resulting fine scale and temporal population structure of the sea trout in Lithuania. This study provides also information about the genetic impacts of supportive releases in the highly structured population system.
Scientific and practical significance of the results. The results
of this study contribute significantly to the general knowledge about the population ecology of salmonid fishes in Lithuanian rivers. This study provides information on spatial and temporal genetic structure that could be used for identifying and analyzing changes caused by

10
human activities, therefore the results of this study can be important not only in Lithuanian but also throughout Baltic sea region.
Results of this study provide baseline data for monitoring future changes at gene level diversity of salmon and sea trout in Lithuania. This study also provides guidelines for future management of the sea trout populations that should be based on knowledge of genetic structuring, relationships and dispersal among populations. Potentially these guidelines can be incorporated in practical management programs of salmon and trout in Lithuania.
Defensive statements
1. Level of genetic diversity in Lithuanian salmon and sea trout populations is high and similar in all examined river basins as well as between wild and hatchery populations.
2. Lithuanian sea trout populations are hierarchically structured at the level of river basins and at the level of tributaries within the river basins.
3. Genetic structure of sea trout populations fit isolation by distance model and differentiation by drainage are more pronounced than within river basin differentiation.
4. Lithuanian sea trout populations are temporally stable.
5. Contemporary gene flow between Lithuanian sea trout rivers is asymmetric and distance restricted.
6. Genetic diversity and genetic structure of Lithuanian sea trout populations reflects contemporary dispersal and gene flow (both natural and human mediated). Scientific approval
The results of this study were presented at 5 international conferences:
European Workshop for Doctoral Students on Salmo salar and Salmo trutta Research (NoWPaS), February 14–17, Roskilde, Denmark

11
"Genetic risks in relation to compensatory releases of reared salmon in the Baltic Sea". December 7–8, 2010, Älvkarleby, Sweden;
1st , 2nd and 3rd regional student conference on "Biodiversity and functioning of aquatic ecosystems in the Baltic Sea region", Klaipeda, Lithuania, in 2004, 2006 and 2008.
Two papers were published on the dissertation topic:
1. A. Šauklytė, A. Kontautas, A. Paulauskas. 2002. Genetic diversity of farmed and wild populations of Lithuanian stocks of Atlantic Salmon. Proceedings of the Latvian Academy of Sciences. Section B, Vol. 56, No. 3, pp. 20–25.
2. A. Samuiloviene, A. Kontautas, R. Gross. 2009. Genetic diversity and differentiation of sea trout (Salmo trutta) populations in Lithuanian rivers assessed by microsatellite DNA variation. Fish Physiology and Biochemistry, Vol. 35, No. 4. pp. 649–659.
Volume and structure of the thesis. The dissertation is presented in the following chapters: Introduction, Literature review, Study Area, Material and Methods, Results, Discussion, Conclusions and References. The volume of the dissertation is 112 pages and references include 144 sources.
Acknowledgements Firstly, I would like to sincerely thank my supervisor Prof. Dr.
Riho Gross for the ideas, help and support; for encouraging and providing an opportunity to begin population genetic research and utilize modern molecular method - analysis of microsatellite DNA. For assistance in research and in the writing publications as well as this thesis. Also for the warm welcome and sincere concern in the beautiful city of Tartu.
I also sincerely thank Antanas Kontautas for care and confidence from the undergraduate studies and throughout my scientific career. Without his regular advise and help in case of any

12
problem, even not linked directly to the scientific work, as well as encouragement and enthusiasm this work would be impossible.
A sincere thank to the supervisor of my master project and co-author of the first article prof. Algimantas Paulauskas for the help, confidence and encouragement of further scientific career.
I thank my other colleagues who have directly contributed to this work: Nerijus Nika and Tomas Ruginis for fish sampling and consultation; Egidijus Leliūna for samples of artificial bred salmon; Jūratė Lesutienė for a friendly shoulder and very valuable advices. I also thank the Chairman of doctoral committee prof. Sergej Olenin, dr. Darius Daunys, dr. Zita Gasiūnaitė and other members of doctoral committee for a special incentive and critical comments in the final stages of this work, as well as other CORPI staff and graduate students for their support and friendship.
Special thanks to all the team of Department of Aquaculture of Estonian University of Life Sciences and especially to prof. Tiit Paver, dr. Jüri Kasesalu, Marje Aid, Mariann Nõlvak and Kuldar Kõiv for the warm welcome and continued support during the work in the laboratory and with the data. Also I would like to specially thank technician of laboratory Manus Olesk for daily support and quick solving of problems, also for warm communication and sense of humor, without which the long work far away from home and family would have been much more difficult.
I thank all my family and especially my mother for comprehensive support, help and faith in my choice. My husband Andrius for understanding and support even for the most difficult moments. Also our sons, Arminas and Augustas for the nearby presence and constant source of positive emotions.
This research was supported by Coastal Research and Planning Institute, EU funded project FW 6 506675 ALARM (Assessing Large Scale Risks for Biodiversity with tested Methods), Estonian Science Foundation (grants no. 5729 and 7348) and Estonian Ministry of Education and Science (grant no. SF1080022s07). The mobility grant was provided by Nordic Marine Academy.

13
2. LITERATURE REVIEW 2.1 Phylogeography of Atlantic salmon (Salmo salar) and brown trout (Salmo trutta) 2.1.1 Atlantic salmon
The distribution area of Atlantic salmon (Salmo salar) is wide and covers north Atlantic river system in North America and Europe. Nowadays its European distribution range extends from northern Portugal to the Pechora River in northwest Russia, including Iceland, the British Isles and the Baltic Sea (Tonteri et al., 2005). In the western Atlantic Salmo salar is found in the rivers of USA, Canada and Greenland. The analysis of various classes of molecular markers showed clear genetic differentiation between western and eastern groups of Atlantic salmon populations (Ståhl 1987; Bermingham et al., 1991; McConnell et al., 1995a, b; Verspoor et al., 1999; King et al., 2001) as well as between eastern Atlantic and Baltic salmon groups (Bourke et al., 1997; Verspoor et al., 1999; Nilsson et al., 2001; Consuegra et al., 2002; Säisä et al., 2005). Consequently, Baltic Sea salmon forms one of the three major groups of Atlantic salmon; the others are groups of western and eastern Atlantic. For the Baltic Sea salmon, three hypotheses of post-glacial origin have been proposed. One of the hypotheses is that the Baltic Sea could be colonized by salmon from eastern preglacial lakes before the Yoldia sea stage (Kazakov and Titov, 1991, Nilsson et al., 2001; Tonteri et al., 2005). Other hypothesis proposes a western origin from Atlantic populations via Närke Strait at the beginning of the Yoldia sea stage (Verspoor et al. 1999) and third hypothesis suggests combination of both west and east origin of Baltic salmon (Koljonen et al., 1999). The hypothesis that the entire Baltic Sea was colonized from a western refugee (Verspoor et al., 1999) was based on the studies of salmon populations from the Gulf of Bothnia only, while other Baltic

14
Sea areas and populations were not covered by investigations (Säisä et. al., 2005). However, knowledge on allozyme and mitochondrial DNA variation provide clear evidence of the genetic differences between southern Baltic populations (Main Basin and Gulf of Finland) and populations that belong to the Gulf of Bothnia (Koljonen et al., 1999; Nilsson et al., 2001). It was proposed that these differences exist because the postglacial colonization of the Baltic Sea with different lineages from different glacial refuge: present salmon stocks of Estonia, Latvia, Russia and southern Sweden are probably originated from the eastern glacial lakes (the Ice Lake Lineage) and stocks of northern Finland and northern Sweden are Atlantic origin (Atlantic lineage) (Koljonen, 1999). Later on it was found that based on microsatellite DNA variation, there are genetic differences not only between southern and northern Baltic salmon populations, but also between populations within southern group. Within the Baltic Sea the anadromous salmon populations form three distinct groups, corresponding to the northern (Gulf of Bothnia), eastern (Gulf of Finland and eastern Baltic Main Basin) and southern regions (western Baltic Main Basin) (Säisä et al., 2005). These findings indicated that the Baltic Sea was colonized by at least three distinct refuges: the Gulf of Bothnia from an Atlantic refugee, the Gulf of Finland from an eastern ice lake refugee and the southern Main Basin from a southern refugee that was presumably located in the basin of rivers Nemunas, Vistula, Odra and Elbe (Säisä et al., 2005).
Colonization hypothesis that entire Baltic Sea has been colonized from eastern preglacial lakes (Kazakov and Titov, 1991, Nilsson et al., 2001; Tonteri et al., 2005) and uncertainty about the possibility of an immigration from Atlantic were based on the fact that one mtDNA haplotype, which is found in most Atlantic populations, was absent in populations from the Gulf of Bothnia (Nilsson et al., 2001). However, Nilsson and co-authors (2001) found that populations from Gulf of Bothnia had several haplotypes that are attributable to Atlantic populations. Studies on allozyme data (Koljonen et al., 1999) as well as microsatellite data (Säisä et al.,

15
2005) also showed similarity of the northern Baltic Sea group and Atlantic populations. Consequently, although the original colonization lineage may later have admixed to some extent with other lineages (Säisä et al., 2005), theories regarding the origin of the Baltic salmon remain controversial. 2.1.2 Brown trout Brown trout (Salmo trutta) is naturally distributed in Europe, Western Asia and North Africa (Garcia-Marin et. al., 1999). Its natural distribution ranges from northern Norway and northeastern Russia, southward to the Atlas Mountains of North Africa. From west to east, its distribution extends from Iceland to the headwaters of Aral Sea in Afghanistan (Apostolidis et. al., 1996a; Bernatchez, 2001). Brown trout is one of the genetically most substructured vertebrate species currently known to exist (Allendorf and Leary 1988). A large proportion of the intraspecific biological diversity of the brown trout is represented by genetic differences between populations, and this genetic divergence is often coupled with pronounced phenotypic variation (Apostolidis et al., 1997). The analysis of mitochondrial DNA (mtDNA) sequence variation has revealed five major phylogeographic groupings among western and central European populations of brown trout: Atlantic, Adriatic, Danubian, Mediterranean and marmoratus (Bernatchez et al., 1992; Bernatchez and Osinov 1995; Bernatchez 2001). The Atlantic phylogeographic group is found throughout the Atlantic river systems from Iceland and Norway in the north to Iberia and the Atlas mountains of Morocco and also in the Baltic and White Sea drainages. Danubian lineage is associated with drainages of the Black, Caspian and Aral Sea basins, as well as the Persian Gulf. The distribution of other three lineages – Adriatic, Mediterranean and marmoratus – slightly overlap with the other two and differ in distribution pattern within the Mediterranean Sea basin. The marmoratus lineage is almost strictly associated with the Adriatic basin. The Mediterranean lineage is predominantly found in tributaries draining in the western basin of Mediterranean Sea,

16
whereas the Adriatic lineage is distributed in the eastern part of the Mediterranean basin (Bernatchez, 2001). Very important role in the origin of the five evolutionary lineages of brown trout played isolation of basins that occurred in Europe during Pleistocene glaciations due to climatic and environmental changes. The most ancient fragmentation, which involved Atlantic, Ponto-Caspian and Mediterranean basins, determined separation between Atlantic and Danubian lineages (Apostolodis et. al., 1996b). Subsequent and possibly simultaneous fragmentation occurred within the Mediterranean basin, which led to the divergence of the Mediterranean, marmoratus and Adriatic lineages (Bernatchez, 2001). Considering that Atlantic lineage is associated with the Atlantic basin, the center of origin of this lineage is associated with drainages of this system. The northern part of the Atlantic region was ice covered and thus many populations have existed only since postglacial times (Apostolidis et. al., 1996a). However, in addition to the brown trout populations being present in unglaciated parts of the Atlantic region, one or more glacial refugia probably existed at the margins of the ice sheets (Ferguson and Fleming 1983; Hamilton et al., 1989; Osinov and Bernatchez 1996). This was supported by significant differences in nuclear and mitochondrial DNA markers between Atlantic Iberian populations and more northern Atlantic populations (Moran et al., 1995; Antunes et al., 1999; Garcia-Marin et al., 1999; Weiss et al., 2000). Studies based on variation of allozyme alleles and mitochondrial DNA has proposed that more than one postglacial colonization of northwestern Europe took place. On the basis of variation in allozyme alleles, Ferguson and Fleming (1983) proposed that the northwest Atlantic was colonized independently by two races of brown trout. Hynes et al. (1996) analyzed the pattern of distribution of mtDNA and suggested that the post-glacial colonization of northwest Europe was more complex. Garcia-Marin et al. (1999) contributed to the hypothesis of multiple colonization and proposed a postglacial recolonization model of the northwest Atlantic, based on

17
allelic distribution at two enzymatic loci. According this model, colonization occurred from (i) a north-western migration from an eastern Mediterranean-Caspian refuge, (ii) a northern expansion from a refuge in Atlantic drainages of Iberia and southern France, and (iii) a northern and eastern migration from a refuge centered near the English Channel (Garcia-Marin et al., 1999a). They suggested that most current populations in the formerly glaciated area are combinations of these lineages. In the subsequent study, this hypothesis was re-evaluated and was argued that distribution of both mtDNA haplotypes and allozyme alleles do not support the contribution of two major glacial refugee (southwest Atlantic and Mediterranean-Caspian Basin) to the postglacial recolonization (Weiss et al., 2000). It was also suggested that distribution of mtDNA and nuclear gene markers in previously glaciated areas of northern Europe can be explained by postglacial dispersal from refugee located northwards of the Iberian Peninsula, as well as the Black-Caspian-Aral basins (Weiss et al., 2000). Furthermore, Bernatchez (2001) reconciled previous interpretations of the origin and postglacial history of brown trout and supported the existence of northwestern refuge as well as existence of northeastern refuge and also provide evidence for the contribution of a southern refuge. Results of that study implied that northern colonization by this southern group occurred prior to the last glaciations; they also refute a contribution of a Ponto-Caspian lineage. It can be concluded that current genetic diversity in North Atlantic region is the result of independent postglacial colonization by genetically distinct brown trout lineages (Bernatchez, 2001). 2.2 Factors affecting genetic differentiation of populations
Salmonid fishes exhibit complex patterns of genetic
differentiation even at microgeographical levels (Garant et al., 2000; Spidle et al., 2003; Verspoor et al., 2005; Dillane et al., 2007; Vähä et al., 2007; Heggenes et al., 2009). The large microgeographical differentiation is mainly associated with reproductive isolation and
18
homing behaviour (Ferguson, 1989). In some cases genetic differentiation is the result of complete reproductive isolation – distinct populations have been found within the locations that are separated by impassable waterfalls and other geomorphological structures. Otherwise, if there are no physical barriers, strong homing behaviour may be sufficient to maintain genetic differentiation (Ferguson and Mason, 1981; Ståhl 1987). The pattern of substantial microgeographical differentiation may be the result of a combination of mutation, random genetic drift, gene flow and natural selection (Wright, 1931).
Genetic drift . Genetic drift is a random change in allele frequency of population. It occurs if a population size is not infinite. In populations that are not infinitely large, allele frequencies will change over time because to chance. The effects of genetic drift are strongest in small populations: the fewer individuals in the population, the stronger genetic drift affects the population. However, the effect is very small in large populations.
In the short term, over a few generations, a result of genetic drift would be the increasing or decreasing of allele frequencies in a random, unpredictable way. In the longer term, the main result of genetic drift is loss of genetic variation. This occurs because some alleles may not be passed to the next generation and over time the effect of genetic drift will be the loss of alleles by chance. Genetic drift also results in different populations becoming genetically different from each other because different alleles will become more frequent or fixed in different populations.
Natural selection. Natural selection occurs because different
genotypes have different fitness. Individuals with some genotypes (those with higher fitness) survive and reproduce more than other individuals. As a result, these genotypes become increasingly more and more common in populations. In different populations, parents of different genotypes pass their genes unequally to the next generation, leading to the genetic differences among isolated populations. So,

19
genetic drift tends to make different populations genetically different from each other by chance, whereas natural selection tends form genetically different populations due to environmental constraints. Consequently, the traits that have high fitness in one population, and evolve through natural selection, will be different from the traits that have high fitness and evolve through natural selection in another population.
Mutation . Mutation is biochemical change in DNA and assumes changes of one allele into another, what creates new alleles. It is a very unusual process and typical mutation rates are about one mutation in a million genes passed from generation to generation. As a result, evolution through mutation is extremely slow – so slow that it is generally impossible to detect it. However, mutation is important as a source of genetic variation. The process of mutation is the only way in which genetic variability is created, and without mutations there would be no biological diversity. Another important aspect of genetic mutation is its randomness – it may produce alleles that result in high or low fitness. What happens to those alleles, once they are produced, depends on the natural selection, genetic drift and gene flow.
Gene flow. Gene flow is a change in allele frequency that
occurs due to migration of individuals among populations. When individuals move into a population they may bring new alleles which are not present in that population or occur in frequencies that differ from the allele frequencies of that population. Gene flow increases genetic variation within a population. Gene flow tends to make populations genetically similar to each other. The more gene flow occurs, the more similar the populations will become. If less than one individual per generation moves between populations, i.e. the amount of gene flow is very low, then populations will develop complete differences (differences in which alleles are fixed in different populations). In contrast, if migration between populations occur in large numbers of individuals, i.e. the amount of gene flow is very

20
high, the populations will be like one single population and will have the same alleles in the same frequencies, even if they occur in different environments and differences could otherwise to evolve through natural selection. Large amounts of gene flow will mask the effects of other forms of evolutions and make populations similar.
In between these two situations, movement of at least one individual in each generation from population to population will prevent complete differences – the alleles found in one population will also be found in the other. However, if levels of gene flow are fairly low, the populations may have large differences in allele frequency – an allele that is common in one population may be rare in another.
Generally, selection, genetic drift and gene flow affect genetic variation within populations and genetic differences between populations. Both drift and selection tend to decrease variation within populations and increase differences between populations, whereas gene flow increases variation within populations but makes populations similar. 2.3 Genetic markers
Genetic markers are the genes or fragments of DNA that can be
used for population genetics studies. Researchers are very interested in assessing genetic variation of populations and detecting similarities as well as differences of populations in order to optimize conservation strategies. It is difficult to quantify distinctness between populations of the same species using morphological characters, since the most of morphological traits are determined by several genes and are strongly influenced by environmental factors. For these reasons, genetic markers are the most accurate and efficient method to identify discrete populations. Both protein and DNA analysis detect genetic variation that is selectively neutral. However, protein electrophoresis surveys portions of the genome that code the functional biochemical products, so only the functional genes can be detected. Furthermore, a large proportion of genetic variation can arise from silent nucleotide substitutions that are not detectable through protein analysis. Although

21
allozymes are useful for estimation of genetic variability within and between populations as well as for comparison of populations on both temporal and spatial scales (Koljonen et al., 1999; Bouza et al., 1999; Cagigas et al., 2002), the low variability at allozyme loci in most salmonid species reduces sensitivity of these markers and do not provide the desired resolution (Corujo et al., 2004).
In contrast, analysis of DNA detects genetic variation at its most fundamental level, the nucleotide sequence. Thus, DNA analysis allows examination of nucleotide sequences that are not translated into protein products or that have no known function. Because the direct analyses of DNA allow more extensive analysis of the genome and show higher levels of polymorphism, DNA-based markers provide greater ability to resolve slight genetic differences between populations and even to distinguish between individuals (Estoup et al., 1998).
DNA-based analyses can be organized into two broad classes that are defined by the type of DNA they detect. One class of studies targets mitochondrial DNA (mtDNA), the other – nuclear DNA (nDNA). Mitochondrial DNA is a small, haploid molecule that is inherited maternally, is composed almost entirely of coding sequence, is free from recombination and have relatively high mutation rate. These features make mtDNA useful for phylogeographical studies (Weiss et al., 2000; Asplund et al., 2004) and for analysis of spatial and temporal population structure (Laikre et al., 2002). The main disadvantage of mtDNA analysis is that this molecule represents a single gene unit where all genes are linked. Analytical techniques for mtDNA include indirect methods such as the analysis of restriction fragment length polymorphism (RFLP), as well as direct analysis of mtDNA sequences.
The analysis of nuclear DNA provides some advantages over the analysis of mtDNA when greater discrimination among populations or individuals is required, primarily because of nDNA`s larger size, greater variability and recombination. nDNA analysis include minisatellites and microsatellites also known as variable number of tandem repeats, or VNTRs. Microsatellites are short, neutral (non-

22
coding) and highly polymorphic DNA sequences in which variation is expressed by differences in the number of simple sequence (two to six base pairs in length) repeats.
Microsatellite markers are widely used for population genetic studies of salmonid fish. Application of them was successful in phylogeography studies of salmonids (Bernatchez, 2001; Tonteri et a.l, 2005; Säisä et al., 2005), in determination of genetic variation in wild and farmed fish populations (Norris et al., 1999; Koljonen et al., 2002; Was and Wenne, 2002; Machado-Schiaffino et al., 2007; Horreo et al., 2008) as well as assessing intrapopulation diversity, fine-scale genetic differentiation and relationship of populations (Jensen et al., 2005; Campos et al., 2007; Sønstebø et al., 2007; Apostolidis et al., 2008). Microsatellites have been very useful for analysis of hierarchical population structure (Dionne et al., 2008), in detection of gene flow (Hansen et al., 2007; Palstra et al., 2007) as well as in assessment of stocking impact on wild populations (Hansen et al., 2000b; Ruzzante et al., 2001; Vasemägi et al., 2005b; Nilsson et al., 2008) and genetic assignment analysis (Hansen et al., 2000a; Rengmark et al., 2006).
The higher level of allelic variation at microsatellite markers make them useful for addressing questions related to genetic structure, particularly where genetic differentiation may be limited.
The polymerase chain reaction (PCR) enables to amplify DNA sequences up to several million times therefore it provides the possibility of nonlethal sampling. Small amount of tissue (fin clips or scales) may be sufficient for analysis and individuals need not be sacrificed for sampling. This can be an important feature when evaluating genetic change in protected or declining populations and for providing access to DNA of ancient or archived tissue samples. It can provide information about genetic diversity over extensive temporal and spatial scales, especially for populations that no longer exist. Taken together, these characteristics suggest capability to monitoring populations that are small, exploited or declining.

23
2.4 Genetic management of salmon and trout populations Large parts of the intraspecific variability of the salmon and trout
have been lost due to environmental degradation, harvest and stocking (Parish et. al., 1998; Nilsson et al., 2005; Allendorf, 2008). The remaining parts are threatened. Therefore, there is a need for increased conservation efforts on these species. An extensive proportion of the natural habitat of the salmon and brown trout has been affected by various activities (pollution, power plant construction, timber floating) that have altered the natural state of the ecosystem. But it is not enough to consider habitat improvement and to ensure that future manipulations of remaining unexploited areas are avoided as much as possible. To enable sustainable use and conservation of natural salmon and brown trout populations it is essential to incorporate genetic aspects into the management (Allendorf et al,. 1987). Furthermore, because of the species economic value, remaining populations are threatened by activities such as releases of translocated or hatchery bred individuals (Laikre et al., 2010b). These activities are frequently considered harmless or even beneficial, but may be devastating from a conservation genetic standpoint (Laikre et al., 2010b). Therefore, genetic management is an important component of strategies that ensure the conservation and recovery of salmon and trout populations.
Genetic management deals with the genetic factors that affect extinction risk and conservation programes required to minimize these risks. The major issues of genetic management are concerned with monitoring and conserving gene-level biodiversity, resolving spatio-temporal population structure as well as with genetic consequences of stocking practices.
2.4.1. Monitoring genetic diversity
It is recognized that genetic diversity is the basis of evolutionary potential of species. The presence of genetic variation between populations as well as between individuals within populations is essential for their potential to survive and ability to evolve in response to both short-term and long-term environmental

24
changes (Allendorf et al., 2008). The two primary measures of genetic diversity are heterozygosity and allelic diversity. Allelic diversity refers to the number of different alleles at any given locus in the population. Heterozygosity is the percentage of heterozygous loci in a population or individual. Loss of heterozygosity can reduce viability of population by reducing individual fitness, so it is important for immediate adaptation and loss of allelic diversity can affect the ability of populations to evolve in the future (Ryman et al., 1995). The population viability strongly depends on the effective population size which determines the rate of loss of genetic diversity in each generation as a result of genetic drift and inbreeding (Frankham et al., 2002). Smaller populations tend to lose more genetic variation than large, becoming less able to adapt to a changing environment. It is broadly conceded that an effective population size of at least 500 is required for long-term viability (Laikre et al., 2009). The effects of small population size are of major concern because small populations suffer from inbreeding and loss of genetic diversity resulting in elevated extinction risks. Consequently, one of a major objective of genetic management is to minimize inbreeding and loss of genetic diversity.
2.4.2 Resolving spatio-temporal population structure
A large proportion of the intraspecific biological diversity of the salmon and brown trout is represented by genetic differences between populations. Genetic studies help to identify discrete populations and their interactions. It was realized that each river system has at least one genetically distinct population (Ståhl, 1987; Carlsson and Nilsson, 2000; Hansen et al., 2002; Koljonen et al., 2002; Fraser et al., 2007; Apostolidis et al., 2008; Ozerov et al., 2010) Moreover, often there is a high degree of differentiation among populations even at very small geographical scales therefore it is impossible to detect if a particular water system contains one or more populations without population genetic studies (Carlsson and Nilsson, 2000; Spidle et al., 2001; Ruzzante et al., 2001). Strong homing of Atlantic salmon and brown trout results in little genetic exchange

25
between rivers, however occasional straying more likely occur between adjacent rivers. This pattern of gene flow results in association between genetic and geographic distance (or isolation by distance). Many empirical studies in salmonids have revealed significant correlation between geographical and genetic distances (Bouza et al., 1999; Carlsson and Nilsson, 2000; Ruzzante et al., 2001; Campos et al., 2007; Palstra et al., 2007). Thus, even though individuals in each river should be considered as one separate population, genetic diversity in one population can be dependent on other geographically close populations (Vasemägi et al., 2005b). Furthermore, gene flow between local salmon and brown trout populations often are asymmetric and individuals move preferably from large into small populations (Hansen et al., 2007). This pattern of gene flow may be important for maintaining the genetic diversity and viability of the small populations (Consuegra et al., 2005) and providing stability to regional population structure (Palstra et al., 2007). Thus, it is clear that genetic monitoring of contemporary connectivity of populations is necessary for conservation.
Whereas one of the fundamental aims of the conservation genetics is to maintain as much genetic variability within and between populations as possible, it is necessary to study and monitor the amount and distribution of biological diversity over time. Otherwise it would be not impossible to detect negative changes and reductions of this diversity. Generally wild populations of salmon and brown trout are assumed to be genetically temporally stable (Ståhl 1987; Koljonen et al., 1989; Hansen et al., 2002; Verspoor et al., 2005; Campos et al., 2007; Palstra et al., 2007; Vähä et al,. 2008). However, some studies have shown temporal variation that includes significant allele frequency differences between temporally separated samples (Laikre et al., 2002; Ostergaard et al., 2003; Jensen et al., 2005; Hansen et al., 2009). Several studies where the original wild population was compared with hatchery stocked populations, indicated clear loss of diversity and decrease of allelic richness in hatchery stocked population (Säisä et al., 2003; Aho et al., 2006). Therefore genetic management must include collecting data of genetic population

26
structure as well as changes of genetic composition over time in order to identify human mediated loss and change of genetic diversity. 2.4.3 Identifying genetic effects of stocking
Stocking – releasing into the wild fish that were bred in hatcheries or transferred from other location – is very common management practice. It is aimed to enhance the natural population and is generally regarded as beneficial. However, the studies of the efficiency of stocking programmes have showed that genetic introgression of the stocked fish on wild populations is variable and unpredictable. In some cases stocking programmes appear to have been inefficient or introgression is very low (<5%) (Moran et al., 1991; Martinez et al., 1993; Garcia-Marin et al., 1999b; Antunes et al., 2001; Aurelle et al., 2002; Almodovar et al., 2006). Other examples of stocking activities have clearly resulted in survival and reproduction of stocked trout, although the levels of introgression vary very broadly: from less than 25% till more than 70% (Apostolidis et al., 1996a, 1997; Berrebi et al., 2000; Weiss et al., 2001; Jug et al., 2005).
Harmful genetic effects of releases on native gene pools and the need of monitoring of such effects where recognized several decades ago (Ryman 1981) and more recent studies also emphasized the deleterious effects of farmed fish on genetic diversity of wild populations (Hindar et al., 1991; Moran et al., 2005; Vasemagi et al., 2005; Apostolidis et al., 2008; McGinnity et al., 2009; Hansen et al, 2010).
Genetic risks associated with releases of hatchery reared fish can be direct and indirect. Indirect genetic changes can result from ecological impacts that arise through competition, introduction of diseases and parasites and increased predation. Stocked trout are often larger than wild, as a result of selection for faster growth together with favorable conditions for growth (such as diet and temperature) in the farm. Because of larger size and more aggressive behaviour that is typical for domesticated fish, stocked fish can competitively displace wild fish (Weber and Fausch, 2003). Introduction of farm-reared

27
salmonids can increase predation on wild fish through the attraction of predators (Nickleson, 2003). Introduced diseases and parasite can also increase mortality in the wild. Therefore, these ecological impacts can be the reason of lowered effective population size which in turn can cause the loss of genetic variability within populations through increased genetic drift and inbreeding.
Direct genetic impacts emerge when released fish interact and reproduce with the wild fish. Here risks are dependent on the type of stocking. There are recognized two most common types of releases of farmed salmonid fishes: 1) releases of genetically distinct (non-local) populations and 2) releases of local populations from which captive-bred individuals are derived (supportive breeding) (Laikre et al., 2010b). In the case of releases of genetically distinct populations, genetic variation of wild populations may be lost and unique gene pools can be destroyed due to strong inflow of genes from non-local population (Moran et al., 2005; Apostolidis et al., 2008). In addition to genetic differences between wild and reared fish due to different origin, they can differ in their co-adapted gene complexes that are comprised of many genes and are involved in local adaptations. If fish with different co-adapted gene complexes interbreed these gene complexes may be broken down resulting in loss of adaptations, so-called outbreeding depression (Gharrett et al., 1999; Muhlfeld et al., 2009). Releases of genetically distinct populations can also result in a change of genetic composition of wild population. Several studies had showed that wild local populations can become genetically similar to non-native hatchery stocks (Araguas et al., 2004; Vasemägi at al., 2005b).
A particular form of stocking – supportive breeding – is a type of breeding-release program where the released fish descend directly from the receiving population (Hansen et al., 2000b). A fraction of the wild parental fish is brought into a hatchery for artificial reproduction, and the offspring are released into the natural habitat where they mix with the wild fish. The aim of supportive breeding is to avoid genetic problems of supplemental stocking with farm-reared or non-native brown trout. Although in the case of supportive breeding no

28
exogenous genes are introduced to the wild population, it may also have strong negative genetic effects. Several studies have shown that even a short period in a hatchery can result in a reduction of subsequent survival and reproductive success, because differential or relaxed selection in hatchery environment alter behavior, physiology and genetics of fish (Glover et al., 2004; Sundström et al., 2004). Moreover, inadvertent artificial mixing of stocks that inhabit the same water system but are spatially or temporally reproductively isolated, can break down the population structure and local adaptations, leading to a loss of productivity and fitness (Stewart et al., 2006). Considering all possible threats, any stocking activity should always be preceded by analysis of potential genetic consequences and organized with aim to eliminate or minimize the negative genetic effects. 2.5 Current status and releases of salmon and brown trout in Lithuanian rivers
There are 12 rivers in Lithuania inhabited by salmon populations of different abundance. The status of these rivers differs. Leaning on historical data and today’s situation, salmon rivers can be divided into following groups: 1-inhabited by wild salmon; 2-inhabited by artificially reared salmon; 3-inhabited by mixed salmon population; 4-“potential” rivers, i.e. where salmon occurs occasionally; 5-rivers, where salmon got extinct (Kesminas et al., 2003). Purely natural salmon population inhabits Žeimena River and its tributary – Mera, Saria. Mixed, i.e. natural and reared populations are in the rivers Neris, Šventoji, Vilnia, Baltijos Šventoji, Dubysa, Siesartis, Širvinta, Vokė. Populations formed of reared salmon inhabit Virinta, Jūra, Minija rivers and some smaller their tributaries. In the latter rivers artificially reared salmon juveniles are being released for several years already (ICES, 2008).
The observed parr densities in Lithuania are very low in relation to the observed parr densities in most other Baltic rivers (ICES, 2011). There is also remarkable variation in the annual parr

29
densities, as well as between different rivers. Abundance of salmon parr depends on hydrological conditions, spawning efficiency, protection of spawning grounds and migration ways (ICES, 2011).
Salmon smolt production in Lithuania is affected by remaining pollution, the lack of habitats for salmon and quite high mortality rate caused by predators that is significantly higher compared with typical salmon rivers in north Baltic (ICES, 2011). Total salmon smolt production in Lithuanian rivers in 2000-2011 is presented in Table 1.
Table1: Total salmon smolt production in Lithuanian rivers in 2000-2011 (Kesminas, 2012)
Year Total smolt production
2000 6500 2001 5598 2002 4184 2003 1629 2004 5227 2005 7148 2006 5741 2007 13908 2008 32808 2009 35937 2010 47843 2011 6656
Population of sea trout in Lithuania is greater than that of
salmon. Sea trout populations inhabit 76 rivers that belong to 10 major basins: Neris, Žeimena, Šventoji, Minija, Jūra, Dubysa, Bartuva, Akmena-Danė, Šyša, Baltijos Šventoji.
The total annual production of smolts has decreased dramatically since 1999: from 94 500 to 18 000 smolts in 2005, while the potential production was estimated at 323,800 smolts (Kesminas

30
and Kontautas, 2011). However, smolt production of sea trout increased continually since 2005 and reached 42 300 in 2011 (Table 2). The highest densities of natural sea trout have been reported in western Lithuania – in Minija river, furthermore abundance of sea trout was bigger in small tributaries. (Kesminas and Kontautas, 2011).
Table 2: Smolt production of sea trout in Lithuanian rivers in 2006-2011 (Kesminas, 2012)
River/Year 2006 2007 2008 2009 2010 2011 Neris 5300 6100 12200 4300 3600 3700 Žeimena 1400 4300 2600 2000 2900 1900 Šventoji 3000 3900 4800 5100 4900 5300 Minija 5200 8200 8200 12500 8200 21100 Jūra 1000 900 900 800 800 2500 Dubysa 400 1100 1100 4600 1100 2900 Bartuva 100 100 100 500 400 1000 Akmena-Danė
220 800 800 600 800 500
Šyša 300 500 500 400 500 2500 Baltijos-Šventoji
160 400 400 200 600 900
Total 17 080 26 300 31600 31 000 23900 42300
Salmon and sea trout restocking programme in Lithuania started in 1998. Stocking of salmonids in Lithuanian rivers is presently implemented only for restoring and supporting weak natural populations. Whereas in other countries of Baltic Sea region i.e. Sweden and Finland large scale releases of salmon is proceeded to compensate for the production losses caused by dam construction which prohibit natural migration of spawners to reproduction areas in rivers and migration of smolts to feeding areas in the Baltic Sea. Compared to compensatory releases, supportive releases in order to enhance weak natural populations, constitute only a minor fraction of stocking. The total number of released salmon and trout smolts into the Baltic Sea was about 5.0 millions and about 3.0 millions,

31
respectively in 2010 (ICES, 2011). In addition to direct smolt releases salmon and trout are released as eggs, alevins, fry and parr. The total number of releases of these younger life stages to the Baltic Sea rivers was 2.6 millions of salmon and 7.8 millions of trout in 2010 (ICES, 2011).
Salmon and trout smolt releases in Lithuanian rivers was 35 500 and 45 000 smolts respectively in 2010, whereas releases of younger life stages was 140 000 and 95 000 of salmon and trout respectively (ICES, 2011). Total releases of salmon and trout individuals in Lithuanian rivers in 2005-2011 are presented in Table 3. Table 3: Total releases of salmon and trout individuals in Lithuanian rivers in 2005-2011 (ICES, 2011)
Year Salmon Trout 2005 102 000 200 000 2006 30 000 245 000 2007 50 000 185 000 2008 68 000 360 000 2009 108 000 299 000 2010 175 500 140 000 2011 140 200 327 000
Improvement measures in salmon and sea trout rivers include
releases of artificially reared individuals, construction of fish ladders, protection of spawning grounds, improvement of migration ways (ICES, 2011; Kesminas and Kontautas 2011). Despite the measures taken, salmon smolt production in Nemunas basin increased very slowly (ICES, 2011) and almost all sea trout stocks remain in a poor state (Kesminas and Kontautas 2011). The importance of genetic studies that help to obtain better understanding of differences between fish populations must be recognized and information of population genetic structure must be incorporated in management and conservation practices.

32
3. STUDY AREA
The study was based on analysis of 16 populations of salmonid fishes that belong to 7 river basins. Sampling of sea trout populations covered 3 different river basins: Akmena-Danė, Bartuva and Nemunas, whereas wild salmon samples were taken from Žeimena river. The description of study area was based on the study of Gailiušis et. al., 2001 and Nemunas river basin district management plan (EPA, 2010).
Nemunas is the longest river in Lithuania. Its total length is 937 km and the basin area constitutes 97 928 km2. Nemunas flows through the territories of Belarus, Lithuania and Russian Federation (Kaliningrad Region). The Lithuanian part of the basin covers the area of 46 626 km2, covering 72% of the territory of Lithuania.
The longest and the largest (by their catchment size) tributaries of the Nemunas in Lithuania are Merkys, Neris, Nevėžis, Dubysa, Šešupė, Jūra, and Minija. The names of these rivers are also the names of 7 sub-basins within the Nemunas River basin. The area of this study covered the sub-basins of Dubysa, Jūra, Minija and Šyša.
River Dubysa is a right tributary of the River Nemunas. Its total
length is 130.9 km of which 75.5 km accessible for salmonids. The river springs from the Bubiai pond and flows into the Nemunas at 167.5 km from the mouth. The Dubysa basin is narrow (50 km width in its broadest place; its length – about 90 km) because the river bumps into the eastern edge of the Samogitian Upland instead of flowing in the direction of the surface gradient towards the Central Lithuanian Lowland and Karšuva Lowland.
Forests occupy 25% of the area of the basin, the highest forest concentration is in the upper reaches of the river. There are 40 lakes larger than 0.005 km2 within the area; however, their total area is only 5.5 km2, that is, the majority of the lakes are small so the lake percentage is only 0.27%. The area of ponds is larger than that of the lakes and totals to about 10 km2.

33
The river network in the Dubysa basin contains 774 rivers, of which 154 rivers are longer than 3 km and only 17 tributaries are more than 10 km long. The total length of the rivers is 2 439 km, and the density of the river network is 1.24 km/km2. The largest tributaries of the River Dubysa are rivers Kražantė (87.4 km), Luknė (25.8 km), Lapišė (21.1 km), Kirkšnovė (24.7 km) and Mūkė (15.8 km).
Previously, there were 11 dams on the River Dubysa but the majority of them have been torn down. There are no major cities or industries in the River Dubysa catchment area. Pollution from households and industrial wastewater is minimal.
River Jūra is a river in western Lithuania and a right tributary of
the Nemunas. Its total length is 171.8 km. The springs of the river Jūra are located in Rietavas Plain. In the upper reaches, it flows over the western slopes of the Samogitian Upland, then turns to Karšuva Lowland and crosses the moraine ridge of Vilkyškiai in the very lower reaches. It flows into the Nemunas at 81 km from the mouth.
The wood density is about 27%. The lake percentage is extremely low – only 0.04% (there are 20 lakes larger than 0.005 m2, with the total area 1.75 km2). A much larger area, about 16 km2, is occupied by ponds.
The river network consists of 1 674 rivers, of which 334 are longer than 3 km. The total length of the rivers is 5 724 km. The largest rivers that belong to the river Jūra basin are rivers Šešuvis (114.9 km), Šaltuona (73.2 km), Akmena (70.8 km), Ančia (66.4 km), Ežeruona (36.8 km) and Šunija (35.1 km).
River Minija is the right tributary of Atmata, the northern branch
of the Nemunas. It is the eighth river in Lithuania by length (201.8 km) and flows into the Atmata at 3 km from the mouth. The spring of the river is lake Didovo, situated approximately 200 km northeast from the mouth of the Minija River. The major part of the basin is situated in the Coastal Lowland, the upper reaches of the river – in the Samogitian Upland. Near the mouth (18.4 km) the Klaipėda (Vilhelmo) channel connects Minija River with Klaipėda harbour.

34
The number of lakes is comparatively small (39), the average lake percentage is 0.6%. The basin of the Babrungas, the right tributary of Minija, accounts for the highest lake concentration (lakes occupy 5.5% of the area of the basin), including Lake Plateliai (12 km2). The wood density is about 32%.
The network of the rivers in the Minija basin consists of 1 359 rivers, of which 269 are longer than 3 km and most of them are less than 30 km length. The total density of the river network is 1.53 km/km2, the length of the river beds – 4 508 km. The largest tributaries of the river Minija are rivers Tenenys (left tributary, length – 71,9 km), Veiviržas (left tributary, length – 67,9 km), Alantas (left tributary, lenght – 42,9 km), Babrungas (right tributary, lenght – 47,3 km), Salantas (right tributary, lenght 42,1 km). The exceptional feature of Minija River basin is the difference of length of right and left tributaries. Majority of the right tributaries of Minija are short, while the left ones are long, therefore the Minija basin is asymmetric. This asymmetry is caused by relief, which was formed during the glacier period in Western Lithuania and by later postglacial processes.
Agriculture has been prevailing in the rest of the river basin till the middle of 1990s. Since 1995 use of land for agricultural purposes has been decreasing. Currently approximately 53% of land is used for agricultural purposes. The biggest urban areas in Minija River basin are Plunge, Gargždai and Salantai. There are no important industrial branches developed in the Minija River basin, except oil exploration. There are three power stations in Minija River basin.
River Šyša is a river in western Lithuania, a right tributary of the
Nemunas. Its total length is 61 km. The springs of the river Jūra are in the neighborhoods of Vainutas. River Šyša flows in to the Atmata, the northern branch of the Nemunas, at 10 km from the mouth. Samples for this study were taken from the right ributary of river – Šustis (42 km).

35
River Akmena-Danė flows out of the Coastal Lowland and enters the Baltic Sea via Klaipėda Strait. From the springs to the town of Kretinga, the river is called Akmena, and further – Danė.
The wood density in the Akmena-Danė basin is 27% of the area. The river network consists of 60 rivers, half of them are shorter than 5 km and only 3 are longer than 20 km (Akmena-Danė – 62.5 km, Eketė – 23.1 km, Tenžė – 20.7km). The total length of the rivers is 463 km.
River Bartuva is a river in western Lithuania and Latvia. Its total
length is 103 km. River Bartuva begins in the Plungė district, 3 km to the north of Lake Plateliai. Bartuva flows through the Coastal Lowland, crosses the Lithuanian–Latvian border at the Apšė mouth and after 46 km enters lagoon Lake Liepaja, which is connected with the Baltic Sea. In the upper courses Bartuva valley is deep and narrow, while in lower courses it becomes much wider.
The wood density of the basin is 3.2%, and the lake percentage is only 0.2%. There are 5 small lakes. The river network in the Bartuva Basin is comprised of 44 rivers longer than 3 km and 144 ones which are shorter than 3 km. The total length of the rivers is 555.8 km. The longest and largest tributaries of the Bartuva according to their catchment areas in Lithuania are the rivers Apšė (40 km), Luoba (52.2 km) and Erla (28 km). Samples for this study were taken from two tributaries of river Luoba – Pragulba (12.8 km) and Guntinas (12.3 km).
River Žeimena is a salmon and sea trout river flowing to the
River Neris and its total length is 79.6 km. The formal source of the Žeimena is Lake Žeimenys. The river flows over the sandy plain of Žeimena and the upper reaches of its tributaries drain foots of Aukštaičiai Upland and Švenčionys Upland. The Žeimena basin is notable for a particularly high number of lakes: there are 479 lakes with an area larger than 0.005 km2, their total area is 180 km2 (the lake percentage is 6.4 Meanwhile the density of the river network is rather low – only 0.67 km/km2.

36
The river network consists of 524 rivers, of which 104 ones are longer than 3 km and 22 are more than 10 km in length, but the main tributaries are rivers Mera (60 km), Lakaja (29 km), Saria (28 km) and Peršokšna (26 km). The total length of the rivers in the basin is 1 882 km.
The Žeimena basin makes up 11% of the area of the Neris Basin, it accounts for about 25% of the annual flow.
There are no natural or man-made migration obstacles in the river. The river Žeimena is one of the cleanest rivers of Lithuania. This is due to the affluent formation of groundwater and a relatively small anthropogenic impact. According to all the main water-quality criteria the water in Žeimena is very clean.

37
4. MATERIAL AND METHODS
4.1 Fish samples Wild Baltic salmon were sampled by electrofishing from the river Žeimena. The River Žeimena is one of the remaining Lithuania’s rivers in which natural salmon populations live and reproduce. The salmon stock of the river Žeimena is purely wild since there has been no stocking at all. Farmed salmon samples were taken from the Meškeryne hatchery in 1999, 2000 and 2002 (Table 4). The breeders for hatchery population of 1999 were taken from Daugava river, so the origin of this populations is not local.
Samples of sea trout were caught by electrofishing from 10 wild and five enhanced populations of three river basins in Lithuania: Akmena-Danė, Bartuva and Nemunas (Fig. 1). Within Nemunas basin, we studied sea trout populations from rivers Dubysa, Jūra, Minija and Šyša. These rivers are the main sea trout rivers with largest densities of natural sea trout in Lithuania (Kesminas, 2012). For the following populations temporally replicated samples were obtained: Bonalė (ADB), Pragulba (BP), Dratvinys (NDD), Lapiše (NDLa), Upinikė (NJU), Blendžiava (NMB) and Mišupis (NMM). All sampled populations consisted of the individuals of 0+ age class. Detailed information about samples is provided in Table 4.

38
Table 4: Information about analyzed salmon and sea trout samples Sampling location (river basin/tributary/sub-tributary)
Abbreviation Status of sample
Year of sampling Sample size
Atlantic salmon 1. Nemunas/Neris/Žeimena NNZ wild 2000 30 2. Hatchery Hat-99/00/02 hatchery 1999/2000/2002 50/30/30 Total 140 Sea trout 1. Akmena-Danė/ Bonalė ADB-03/07 wild 2003/2007 10/29 2. Akmena-Danė/ Eketė ADE wild 2004 12 3. Akmena-Danė ADF enhanced 2005 30 4. Bartuva / Guntinas BG wild 2004 10 5. Bartuva / Pragulba BP-04/07 wild 2004/2007 21/29 6. Nemunas / Dubysa/Luknė NDL wild 2003 17 7. Nemunas / Dubysa/Dratvinys NDD-04/07 enhanced 2004/2007 33/30 8. Nemunas / Dubysa/Lapišė NDLa-06/07 enhanced 2006/2007 30/31 9. Nemunas /Jūra /Upynike NJU-04/06 wild 2004/2006 27/26 10. Nemunas/Jūra/Ežeruona NJE wild 2004 17 11. Nemunas/Jūra/Šunija NJS enhanced 2004 30 12. Nemunas /Minija/Blendžiava NMB-04/05 wild 2004/2005 28/30 13. Nemunas/Minija/Mišupis NMM-05/07 wild 2005/2007 29/21 14. Nemunas/Minija/Šiūšis NMTS enhanced 2005 30 15. Nemunas/Šyša/Šustis NSS wild 2004 37 Total 557

39
Fig. 1: The origin of analyzed sea trout samples

40
4.2 DNA isolation and genetic analysis Genomic DNA was isolated from fin clips or muscle tissue according to the simplified method of Laird et al. (1991). A total of 5 salmon microsatellite loci (Ssa 197, SSOSL417, Ssa202, SSOSL85 and Ssa171) as well as 7 sea trout microsatellite loci (Str60, SSOSL311, Str15, SSOSL483, Ssa197, Ssa85 and SSOSL417) were analyzed according to protocols outlined in Samuiloviene et al. (2009). Briefly, PCR reactions were composed of ca 10 ng DNA, 1x PCR buffer, 1.5 mM MgCl2, 0.1 µM dNTPs, 0.2-0.3 µM of each primer and 0.2 U of Taq DNA polymerase (MBI-Fermentas), in a total volume of 10 µl. The forward primers were end-labeled with the fluorescent dye Cy5. For cycling, the following thermal profile was used: initial denaturation at 94 °C for 3 min, 35 cycles of 40 sec at 94 °C, 40 sec at 57 °C, 1 min at 72 °C and final extension at 72 °C for 10 min.
The length of the microsatellite alleles was determined by ALFexpress II DNA analyzer and AlleleLinks v. 1.02 software (Amersham Pharmacia Biotech). A reference sample with known genotype was included on each gel and internal size standards were included in each lane to ensure consistent scoring of genotypes across all gels.
4.3 Statistical analysis
For data analysis, FSTAT v. 2.9.3.2 program package (Goudet 2002) was used for calculating allele frequencies and pair-wise FST values, for estimating the expected and observed heterozygosities (HE, HO) and the allelic richness (AR), and for testing the significance of differences in average values of AR, HE and HO among the groups of populations (1000 permutations, two-side tests of the null hypothesis of no difference). GENEPOP v. 3.3 (Raymond and Rousset 1995a) was used to test genotypic distributions for conformance to Hardy-Weinberg (HW) expectations and for deficiency or excess of heterozygosity, to test the loci for genotypic disequilibria, and for estimating the significance of allelic differentiation between population pairs. All probability tests were based on the Markov chain

41
method (Guo and Thompson 1992; Raymond and Rousset 1995b) by using 1000 de-memorization steps, 100 batches and 1000 iterations per batch. The sequential Bonferroni adjustments (Rice 1989) were applied to correct for the effect of multiple tests.
The significance of the differences in pairwise FST and DA values observed between temporal replicates and spatial samples within years was assessed by performing nonparametric Mann-Whitney U-test in software package STATISTICA 7. Spatial patterns of differentiation among the populations were tested for their fit to the isolation-by-distance model (Rousset 1997). The significance of the fit was estimated by the Mantel test of the ISOLDE program in the GENEPOP 3.3 software package (Raymond and Rousset 1995a) using 10 000 bootstraps. The populations were tested also for recent reduction of their effective population size by using Wilcoxon sign-rank test as implemented in the BOTTLENECK computer program, assuming the two-phase model of mutation (with 5% multi-step changes and variance of 12) for microsatellite loci (Piry et al., 1999).
Contemporary migration rates were estimated using a Bayesian method, implemented in BAYESASS 1.3 (Wilson and Rannala, 2003). Analyses were run for 3 000 000 iterations and sampled every 2000 iterations, with a burn-in of 1 000 000 iterations. The delta values of 0.10, 0.10 and 0.25 for allele frequency, migration rate and the level of inbreeding, respectively were used.
Analysis of molecular variance (AMOVA) incorporated in ARLEQUIN v. 2.00 (Schneider et al. 2000) was used to partition genetic variance hierarchically between river drainages, between populations within river drainages and among individuals within the populations. In order to assess the temporal component of genetic diversity, we defined three hierarchical levels: the first level was associated with variation among sampled populations (geographic component), second level was associated with variation between temporal samples within populations (temporal component), and the third level was associated with variation among individuals within populations. This analysis was performed on the subset of 7 populations for which temporal replicates were available (Table 4).

42
Genetic distances between the populations were estimated by the DA distance of Nei et al. (1983) and a population tree was constructed with the neighbor joining (NJ) algorithm using DISPAN software (Ota 1993). Bootstrapping 1000 times over loci assessed the strength of the support for each node in the tree.

43
5. RESULTS 5.1 Sea trout 5.1.1 Hardy-Weinberg equilibrium and genotypic linkage disequilibrium
Exact Hardy–Weinberg tests showed significant deviations from Hardy-Weinberg equilibrium in 16 out of 161 tests at 5% significance level. Two of them remained significant after Bonferroni adjustments, all of them involve different locus in different population (locus SSOSL311 in NDD-04 and locus Ssa197 in NDD-07) (Table 6). Linkage disequilibrium was not significant for most studied samples and only one to three pairs of loci out of 21 tests per population were in linkage disequilibrium in populations ADB-07, NDD-04, NDD-07, NMB-04, NMB-05, NJS and NSS after applying Bonferroni correction for multiple tests. Significant linkage disequilibrium between loci in these populations can be most probably explained by sampling the siblings (Ohta 1982). 5.1.2 Genetic diversity in wild and enhanced sea trout populations 5.1.2.1 Within locus variability
Within locus genetic diversity was moderate to high with observed heterozygosities ranging from 0.509 (SSOSL438) to 0.899 (SSOSL311) over all samples (Table 5). Individual loci varied in observed heterozygosity among populations, ranging from 0.300 (SSOSL438 in BG04) to 1.000 (SSOSL311 and SSOSL417 in ADB07; SSOSL311 and SSOSL417 in NDL04; SSOSL311 in BG04 and Ssa197 in NMB04) (Table 6). Expected heterozygosities ranged from 0.491 (SSOSL438) to 0.870 (SSOSL311) over all samples (table 5) and from 0.249 (SSOSL438 in NMM05) to 0.911 (SSOSL311 in NJE) for individual loci among populations (Table 6). In total, 67

44
alleles were observed at the 7 microsatellite loci analysed, ranging from 4 (Str60) to 20 (SSOSL311). Averaged number of alleles detected per population varied from 2.77 (Str60) to 10.36 (SSOSL311) (Table 5). Table 5: Locus by locus statistics (Aver.A – average number of alleles per locus; Aver.HE – average expected heterozygosity; Aver.HO – average observed heterozygosity; SD – standard deviation) Locus Aver.A SD Aver.HE SD Aver.HO SD Str60 2.772 0.612 0.529 0.073 0.545 0.121 SSOSL311 10.364 2.216 0.870 0.024 0.899 0.070 Str15 4.045 0.722 0.643 0.113 0.678 0.134 SSOSL438 3.455 1.057 0.491 0.111 0.509 0.149 Ssa197 6.091 1.019 0.711 0.100 0.738 0.127 Ssa85 4.318 0.716 0.677 0.064 0.677 0.095 SSOSL417 7.227 1.572 0.788 0.065 0.803 0.111
Figure 2: Relationship between the number of alleles per locus and heterozygosity (averages±SD).

45
Three analysed loci SSOSL311, SSOSL417 and Ssa197 revealed higer level of genetic diversity than Str15, Ssa85, SSOSL438 and Str60. Also it was evident that loci with higher allelic diversity, exhibited higer level of heterosygosity, the only exeption was locus SSOSL438, that has lowest genetic diversity in terms of heterozygosity but not in terms of allele diversity (Fig. 2). 5.1.2.2 Genetic diversity within populations
Genetic diversity within Lithuanian sea trout populations was assessed by heterozygosity and allelic diversity. Allelic diversity refers to the number of different alleles at any given locus in the population. Heterozygosity is the percentage of heterozygous loci in a population.
The total number of alleles over seven loci ranged from 25 in the Guntinas population of the Bartuva river basin (BG) to 45 in the Lapišė population from 2006 that belongs to the Dubysa river of the Nemunas river basin (NDLa-06). As the number of alleles is dependent on the sample size it is more appropriate to characterize the populations based on the corrected parameter, the allelic richness (AR), which across all populations had a mean value of 4.43 and within populations ranged from 3.53 in Guntinas population of the river Bartuva (BG) to 5.04 Dratvinys population from 2004 that belongs to the Dubysa river (NDD-04) (Table 6).
Average observed heterozygosity across all populations was 0.693 and within populations varied from 0.584 in 2004 sample of Bonalė population of the Akmena-Danė river basin (ADB-04) to 0.797 in Luknė population of the Dubysa river (NDL). Expected gene diversity across all populations was 0.673 and within populations varied from 0.600 in the Eketė population of the Akmena-Danė river basin (ADE) to 0.745 in Dratvinys population from 2004 that belongs to the Dubysa river (NDD-04) (Table 6).

46
Table6: Micosatellite diversity indices for sea trout populations from Lithuanian rivers. Figures provided are number of alleles (A), allelic richness (AR), expected (HE) and observed (HO) heterozygosity and P-value for deviation from expected Hardy-Weinberg proportions (PHW; significant deviations indicated in bold). Basin/Population Str60 SSOSL311 Str15 SSOSL438 Ssa197 Ssa85 SSOSL417 All loci Akmena-Danė Bonalė 2003
A 2 9 4 5 5 3 6 4.86 Ar 2 8.542 3.993 4.4 4.568 2.996 5.733 4.605 He 0.442 0.908 0.742 0.558 0.616 0.616 0.811 0.670 Ho 0.400 0.889 0.700 0.500 0.500 0.500 0.600 0.584 PHW 1.0000 0.4180 0.7340 0.8044 0.3905 0.3198 0.1694 0.7240
Bonalė 2007 A 2 11 5 6 7 4 9 6.29 Ar 1.999 8.184 4.344 3.631 4.819 3.238 5.83 4.578 He 0.422 0.899 0.726 0.474 0.626 0.574 0.816 0.648 Ho 0.448 1.000 0.621 0.586 0.759 0.655 1.000 0.724 PHW 1.0000 0.5276 0.2742 0.8535 0.4349 0.8444 0.4943 0.9093
Eketė A 2 7 4 3 6 3 5 4.29 Ar 2 6.667 3.538 2.639 5.503 2.667 4.89 3.986 He 0.526 0.863 0.431 0.301 0.754 0.518 0.808 0.600 Ho 0.800 0.778 0.417 0.333 0.667 0.667 0.833 0.642 PHW 0.1998 0.0101 0.5606 1.0000 0.0931 0.2914 0.2631 0.0533

47
Str60 SSOSL311 Str15 SSOSL438 Ssa197 Ssa85 SSOSL417 All loci
Upper reaches A 3 12 5 3 7 5 8 6.14 Ar 2.859 7.206 4.102 2.266 5.834 4.377 6.246 4.699 He 0.581 0.862 0.723 0.484 0.821 0.677 0.844 0.713 Ho 0.533 0.867 0.929 0.500 0.833 0.700 0.852 0.745 PHW 0.0191 0.9834 0.0980 0.5198 0.2121 0.6752 0.7325 0.1871
Bartuva Guntinas
A 2 6 4 3 3 4 3 3.57 Ar 2 5.778 3.993 2.996 2.968 4 3 3.534 He 0.505 0.837 0.699 0.647 0.611 0.642 0.626 0.652 Ho 0.800 1.000 0.778 0.300 0.800 0.625 0.700 0.715 PHW 0.1731 0.9568 0.7789 0.0524 0.3307 0.1497 0.1998 0.1565
Pragulba 2004 A 2 9 4 4 5 4 5 4.71 Ar 2 6.435 3.627 3.219 4.151 3.842 3.777 3.864 He 0.508 0.838 0.668 0.422 0.645 0.700 0.639 0.631 Ho 0.429 0.947 0.800 0.350 0.650 0.810 0.714 0.671 PHW 0.6605 0.3162 0.1292 0.4116 0.1673 0.3071 0.7219 0.3390
Pragulba 2007 A 2 13 4 4 5 4 10 6.00 Ar 2 8.038 3.806 3.773 3.657 3.997 6.07 4.477 He 0.508 0.873 0.716 0.676 0.479 0.766 0.794 0.688 Ho 0.679 0.793 0.724 0.536 0.448 0.636 0.759 0.654 PHW 0.1268 0.1182 0.9726 0.2668 0.0966 0.6059 0.0818 0.0835

48
Str60 SSOSL311 Str15 SSOSL438 Ssa197 Ssa85 SSOSL417 All loci
Nemunas/Dubysa Luknė
A 3 10 5 2 7 5 7 5.57 Ar 2.727 7.606 4.328 2 5.644 4.38 6.328 4.716 He 0.569 0.867 0.738 0.508 0.790 0.726 0.845 0.720 Ho 0.647 1.000 0.706 0.647 0.765 0.813 1.000 0.797 PHW 0.2928 0.9698 0.6041 0.3428 0.3188 0.0163 0.9939 0.3016
Dratvinys 2004 A 3 12 5 4 6 4 9 6.14 Ar 2.872 7.725 4.814 3.396 5.037 3.935 7.467 5.035 He 0.589 0.870 0.784 0.612 0.773 0.733 0.881 0.749 Ho 0.606 0.879 0.774 0.758 0.719 0.667 0.935 0.763 PHW 0.1049 0.0030 0.0154 0.5528 0.3404 0.4377 0.3421 0.0046
Dratvinys 2007 A 3 10 4 5 6 3 7 5.43 Ar 2.465 6.979 3.76 3.222 4.798 2.968 6.184 4.339 He 0.505 0.869 0.632 0.437 0.753 0.611 0.831 0.663 Ho 0.633 0.931 0.724 0.500 0.767 0.600 0.833 0.713 PHW 0.2744 0.0349 0.6471 0.8004 0.0014 0.5732 0.5301 0.0246
Lapišė 2006 A 3 15 5 4 6 4 8 6.43 Ar 2.951 8.292 4.663 3.335 4.803 3.916 5.734 4.813 He 0.595 0.879 0.776 0.606 0.700 0.725 0.810 0.727 Ho 0.567 0.833 0.767 0.667 0.633 0.633 0.833 0.705 PHW 0.5267 0.0433 0.0985 0.6732 0.3058 0.7821 0.9006 0.3099

49
Str60 SSOSL311 Str15 SSOSL438 Ssa197 Ssa85 SSOSL417 All loci
Lapišė 2007 A 4 12 4 4 7 5 8 6.29 Ar 3.241 8.141 3.967 3.1 5.782 4.336 5.787 4.908 He 0.609 0.879 0.751 0.524 0.798 0.751 0.795 0.730 Ho 0.484 0.786 0.742 0.484 0.839 0.742 0.871 0.707 PHW 0.3040 0.2602 0.7209 0.7731 0.9906 0.6226 0.0555 0.5271
Nemunas/Jūra Upynikė 2004
A 3 12 4 3 7 5 7 5.86 Ar 2.924 7.943 3.881 2.293 4.801 4.314 5.832 4.570 He 0.539 0.880 0.713 0.419 0.680 0.703 0.817 0.679 Ho 0.444 0.960 0.741 0.333 0.741 0.704 0.852 0.682 PHW 0.4432 0.4349 0.9697 0.4981 0.2911 0.6590 0.7662 0.8556
Upynikė 2006 A 3 11 4 2 6 5 9 5.71 Ar 2.959 7.92 3.663 2 4.223 3.938 5.891 4.371 He 0.594 0.883 0.671 0.449 0.544 0.642 0.687 0.639 Ho 0.615 0.923 0.846 0.577 0.680 0.692 0.615 0.707 PHW 1.0000 0.1319 0.2128 0.1956 0.8953 0.4395 0.0391 0.1744
Ežeruona A 3 11 4 4 6 5 8 5.86 Ar 2.727 8.675 3.449 3.655 4.979 4.332 7.145 4.995 He 0.563 0.911 0.623 0.576 0.604 0.749 0.874 0.700 Ho 0.412 0.938 0.625 0.706 0.647 0.882 0.923 0.733 PHW 0.5335 0.9822 0.3498 0.9265 0.5056 0.1539 0.9758 0.8461

50
Str60 SSOSL311 Str15 SSOSL438 Ssa197 Ssa85 SSOSL417 All loci
Šunija A 3 9 4 3 7 4 8 5.43 Ar 2.893 7.407 3.275 2.952 5.782 3.45 5.334 4.442 He 0.586 0.883 0.658 0.540 0.830 0.676 0.794 0.710 Ho 0.593 0.867 0.571 0.633 0.900 0.733 0.852 0.736 PHW 0.1326 0.1694 0.4904 0.6149 0.7313 0.0282 0.0640 0.0563
Nemunas/Minija Blendžiava 2004
A 2 10 4 2 5 4 7 4.86 Ar 1.998 7.08 3.417 2 4.579 3.938 5.509 4.074 He 0.409 0.850 0.467 0.456 0.771 0.742 0.808 0.643 Ho 0.481 0.875 0.536 0.536 1.000 0.679 0.679 0.684 PHW 0.6298 0.2358 1.0000 0.4249 0.1542 0.0107 0.0128 0.0190
Blendžiava 2005 A 3 8 4 2 6 4 8 5.00 Ar 2.244 5.982 3.288 2 4.789 3.772 5.91 3.997 He 0.332 0.818 0.535 0.503 0.730 0.666 0.764 0.621 Ho 0.400 0.933 0.621 0.700 0.690 0.733 0.800 0.697 PHW 0.6336 0.5332 0.5998 0.0611 0.8457 0.9757 0.4051 0.6853
Mišupis 2005 A 3 10 3 3 7 5 7 5.43 Ar 2.767 7.492 2.867 2.35 5.877 3.748 5.404 4.358 He 0.570 0.873 0.525 0.249 0.795 0.626 0.763 0.629 Ho 0.444 0.786 0.621 0.207 0.741 0.586 0.741 0.589 PHW 0.4156 0.3280 0.7288 0.0410 0.4246 0.3483 0.1981 0.2038

51
Str60 SSOSL311 Str15 SSOSL438 Ssa197 Ssa85 SSOSL417 All loci
Mišupis 2007 A 3 8 3 3 6 5 7 5.00 Ar 2.421 6.259 2.976 2.337 4.9 4.389 5.372 4.093 He 0.522 0.832 0.640 0.292 0.667 0.733 0.760 0.635 Ho 0.421 0.950 0.762 0.333 0.714 0.714 0.762 0.665 PHW 0.6305 0.4157 0.4616 1.0000 0.1315 0.6582 0.2377 0.6070
Šiūšis A 4 9 2 3 7 5 7 5.29 Ar 3.324 7.678 1.998 2.465 6.103 3.632 5.72 4.417 He 0.619 0.891 0.399 0.495 0.837 0.628 0.795 0.666 Ho 0.533 0.897 0.393 0.467 0.900 0.467 0.833 0.641 PHW 0.7448 0.7194 1.0000 0.7241 0.3316 0.0344 0.4512 0.5716
Nemunas/Šyša Šustis
A 3 14 4 4 7 5 6 6.143 Ar 2.832 7.912 3.215 3.411 5.774 3.597 5.071 4.545 He 0.548 0.873 0.535 0.580 0.813 0.690 0.775 0.688 Ho 0.622 0.939 0.514 0.541 0.853 0.649 0.676 0.685 PHW 0.7485 0.3938 0.935 0.2199 0.9063 0.9834 0.0404 0.5860

52
The Wilcoxon’s sign-rank test detected significant excess of heterozygosity in all populations of the Nemunas basin, in the Guntinas and Pragulba-2007 populations of the Bartuva basin, and also in the enhanced population of Akmena-Danė, i.e. the HE values were significantly larger than the heterozygosity expected at mutation drift equilibrium (p<0.05), indicating that many Lithuanian sea trout populations have recently experienced severe reduction in their effective population size. 5.1.2.3 Genetic diversity among populations
For comparison of genetic diversity between different river basins, populations from the same river basin were grouped together. We compared allelic richness (Ar) and expected as well as observed heterozygosities (HE and HO). At first we compared three major river basins: Akmena-Danė, Bartuva and Nemunas and found no significant differences neither in average allelic richness nor in average heterozygosities (p>0.05). Further we compared the level of genetic diversity between major tributaries of the Nemunas river: Dubysa, Jūra, Minija and Šyša. Here we detected that populations from Dubysa river sub-basin exhibited higher level of average allelic richness as well as average heterozygosity than populations from Minija river sub-basin (p<0.05).
At the same time the averaged diversity indices were compared with smolt production of analyzed rivers (Table 2, Kesminas, 2012). It became clear that even if analyzed rivers differ strongly in their smolt production, the level of genetic diversity in these rivers is generally the same (Fig. 3). Comparison of wild and enhanced populations as well as comparison of temporal samples revealed that there were no significant differences in genetic diversity between the wild and enhanced populations (p>0.05). Similarly, no significant differences were observed in average allelic richness and gene diversity between temporal samples of the same population (p>0.05).

53
(a)
(b) Figure 3: Comparison of the average diversity indices and smolt production of analyzed river basins (a) and sub-basins of Nemunas (b) 5.1.2.4 Allele frequencies Range of allele lengths in each locus are given in the Table 7. Allele frequencies of each population at each locus are presented in Table 8.

54
Table 7: Range of allele lengths in each locus
Locus Range of allele lengths (bps) Str60 95 – 105 SSOSL311 121 – 169 Str15 214 – 230 SSOSL438 95 – 113 Ssa197 126 – 162 Ssa85 106 – 120 SSOSL417 171 – 197
Populations of the river Bartuva basin shared almost the same
number of alleles over all loci with populations of river Akmena-Danė basin and with populations of river Nemunas basin (42 alleles (70%) and 45 alleles (70%), respectively). Whereas a total of 14 and 4 private alleles were observed in the Akmena-Danė and Bartuva populations, respectively and 2 and 18 private alleles were found in the Bartuva and Nemunas populations, respectively. The proportion of shared alleles between populations of Akmena-Danė basin and Nemunas river basin was 76%, but considering only wild sea trout populations, it became lower (72%) and comparable with other values of between basin comparisons. Within the Nemunas river the highest proportion of alleles over all loci shared populations from Dubysa and Jūra (82%), whereas the most divergent population that shared the least proportion of alleles with other populations was population from Šyša river sub-basin: the proportion of shared alleles was 73%, 74% and 76% with populations of Dubysa, Minija and Jūra, respectively. Considering all populations separately, a total of 6 private alleles were found in 5 populations and most of them (5 out of 6) were observed in populations that belong to the Nemunas basin: Ežeruona population and Šunija population of Jūra river sub-basin (NJE and NJS) had 2 and 1 private alleles, respectively and Dratvinys population (NDD-07) and Lapišė population (NDLa-06) of Dubysa

55
river sub-basin had one private allele each. Only a single private allele was found in the Akmena-Danė basin (ADB-07) while there were no private alleles in the Bartuva basin. The frequency of private alleles in the populations of Nemunas basin did not exceed 0.05, whereas the frequency of the private allele in Akmena-Danė basin was 0.07. There was at least one very rear allele in each locus across all populations. Two loci exhibited high proportion of rare alleles: in the locus SSOSL438, three out of seven loci (43% of loci) were very rare (frequency ranged from 0.02 to 0.05); similarly, in the locus SSOSL417, four out of thirteen loci (31% of loci) were very rare (frequency ranged from 0.02 to 0.07). The majority of rare alleles were attributable to wild sea trout populations, however five very rare alleles were found only in enhanced populations. We also found several very frequent alleles that frequency in some populations exceeded 0.70. For example, the frequency of allele 134 of locus Ssa197 was 0.71 in BP-07 population and the frequency of allele 99 of locus Str60 was 0.80 in NMB-05 population. Similarly, there were several alleles that were very frequent in a particular river basin: the average frequency of allele 103 of locus SSOSL417 was 0.71 in populations of Akmena-Danė basin and in wild populations of Minija river sub-basin. Also the average frequency of allele 114 of locus Ssa85 and allele 222 of locus Str15 was 0.57 and 0.63 in populations of Akmena-Danė river basin and populations of Minija river sub-basin, respectively. We found five alleles that are characteristic only for populations of Nemunas river basin but were found in enhanced populations of Akmena-Danė basin.

56
Table 8: Allele frequencies of each Lithuanian sea trout population at each locus Locus Populations Ssa197 ADB03 ADB07 ADE04 ADF05 BG04 BP04 BP07 NDL04 NDD04 NDD07 NDLa06
126 1,72 4,17 130 20,00 13,79 45,83 28,33 50,00 15,00 13,79 5,88 20,31 10,00 11,67 134 60,00 58,62 12,50 18,33 40,00 55,00 70,69 20,59 29,69 33,33 48,33 138 10,00 12,07 21,67 7,50 35,29 7,81 6,67 3,33 142 16,67 3,33 1,72 5,88 31,25 33,33 23,33 146 13,33 20,00 8,62 23,53 4,69 1,67 6,67 150 3,45 5,00 10,00 5,17 5,88 154 5,00 6,90 10,00 2,50 2,94 6,25 15,00 6,67 158 3,45 12,50 162 5,00 8,33
Ssa85 ADB03 ADB07 ADE04 ADF05 BG04 BP04 BP07 NDL04 NDD04 NDD07 NDLa06 106 1,72 10,00 12,50 9,52 22,73 9,38 15,15 13,33 112 30,00 18,97 4,17 25,00 56,25 16,67 18,18 43,75 21,21 40,00 21,67 114 55,00 60,34 62,50 50,00 25,00 42,86 22,73 21,88 37,88 10,00 40,00 116 15,00 18,97 33,33 8,33 6,25 30,95 36,36 21,88 25,76 50,00 25,00 118 6,67 3,13 120

57
Str15 ADB03 ADB07 ADE04 ADF05 BG04 BP04 BP07 NDL04 NDD04 NDD07 NDLa06
214 6,90 220 15,00 5,17 12,50 8,93 22,22 5,00 8,62 8,82 17,74 15,52 31,67 222 30,00 39,66 75,00 39,29 11,11 17,50 22,41 29,41 33,87 55,17 26,67 224 40,00 29,31 8,33 28,57 16,67 47,50 32,76 38,24 16,13 20,69 18,33 226 15,00 18,97 4,17 21,43 50,00 30,00 36,21 20,59 20,97 8,62 16,67 228 1,79 2,94 11,29 6,67 230
SSOSL438 ADB03 ADB07 ADE04 ADF05 BG04 BP04 BP07 NDL04 NDD04 NDD07 NDLa06 95 5,00 5,17
103 65,00 70,69 83,33 63,33 40,00 12,50 30,36 55,88 51,52 73,33 50,00 105 5,00 1,72 4,17 1,67 2,50 8,93 9,09 6,67 5,00 107 5,00 3,45 15,00 10,00 14,29 4,55 1,67 6,67 109 1,72 111 20,00 17,24 12,50 35,00 45,00 75,00 46,43 44,12 34,85 16,67 38,33 113 1,67
Str60 ADB03 ADB07 ADE04 ADF05 BG04 BP04 BP07 NDL04 NDD04 NDD07 NDLa06 95 70,00 70,69 50,00 36,67 40,00 54,76 51,79 50,00 37,88 61,67 30,00 97 99 30,00 29,31 50,00 53,33 60,00 45,24 48,21 44,12 51,52 35,00 55,00
105 10,00 5,88 10,61 3,33 15,00

58
SSOSL311 ADB03 ADB07 ADE04 ADF05 BG04 BP04 BP07 NDL04 NDD04 NDD07 NDLa06
121 1,67 1,52 13,79 6,67 125 1,67 22,22 13,16 25,86 3,33 129 16,67 13,79 5,56 26,32 12,07 6,67 1,52 1,72 1,67 131 11,11 15,52 15,00 21,05 1,72 10,00 9,09 17,24 8,33 133 5,56 10,34 22,22 1,67 3,45 12,12 18,97 1,67 135 16,67 8,62 8,33 27,78 21,05 18,97 26,67 6,67 137 5,56 3,45 5,56 15,00 1,72 16,67 139 11,11 15,52 22,22 1,67 16,67 3,45 3,45 1,67 141 22,22 6,90 22,22 21,67 2,63 3,45 20,00 27,27 13,79 18,33 143 5,56 5,56 1,72 1,52 145 6,67 1,52 1,72 1,67 147 5,56 13,64 1,72 5,00 149 2,63 1,67 151 3,45 7,58 17,24 3,33 153 13,79 16,67 21,67 2,63 5,17 3,33 9,09 13,33 155 6,90 5,56 3,33 5,17 6,67 6,06 10,34 3,33 157 1,72 1,67 3,33 1,67 159 7,89 8,62 3,33 9,09 25,00 161 5,56 22,22 2,63 8,62 169
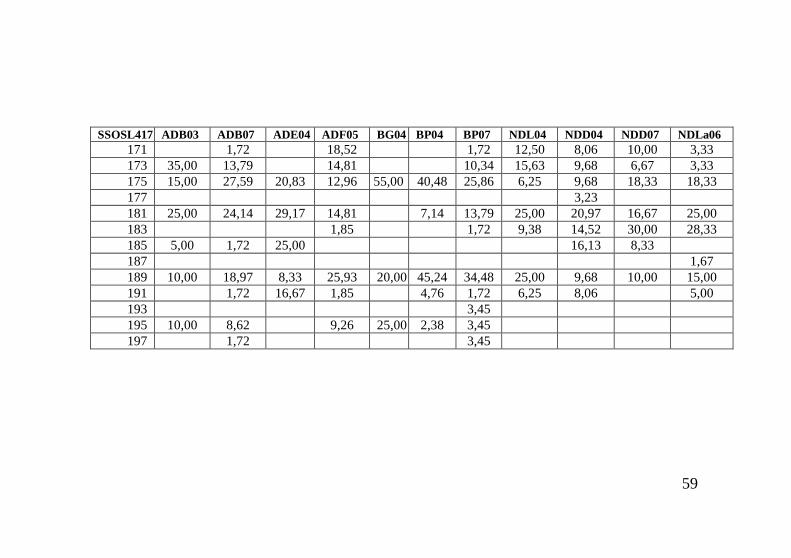
59
SSOSL417 ADB03 ADB07 ADE04 ADF05 BG04 BP04 BP07 NDL04 NDD04 NDD07 NDLa06
171 1,72 18,52 1,72 12,50 8,06 10,00 3,33 173 35,00 13,79 14,81 10,34 15,63 9,68 6,67 3,33 175 15,00 27,59 20,83 12,96 55,00 40,48 25,86 6,25 9,68 18,33 18,33 177 3,23 181 25,00 24,14 29,17 14,81 7,14 13,79 25,00 20,97 16,67 25,00 183 1,85 1,72 9,38 14,52 30,00 28,33 185 5,00 1,72 25,00 16,13 8,33 187 1,67 189 10,00 18,97 8,33 25,93 20,00 45,24 34,48 25,00 9,68 10,00 15,00 191 1,72 16,67 1,85 4,76 1,72 6,25 8,06 5,00 193 3,45 195 10,00 8,62 9,26 25,00 2,38 3,45 197 1,72 3,45

60
Table 8 (continued) Locus Populations Ssa197 NDLa07 NJU04 NJU06 NJE NJS NMB04 NMB05 NMM05 NMM07 NMTS05 NSS04
126 130 9,68 1,85 10,00 11,76 15,00 23,21 43,10 16,67 7,14 5,00 7,35 134 29,03 51,85 66,00 61,76 21,67 32,14 25,86 37,04 54,76 16,67 26,47 138 6,45 14,81 2,00 5,88 20,00 5,36 12,07 18,52 2,38 26,67 23,53 142 30,65 1,85 2,00 8,82 23,33 1,72 5,56 11,90 6,67 146 12,90 7,41 8,00 5,56 16,67 8,82 150 3,70 5,88 3,33 25,00 6,90 9,26 14,29 10,00 5,88 154 6,45 18,52 12,00 5,88 3,33 14,29 10,34 7,41 9,52 18,33 4,41 158 4,84 13,33 23,53 162
Ssa85 NDLa07 NJU04 NJU06 NJE NJS NMB04 NMB05 NMM05 NMM07 NMTS05 NSS04 106 3,23 3,70 1,92 1,72 4,76 1,67 2,70 112 32,26 46,30 15,38 32,35 20,00 23,21 23,33 32,76 23,81 51,67 32,43 114 24,19 24,07 53,85 32,35 40,00 33,93 50,00 51,72 40,48 31,67 39,19 116 29,03 16,67 23,08 23,53 36,67 28,57 18,33 6,90 23,81 11,67 24,32 118 11,29 9,26 5,77 8,82 3,33 14,29 8,33 6,90 7,14 3,33 1,35

61
Str15 NDLa07 NJU04 NJU06 NJE NJS NMB04 NMB05 NMM05 NMM07 NMTS05 NSS04
214 220 27,42 12,96 5,77 12,50 5,36 3,45 2,70 222 32,26 35,19 48,08 53,13 46,43 71,43 63,79 63,79 40,48 73,21 63,51 224 20,97 37,04 21,15 3,13 30,36 14,29 24,14 25,86 42,86 24,32 226 19,35 14,81 25,00 31,25 21,43 8,93 8,62 10,34 16,67 26,79 9,46 228 230 1,79
SSOSL438 NDLa07 NJU04 NJU06 NJE NJS NMB04 NMB05 NMM05 NMM07 NMTS05 NSS04 95 5,41
103 64,52 72,22 67,31 61,76 63,33 66,07 45,00 86,21 83,33 33,33 58,11 105 9,68 1,85 11,76 16,67 3,33 8,11 107 1,61 5,88 3,45 109 2,38 111 24,19 25,93 32,69 20,59 20,00 33,93 55,00 10,34 14,29 63,33 28,38 113
Str60 NDLa07 NJU04 NJU06 NJE NJS NMB04 NMB05 NMM05 NMM07 NMTS05 NSS04 95 45,16 24,07 28,85 52,94 35,19 27,78 18,33 40,74 39,47 38,33 59,46 97 3,23 3,33 99 43,55 62,96 55,77 41,18 53,70 72,22 80,00 51,85 57,89 48,33 31,08
105 8,06 12,96 15,38 5,88 11,11 1,67 7,41 2,63 10,00 9,46

62
SSOSL311 NDLa07 NJU04 NJU06 NJE NJS NMB04 NMB05 NMM05 NMM07 NMTS05 NSS04
121 3,57 6,00 9,38 16,67 20,83 28,33 17,86 27,50 10,34 1,52 125 129 5,36 2,00 15,38 13,33 25,00 23,33 16,07 20,00 15,52 1,52 131 3,57 10,00 5,77 15,63 3,33 8,33 1,67 7,14 1,52 133 8,93 4,00 9,62 12,50 6,67 20,83 8,33 10,71 10,00 15,52 24,24 135 8,00 23,08 9,38 16,67 2,08 5,00 5,36 7,50 17,24 7,58 137 1,79 2,50 139 3,57 12,00 5,77 15,63 6,25 10,00 3,57 6,90 4,55 141 23,21 24,00 1,92 15,63 10,00 4,17 20,00 23,21 22,50 10,34 18,18 143 5,00 5,17 3,03 145 21,43 7,14 4,55 147 5,36 4,17 149 15,00 151 10,71 13,46 3,13 1,52 153 5,36 2,00 6,25 13,33 4,17 3,33 8,62 4,55 155 7,14 18,00 13,46 6,25 4,17 7,14 2,50 15,15 157 2,00 3,85 3,13 1,79 7,50 1,52 159 10,00 3,85 10,61 161 2,00 3,85 10,34

63
SSOSL417 NDLa07 NJU04 NJU06 NJE NJS NMB04 NMB05 NMM05 NMM07 NMTS05 NSS04
171 3,23 27,78 5,77 1,85 3,57 13,33 7,41 4,76 5,41 173 1,61 3,85 7,69 14,81 5,56 4,76 10,00 5,41 175 35,48 9,26 7,69 19,23 29,63 12,50 6,67 9,26 16,67 13,33 31,08 177 1,85 181 20,97 20,37 5,77 19,23 25,93 21,43 13,33 37,04 23,81 23,33 29,73 183 14,52 9,26 13,46 7,69 1,85 8,93 13,33 9,26 5,00 9,46 185 4,84 5,77 7,69 3,33 187 189 14,52 24,07 53,85 23,08 20,37 28,57 43,33 29,63 40,48 35,00 18,92 191 4,84 5,56 1,92 11,54 3,70 23,21 3,33 1,85 2,38 10,00 193 7,14 195 3,70 1,92 3,85 1,79 3,33 3,33 197

64
5.1.3 Genetic differentiation and relationships among sea trout populations
Significant differences in allele frequencies were detected between 225 out of 231 population/sample pairs. One pair of populations with homogenous allele frequencies belonged to the Dubysa river sub-basin (NDD-04 and NDLa-06) and two pairs involved populations from two different basins, Akmena-Danė and Nemunas: ADF and NDL, and ADB-04 and NJE. Three other pairs with homogenous allele frequencies represented temporal samples of the same population: ADB-04 and ADB-07, BP-04 and BP-07, and NMM-05 and NMM-07. Interestingly, all other temporal samples (NDD-04/07, NDLa-06/07, NJU-04/06, NMB-04/05) showed statistically highly significant differences in allele frequency distribution. Differences in NDD and NJU temporal samples mostly depended on allele frequency shifts in locus Ssa85 – the difference of allele 114 and allele 116 frequencies between temporal samples of NDD was 28% and 24%, respectively; similarly the difference of allele 112 and allele 114 frequencies between temporal samples of NDD was 31% and 30%, respectively. The largest allele frequency shifts in NDLa and NMB temporal samples were observed in locus SSOSL311 and SSOSL438, respectively (Table 8).
The level of differentiation between the major river basins was significantly higher than between populations from the same river basin (p<0.001, Mann-Whitney U-test). The most distinguished were the populations from Bartuva river basin which displayed average FST values of 0.111 and 0.103 in pair-wise comparisons with Akmena-Danė and Nemunas populations, respectively, whereas the average FST between the Akmena-Danė and Nemunas populations was 0.063 (Table 9). The level of population differentiation within the three river basins was similar: average FST ranged from 0.049 (Akmena-Danė) to 0.056 (Nemunas). Within the Nemunas basin, the average differentiation between tributaries of Minija, Jūra and Dubysa ranged from 0.046 to 0.069 (Table 9).

65
Table 9: Pairwise FST values (above diagonal) and DA distances (below diagonal) between Lithuanian sea trout populations
ADB-04 ADB-07 ADE ADF BG BP-04 BP-07 NDL NDD-04 NDD-07 NDLa-06 ADB-04 -0.010 0.083 0.037 0.092 0.093 0.050 0.037 0.042 0.069 0.049 ADB-07 0.065 0.074 0.049 0.116 0.102 0.068 0.068 0.061 0.076 0.066 ADE 0.199 0.168 0.066 0.181 0.208 0.159 0.123 0.054 0.087 0.092 ADF 0.148 0.114 0.220 0.084 0.098 0.079 0.017 0.026 0.084 0.042 BG 0.203 0.216 0.345 0.245 0.085 0.049 0.093 0.089 0.150 0.084 BP-04 0.167 0.156 0.326 0.178 0.155 0.019 0.079 0.100 0.162 0.085 BP-07 0.144 0.132 0.265 0.160 0.123 0.071 0.059 0.063 0.107 0.049 NDL 0.160 0.147 0.285 0.061 0.273 0.148 0.138 0.036 0.066 0.046 NDD-04 0.188 0.169 0.179 0.123 0.311 0.217 0.172 0.138 0.040 0.005 NDD-07 0.181 0.163 0.205 0.175 0.337 0.271 0.225 0.177 0.090 0.059 NDLa-06 0.193 0.166 0.226 0.119 0.265 0.166 0.140 0.117 0.048 0.117
NDLa-07 NJU-04 NJU-06 NJE NJS NMB-04 NMB-05 NMM-05 NMM-07 NMTS NSS NDLa-07 0.041 0.073 0.022 0.028 0.068 0.099 0.053 0.048 0.082 0.037 NJU-04 0.117 0.046 0.034 0.054 0.058 0.077 0.037 0.030 0.086 0.059 NJU-06 0.136 0.084 0.032 0.061 0.056 0.067 0.052 0.035 0.088 0.075 NJE 0.102 0.106 0.108 0.036 0.042 0.086 0.031 0.033 0.059 0.030 NJS 0.137 0.159 0.167 0.125 0.045 0.067 0.035 0.030 0.068 0.031 NMB-04 0.155 0.109 0.128 0.107 0.140 0.027 0.034 0.041 0.058 0.063 NMB-05 0.158 0.105 0.116 0.127 0.127 0.047 0.064 0.071 0.063 0.095 NMM-05 0.115 0.080 0.105 0.104 0.109 0.082 0.077 0.013 0.080 0.036 NMM-07 0.157 0.115 0.125 0.134 0.106 0.099 0.100 0.060 0.106 0.060 NMTS 0.172 0.149 0.148 0.127 0.127 0.126 0.121 0.120 0.157 0.055 NSS 0.107 0.097 0.126 0.123 0.110 0.146 0.151 0.091 0.143 0.134

66
FST values between temporal replicates of the populations were significantly lower than between spatial samples within years (P<0.001, Mann-Whitney U-test).
Pair-wise genetic distances (DA) were calculated between all populations pairs (Table 9). Estimation of the genetic distance between three major river basins showed that populations of Bartuva river basin were mostly genetically distant – average DA values between Bartuva river and Akmena-Danė river basins as well as between Bartuva and Nemunas basins were 0.21 and 0.22, respectively and were significantly higher than between Akmena-Danė and Nemunas river basins (DA = 0.16). Within Nemunas river basin, the largest genetic distance was between Dubysa and Minija river sub-basins and the smallest – between Jūra and Šyša river sub-basins (0.16 and 0.11, respectively).
Genetic distances between the major river basins was significantly higher than between populations from the same basin (p<0.05, Mann-Whitney U-test). Similarly, genetic distances between the different river sub-basins within Nemunas river basin was significantly higher than between populations from the same river sub-basin (p<0.05, Mann-Whitney U-test).
The Mantel test for isolation by distance over all populations revealed non-significant (p>0.05) association between the geographical and genetic distances. The same was true in more regional scale, within the Nemunas basin (p>0.05). However, when the enhanced populations were excluded from the analysis, association between geographical and genetic distance became highly significant both for all studied populations and for populations from the Nemunas basin (P<0.01).
The Neighbor-joining dendrogram of the Lithuanian sea trout populations based on DA genetic distances illustrates the grouping of populations into two moderately supported (bootstrap value 57) major clusters (fig. 4).

67
Figure 4: NJ dendrogram of the Lithuanian sea trout populations based on DA distances.

68
One cluster consisted mainly of the populations from the Nemunas basin (with the exception of ADF and ADE-04 populations from the Akmena-Danė basin) while the other consisted of two well-supported subclusters that corresponded to the river basins of Akmena-Danė and Bartuva, respectively (Figure 4). Within the Nemunas cluster, the populations from Dubysa and Minija rivers formed two well supported sub-clusters (with the exception of NDL and NMTS) while the Jūra populations did not cluster together (Figure 4). 5.1.4 Hierarchical analysis of genetic structure
Analysis of molecular variance (AMOVA) was used to partition genetic variation into hierarchical levels. For the first analysis, the populations were grouped according to three major river basins (Nemunas, Akmena-Danė and Bartuva) that formed the highest level of hierarchy. The second level consisted of populations within basins and the third level consisted of individuals within the populations. The AMOVA analysis revealed that most of total variation of microsatellite loci (91.63%) was due to variation within the populations, whereas 3.04% was distributed among river basins and 5.33% was distributed among populations within river basins (Table 6). The percentage of variation due to differences between population groups increased to 4.66% after excluding enhanced populations (Table 10). For the second analysis, the highest level of hierarchy consisted of four tributaries of the Nemunas (Minija, Jūra, Dubysa and Šyša), second level consisted of populations within tributaries and the third level consisted of individuals within the populations. The AMOVA analysis revealed that 93.86% of total genetic diversity within the Nemunas basin was due to variation within the populations; 4.34% was distributed among populations, and only 1.80% was explained by differences among the tributaries.

69
Table 10: Hierarchical gene diversity analysis of Lithuanian sea trout populations Population groups for the highest level of hierarchy
Percentage of variation Among groups
Among populations within groups
Within populations
Main river basins (Nemunas, Akmena-Dane, Bartuva)
3.04 5.33 91.63
Major tributaries within the Nemunas basin (Dubysa, Jura, Minija, Sysa)
1.80 4.34 93.86
Major tributaries within the Nemunas basin (Dubysa, Jura, Minija, Sysa) with hatchery stocks excluded
2.32 3.99 93.68
Main river basins (Nemunas, Akmena-Dane, Bartuva) with hatchery stocks excluded
4.66 5.06 90.28
Populations with temporal replicates (Bonalė, Pragulba, Dratvinys, Lapišė, Upinikė, Blendžiava, Mišupis)
5.40 2.01 92.59

70
After excluding the enhanced stocks from the analysis, 3.99% of the total genetic diversity was distributed among populations, and 2.32% was distributed among the tributaries (Table 10). For the third analysis, only populations with temporal replicates were included in order to assess the relative magnitude of temporal versus spatial variation. AMOVA analysis revealed that the temporal variation (2.01% of the total variation) was almost three times smaller than the spatial variation (5.40%) but still significant (P<0.001), indicating that significant differences of allele frequencies existed among the temporal replicates within populations (Table10). 5.1.5 Contemporary gene flow Based on the results of BAYESASS analysis, the most isolated populations (with the proportion of non-migrants 0.90 or higher) were Bonalė (ADB) and Eketė (ADE) from Akmena-Danė river basin, Pragulba from Bartuva river basin (BP), and Blendžiava (NMB), Šiūšis (NMTS) and Šustis (NSS) from Nemunas river basin, whereas the least isolated populations (with the proportion of non-migrants 0.80 or less) were enhanced population of Akmena-Danė river basin (ADF), Guntinas population from Bartuva river basin (BG), and Luknė (NDL), Ežeruona (NJE), Šunija (NJS) and Mišupis (NMM) from Nemunas river basin (Table11). The recent migration rates between populations belonging to different river basins (Akmena-Danė, Bartuva, Nemunas) were quite low: typically 0.00 or 0.01, rarely 0.02 or 0.03 (Table 11). The highest between river basin migration rates were observed from Bonalė population of Akmena-Danė river basin (ADB) to Ežeruona population of Jūra river sub-basin (NJE), from enhanced population of Akmena-Danė river (ADF) to Luknė population of Dubysa river sub-basin (NDL) and from Mišupis population of Minija river sub-basin (NMM) to enhanced population of Akmena-Danė river basin (ADF) (m = 0.05, 0.04 and 0.04, respectively).

71
Table 11: Bayesian assessment of migration proportions by populations (BAYESASS, Wilson and Ranalla 2003). Bolded terms along the diagonal represent proportion of nonmigrants within a population; values in rows represent migrants received from other sites; values in columns represent migrants donated to other populations.
ADB ADE ADF BG BP NDL NDD NDLa NJU NJE NJS NMB NMM NMTS NSS ADB 0.98 0.00 0.00 0.00 0.01 0.00 0.00 0.00 0.00 0.00 0.00 0.00 0.00 0.00 0.00 ADE 0.01 0.94 0.00 0.00 0.00 0.00 0.01 0.00 0.00 0.00 0.00 0.00 0.00 0.00 0.01 ADF 0.04 0.01 0.76 0.00 0.01 0.01 0.01 0.02 0.03 0.00 0.01 0.01 0.04 0.03 0.01 BG 0.02 0.01 0.02 0.74 0.08 0.01 0.01 0.01 0.01 0.01 0.01 0.01 0.02 0.01 0.01 BP 0.00 0.00 0.00 0.00 0.98 0.00 0.00 0.00 0.00 0.00 0.00 0.00 0.00 0.00 0.00 NDL 0.02 0.01 0.04 0.00 0.03 0.69 0.02 0.03 0.04 0.00 0.01 0.02 0.02 0.03 0.02 NDD 0.02 0.00 0.00 0.00 0.00 0.00 0.84 0.10 0.01 0.00 0.00 0.01 0.00 0.00 0.00 NDLa 0.00 0.00 0.00 0.00 0.00 0.00 0.08 0.82 0.01 0.00 0.01 0.00 0.04 0.01 0.01 NJU 0.00 0.00 0.00 0.00 0.00 0.00 0.00 0.00 0.88 0.00 0.00 0.05 0.03 0.00 0.00 NJE 0.05 0.01 0.01 0.01 0.01 0.01 0.03 0.02 0.06 0.68 0.01 0.05 0.02 0.02 0.01 NJS 0.02 0.01 0.01 0.00 0.01 0.00 0.01 0.01 0.01 0.00 0.78 0.08 0.01 0.01 0.05 NMB 0.00 0.00 0.01 0.00 0.01 0.00 0.00 0.00 0.00 0.00 0.00 0.99 0.00 0.00 0.00 NMM 0.00 0.00 0.00 0.00 0.00 0.00 0.00 0.00 0.01 0.00 0.00 0.18 0.77 0.01 0.01 NMTS 0.00 0.00 0.00 0.00 0.00 0.00 0.00 0.00 0.00 0.00 0.00 0.00 0.00 0.98 0.00 NSS 0.02 0.00 0.01 0.00 0.00 0.00 0.00 0.00 0.02 0.00 0.01 0.00 0.01 0.01 0.90

72
Immigration rates to the Nemunas river basin were also quite low and mostly associated with Luknė population of Dubysa river (NDL) and Ežeruona population of Jūra river (NJE). Other populations from Nemunas river basin possessed negligible proportions of immigrants from Akmena-Danė and Bartuva river basins (Table 11).
Considering migration between tributaries of the Nemunas river (Dubysa, Jura, Minija and Šyša), populations of Minija and Šyša were mostly isolated, whereas Jūra and Dubysa received immigrants from populations that belonged to different sub-basins. For example, Šunija population of Jūra river (NJS) received relatively high proportion of immigrants from Blendžiava population of Minija river (NMB) and from Šustis population of Šyša river (NSS) (m = 0.08 and 0.05, respectively), while Ežeruona (NJE) and Upinikė (NJU) populations of Jūra river received immigrants from Blendžiava population of Minija (NMB; m = 0.05). Populations of the Dubysa river, Luknė (NDL) and Lapiše (NDLa), displayed relatively high proportions of immigrants (m = 0.04) from Upinikė population of Jūra river (NJU) and from Mišupis population of Minija river (NMM), respectively (Table 11). Within the major tributaries of the Nemunas, the highest migration rates were observed in Minija and Dubysa river sub-basins. Within Minija sub-basin, Mišupis (NMM) population received high proportion of immigrants from Blendžiava (NMB; m = 0.18) and within Dubysa sub-basin, relatively high reciprocal migration (m = 0.08 and 0.10) between Dratvinys (NDD) and Lapiše (NDLa) was observed (Table 11). Relatively high migration rates we also found within the Jūra river sub-basin: in Ežeruona (NJE), the proportion of immigrants from Upinikė (NJU) was 0.06 (Table 11).

73
BP
N=2687
(0.98)
BG
N=654(0.74)
NMB
N=20846
(0.99)
NMM
N=11348
(0.77)
0.08
0.18
NDDN=3710
(0.84)
NDLa
N=16502
(0.82)
NDL
N=3885
(0.69)
ADB
N=2566
(0.98)
ADE
N=238
(0.94)
ADF
N=1299
(0.76)
NMTS
N=1909
(0.98)
NJUN=2636
(0.88)
NJS
N=8085
(0.78)
NJE
N=2157
(0.68)
NSS
N=13098
(0.90)
0.04
0.04
0.04
0.04
0.10
0.08
0.04
0.05
0.05
0.06
0.05
0.08
0.05
Fig. 5: Gene flow between Lithuanian sea trout populations based on contemporary migration estimates. Arrows indicate direction of gene flow; N denotes estimated numbers of sea trout parr and numbers in brackets indicate proportion of nonmigrants within population. Numbers on arrows represent proportion of migrants. Only migration rates larger than 0.03 are displayed.

74
Movement of sea trout between analyzed rivers was generally asymmetric. Rivers characterized by large numbers of sea trout parr, frequently functioned as sources of migrants. In Minija river basin, Blendžiava (NMB) and Mišupis (NMM) provided migrants not only to the neighboring rivers but also to the rivers that belong to other basins (Table 11, Fig. 5). Similarly, Pragulba population of Bartuva river basin (BP), Bonalė population of Akmena-Danė river basin (ADB) as well as Šustis population of Šyša river sub-basin (NSS) functioned as a source of migrants to smaller populations. Ežeruona population of Jūra river sub-basin (NJE) that is characterized by one of the smallest number of sea trout parr received immigrants from the largest number of populations (Table 11, Fig. 5). Large proportion of immigrants (from 0.16 to 0.24) were also observed in most enhanced populations of sea trout (ADF, NDD, NDLa and NJS). The only exception was NMTS where the proportion of non-migrants was very high (0.98). Genetically effective migration rate depended also on geographical distance. In majority of cases, migration was more frequent to geographically closer populations. For example, Mišupis (NMM) received high proportion of immigrants from nearby population (26.9 km) Blendžiava (NMB) within the Minija sub-basin. Migration between geographically remote rivers was rare and the proportion of migrants was smaller.
5.2 Atlantic salmon 5.2.1 Genetic diversity in wild and farmed salmon populations Exact Hardy-Weinberg tests showed significant deviations from Hardy-Weinberg equilibrium in 3 out of 25 tests at 5% significance level after Bonferroni adjustments. Two of them were in Hatchery-2000 population (SSOSL417 and Ssa202) and one was in Hatchery-1999 population (locus Ssa197 (Table 13)).

75
Linkage disequilibrium was not significant for most studied samples and only one and two pairs of loci were in linkage disequilibrium in populations Hatchery-2000 and Hatchery-2002 after applying Bonferroni correction for multiple tests. Significant linkage disequilibrium between loci in these populations can be most probably explained by sampling the siblings (Ohta 1982).
In total, 53 alleles were observed at the 5 microsatellite loci analysed, ranging from 6 (SSOSL85) to 20 (Ssa197). Average number of alleles detected per population varied from 3.25 (SSOSL85) to 9.75 (Ssa197) (Table 12).
Within locus genetic diversity was moderate to high with observed heterozygosities ranging from 0.591 (SSOSL85) to 0.808 (Ssa197) over all samples (Table 12). Individual loci varied in observed heterozygosity among populations, ranging from 0.388 (Ssa171 in Hat99) to 10.96 (SSOSL417 in Hat00) (Table 13). Expected heterozygosities ranged from 0.528 (SSOSL85) to 0.816 (Ssa197) over all samples (Table 12) and from 0.424 (Ssa171 in Hat99) to 0.881 (Ssa197 in Hat99) for individual loci among populations (Table 13).
Table 12: Locus by locus statistics (Aver.A – average number of alleles per locus; Aver.HE – average expected heterozygosity; Aver.HO – average observed haterozygosity; SD – standard deviation) Locus Aver.A SD Aver.HE SD Aver.HO SD Ssa197 9.750 4.500 0.816 0.059 0.808 0.125 SSOSL417 5.500 1.915 0.652 0.037 0.754 0.161 Ssa202 5.750 0.500 0.736 0.098 0.730 0.102 SSOSL85 3.250 1.258 0.528 0.042 0.591 0.126 Ssa171 5.750 2.217 0.613 0.142 0.637 0.185
The total number of alleles over seven loci ranged from 23 in
the Hatchery2000 population to 43 in the Hatchery-1999 population. Allelic richness across all populations had a mean value of 5.46 and

76
within populations ranged from 4.51 in Hatchery-2000 population to 6.89 in Hatchery-1999 population (Table 13).
Table13: Micosatellite diversity indices for salmon populations from Lithuanian rivers. Figures provided are number of alleles (A), allelic richness (AR), expected (HE) and observed (HO) heterozygosity and P-value for deviation from expected Hardy-Weinberg proportions (PHW; significant deviations indicated in bold).
Population Ssa197 SSOSL417 Ssa202 SSOSL85 Ssa171 All loci Žeimena
A 10 6 6 3 5 6.00 Ar 9.250 5.517 5.992 3.000 5.000 5.75 He 0.836 0.667 0.773 0.583 0.739 0.719 Ho 0.931 0.655 0.821 0.759 0.759 0.785 PHW 0.355 0.434 0.519 0.146 0.363
Hat-1999 A 16 8 5 5 9 8.60 Ar 12.437 6.543 4.129 4.319 7.022 6.89 He 0.881 0.689 0.593 0.493 0.424 0.616 Ho 0.840 0.800 0.600 0.460 0.388 0.618 PHW 0.010 0.084 0.657 0.149 0.075
Hat-2000 A 6 4 6 3 4 4.60 Ar 5.729 4.000 5.880 3.000 3.957 4.51 He 0.740 0.649 0.816 0.537 0.584 0.665 Ho 0.633 0.960 0.800 0.546 0.607 0.709 PHW 0.1607 0.0002 0.0005 0.3272 0.5872
Hat-2002 A 7 4 6 2 5 4.80 Ar 6.965 3.984 5.733 2.000 4.756 4.69 He 0.806 0.602 0.762 0.497 0.704 0.674 Ho 0.828 0.600 0.700 0.600 0.793 0.704 PHW 0.656 0.299 0.370 0.414 0.452
Average observed heterozygosity across all populations was
0.704 and within populations varied from 0.618 in Hatchery-1999 population to 0.785 in wild Žeimena population. Expected gene diversity across all populations was 0.669 and within populations

77
varied from 0.618 in Hatchery1999 population to 0.719 in wild Žeimena population (Table 13).
The Wilcoxon’s sign-rank test detected significant excess of heterozygosity in all studied salmon populations (p<0.05), except Hatchery-1999. It indicates that other hatchery populations as well as wild Žeimena population have recently experienced severe reduction in their effective population size.
Tests for comparison of genetic diversity indices showed that Hatchery-1999 population exhibited higher allelic richness than other two hatchery populations (p<0.05), but detected no significant differences in observed and expected heterozygosities (p>0.05). Similarly, comparison of genetic diversity of wild and hatchery populations found no significant differences neither in average allelic richness nor in average heterozygosities (p>0.05). 5.2.2 Allele frequencies of salmon populations
Range of allele lengths in each locus are given in the Table 14 and allele frequencies of each population at each locus are presented in Table 15.
Table 14: Range of allele lengths in each locus
Locus Range of allele lengths (bps) Ssa197 164-224 SSOSL417 159-203 Ssa202 240-268 SSOSL85 183-201 Ssa171 208-240
The proportion of shared alleles between populations of Žeimena and hatchery populations of local origin (Hatchery-2000 and Hatchery-2002) was 76%, whereas only 42% of common alleles were observed between Žeimena population and Hatchery-1999 population.

78
Table 15: Allele frequencies of each Lithuanian salmon population at each locus Lokus Populations Ssa197 Žeimena Hat-1999 Hat-2000 Hat-2002
164 6,67 13,79 1,72 168 21,67 5,17 24,14 172 20,00 27,59 27,59 176 1,72 188 8,33 13,79 11,00 5,17 192 6,00 194 1,00 196 12,00 198 1,00 204 1,67 10,00 1,72 206 2,00 208 41,67 29,31 4,00 13,79 210 1,00 212 23,00 5,17 214 3,00 216 5,17 4,00 12,07 218 2,00 220 17,00 222 2,00 224 5,17 1,00 6,90
SSOSL417 Žeimena Hat-1999 Hat-2000 Hat-2002 159 52,00 5,00 1,00 161 8,00 11,67 8,00 22,41 163 2,00 1,72 183 7,00 8,62 185 14,00 56,67 50,00 51,72 187 9,00 191 1,00 193 26,00 26,67 22,00 13,79 203 1,72

79
Ssa202 Žeimena Hat-1999 Hat-2000 Hat-2002 240 2,00 5,36 244 20,00 38,33 18,00 30,36 248 16,00 11,67 21,00 8,93 252 58,00 256 1,67 2,00 260 24,00 25,00 1,00 33,93 264 24,00 10,00 10,71 268 14,00 13,33 10,71
SSOSL85 Žeimena Hat-1999 Hat-2000 Hat-2002 183 13,64 10,34 187 4,00 195 1,00 197 63,64 42,00 21,00 36,21 199 22,73 58,00 68,00 53,45 201 6,00
Ssa171 Žeimena Hat-1999 Hat-2000 Hat-2002 208 3,57 2,04 212 12,50 6,90 1,02 12,07 216 25,86 7,14 10,34 220 25,00 43,10 75,51 41,38 224 2,04 228 2,04 232 5,10 10,34 236 58,93 22,41 3,06 25,86 238 2,04
Considering all populations separately, a total of 22 private alleles were found in 4 populations and most of them (19 out of 22) were observed in Hatchery-1999 population. Two private alleles were found in the wild Žeimena population and only a single private allele was found in the Hatchery-2002 population. The frequency of private alleles in the populations of Žeimena and Hatchery-2002 did not exceed 0.02, whereas some private alleles of Hatchery-1999 population dominated over all others. For example, the frequency of

80
allele 252 in locus Ssa202 was 0.58, similarly the frequencies of alleles 196 and 220 in locus 197 were 0.12 and 0.17 (Table 15).
We found some very rare alleles, that frequency did not exceed 0.05, for example the frequency of allele 163 in locus SSOSL417 and allele 256 in locus Ssa202 did not exceed 0.02. We also found some alleles that dominate over others, for example the frequency of alleles 197 and 199 in locus SSOSL85 ranged from 0.86 to 1.00 across all populations, similarly the frequency of alleles 220 and 236 in locus Ssa174 ranged from 0.66 to 0.84.
5.2.3 Genetic differentiation and relationships among salmon populations
Significant differences in allele frequencies were detected between all studies salmon populations. Pair-wise FST values were calculated between all populations pairs (Table 16). The most distinguished were the Hatchery-1999 population which displayed FST values of 0.126, 0.127 and 0.252 in pair-wise comparisons with Žeimena, Hatchery-2002 and Hatchery-2000 populations, respectively, whereas the lowest FST value was between Žeimena and Hatchery-2002 populations (FST = 0.013) (Table 16).
Pair-wise genetic distances (DA) were also calculated between all populations pairs (Table 16). The Hatchery-1999 population was mostly genetically distant – average DA values between Hatchery-1999 population and wild Žeimena population as well as between Hatchery-1999 population and Hatchery-2000 was 0.308 and 0.453, respectively. Whereas the smallest genetic distance was found between wild Žeimena population and Hatchery-2002 population (DA = 0.085).
Table 16: Pairwise FST values (above diagonal) and DA distances (below diagonal) between Lithuanian salmon populations
NNZ Hat-1999 Hat-2000 Hat-2002 NNZ 0.126 0.107 0.013 Hat-1999 0.308 0.252 0.127

81
Hat-2000 0.168 0.453 0.111 Hat-2002 0.085 0.316 0.138
6. DISCUSSION 6.1 Genetic diversity of sea trout and salmon populations
Analysis of microsatellite DNA variation revealed high level of polymorphism in Lithuanian sea trout populations. Comparisons of mean expected heterozygosity and mean allelic richness between river basins revealed that all examined river basins exhibited similar levels of genetic diversity in spite of significant differences in the estimates of their smolt production. However, comparison of genetic diversity of populations that belong to Nemunas river basin revealed significant differences between populations that belong to sub-basins of the tributaries Minija and Dubysa. The reason of increased genetic variation in the Dubysa river sub-basin can be natural or human mediated gene flow, as according to estimates of recent migration rates, the most isolated populations in terms of immigrants, belong to the Minija sub-basin, whereas populations from Dubysa river sub-basin receive immigrants not only from Nemunas basin but also from populations that belong to Akmena-Danė basin (Table 11, Fig. 5).
The levels of polymorphism and genetic diversity found in this study are comparable to those reported in studies from other regions of Atlantic sea trout. Average number of alleles per locus in Lithuanian populations ranged from 3.57 to 6.29, whereas the range of this measure was from 5.33 to 7.33 in Danish anadromous brown trout populations (6 common loci with our study; Hansen et al., 2002), from 5.33 to 6.67 in Polish sea trout populations (three common loci; Was and Wenne, 2003) and from 3.68 to 6.17 in Norwegian brown trout populations (four common loci; Sønstebø et all. 2007). Similarly, expected heterozygosity in Lithuanian populations ranged from 0.60 to 0.72, whereas the range of this measure was from 0.62 to 0.70 in Danish anadromous brown trout populations, from 5.33 to 6.67 in Polish sea trout populations and from 3.68 to 6.17 in Norwegian brown trout populations. However, in Spain it was found higher levels

82
of genetic diversity than seen in our study: number of alleles per locus varied from 11.67 to 17.00 and expected heterozygosity varied from 0.83 to 0.90 (Campos et al., 2007).
It was found no evidence of recent bottleneck in Spanish sea trout populations (Campos et al., 2007), whereas our results showed that most Lithuanian sea trout populations have recently experienced severe reduction in their effective population size. It cannot be excluded, however, that the Danish, Polish and Norwegian populations have also suffered from the reduced effective population size.
The level of polymorphism was also high in studied Atlantic salmon populations. Genetic diversity of Lithuanian salmon populations was comparable with other salmon populations from Baltic Sea region. Allelic richness (Ar = 5.46) and mean heterozygosity (He = 0.67) of Lithuanian populations was consistent with that reported for Estonia and Latvia (Estonia: Ar = 5.13; He = 0.60; Vasemägi et al. 2005a and Latvia: Ar = 6.90; He = 0.69; Säisä et al., 2005). Therefore, genetic diversity of Lithuanian salmon populations was lower than reported in Gulf of Bothnia (Ar = 8.3; He = 0.72; Säisä et al., 2005) and in southern populations of Baltic sea (Ar = 8.4; He = 0.73; Säisä et al., 2005). The level of genetic diversity of Barent and White Sea populations as well as of populations of Eastern Atlantic and Spain was even more higher (Barent and White Sea: Ar = 10.6; He = 0.78; Säisä et all. 2005; Eastern Atlantic: Ar = 12.1; He = 0.81; Säisä et al., 2005; Spain: Ar = 9.5; He = 0.76; Horreo et al., 2008).
Analysis of genetic distances (DA) and Fst values revealed that, because of non-local origin, Hatchery-1999 population was very distinct from other analyzed populations. Moreover, average genetic distance between this population and other analyzed populations was 0.36 and was similar to that reported between eastern Baltic sea and Gulf of Bothnia populations (DA = 0.35; Säisä et al., 2005). At the same time, average Fst value between wild Žeimena population and other hatchery populations was 0.08 and was similar to that reported

83
between wild Estonian salmon populations (Fst = 0.10; Vasemägi et al., 2005a).
The level of genetic diversity in wild, enhanced and farmed populations of salmon and sea trout in Lithuania was similar. Population size bottlenecks were detected not only in enhanced or hatchery populations but also in majority of wild populations, where releases of artificially reared trout have never been carried out. Furthermore, the genetic composition of enhanced populations was more similar to the wild populations of Nemunas basin than to the other analyzed populations. These results are consistent with the Lithuanian stocking program that is based on wild spawners of local origin (Virbickas and Kesminas 2002).
6.2 Genetic structure of sea trout populations
Significant population differentiation was found both between river systems and between most population pairs within the same river system. Even geographically adjacent tributaries exhibited significant genetic differences. This indicates that Lithuanian sea trout populations are structured into distinct breeding units.
Quantitative analysis of genetic differentiation showed that genetic differences between populations from Akmena-Danė river basin and other analyzed populations as well as between populations from Bartuva river basin and other analyzed populations were larger than differences between populations from Minija, Jūra, Dubysa and Šyša sub-basins. The same situation was obvious from comparison of genetic distances which showed that populations from Akmena-Danė river basin as well as populations from Bartuva river basin are genetically more distinct from other studied populations whereas populations from Minija, Jūra, Dubysa and Šyša sub-basins are genetically more similar. This pattern could be explained by different geographical situation of analyzed rivers: Akmena-Danė drains to the Curonian Lagoon, Bartuva drains to the Liepaja Lake which is connected with the Baltic Sea, whereas Dubysa, Jūra, Minija and Šyša are tributaries of the Nemunas river, providing more possibilities for gene flow among the populations from the same river basin.
84
However, regardless clear importance of geographic region to genetic differences, we found no statistically significant differences of allele frequencies and no statistically significant Fst values between enhanced population of Akmena-Danė (ADF) and Luknė population from Dubysa river sub-basin (NDL) as well as between Bonalė-2004 population of Akmena-Danė (ADB-04) and Ežeruona population from Jūra river sub-basin (NJE). This finding could reflect relatively high level of gene flow mediated by stocking practices that translocate fish from one river basin to other.
Analysis of proportions of shared alleles between three major river drainages showed that this proportion between populations of Akmena-Danė river basin and populations of Nemunas river basin was higher than between populations of Bartuva and Akmena-Danė river basin and between populations Bartuva and Nemunas river basins, therefore populations of Akmena-Danė and Nemunas river basins are more similar in allele composition in comparison with populations of Bartuva river basin. However, when we considered only wild sea trout populations of Akmena-Danė and Nemunas river basins, proportion of shared alleles became lower and comparable with other values of between basin comparisons.
These similarities were also reflected in the relatively weak inter-regional structuring of populations – the AMOVA analysis showed that regardless of population grouping strategy, within-region variation was higher than the between-region variation and the genetic distance based analysis clearly showed only two main population groups with high bootstrap support. These results indicate that for the Lithuanian sea trout, the population structure at the level of within river basins is more pronounced than at the level of between river basins. It also shows the impact of both natural gene flow and translocations of fish from different tributaries of Nemunas and also from different river basins during stocking practices. The latter became obvious after excluding enhanced populations from the AMOVA analysis since the percentage of among-basin differentiation increased markedly. AMOVA results also indicated that although structuring between three regions is not strong when all populations

85
are considered, there is evidence that wild populations exhibit much stronger differentiation at this spatial scale (Table 10).
6.3 Temporal stability of sea trout populations
Analysis of temporal stability of populations revealed statistically significant differences in allele frequency distribution and significant FST values between temporal replicates taken from Dratvinys and Lapiše populations from Dubysa river sub-basin (NDD and NDLa), Upinikė population from Jūra river sub-basin (NJU) and Blendžiava population from Minija river sub-basin (NMB). Temporal AMOVA also showed significant changes in allele frequencies among temporal replicates within populations. This indicates that these populations are not temporally stable over short time scales of two to four years. Unstable population genetic composition and structure has been reported also in several other studies of salmonids (e.g. Laikre et al., 2002; Ostergaard et al., 2003; Jensen et al., 2005; Hansen et al., 2009) though there were also studies that demonstrated stability of genetic population structure, for instance in Atlantic salmon (Nielsen et al., 1999; Tessier and Bernatchez 1999; Palstra et al., 2007; Vähä et al., 2008) and also brown trout (Hansen et al., 2002; Campos et al., 2007). Main reasons of significant temporal genetic changes include random genetic drift in populations that have very small effective population size (Laikre et al., 2002; Palm et al., 2003), population size bottlenecks or extinction–recolonization events determined by unfavorable environmental conditions (Østergaard et al., 2003; Jensen et al., 2005) and effects of captive breeding as well as introgression from other populations by stocking activity (Säisä et al., 2003; Hansen et al., 2009). In our study we found evidence of recent population bottleneck in many populations. However, reduction of effective population size was detected not only in populations with unstable allele frequency distribution, but also in other populations from Nemunas and Bartuva basins in which allele frequencies were stable over time.

86
Computer simulations have provided evidence that in organisms with overlapping generations the total population consists of several age classes (cohorts) that may have different allele frequencies and such population will display considerably larger allele frequency shifts than the population with discrete generations (Ryman 1997). Moreover, it was shown that if sampled population consists of individuals of only single year class (cohort), changes in allele frequencies can be much more pronounced than in sample that consists of different cohorts and that the possibility to find significant differences in allele frequencies is higher when samples do not consist of even representation of a cohort (Ryman 1997; Palm et al., 2003). In our study, sampled populations consisted of the individuals of the 0+ age class, therefore allele frequency differences that were found between temporal samples of the same river were likely due to restricted number of age classes. Moreover, the AMOVA analysis showed that the genetic variation attributable to temporal variation within populations is three times lower (2.0%) than the variation attributable to spatial variation among sampling sites (5.4%). This indicates that temporal variation within sampling sites was relatively low compared to the spatial differences between them. The higher variation attributable to spatial variation compared to temporal variation was also reflected in the pairwise FST and DA values, which were significantly lower between temporal replicates of the populations than between spatial samples within the years (p<0.05; Mann-Whitney U-test). Moreover, temporal samples grouped together according to the site of origin in the neighbor-joining dendrogram. These results provide additional evidence that spatial diversity is a more important constituent of total genetic diversity of Lithuanian sea trout populations and allows treating them as temporally stable. Several previous studies have also reported temporal variation within populations that was several times lower than the spatial component of variation and did not change the spatial differentiation pattern and accordingly, allowed to infer temporal stability of the analyzed populations (Campos et al., 2007; Heggenes et al., 2009; Ozerov et al., 2010).

87
6.4 Impact of contemporary gene flow on fine scale genetic structure of sea trout populations
Analysis of contemporary migration rates showed that two of the currently largest populations (NMB, NMM) were the main donors of migrants and that the direction of gene flow was predominantly from large into small populations. These findings indicate asymmetric pattern of contemporary gene flow where larger populations act as sources of migrants and smaller populations act as recipients. This result is in good accordance with the other recent studies of brown trout and salmon where asymmetric gene flow from large into small populations was observed (Hansen et al., 2007, Palstra et al., 2007). It is evident that asymmetric gene flow can be helpful in maintaining genetic diversity in small populations (Palm et al., 2003; Consuegra et al., 2005). For instance, the Ežeruona population from Jūra river sub-basin (NJE) has one of the smallest parr densities among Lithuanian sea trout populations and nevertheless exhibits a relatively high level of genetic diversity, similar or even higher than those found in much larger populations. This can be explained by naturally occurring gene flow as we found that this population receives the largest number of migrants from other rivers. The gene flow is of such magnitude that prevents loss of genetic diversity but preserves genetic differences. Therefore, magnitude and asymmetry of natural gene flow could be very important for the preservation of genetic variability in the Lithuanian sea trout.
It is obvious that geographic distance between populations can be important contributor to genetic structure but, in contrast to many other studies of salmonids (Bouza et al., 1999; Carlsson and Nilsson, 2000; Ruzzante et al., 2001; Campos et al., 2007; Palstra et al., 2007), we did not detect significant correlation between geographical and genetic distances when all populations were considered. However, when the enhanced populations were excluded from the analysis the correlation became highly significant. Consequently, natural patterns of isolation-by-distance could be modified by human impact through transplantations of trout between populations. Indeed, we found a relatively high migration rates between wild and enhanced sea trout

88
populations that belong to different river basins. For example, migration rate from ADF to NDL and from NMB to NJS was 0.04 and 0.08, respectively, whereas the waterway distance between these populations was 294 km and 248 km, respectively. This suggests the possibility of transplantation of juveniles between wild and enhanced populations. Altogether, our results showed relationships between genetic diversity, gene flow and population structure of Lithuanian sea trout. It is obvious that genetic diversity and population genetic structure of Lithuanian sea trout reflects contemporary dispersal and gene flow, both natural and human mediated. The larger portion of the genetic diversity revealed in this study is distributed among populations within geographical regions than between regions. The proportion of variance attributable to differences between regions was highest (4.13%) when only wild populations were considered in analysis. Furthermore, the genetic structure of wild sea trout populations fit isolation by distance model where geographical distances between populations are important, whereas no evidence that limited gene flow between remote populations is an important factor for the observed genetic structure was apparent when all studied populations were considered. Consequently, human mediated gene flow from stocked to wild populations alters hierarchical as well as spatial population structure of Lithuanian sea trout. It is also evident, that asymmetrical and distance restricted natural gene flow between wild populations is one of the fundamental contributor to the genetic structure of Lithuanian sea trout. Asymmetrical and quite extensive gene flow may also determine relatively small genetic differences among rivers in this region as well as maintenance of genetic diversity and counteraction inbreeding in small populations by immigration from larger ones.
6.5 Implications for management of salmon and sea trout populations
This study provided the detailed information on the amount of genetic diversity and distribution of genetic variation between and within populations, i.e. information on the spatial genetic structure, of

89
salmon and sea trout in Lithuania. This knowledge can be useful and must be incorporated into management actions of salmon and sea trout recourses in Lithuania.
This study reported high levels of genetic diversity both in wild and enhanced populations. It was also found an importance of geographic region to genetic differences. These findings were ascribed to proper Lithuanian stocking program that is based on wild spawners of local origin. There are a number of studies showing that releases of populations of non-local origin have affected wild populations. It was demonstrated that releases of non-native hatchery reared salmon caused genetic homogenization between wild populations and hatchery stocks (Vasemägi et al., 2005b) as well as altered the genetic integrity of unique gene pools of wild trout since stocked and wild trout interbreed (Apostolidis et al., 2008). It was also evident that stocking with non-indigenous trout has disturbed the genetic patterns of wild populations (Moran et al., 2005) and caused introgression of exotic alleles and even domination of them in intensively stocked populations (Jug et al., 2005). All these threats, consequently, can disrupt local adaptations and reduce fitness of wild populations (Utter, 2001; Alendorf et al., 2001).
Also there is empirical evidence that maintaining populations in hatcheries for several generations may cause negative genetic effects. For example, Säisä et al. (2003) assessed genetic changes in two Atlantic salmon stocks in Finland by comparing genetic parameters of these stocks before and after long-term (40 and 33 years respectively) captive breeding and found that hatchery broodstocks experienced significant decrease in allelic richness and mean heterozygosity. Similarly, Aho et al. (2006) found that in hatchery broodstocks of sea trout in Finland genetic diversity decreased over time since founding and that the size of founding population is an important factor for the level of genetic variability over time. Similarly, positive correlation was found in Atlantic salmon between mean heterozygosity and number of founder individuals (Verspoor, 1998).

90
Genetic changes in hatchery stocks that have been reared in captivity for several generations can result in severe negative effects on wild populations they interact with. A 37-years study of Atlantic salmon in Ireland showed that release of captive bred salmon into the wild can substantially disrupt the capacity of natural populations to adapt to higher winter water temperatures associated with climate variability (McGinnity et al., 2009). Similarly, Hansen et al., (2010) examined Danish populations of brown trout that were supplemented by hatchery releases for 60 years and found evidence of contemporary selection in wild populations against alleles introduced by hatchery strain trout.
Supportive breeding in Lithuania is based only on wild breeders. All produced offspring are released in to the rivers, thus the brood-stock is obtained from the wild every year. This type of stocking is referred as supportive breeding (Hansen et al., 2000b) to differentiate it from other forms of stocking. Results of this study indicated that this breeding practice is adequate for maintaining genetic diversity levels similar to the wild populations.
Even though supportive breeding has advantages over stocking with non-local or farm-reared domesticated fish, it is not without its problems. Several studies showed that even a short period in a hatchery can result in reduction of survival and reproductive success because hatchery environment alter behaviour and physiology and also because genetic changes that arise due to differential or relaxed selection (Glover et al., 2004; Sundström et al., 2004). Consequently, the period in the hatchery should be as short as possible.
It was evident that genetic diversity can decrease in hatcheries because of breeding related individuals or using a small numbers of parents (Norris et al., 1999). The fish brought into captivity have more offspring than the wild fish if the breeding program is successful. Therefore, if a limited number of parents is used, inbreeding and loss of genetic variability in the naturally spawning population can occur because higher reproductive rates of reared fish affects the overall effective population size (Ryman and Laikre, 1991; Ryman 1994;

91
Ryman et al., 1995; Waples and Do 1994; Nomura 1999). It is recognized that the number of unrelated individuals founding the new population should be as large as possible and comprise at least 50 genetically effective founders (Allendorf and Ryman 1987). The reason of reduced effective population size also can be the unequal sex ratio; therefore an equal number of each sex should be used, with at least 25 of each sex. Therefore, to preserve as much genetic variation as possible, it is also essential to optimize breeding programmes with regard to number of parents, relatedness of breeders and sex ratio of breeders.
Genetic effects of stocked individuals also depend on population genetic structure of wild populations and the degree of genetic divergence between the released individuals and the wild population. This study revealed that Lithuanian sea trout populations form three main population groups that correspond to three main river basins: Akmena-Danė, Bartuva and Nemunas. It was also obvious that there is genetic structuring at the level of tributaries. Therefore, management strategies of Lithuanian sea trout should take into account that populations inhabiting different rivers and different tributaries of the same river are genetically differentiated and should be regarded as a separate distinct populations. Consequently, adults used for stocking should be taken from the same tributary and the progeny should be released in the same tributary in order to maximize their chances of survival and recruitment. Existing evidence that relocation of fish from one neighbouring geographical group to another during stocking practices was not very successful (as influence of stocked fish to wild populations was very little) (Sønstebø et al., 2007) and low survival of even moderately differentiated hatchery fish compared to the local wild population (Hansen et al., 2000a) provide empirical support that conservation strategies must be based on local populations. This study revealed close genetic similarity between enhanced population of Akmena-Danė (ADF) and Luknė population from Dubysa river sub-basin that belong to the Nemunas basin (NDL). The genetic relationship between populations that inhabit different river

92
basins may be attributable to enhancement of Akmena-Danė with hatchery reared individuals originated from Nemunas basin. This study also suggested that human mediated gene flow from stocked to wild populations alters hierarchical as well as spatial population structure of Lithuanian sea trout. Fish translocations between different river basins, particularly between Nemunas and Akmena-Danė and also between different rivers basins within Nemunas basin, could result in greater within-region variation in comparison with between-region variation and no detection of isolation-by-distance effect. According these findings, translocations between rivers that belong to different river basins, as in the case of Akmena-Danė and Dubysa, should be strictly avoided and concerning rivers of Nemunas river basin, appropriate procedures ensuring that hatchery reared individuals originated from one river sub-basin will not be released in other, should be developed.
Some recent empirical studies provided evidence for asymmetric gene flow from large to small populations in salmonid fishes and predicted that it can be important for maintaining genetic diversity and countering inbreeding depression in small populations and that possible future population recoveries will be mediated primarily by the remaining large populations (Consuegra et al., 2005; Palstra et al., 2007; Fraser et al,. 2007; Hansen et al., 2007). This study also indicated asymmetric pattern of contemporary gene flow in Lithuanian sea trout populations and suggested that it prevents loss of genetic diversity in relatively small natural populations (as in the case of Ežeruona population). It was also evident that presently largest wild populations (NMB and NMM in Nemunas river basin, ADB and BP in Akmena-Danė and Bartuva river basin, respectively) are the main donors of migrants in corresponding region; therefore it is very important to these populations should be managed very carefully. Even if contemporary dispersal occurs predominantly from current large census populations into smaller populations, long-term patterns can be quite different, with small populations functioning as sources of gene flow (Palstra et al., 2007). Therefore it is important to continue focusing conservation efforts on small rivers. Special

93
attention must be paid to Ežeruona from Jūra river sub-basin and Eketė from Akmena-Danė river basin because these populations have several very rare alleles and Ežeruona has two private alleles that can be easily lost.
Another very important result of this study is that due to relatively extensive contemporary gene flow within river basins, inappropriate genetic manipulation of fish in one population may negatively affect the whole river system. One of the most important issues in conservation programmes is re-introduction of former salmon or trout rivers. According recent studies, the best donor populations for such reintroductions are geographically proximate wild populations (Vasemägi et al., 2005a).
The important concept in the management of threatened salmonid species is effective population size (Ne). Ne is a measure of the rate of genetic drift and is directly related to the rate of loss of genetic diversity and the rate of increase in inbreeding within a population. The rate of loss of genetic diversity due to genetic drift is grater in populations with small Ne and this rate is expected to increase as Ne decreases (Frankham et al., 2002). Therefore in order to understand how genetic diversity in the stocks of Atlantic salmon and sea trout in Lithuania may be affected in the future, it would be useful to know Ne of each population.
This study provides basic information regarding current genetic composition and population genetic structure of Atlantic salmon and sea trout. This information can constitute important prerequisite for genetic monitoring that is needed for identifying and preserving gene level diversity.
Based on the results of this study the following recommendations for management are suggested:
1. Breeding practice that is based on wild breeders only is adequate for maintaining genetic diversity levels similar to the wild populations and for avoidance of negative genetic changes in wild populations. Maintaining a hatchery broodstock will result in the problems of domestication.

94
2. To preserve as much genetic variation as possible, it is also essential to optimize breeding programmes with regard to number of parents, relatedness of breeders and sex ratio of breeders.
3. Management strategies of Lithuanian sea trout should take into account that populations inhabiting different rivers and different tributaries of the same river are genetically differentiated and should be regarded as a separate distinct populations. Consequently, adults used for stocking should be taken from the same tributary and the progeny should be released in the same tributary in order to maximize chances of survival and recruitment.
4. Translocations between rivers of different river basins, as in the case of Akmena-Danė and Dubysa, should be strictly avoided. Appropriate procedures preventing releases of hatchery reared individuals into other river basin than their origin, should be developed for Nemunas river basin.
5. Indicated asymmetric pattern of contemporary gene flow in Lithuanian sea trout populations can be important for maintaining genetic diversity and countering inbreeding depression in small populations. Therefore, presently largest wild populations (NMB and NMM in Nemunas river basin, ADB and BP in Akmena-Danė and Bartuva river basin, respectively) should be managed with special regard.
6. Special attention must be paid to conservation efforts on small rivers such as Ežeruona from Jūra river basin and Eketė from Akmena-Danė river basin. These populations have several very rare alleles and Ežeruona has two private alleles that can be easily lost.
7. Due to relatively extensive contemporary gene flow within river basins, inappropriate genetic manipulation of fish in one population may negatively affect the whole river system. Therefore, the best donor populations for re-introductions of former salmon or trout rivers are geographically proximate wild populations.

95
8. It is necessary to implement genetic monitoring program that is needed for identification of diversity changes at gene level and preserving existing genetic recourses.

96
7. CONCLUSIONS
1. Level of genetic diversity in Lithuanian salmon and sea trout populations was high despite recent population size bottlenecks in many of them. All examined river basins exhibited similar levels of genetic diversity in spite of significant differences in the estimates of their smolt production.
2. Most of the tributaries of the Nemunas river also displayed similar levels of genetic diversity, the only exceptions were the tributaries Dubysa and Minija. Higher rates of genetically effective immigrants even from different river basin could be the reason of increased genetic variation in Dubysa river in comparison to Minija river.
3. Level of genetic diversity in wild, enhanced and farmed populations of salmon and sea trout in Lithuania was quite similar that is consistent with the Lithuanian supportive breeding program that is based only on wild spawners of local origin.
4. Populations inhabiting different rivers and different tributaries of the same river were genetically differentiated. Population structure of analyzed sea trout populations corresponded to three main river basins: Akmena-Danė, Bartuva and Nemunas. Structuring within Nemunas basin was significantly weaker.
5. Genetic structure of wild sea trout populations fitted isolation by distance model, whereas it was not relevant when all studied populations were considered. Similarly, proportion of variance attributable to differences between regions was highest when only wild populations were considered in analysis. Consequently, human mediated gene flow from stocked to wild populations alters hierarchical as well as spatial population structure of Lithuanian sea trout.
6. Spatial diversity of Lithuanian sea trout populations was more important constituent of total genetic diversity than temporal

97
variation therefore Lithuanian sea trout populations were temporally stable.
7. Lithuanian sea trout was characterized as a population system with asymmetric and distance restricted contemporary gene flow where larger populations acted as sources of migrants and smaller populations acted as recipients and where gene flow between different river basins was more restricted than within river basins.
8. Future management strategies should consider maintaining of individual populations even at tributary level and ensuring the natural levels of gene flow among populations.

98
8. REFERENCES
1. Aho T., Rönn J., Piironen J., Björklund M., 2006. Impacts of effective population size on genetic diversity in hatchery reared Brown trout (Salmo trutta L.) populations. Aquaculture 253: 244–248
2. Allendorf F., Ryman N., 1987. Genetic management of hatchery stocks. In Ryman, N. and Utter, F. (eds.). Population Genetics and Fishery Management. Washington Sea Grant Publications/ University of
Washington Press, Seattle and London, pp. 141–159. 3. Allendorf F.W, Leary R.F., 1988. Conservation and distribution of
genetic variation in a polytypic species, the cutthroat trout.
Conservation Biology 2: 170–184. 4. Allendorf F.W., Leary R.F., Spruell P., Wenburg J.K., 2001. The
problems with hybrids: setting conservation guidelines. Trends in Ecological Evolution 16: 613–622.
5. Allendorf F.W., England P.R., Luikart G., Ritchie P.A., Ryman N., 2008. Genetic effects of harvest on wild animal populations. Trends in Ecology and Evolution 23:327–337.
6. Almodovar A., Nicola G.G., Elvira B., Garcia-Marin J.L., 2006. Introgression variability among Iberian brown trout Evolutionary Significant Units: the influence of local management and environmental features. Freshwater Biology 51, 1175–1187.
7. Antunes A., Alexandrino P., Ferrand N., 1999. Genetic characterization of Portuguese brown trout (Salmo trutta L.) and comparison with other
European populations. Ecology of Freshwater Fish 8:194–200. 8. Antunes A., Faria R., Weiss S., Alexandrino P., 2001. Complex
evolutionary history in the brown trout: insights on the recognition of
conservation units. Conservation Genetics 2, 337–347. 9. Apostolidis A., Karakousis Y., Triantaphyllidis C., 1996a. Genetic
differentiation and phylogenetic relationships among Greek Salmo trutta L. (brown trout) populations as revealed by RFLP analysis of PCR amplified mitochondrial DNA segments. Heredity 77:608–618.
10. Apostolidis A., Karakousis Y., Triantaphyllidis C., 1996b. Genetic divergence and phylogenetic relationships among Salmo trutta L.

99
(brown trout) populations from Greece and other Europeans countries. Heredity 76:551–560.
11. Apostolidis A., Triantaphyllidis C., Kouvatsi A., Economidis P. S., 1997. Mitochondrial DNA sequence variation and phylogeography among Salmo trutta L. (Greek brown trout) populations. Molecular Ecology 6:531–542.
12. Apostolidis A. P., Madeira M. J., Hansen M. M., Machordom, A., 2008. Genetic structure and demographic history of brown trout (Salmo trutta) populations from the southern Balkans. Freshwater Biology 53: 1555–1566.
13. Araguas R.M., Sanz N., Pla C., Garcia-Marin J.L., 2004. Breakdown of the brown trout evolutionary history due to hybridization between native and cultivated fish. Journal of Fish Biology 65 (suppl. A): 28–37.
14. Asplund T., Veselov A., Rimmer C.R., Bakhmet I., Potutkin A., Titov S., Zubchenko A., Studenov I., Kaluzchin S., Lumme J., 2004. Geographical structure and postglacial history of MtDNA haplotype variation in Atlantic salmon (Salmo salar L.) among rivers of the White and Barents Sea basins. Annales Zoologici Fennici 41: 465–475
15. Aurelle D., Cattaneo-Cerrebi G., Berrebi P., 2002. Natural and artificial secondary contact in brown trout (Salmo trutta, L.) in the French western Pyrenees assessed by allozymes and microsatellites. Heredity 89, 171–183.
16. Bernatchez L., Guyomard R., Bonhomme F., 1992. DNA sequence variation of the mitochondrial control region among geographically and morphologically remote European brown trout Salmo trutta populations.
Molecular Ecology 1:161–173. 17. Bernatchez L. and Osinov A.G., 1995. Genetic diversity of trout (genus
Salmo) from its most eastern native range based on mitochondrial DNA
and nuclear gene variation. Molecular Ecology 4:285–297. 18. Bernatchez L., 2001. The evolutionary history of brown trout (Salmo
trutta L.) inferred from phylogeographic, nested clade, and mismatch analyses of mitochondrial DNA variation. Evolution 55: 351–379.
19. Berrebi P., Poteaux C., Fissier M., Cattaneo-Berrebi G., 2000. Stocking impact and allozyme diversity in brown trout from Mediterranean southern France. Journal of Fish Biology 56: 949–960.
20. Bouza C., Arias J., Castro J., Sanches L., Martinez P., 1999. Genetic structure of brown trout, Salmo trutta L., at the southern limit of the

100
distribution range of the anadromous form. Molecular Ecology 8: 1991–2001
21. Bourke E.A., Coughlan J., Jansson H., Galvin P., Cross T.F., 1997. Allozyme variation in populations of Atlantic salmon located throughout Europe: diversity that could be compromised by introductions of reared fish. ICES Journal of Marine Science 54: 974–985.
22. Cagigas M.E., Vazquez E., Blanco G., Sanchez J., 2002. Phylogeographical lineages in brown trout (Salmo trutta): investigating microgeographical differentiation between native populations from Northern Spain. Freshwater Biology 47: 1879–1892
23. Campos J.L., Posada D., Caballero P., Moran P., 2007. Spatio-temporal genetic variability in sea trout (Salmo trutta) populations from north-western Spain. Freshwater Biology 52: 510–524
24. Carlsson J. and Nilsson J., 2000. Population genetic structure of brown trout (Salmo trutta L.) within a northern boreal forest stream. Hereditas 132: 173–181
25. Consuegra S., Garcia de Leaniz C., Serdio A., Gonzalez Morales M., Straus L. G., Knox D., Verspoor E., 2002. Mitochondrial DNA variation in Pleistocene and modern Atlantic salmon from the Iberian glacial refugium. Molecular Ecology 11: 2037–2048.
26. Consuegra S., Verspoor E., Knox D., Garcia de Leaniz C., 2005. Asymmetric gene flow and the evolutionary maintenance of genetic diversity in small, peripheral Atlantic salmon populations. Conservation
Genetics 6: 823–842 27. Corujo M., Blanco G., Vasquez E., Sanchez J.A., 2004. Genetic
structure of northwestern Spanish brown trout (Salmo trutta L.) populations, differences between microsatellite and allozyme loci.
Hereditas 141: 258–271 28. Dillane E., Cross M.C., McGinnity P., Coughlan J.P., Galvin P.T.,
Wilkins N.P., Cross T.F., 2007. Spatial and temporal patterns in microsatellite DNA variation of wild Atlantic salmon, Salmo salar, in
Irish rivers. Fisheries Management and Ecology 14: 209–219. 29. Dionne M., Caron F., Dodson J.J., Bernatchez L., 2008. Landscape
genetics and hierarchical genetic structure in Atlantic salmon: the

101
interaction of gene flow and local adaptation. Molecular Ecology 17:
2382–2396 30. Elliott J.M., 1994. Quantitative ecology and the brown trout. Oxford
University Press, Oxford, UK. 31. EPA (Lithuanian Environmental Protection Agency), 2010. Nemunas
river basin district management plan. APPROVED by Resolution No. 1098 of the Government of the Republic of Lithuania of 21 July 2010
32. Estoup A., Rousset F., Michalakis Y., Cornuet J.M., Adriamanga M., Guymard R., 1998. Comparative analysis of microsatellite and allozyme markers: a case study investigating microgeographic differentiation in
brown trout (Salmo trutta). Molecular Ecology 7: 339–353 33. Ferguson A., 1989. Genetic differences among brown trout, Salmo
trutta, stocks and their importance for the conservation and management
of the species. Freshwater Biology 21: 35–46 34. Ferguson A and Mason F.M., 1981. Allozyme evidence for reproductive
isolated sympatric populations of brown trout, Salmo trutta L., in Lough
Melvin, Ireland. Journal of Fish Biology 18, 629–642 35. Ferguson A. and Fleming C.C., 1983. Evolutionary and taxonomic
significance of protein variation in the brown trout (Salmo trutta L.). In Oxford, G.S. and Rollinson, D. (eds.). Protein Polymorphism: Adaptive
and Taxonomic Significance. London Academic Press 24: 85–99. 36. Frankham R., Ballou J.D., Briscoe D.A. 2002. Introduction to
conservation genetics. Cambridge University Press, Cambridge, UK. 37. Frankham R., 2005. Genetics and extinction. Biological Conservation
126:131–140. 38. Fraser D. J., Hansen M. M., Ostergaard S., Tessier N., Legault M.,
Bernatchez L., 2007. Comparative estimation of effective population sizes and temporal gene flow in two contrasting population systems. Molecular Ecology 16: 3866–3889.
39. Gailiušis B., Jablonskis J., Kovalenkienė M., 2001. The Lithuanian rives. Hydrography and runoff. Kaunas: Lithuanian Energy Institute, Kaunas, 796 p. (in Lithuanian)

102
40. Garant D., Dodson J.J., Bernatchez L., 2000. Ecological determinants and temporal stability of the within-river population structure in
Atlantic salmon (Salmo salar L.). Molecular Ecology 9: 615–628 41. Garcia-Marin J.L., Utter F. M.,. Pla C., 1999a. Postglacial colonization
of brown trout in Europe based on distribution of allozyme variants. Heredity 82:46–56.
42. Garcia-Marin J.L., Sanz N.R., Pla C., 1999b. Erosion of the native genetic resources of brown trout in Spain. Ecology of Freshwater Fish 8:151–158.
43. Gharrett A.J., Smoker W.W., Reisenbichler R.R., Taylor S.G., 1999. Outbreeding depression in hybrids between odd- and even-broodyear pink salmon. Aquaculture 173: 117–129
44. Glover K.A., Taggart J.B., Skaala, Ø., Teale A.J., 2004. A study of inadvertent domestication selection during start-feeding of brown trout
families. Journal of Fish Biology 64: 1168–1178. 45. Goudet J (2002) FSTAT, a program to estimate and test gene diversities
and fixation indices (version 2.9.3). Available from http://www2.unil.ch/popgen/softwares/fstat.htm. Accessed 8 Sept 2008
46. Guo S., Thompson E., 1992. Performing the exact test of Hardy-Weinberg proportion for multiple alleles. Biometrics 48: 361–372.
47. Hamilton K.E., Ferguson A., Taggart J.B., Tomasson T., Walker A., Fahy E., 1989. Post-glacial colonization of brown trout, Salmo trutta L.: Ldh-5 as a phylogeographical marker locus. Journal of Fish Biology 35: 651–664.
48. Hansen M.M., Ruzzante D.E., Nielsen E.E., Mensberg K-L.D., 2000a. Microsatellite and mitochondrial DNA polymorphism reveals life-history dependent interbreeding between hatchery and wild brown trout
(Salmo trutta L.). Molecular Ecology 9: 583–594 49. Hansen M.M., Nielsen E.E., Ruzzante D.E., Bouza C., Mensberg K-
L.D., 2000b. Genetic monitoring of supportive breeding in brown trout (Salmo trutta L.), using microsatellite DNA markers. Canadian Journal of Fish and Aquatic Science 57: 2130–2139
50. Hansen M.M, Ruzzante D.E, Nielsen E.E., Bekkevold D., Mensberg K.L.D., 2002. Long-term effective population sizes, temporal stability of genetic composition and potential for local adaptation in anadromous

103
brown trout (Salmo trutta) populations. Molecular Ecology 11: 2523–2535.
51. Hansen M.M., Skaala O., Jensen L.F., Bekkevold D., Mensberg K-L., 2007. Gene flow, effective population size and selection at major histocompability complex genes: brown trout in the Hardanger Fjord,
Norway. Molecular Ecology 16: 1413–1425 52. Hansen M.M., Fraser D.J., Meier K., Mensberg K-L.D., 2009. Sixty
years of anthropogenic pressure: a spatio-temporal genetic analysis of brown trout populations subject to stocking and population declines. Molecular Ecology 18: 2549–2562
53. Hansen M.M., Meier K., Mensberg K-L.D., 2010. Identifying footprints of selection in stocked brown trout populations: a spatial-temporal approach. Molecular Ecology 19: 1787–1800.
54. Heggenes J., Roed K.H.,Jorde P.E.,Brabrand A., 2009. Dynamic micro-geographical genetic diversity in vertebrates: the case of lake-spawning
populations of brown trout (Salmo trutta). Molecular Ecology 18: 1100–1111
55. Hindar K., Ryman N., Utter F., 1991. Genetic effects of cultured fish on natural fish populations. Canadian Journal of Fish and Aquatic Science
48: 945–956 56. Horreo J.L., Machado-Schiaffino G., Griffiths A., Bright D., Stevens J.,
Garcia-Vazquez E., 2008. Identification of differential broodstock contribution affecting genetic variability in hatchery stacks of Atlantic
salmon (Salmo salar). Aquaculture 280: 89–93 57. Hynes R.A., Ferguson A., McCann M.A., 1996. Variation in
mitochondrial DNA and post-glacial colonisation of north-west Europe
by brown trout (Salmo trutta L.). Journal of Fish Biology 48: 4–67. 58. ICES. 2008. Report of the Baltic Salmon and Trout Working Group
(WGBAST), 11 - 20 April 2007, Vilnius, Lithuania. ICES CM 2007/ACFM:12. 255 pp.
59. ICES. 2011. Report of the Baltic Salmon and Trout Assessment Working Group (WGBAST), 22–30 March 2011, Riga, Latvia. ICES 2011/ACOM:08. 297 pp.

104
60. Jensen L.F., Hansen M.M., Carlsson J., Loeschcke V., Mensberg K-L.D., 2005. Spatial and temporal genetic differentiation and effective population size of brown trout (Salmo trutta L.) in small Danish rivers.
Conservation Genetics 6: 615–621 61. Jug T., Berrebi P., Snoj A., 2005. Distribution of non-native trout in
Slovenia and their introgression with native trout populations as observed through microsatellite DNA analysis. Biological Conservation
123: 381–388. 62. Kazakov R.V., Titov S.F., 1991. Geographical patterns in the population
genetics of Atlantic salmon, Salmo salar L., on U.S.S.R. territory, as evidence for colonisation routes. Journal of Fish Biology 39: 1–6.
63. Kesminas V., Virbickas T., Repečka R., 2003. The present state of salmon (Salmo salar L.) in Lithuania. Acta Zoologica Lituanica 13: 176–187.
64. Kesminas V. and Kontautas A., 2011. Lithuanian country report in Baltic Sea trout workshop. 11-13 October 2011, Helsinki, Finland
65. Kesminas V., 2012. Lithuanian National Report on Salmon and Sea Trout in Baltic Salmon and Trout Assessment Working Group, Uppsala, Sweden
66. King T.L., Kalinowski S.T., Schill W.B., Spidle A.P., Lubinski B.A., 2001. Population structure of Atlantic salmon (Salmo salar L.): a range-wide perspective from microsatellite DNA variation. Molecular Ecology 10: 807–821.
67. Koljonen M-L., 1989. Electrophoretically detectable genetic variation in natural and hatchery stocks of Atlantic salmon in Finland. Hereditas 10: 23–35
68. Koljonen M.-L., Jansson H., Paaver T., Vasin O., Koskiniemi J., 1999. Phylogeographic lineages and differentiation pattern of Atlantic salmon (Salmo salar) in the Baltic Sea with management implications. Canadian Journal of Fish and Aquatic Science 56: 1766–1780.
69. Koljonen M.L., Tähtinen J., Säisä M., Koskiniemi J., 2002. Maintenance of genetic diversity of Atlantic salmon (Salmo salar) by captive breeding programmes and the geographic distribution of microsatellite variation. Aquaculture 212, 69–92.
70. Laikre L., Ryman N., 1996. Effects on intraspecific biodiversity from harvesting and enhancing natural populations. Ambio 25: 504–509.

105
71. Laikre L., Järvi T., Johansson L., Palm S., Rubin J-F., Glimsater C.E., Landergren P., Ryman N., 2002. Spatial and temporal population structure of sea trout at the Island of Gotland, Sweden, delineated from mitochondrial DNA. Journal of Fish Biology 60: 49–71
72. Laikre L., Palm S., Ryman N., 2005. Genetic population structure of fishes: implications for coastal zone management. Ambio 34:111–119.
73. Laikre L., Nilsson T., Primmer C.R., Ryman N., Allendorf F.W., 2009. Importance of genetics in the interpretation of favorable conservation status. Conservation Biology 23: 1378–1381
74. Laikre L., Allendorf F.W., Aroner L.C., Baker C.S., Gregovich D.P., Hansen M.M., Jackson J.A., Kendall K.C., McKelvey K., Neel M.C., Olivieri I., Ryman N., Schwartz M.K., Short Bull R., Stetz J.B., Tallmon D.A., Taylor B.L., Vojta C.D., Walle, D.M., Waples R.S., 2010a. Neglect of genetic diversity in implementation of the Convention on Biological Diversity. Conservation Biology 24:86–88.
75. Laikre L., Schwartz M.K., Waples R.S., Ryman N., and The GeM Working Group., 2010b. Compromising genetic diversity in the wild: unmonitored large-scale release of plants and animals. Trends in Ecology & Evolution, 25: 520–529.
76. Laird P.W., Zijderveld A., Linders K., Linders K., Rudnicki M.A, Jaenisch R., Berns A., 1991. Simplified mammalian DNA isolation procedure. Nucleic Acid Research 19: 4293.
77. Leliūna E., Virbickas J., 2006. Phylogeographic characteristics of the Atlantic salmon (Salmo salar L.) population of the Nemunas river. Acta Zoologica Lituanica 16: 229–234
78. Leliūna E., 2010. Assessment of genetic structure of sea trout (Salmo trutta trutta L.) populations in the Nemunas River tributaries based on mitochondrial DNA variation. Acta Zoologica Lituanica 20: 112–118
79. Luck G.W., Daily G.C., Ehrlich P.R., 2003. Population diversity and ecosystem services. Trends in Ecology and Evolution 18: 331–336.
80. Machado-Schiaffino G., Dopico E., Garcia-Vazquez E., 2007. Genetic variation in Atlantic salmon stocks created for supportive breeding.
Aquaculture 264: 59–65 81. Martinez P., Arias J., Castro J. and Sanchez L., 1993. Differential
stocking incidence in brown trout (Salmo trutta) populations from
northwestern Spain. Aquaculture 114: 203–216.

106
82. McConnell S.K., O’Reilly P., Hamilton L., Wright J.M., Bentzen, P., 1995a. Polymorphic microsatellite loci from Atlantic salmon (Salmo salar): genetic differentiation of North American and European populations. Canadian Journal of Fish and Aquatic Science 52: 1863–1872.
83. McConnell S., Hamilton L., Morris D., Cook D., Paquet D., Bentzen, P., Wright J., 1995b. Isolation of salmonid microsatellite loci and their application to the population genetics of canadian east coast stocks of Atlantic salmon. Aquacuture 137: 19–30
84. McGinnity P., Jennings E., deEyto E., Allott N., Samuelsson P., Rogan G., Whelan K., Cross T., 2009. Impact of naturally spawning captive-bred Atlantic salmon on wild populations: depressed recruitment and increased risk of climate-mediated extinction. Proceedings of the Royal Society London Series B Biological Sciences 276: 3601–3610.
85. Moran P., Pendas A.M., Garcia-Vasquez E., Izquierdo J., 1991. Failure of a stocking policy, of hatchery reared brown trout, Salmo trutta L, in Asturias, Spain, detected using Ldh-5-* as a genetic marker. Journal of
Fish Biology 39 (Supplement A):117–121. 86. Moran P., Pendas A.M., Garcia-Vazques E., Iziquierdo J.I., Lobon-
Cervia J., 1995. Estimates of gene flow among neighboring populations of brown trout. Journal of Fish Biology 46: 593–602
87. Moran P., Dumas J., Beall E., Garcia-Vazques E., 2005. Stocking-related patterns of genetic variation at enzymatic loci in south European Atlantic salmon populations. Journal of Fish Biology 67: 186–199.
88. Muhlfeld C.C., Kalinowski S.T., McMahon T.E., Taper M.L., Painter S., Leary R.F., Allendorf F.W., 2009. Hybridization rapidly reduces
fitness of a native trout in the wild. Biology Letters 5: 328–331 89. Nei M., Tajima F., Tateno Y., 1983. Accuracy of estimated
phylogenetic trees from molecular data. Journal of Molecular Evolution 19: 153–170.
90. Nickleson T., 2003. The influence of hatchery coho salmon (Oncorhunchus kisutch) on the productivity of wild coho salmon populations in Oregon coastal basins. Canadian Journal of Fisheries and Aquatic Sciences 60: 1050–1056.

107
91. Nielsen E.E., Hansen M.M., Loeschcke V., 1999. Genetic variation in time and space: microsatelllite analysis of extinct and extant populations
of Atlantic salmon. Evolution 53: 261–268 92. Nilsson J., Gross R., Asplund T., Dove O., Jansson H., Kelloniemi J.,
Kohlmann K., Löytynoja A., Nielsen E. E., Paaver T., Primmer C. R., Titov S., Vasemägi A., Veselov A., Öst, T., Lumme J., 2001. Matrilinear phylogeography of Atlantic salmon (Salmo salar L.) in Europe and postglacial colonization of the Baltic Sea area. Molecular Ecology 10: 89–102.
93. Nilsson C., Lepori F., Malmqvist B., Törnlund E., Hjerdt N., Helfield J. M., Palm D., Östergren J., Jansson R., Brännäs E., Lundqvist, H., 2005. Forecasting environmental responses to restoration of rivers used as log floatways: an interdisciplinary challenge. Ecosystems 8: 779–800
94. Nilsson J., Ostergren J., Lundqvist H., Carlsson U., 2008. Genetic assessment of Atlantic salmon Salmo salar and sea trout Salmo trutta
stocking in a Baltic Sea river. Journal of Fish Biology 73: 1201–1215 95. Nomura T., 1999. Effective population size in supportive breeding.
Conservation Biology 13: 670–672. 96. Norris A.T., Bradley D.G., Cunningham E.P., 1999. Microsatellite
genetic variation between and within farmed and wild Atlantic salmon
(Salmo salar) populations. Aquaculture 180: 247–264. 97. Ohta T., 1982. Population genetics of multigene families. Advances in
Biophysics 15: 173–179. 98. Osinov A. and Bernatchez L., 1996. Atlantic and Danubean
phylogenetic groupings of brown trout (Salmo trutta L.) complex: genetic divergence, evolution, and conservation. Journal of Ichthyology
36: 762–786. 99. Østergaard S., Hansen M.M., Loeschke V., Nielsen E.E., 2003. Long-
term temporal changes of genetic composition in brown trout (Salmo trutta L.) populations inhabiting an unstable environment. Molecular
Ecology 12: 3123–3135. 100. Ota T., 1993. DISPAN: genetic distance and phylogenetic analysis
software. Pennsylvania State University, University Park, Pa.

108
101. Ozerov M., Veselov A., Lumme J., Primmer C., 2010. Genetic structure of freshwater Atlantic salmon (Salmo salar L.,) populations from the lakes Onega and Ladoga of northwest Russia and implications for conservation. Conservation Genetics 11: 1711–1724
102. Palm S., Dannewitz J., Järvi T., Petersson E., Prestegaard T., Ryman N., 2003. Lack of molecular genetic divergence between sea-ranched and wild sea trout (Salmo trutta). Molecular Ecology 12: 2057–2071
103. Palstra F., O`Connell M. F., Ruzzante D.E., 2007. Population structure and gene flow reversals in Atlantic salmon (Salmo salar) over contemporary and long-term temporal scales: effects of population size and life history. Molecular Ecology 16: 4504–4522
104. Parrish D. L., Behnke R. J., Gephard S. R., McCormick S. D., Reeves, G. H., 1998. Why aren't there more Atlantic salmon (Salmo salar)? Canadian Journal of Fisheries and Aquatic Sciences 55: 281–287.
105. Piry S., Luikart G., Cornuet J-M., 1999. BOTTLENECK: a computer program for detecting recent reductions in the effective population size using allele frequency data. Journal of Heredity 90: 502–503.
106. Rengmark A.H., Slettan A, Skaala O., Lie O., Lingaas F., 2006. Genetic variability in wild and farmed Atlantic salmon (Salmo salar) strains
estimated by SNP and microsatellites. Aquaculture 253: 229–237 107. Raymond M., Rousset F., 1995a. GENEPOP: Population genetics
software for exact tests and ecumenicism. Journal of Heredity 86: 248–249.
108. Raymond M., Rousset F., 1995b. An exact test for population differentiation. Evolution 49: 1280–1283.
109. Reusch T.B.H., Ehlers A., Hämmerli A., Worm B., 2005. Ecosystem recovery after climatic extremes enhanced by genotypic diversity. Proceedings of the National Academy of Sciences of the United States of America 102: 2826–2831.
110. Rice W.R., 1989. Analysing tables of statistical tests. Evolution 43: 223–225.
111. Rousset F., 1997. Genetic differentiation and estimation of gene flow
from F-statistics under isolation by distance. Genetics 145: 1219–1228. 112. Ruzzante D.E., Hansen M.M., Meldrup D., 2001. Distribution of
individuals inbreeding coefficients, relatedness and influence of

109
stocking on native anadromous brown trout (Salmo trutta) population
structure. Molecular Ecology 10: 2107–2128 113. Ryman N., 1981. Conservation of genetic resources: experiences from
the brown trout (Salmo trutta). Ecological Bulletins 34: 61–74. 114. Ryman N., 1994. Supportive breeding and effective population size:
differences between inbreeding and variance effective numbers. Conservation Biology 8: 888–890.
115. Ryman N., 1997. Minimizing adverse effects of fish culture: understanding the genetics of populations with overlapping generations. ICES Journal of Marine Science 54:1149–1159.
116. Ryman N., Laikre L., 1991. Effects of supportive breeding on the genetically effective population size. Conservation Biology 5: 325–329.
117. Ryman N., Utter F., Laikre L., 1995. Protection of intraspecific biodiversity of exploited fishes. Reviews in Fish Biology and Fisheries
5: 417–446 118. Säisä M., Koljonen M.-L., Tähtinen J., 2003. Genetic changes in
Atlantic salmon stocks since historical times and the effective population size of a long-term captive breeding programme. Conservation Genetics 4: 613–627.
119. Säisä M., Koljonen M.-L., Gross R., Nilsson J., Tähtinen J., Koskiniemi J., Vasemägi, A., 2005. Population genetic structure and postglacial colonization of Atlantic salmon (Salmo salar) in the Baltic Sea area based on microsatellite DNA variation. Canadian Journal of Fisheries and Aquatic Sciences 62, 1887–1904
120. Schneider S., Roessli D., Excoffier L., 2000. ARLEQUIN: software for population genetics data analysis (version 2.000). Available at http://lgb.unige.ch/arlequin/. Accessed 9 Sept 2008.
121. Sønstebø L.H., Borgstrom R., Heun M. 2007. Genetic structure of brown trout (Salmo trutta L.) from the Hardangervidda mountain plateau (Norway) analyzed by microsatellite DNA: a basis for conservation quidelines. Conservation Genetics 8, 33–44
122. Spidle A.P., Schill W.B., Lubinski B.A., King T.L., 2001. Fine-scale population sgtructure in Atlantic salmon from Maine`s Penobscot River drainage. Conservation Genetics 2: 11–24.
123. Spidle A.P., Kalinowski S.T., Lubinski B.A., Perkins D.L., Beland K.F., Kocik J.F., King T.L., 2003. Population structure of Atlantic salmon in

110
Maine with reference to populations from Atlantic Canada. Transactions of the American Fisheries Society 132:196–209.
124. Ståhl G. 1987. Genetic population structure of Atlantic salmon. In Population genetics and fishery management. Edited by N. Ryman and F. Utter. University of Washington Press, Seattle, Wash. pp. 121–141.
125. Stewart D.C., Middlemas S.J., Youngson A.F., 2006. Population structuring in Atlantic salmon (Salmo salar): evidence of genetic influence on the timing of smolt migration in sub-catchment stocks. Ecology of Freshwater Fish 15: 552–558.
126. Sundström L.F., Petersson E., Höjesjö J., Johnsson J.I., Järvi T., 2004. Hatchery selection promotes boldness in newly hatched brown trout (Salmo trutta): implications for dominance. Behavioural Ecology 15, 192–198.
127. Tessier N., Bernatchez L., 1999. Stability of population structure and genetic diversity across generations assessed by microsatellites among sympatric populations of landlocked Atlantic salmon (Salmo salar L.).
Molecular Ecology 8: 169–179 128. Tonteri A., Titov S., Veselov A., Zubchenko A., Koskinen M. T.,
Lesbarreres D., Kaluzhin S., Bakhmet I. Lumme J., Primmer C. R., 2005. Phylogeography of anadromous and non-anadromous Atlantic salmon (Salmo salar) from northern Europe. Annales Zoologici Fennici 42: 1–22.
129. Utter F., 2001. Patterns of subspecific anthropogenic introgression in two salmonid Genera. Reviews in Fish Biology and Fisheries 10: 265–279.
130. Vähä J-P., Erkinaro J., Niemela E., Primmer C.R., 2007. Life-history and habitat features influence the within-river genetic structure of Atlantic salmon. Molecular Ecology 16: 2638–2654
131. Verspoor E., McCarthy E. M., Knox D., Bourke E. A., Cross T. F., 1999. The phylogeography of European Atlantic salmon (Salmo salar L.) based on RFLP analysis of the ND1/16sRNA region of the mtDNA. Biological Journal of the Linnean Society 68: 129–146.
132. Verspoor E., Beardmore J. A., Consuegra S., García de Leániz C., Hindar K., Jordan W.C., Koljonen M.-L., Mahkrov A.A., Paaver T., Sánchez J. A., Skaala O., Titov S., Cross T.F., 2005. Population structure in the Atlantic salmon: insights from 40 years of research into
genetic protein variation. Journal of Fish Biology 67, 3–53

111
133. Virbickas T., Kesminas V., 2002. Salmon (Salmo salar) and sea trout (Salmo trutta) restocking efficiency in potential rivers of Lithuania. Initial study. Acta Zoologica Lithuanica, 12: 129–137.
134. Waples R.S., Do C., 1994. Genetic risk associated with supplementation of Pacific salmonids: captive broodstock programs. Canadian Journal of Fish and Aquatic Science 51 (Suppl. 1): 310–329.
135. Was A., Wenne R., 2002. Genetic differentiation in hatchery and wild sea trout (Salmo trutta) in the Southern Baltic at microsatellite loci.
Aquaculture 204: 493–506. 136. Was A., Wenne R., 2003. Microsatellite DNA polymorphism in
intensely enhanced populations of sea trout (Salmo trutta) in the Southern Baltic. Marine Biotechnology 5: 234–243
137. Vasemägi A., Gross R., Paaver T., Koljonen M-L., Säisä M., Nilsson J., 2005a. Analysis of gene associated tandem repeat markers in Atlantic salmon (Salmo salar L.) populations: implications for restoration and conservationin the Baltic Sea. Conservation Genetics 6: 385–397.
138. Vasemägi A., Gross R., Paaver T., Koljonen M-L., Nilsson J., 2005b. Extensive immigration from compensatory hatchery releases into wild Atlantic salmon population in the Baltic Sea: spatio-temporal analysis
over 18 years. Heredity 95: 76–83 139. Verspoor E., 1988. Reduced genetic variability in first-generation
hatchery populations of a Atlantic salmon (Salmo salar). Canadian
Journal of Fish and Aquatic Science 48: 1686–1690 140. Weber E.D., Fausch K.D., 2003. Interactions between hatchery and wild
salmonids in streams: differences in biology and evidence for competition. Canadian Journal of Fisheries and Aquatic Sciences 60:
1018–1036. 141. Weiss S., Antunes A., Schlötterer C., Alexandrino P., 2000.
Mitochondrial haplotype diversity among Portuguese brown trout Salmo trutta L. populations: relevance to the post-Pleistocene recolonization of
northern Europe. Molecular Ecology 9, 691–698. 142. Weiss S., Schlötterer C., Waidbacher H., Jungwirth M., 2001.
Haplotype (mtDNA) diversity of brown trout Salmo trutta in tributaries of the Austrian Danube: massive introgression of Atlantic basin fish – by man or nature? Molecular Ecology 10: 1241–1246.
112
143. Wilson G.A., Rannala B., 2003. Bayesian inference of recent imigration
rates using multilocus genotypes. Genetics 163: 1177–1191
144. Wright S., 1931. Evolution in Mendelian populations. Genetics 16: 97–159.