population molecular biometry, and evolution
TRANSCRIPT

POPULATION GENETICS, MOLECULARBIOMETRY, AND EVOLUTION
MOTOO KIMURA and TOMOKO OHTANATIONAL INSTITUTE OF GENETICS, MISHIMA, JAPAN
1. Introduction
It has been said that Darwin's theory of evolution by natural selection is oneof the greatest intellectual triumphs of our civilization (Crick [7]). Equallyimportant is the recent discovery that the instruction to form an organism isencoded in DNA (or sometimes RNA) with four kinds of nucleotide bases. It isnatural, therefore, that attempts be made to understand evolution in molecularterms.
Studies of evolution always contain two aspects. One is historical and is con-cerned with the reconstruction of past processes. The other is causal in that theunderlying mechanism is pursued. Although these two are intimately con-nected, we are mainly concerned in this paper with the latter aspect of molecularevolution and we shall discuss several problems from the standpoint of popula-tion genetics.As a branch of genetics, population genetics investigates the laws which
govern the genetic composition of Mendelian populations (reproductive com-munities), and through such study, we intend to clarify the mechanism ofevolution. The fundamental quantity which is used here is the gene frequencyor the proportion of a given allelic gene in the population.Because of the particulate nature of Mendelian inheritance, gene frequencies
change only gradually with time under the influence of mutation, migration,selection, and random sampling of gametes in reproduction in any reasonablylarge population. The mathematical theory which treats such processes of changeas stochastic processes was founded by the great works of R. A. Fisher [15] andSewall Wright [66], and since then has been considerably extended under thename of diffusion models (Kimura [25]; see also Crow and Kimura [10], Chap-ters 8 and 9).Although population genetics theories in general, and especially their deter-
ministic aspects such as those initiated by J. B. S. Haldane [18], have promotedgreatly the development of neo-Darwinian theory of evolution (see Haldane[21]), the real impact of the mathematical theory of population genetics hasnot been felt in the study of evolution. The main reason for this is that popula-
Contribution No. 820 from the National Institute of Genetics, Mishima, Shizuoka-keri,411 Japan.
43

44 SIXTH BERKELEY SYMPOSIUM: KIMURA AND OHTA
tion genetics theory is built on the concept of gene frequencies and the actualstudies of evolution are conducted at the phenotypic level, and there is no directway of unambiguously connecting the two. This has often made the study ofmicroevolution a victim of loose jargon and facile generalizations, to the dis-couragement of the time consuming efforts to build mathematical models andcheck them with observable quantities.
It is fortunate, therefore, that the study of molecular evolution has openeda new field where the mathematical theory of population genetics can be intro-duced (Kimura [27], [31]). We now know, thanks to the pioneering work ofZuckerkandl and Pauling [67], that mutant substitutions have proceededwithin the gene locus (cistron) coding for the alpha chain of hemoglobins at anaverage interval of roughly ten million years in the course of vertebrate evolu-tion. Similar estimates of evolutionary rate are now available for several cis-trons [38], [45]. In addition, the estimation of the rate of nucleotide substitu-tion in evolution has begun using DNA hybridization techniques [39], [40].For many years, attempts have been made in vain to estimate the number of
gene substitutions that actually occurred in the course of evolution, trans-forming one species into another, one genus into another, and so forth. Butnow, by the methods that can measure gene differences in molecular terms,this has become feasible.An exciting possibility confronting us is, by synthesizing comparative studies
of informational macromolecules and modem studies of paleontology by themethods of population genetics and biometry, to go far back into the historyof life and to penetrate deep into the mechanism of evolution at the molecularlevel. Certainly, there is much to be done by statisticians and applied mathe-maticians in this new venture.
2. Population genetics of gene substitution
From the standpoint of population genetics, the process of molecular evolu-tion consists of a sequence of events in which a rare molecular mutant increasesits frequency and spreads into the species, finally reaching the state of fixation.They represent a lucky minority among a tremendous number of mutants thatactually appear in the species in the course of evolution.
Before we present the dynamics of mutant substitution in the population,let us summarize briefly the nature of genes and mutations at the molecular(DNA) level. A gene, or more precisely a cistron, may be thought of as a linearmessage written with four kinds of nucleotide bases (A, T, G, C) from whicha polypeptide chain is transcribed (A = adenine, T = thymine, G = guanine,C = cytocine). The message is so composed that a set of three consecutiveletters (triplet) form a code word or codon for an amino acid. With four possibleletters at each position of a triplet, there are 43 or 64 codons. Of these, 61 areused to code for 20 amino acids, while the remaining three codons serve as
POPULATION GENETICS 45
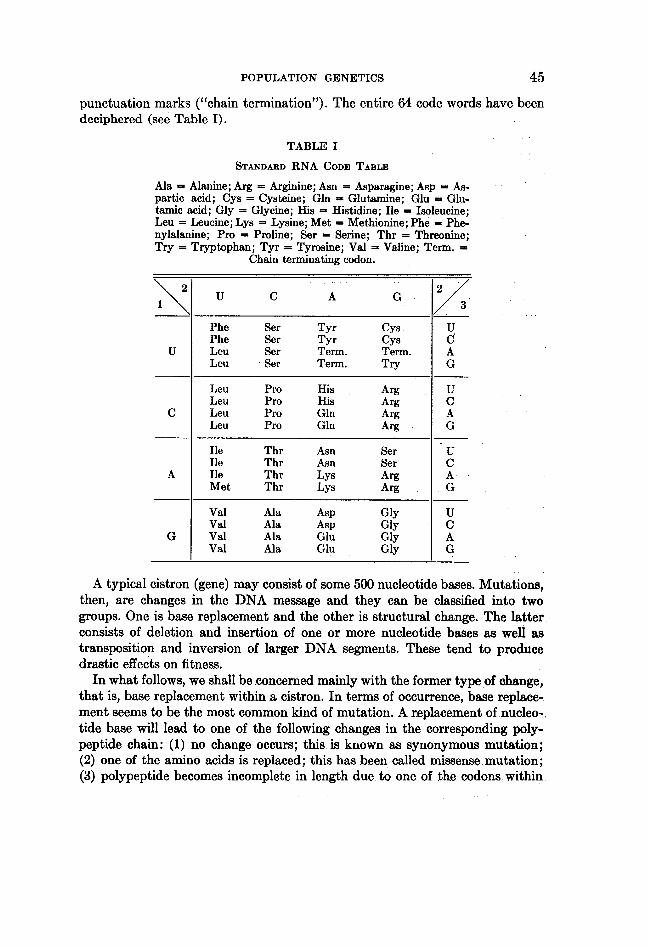
punctuation marks ("chain termination"). The entire 64 code words have beendeciphered (see Table I).
TABLE I
STANDARD RNA CODE: TABLE
Ala = Alanine; Arg = Arginine; Asn = Asparagine; Asp = As-partic acid; Cys = Cysteine; Gln = Glutamine; Glu = Glu-tamic acid; Gly = Glycine; His = Histidine; Ile = Isoleucine;Leu = Leucine; Lys = Lysine; Met = Methionine; Phe = Phe-nylalanine; Pro = Proline; Ser = Serine; Thr = Threonine;Try = Tryptophan; Tyr = Tyrosine; Val = Valine; Term. =
Chain terninating codon.
\2 U C A G ,1 3
Phe Ser Tyr Cys UPhe Ser Tyr Cys C
U Leu Ser Term. Term. ALeu Ser Term. Try G
Leu Pro His Arg ULeu Pro His Arg C
C Leu Pro Gin Arg ALeu Pro Gln Arg G
Ile Thr Asn Ser UIle Thr Asn Ser C
A Ile Thr Lys Arg AMet Thr Lys Arg G
Val Ala Asp Gly UVal Ala Asp Gly C
G Val Ala Glu Gly AVal Ala Glu Gly G
A typical cistron (gene) may consist of some 500 nucleotide bases. Mutations,then, are changes in the DNA message and they can be classified into twogroups. One is base replacement and the other is structural change. The latter.consists of deletion and insertion of one or more nucleotide bases as well astransposition and inversion of larger DNA segments. These tend to producedrastic effects on fitness.
In what follows, we shall be concerned mainly with the.former type of change,that is, base replacement within a cistron. In terms of occurrence, base replace-ment seems to be the most common kind of mutation. A replacement of.nucleo-,tide base will lead to one of the following changes in the corresponding poly-peptide chain: (1) no change occurs; this is known as synonymous mutation;(2) one of the amino acids is replaced; this has been called missense mutation;(3) polypeptide becomes incomplete in length due. to one of the codons within

46 SIXTH BERKELEY SYMPOSIUM: KIMURA AND OHTA
the cistron changing into a terminating codon; this is known as chain terminatingmutation.Among the three types of mutations, synonymous mutations amount to
roughly 25 per cent of cases and must be the least damaging type to the or-ganism. It is possible that most of them are selectively neutral. Missense (aminoacid substitution) mutations may also affect the biological activity of the poly-peptide very little unless amino acid substitutions occur at the active sites thatare crucial for the function of the molecule. This class of mutations is particu-larly important in the study of molecular evolution since they lead to changesthat are found by comparative studies of amino acid sequences. Also, roughlyone third of these mutations can be detected by electrophoresis. Chain ter-minating mutations amount to roughly five per cent of the cases and they mustusually be very damaging to the function of the protein, so that they are readilyeliminated by natural selection.In considering population consequences of mutations at the molecular level,
two very important points that we must keep in mind are: (1) the number ofpossible allelic states at any locus (cistron) is so large as to be practically infinite,and (2) the back mutation in the strict sense is so rare as to be negligible for anyshort interval of time. As an example, let us take the cistron coding for thea chain of the mammalian hemoglobins. This polypeptide consists of 141 aminoacids, and so its cistron is made up of 423 nucleotide sites. This allows 4428 orsome 10254 allelic states through base replacements alone, because each nucleotidesite may be occupied by one of the four kinds of nucleotide bases. Thus, for anyone of these alleles, there are 3 X 423 or 1269 other alleles that can be reachedby a single step base replacement. The probability of returning to the originalallele from any one of the latter alleles by further single base replacement is onlyone in 1269, assuming that all base replacements occur with equal probability.
This example brings to light the inadequacy of the conventional model inwhich a pair of alleles (usually denoted by A and a) are assumed with reversiblemutations at comparable rates at each gene locus. Also, we must note that themutation rate per nucleotide site must be several hundred times lower than theconventional figure of 105 usually assumed for a gene. Clearly, we need morerealistic models to treat problems of population genetics at the molecular level.So far, two models have been devised to meet such a need. One is the modelused' by Kimura and Crow [32] who assumed that the number of possible allelicstates at a locus is so large that each new mutant represents an allelic state notpre-existing in the population. Another is the model' used by Kimura [28] whoassumed that the number of nucleotide sites making up the genome is so large,while the mutation rate- per site is so low, that whenever a mutant appears(within -a limited evolutionary time period)j it represents a mutation at a newsite. These two models may be called "the model of infinite alleles" and "themodel of infinite sites," respectively, [31]. The latter is especially useful whenwe consider the rate of mutant substitution in evolution.
Let us denote by k the rate of mutant substitution (incorporation) and define

POPULATION GENETICS 47
this as the long term average of a number of mutants that become fixed, perunit time (year, generation, and so forth) in the course of evolution. To avoidconfusion, we must emphasize here that this rate is different from the rate atwhich an individual mutant increases its frequency in the population. We waitlong enough so that the length of time taken for each substitution does notinfluence the result. Thus, as long as the average interval between occurrencesof consecutive mutants (considering only those that are destined to reachfixation) is the same, two populations have the same k value.
Consider a panmictic population consisting of N diploid individuals andhaving the effective number N. (for the meaning of N., see [10], p. 345). Let vbe the mutation rate of a cistron per ga'mete per unit time and let u be theprobability of ultimate fixation of an individual mutant.'Then, the rate ofmutant substitution at this locus is given by(1) k = 2Nvu,because 2Nv new mutants appear per unit time in the population and the frac-tion u reach ultimate fixation. Here, the model of infinite sites is appropriateand we assume that mutants at different sites behave independently.
Using the formula for the probability of gene fixation by Kimura [24], andassuming that the mutant has selective advantage s in heterozygote and 2s inhomozygote, we have
(2) 1-exp {-2N.8/N}1-exp {-4N.s}
Also, in this and in the subsequent formulae, we assume that each mutant isrepresented only once at the moment of appearance.
If the mutant has a definite selective advantage so that 4N. 8» 1 but s << 1,this reduces approximately to
(3) 2N. 8N
On the other hand, if the mutant is selectively neutral such that 14N. al << 1,then, taking the limit s-O0, we have
(4) u 1
First, consider the neutral case since this leads to a very simple result. Sub-stituting (4) in (1), we have(5) k =v,namely, the rate of mutant substitution in evolution is equal to the mutationrate per gamete [27], [38], [8]. Note that this is independent of population size.On the other hand, if the mutant has a definite selective advantage, substituting(3) in (1), we have(6) k = 4N,av.In this case k depends on N. and 8, as well as on v.

48 SIXTH BERKELEY SYMPOSIUM: KIMURA AND OHTA
In addition to the probability of fixation and the rate of mutant substitution,we need to know the average length of time involved for each substitution.A general theory on this subject has been worked out by Kimura and Ohta [35]based on the diffusion models. The theory gives the average number of genera-tions until fixation (excluding the cases of eventual loss), assuming the initialfrequency of the mutant is p. In the special case of selectively neutral mutant,taking p = 1/2N, the average number of generations until fixation is approxi-mately(7) 4 = 4Ne.
Namely, it takes, on the average, four times the effective population numberfor a selectively neutral mutant to reach fixation by random frequency drift.Actually, in this particular case of neutral mutants, the probability distributionof the length of time until fixation has been obtained [30]. For selected mutants,if they have selective advantage both in homozygotes and heterozygotes, theaverage length of time until fixation is shorter, while if they are overdominant,the time is prolonged.When mutant substitutions are carried out by natural selection rather than
by random drift, the population must stand the load of gene substitution. Thiswas first pointed out by Haldane [19] in his paper entitled "The cost of naturalselection." He showed that the sum of the fraction of selective deaths over allgenerations for one gene substitution is given by D = -2 log.p if the mutantis semidominant in fitness and has initial frequency p. A remarkable point isthat the cost D is independent of the selection coefficient 8 (>0). For example,if p = 106, we have D = 27.6. If mutant substitutions proceed independentlyat the rate k per generation, the fraction of selective elimination per generationor selection intensity is I = kD. Haldane conjectured that the selection inten-sity involved in the standard rate of evolution is of the order of 0.1, so thatk = 1/300 is a typical figure for the rate of gene substitution. He believed thisexplains the observed slowness of evolution (at the phenotypic level). To whatextent species can stand the load of substitution depends on the reproductiveexcess that the species can afford. Haldane's result is based on the deterministicmodel that disregards the effect of random sampling of gametes in finite popu-lations. The problem of obtaining the cost or the substitutional load in a finitepopulation was solved by Kimura and Maruyama [34] using the diffusionmodels. For semidominant mutants having definite selective advantage, theload for one gene substitution is approximately
(8) L(p) = -2 logp + 2,
where we can put p = 1/2N for molecular mutants. This approximation formulais valid under the same condition for which formula (6) on the rate of mutantsubstitution is valid. By comparing this with Haldane's formula, we note thatin a finite population the cost is larger by 2, although this difference is usuallyrelatively small.

POPULATION GENETICS 49
Since Haldane's original formulation on this subject, a number of papers havebeen published criticizing it. However, Haldane based his principle of cost ofnatural selection on his deep consideration of the ecology of the living species,as well as on their genetics and evolution. In our opinion, nothing biologicallysignificant has been added to Haldane's original papers [19], [20] by thesecriticisms. Meanwhile, further developments of Haldane's principle of the costhave been made by Kimura and Crow [33], Crow [9], Felsenstein [14], andNei [50].
3. Neutral mutation-random drift theory as the first approximation
It is customary in the literature of molecular evolution to ascribe amino aciddifferences of homologous proteins simply to "accepted point mutations."From our standpoint, however, one amino acid difference is the result of atleast one mutant substitution in which a rare molecular mutant increases itsfrequency and finally spreads to the whole species. Not only a large number ofgenerations are involved for such a substitution, but also a significant amountof substitutional load is imposed if it is carried out by natural selection. Also,such a mutant represents a lucky minority among a large number of mutantsthat actually occur in the population. The majority of mutants are lost fromthe population within a small number of generations [15], [36]. It is often notrealized that this applies not only to deleterious and selectively neutral mutants,but also to advantageous mutants unless the advantage is very large.When the rate of molecular evolution is analyzed from such standpoint, we
find two salient features in it. One is a remarkable uniformity for each moleculeand the other is a very high rate for the total DNA.The remarkable uniformity of the evolutionary rate is particularly evident
when we analyze amino acid substitutions in hemoglobins among diverse linesof vertebrate evolution [29].
Figure 1 illustrates the amino acid differences of hemoglobin a between carpand four mammalian species together with their phylogeny. It may be seen that,with respect to this molecule, the mammals have diverged among themselvesless than the group has diverged from carp. Taking into account the estimatedtime since divergence, we obtain a rate of amino acid substitution k,4 of ap-proximately 10-9 per amino acid site per year. That the rate of substitution isproportional to chronological time rather than the number of generations be-comes apparent when we compare the number of amino acid substitutions inthe two lines, one leading to the mouse and the other leading to man from theircommon ancestor B. The former is estimated to be only about 50 per centlarger than the latter. If the rate. of substitution is proportional to the numberof generations, the number of substitutions in the line leading to the mouseshould be larger by a factor of some 40 or so. Extensive calculations based onvarious comparisons involving j8 hemoglobin and lamprey globin as well as ahemoglobin reveal the remarkable uniformity of the rate of amino acid substi-

50 SIXTH BERKELEY SYMPOSIUM: KIMURA AND OHTA
400 ADEVONIAN
0 5N
t CARBONIFEROUS
270PERMIAN
225TRIASSIC
1808 JURASSIC
135CRETACEOUS
BT0
0~~0
Carp Mouse Rabbit Horse Human
FIGURE 1A phylogenetic tree of carp and four mammalian species together with geologictime scale. Numbers of different amino acid sites with respect to the a chain of
hemoglobin are also given for various comparisons.
tution in vertebrate evolution, always giving approximately k.. = 10-9 peramino acid site per year. Particularly noteworthy, in this context, are the re-sults obtained when the human ,B chain is compared with the human, mouse,rabbit, horse, bovine, and carp a chains. As shown in Table II, relative to the,B chain these a chains have differentiated almost equally. It is remarkable thatthe two structural genes coding for the a and B chains, after their origin byduplication, have diverged from each other independently and to the same

POPULATION GENETICS 51
TABLE II
FRACTIONS OF DIFFERENT AMINO ACID SITES WITH RESPECT TOCOMPARISONS BETWEEN a AND 13 HEMOGLOBIN CHAINS
Comparison Fraction of different sites
Human ,8-Human a 75/139Human ,8-Mouse a 75/139Human ,6-Rabbit a 79/139Human 13-Horse a 77/139Human ,8-Bovine a 76/139Human ,8-Carp a 77/139
extent, whether we compare a and ,B chains taken from the same organism(man) or from two different organisms (man and carp) which have evolvedindependently for some 400 million years.The uniformity of the rate as well as the fortuitous nature of amino acid
substitution in evolution are also evident in cytochrome c. In this case, however,the rate per year is about one third that of the hemoglobins (Figure 2). InFigure 2 note that, compared to the wheat, the various animals have differen-tiated to about the same extent. The estimates of the rate of amino acid sub-stitutions are now available for several proteins [38], [11]. According to Kingand Jukes, the average rate is 1.6 X 10⁻⁹ per amino acid site per year, or usingthe terminology proposed by Kimura [29], it is 1.6 paulings (one pauling stand-ing for the substitution rate of 10-9 per site per year).
Next, let us examine the second characteristic, namely, the very high overallrate of mutant substitution. In mammals (including man), the total number ofnucleotide sites making up the haploid DNA is roughly 3 X 10⁹. Not all ofthem may code for proteins but as long as they are self reproducing entities,they are members of the genome in a broad sense. There are also "repeatingsequences" whose function is not understood at the moment. In some speciessuch as in the mouse they amount to as much as 40 per cent of the total DNA[2]. In the following discussion we will disregard such sequences, for this willnot alter our conclusion.
If we take 1.6 X 10⁻⁹ as the average substitution rate per amino acid site(per year) in cistrons, this corresponds roughly to the substitution rate of 6.3 X10⁻¹⁰ per nucleotide site in which synonymous mutations are taken into account.Extrapolating this to the total nucleotide sites, the rate of mutant substitutionamounts to roughly two per haploid DNA per year. Then, for mammals whichtake three years for one generation, the rate of mutant substitution amountsto some half dozen per generation.Comparing this figure with Haldane's earlier estimate of 1/300, we note that
it is unbelievably high. In fact, if the majority of such substitutions are carriedout by natural selection and if each substitution entails a load of about 30, thetotal load per generation is 180.

52 SIXTH BERKELEY SYMPOSIUM: KIMURA AND OHTA
Wheat Fruit Fly Tuna Chicken Horse Human
42/107
40/103
38/104
38/104
35/104FIGURE 2
A phylogenetic tree and fraction of different amino acid sites with respect tocytochrome c of wheat and various animals.
This means that in order to carry out independent gene substitutions at thisrate and still maintain the same population number, each parent must leavee180 or about 1078 offspring for only one of them to survive. It is obvious that nomammalian species can stand such a heavy load of substitution. This reasoningled one of us [27] to put forward for the first time the neutral mutation-randomdrift theory as the main cause of molecular evolution. For neutral mutants,there is no selection, and hence, no genetic load.
Since then, models assuming truncation selection were proposed to avoid theheavy load of substitution [63], [42]. With very small (yet effective) selectiveadvantage, mutant substitution can be carried out at a high rate in such modelswithout excessive substitutional load. However, these models encounter thesame kind of difficulty as the ordinary selection model when we try to explainthe constancy of the evolutionary rate of cistrons. In addition, the assumption
POPULATION GENETICS 53
of a very small selective advantage requires a very high production of suchmutants per generation in order to carry out substitutions at a high rate. Themain reason for this is that the probability of fixation of such mutants is verylow. To see this point more quantitatively, let us consider a mammalian specieshaving an effective population number of 5 X 10⁴ with actual populationnumber possibly much larger. This is a realistic value for effective populationsize of mammals having a large body size and a generation time of three years.
Let us suppose that the selective advantage of the mutants is s = 0.001.Then, putting k = 6, N. = 5 X 10⁴, and s = 10- in formula (6) and solvingfor v, we get v = k/4N, s = 3/100. This means that in order to carry out mutantsubstitution at the rate of six per generation, the mutation rate for such ad-vantageous mutations must be three per cent per gamete. This is comparableto the total rate for lethal and semilethal mutations per gamete. If k is larger,or if either N. or s is smaller, a higher value for v is required. We believe thatsuch a high rate of production of advantageous mutations is unlikely. Thesemodels even seem to contradict the principle of adaptive evolution, since themodels require that advantageous mutations occur under rapidly changingenvironments and also under constant environments at an equal rate (providedthat N. is the same).The contrast between the hypothesis of neutral substitution and that of
adaptive substitution becomes quite pronounced when we try to interpret a largedifference in evolutionary rate between fibrinopeptides and histones. It is esti-mated that fibrinopeptides evolved some 1500 times as fast as histones [45].According to the neutral theory, a majority of amino acid substitutions infibrinopeptides is selectively neutral, while in histones virtually all mutationsare deleterious. On the other hand, under the adaptive substitution theory,as pointed out by Dr. Sewall Wright (personal communication), one mighthave to make the following interpretation: one particular amino acid sequencein histone is so perfect that any mutation is deleterious, irrespective of changesin the rest of the organism, while in fibrinopeptides there is so much functionaldependence on other evolving molecules that mutations have been 1500 timesas likely to be favorable compared to histone during the course of evolution.This view appears to encounter difficulty in explaining the uniformity of sub-stitution rate. Also, it appears to contradict the fact that the function of fibrino-peptides is nonspecific [53].An additional example that is instructive in this context is the rapid evolu-
tionary change observed in the middle portion of the proinsulin molecule. Thismolecule is a precursor of insulin and consists of three parts, A chain, B chain,and a middle segment connecting the two. When active insulin is formed, themiddle segment (amounting to roughly one third of the total in length) is re-moved. According to Nolan, Margoliash, and Steiner [52], bovine proinsulindiffers from porcine proinsulin with respect to the middle segment by about50 per cent in structure, but only by two residues with respect to the remainingportion. Assuming that bovine and pig lines were separated about 8 X 10⁷

54 SIXTH BERKELEY SYMPOSIUM: KIMURA AND OHTA
years ago (note that bovine, pig, and human have differentiated from eachother to the same extent with respect to hemoglobin a and (3 chains), we getabout kaa = 4.4 X 10⁹ as the rate of amino acid substitution per year in thismiddle segment. This is not very different from the rate in fibrinopeptides. Onthe other hand, the corresponding evolutionary rate is estimated to be aboutkaa = 0.4 X 10-i for insulin A and B [45]. It is interesting that the rate ofsubstitution is very high in this middle segment which appears to be functionallyunimportant.
This example shows clearly that the rate of amino acid substitution in evolu-tion can be very different in different parts of a molecule. Recently, Fitch andMarkowitz [16] carried out a detailed statistical analysis of evolutionary changeof cytochrome c and arrived at the important conclusion that in this moleculeonly about 10 per cent of the amino acid sites (codons) can accept mutations atany moment in the course of evolution. They called such codons the concom-itantly variable codons. This method of analysis was applied to the hemoglobinsby Fitch [17], who found that the number of concomitantly variable codons("covarions" in short) is about 50 in the mammalian alpha hemoglobin genes.Furthermore, he has noted the remarkable fact that if the rates of mutantsubstitution in evolution are calculated only on the basis of covarions, hemo-globin, cytochrome c, and fibrinopeptide A are all evolving at roughly the samerate.
Therefore, we believe that the neutral mutation-random drift theory is muchmore plausible, as a scientific hypothesis, than the conventional positive selec-tion model in explaining the great majority of amino acid substitutions inevolution.The basic idea of our neutral mutation-random drift theory as succinctly
reviewed by Maynard Smith [43] is as follows. At each cistron, a large fractionof mutations are harmful and they will be eliminated by natural selection. Asmall but significant fraction is selectively neutral and their fate is controlledby random frequency drift. The main cause of molecular evolution is thusrandom fixation of neutral mutants. The fraction of such neutral mutationsdiffers from cistron to cistron depending on the functional requirement of theprotein molecule. Favorable mutations may occur, and although they areextremely important in adaptive evolution, they are so rare that they influencevery little the estimates of the rate of amino acid substitution.
4. Nearly neutral mutations and constancy of evolutionary rate
In the foregoing sections we regarded mutants as neutral if their selectioncoefficients s are so small that 14N. 8s is much smaller than unity. It is likelythat in reality the borderline between neutral and deleterious mutations is notdistinct but, rather, continuous. Clearly, many amino acid substitutions inproteins are deleterious, and we need to clarify the relationship between neutraland deleterious amino acid substitutions in molecular evolution. But since the

POPULATION GENETrCS 55
overall fitness of a mutant consists of a great many components, it is hard tobelieve that neutral and deleterious mutations are distinctly separated.
For nearly neutral mutations having a slight advantage or disadvantage (butnot necessarily 14N o1 << 1), the rate of evolutionary substitution is determinednot only by the mutation rate but also by such factors as effective populationnumber N. and selection coefficient of the mutant s. It is convenient, for thefollowing treatment, to express the fixation probability given by formula (2)as u(s) indicating its dependence on s. Figure 3 illustrates the fixation prob-ability as a function of 4N. s. For example, as compared with a completelyneutral mutant, a disadvantageous mutant having 4N. s = -2 has about onethird probability of eventual fixation, while a mutant with 4Nes =-1 hasabout three fifths probability of fixation.
4N4s- ~~~~FIGURE 3
Probability of ultimate fixation of a mutant as a function of 4Ne s, where N. s=pr oduct of effective population size and selective advantage.

56 SIXTH BERKELEY SYMPOSIUM: KIMURA AND OHTA
When we consider the rate of nucleotide substitution in evolution, we musttake into account all mutations that have finite chance of eventual fixation.Thus, the evolutionary rate is the sum of the product of the mutation rate andthe corresponding fixation probability of the mutant over all possible kinds ofmutations, that is,
(9) k = 2N f|/N u(S)v(S) ds,where u(s) and v(s) are the mutation rate and fixation probability as functionsof selection coefficient s, and we take into account all the mutants whose N. sranges from -4 to +4. This integral has been called the "effective neutralmutation rate" by Ohta and Kimura [57].
Actually, however, the selection coefficient may not remain constant overa very long period, but may fluctuate from generation to generation due torandom fluctuation in environmental conditions. In such a case, if the varianceV. is larger than the absolute value of the mean selection coefficient 19!, thefixation probability of the mutant, even if it is selected, does not differ greatlyfrom that of a neutral mutant [54]. This must, at least partly, contribute toincreasing the frequency of "nearly neutral mutations."
Let us examine more fully the problem of whether the evolutionary rate ofcistrons is really proportional to the simple chronological time. As shown inthe previous section, the evolutionary rate of individual cistron is mostly uni-form for various lines over vast geologic time. However, some significant devia-tions from this rule have been reported. For example, insulins evolved muchfaster in the line leading to guinea pig than in other lines. King and Jukes [38]estimated that the evolutionary rate of insulins is 5.31 X 10⁻⁹ per amino acidper year from comparisons between guinea pig and other organisms, but only0.33 X 109 from comparisons among the other mammals. Another example,although less distinct, is the evolutionary rate of hemoglobins in lower primates.As pointed out by Zuckerkandl and Pauling [67], Buettner-Janusch and Hill[3], and Nolan and Margoliash [51], hemoglobins seem to have evolved, slightlyfaster in lower primates, such as lemur and tree shrew, than other mammals.
In order to analyze such variations statistically, we have estimated thevariance in evolutionary rates of hemoglobins and cytochrome c by takingindependent comparisons among relatively close organisms. The comparisonsamong remote species available are not numerous, and also, the deviationsappear to be somehow cancelled if one makes very remote comparisons.
Seven independent and closely related comparisons such as monkey-mouse,human-rabbit, horse-bovine (fetal), human a sheep, and so forth, have beenchosen for ,B type hemoglobin from Dayhoff [11]. The substitution rate per yearka was computed for each comparison and the variance among seven kaa valueswas obtained. On the other hand, the expected variance is estimated by
(10) j-d4T2(j - P)f.
POPULATION GENETICS 57
where pd and nTh are, respectively, the averages of Pd (fraction of different aminoacids) and n. (total number of amino acid sites per protein compared), and Tis the harmonic mean of the time since divergence T. Similarly, five independentcomparisons were chosen for a type hemoglobin and seven comparisons forcytochrome c to calculate observed and expected variances in the rates ofsubstitution.Whether the observed variance is significantly larger than expected was
tested by the F test. It turned out that the F value is highly significant for0 type hemoglobins and cytochrome c, but not for the hemoglobin a. The esti-mated time since divergence may not be accurate, and this will inflate theobserved variance somewhat, but this effect should not be very large. Fordetails see [57]. We conclude, then, that the variations in evolutionary ratesamong highly evolved animals are sometimes larger than expected from chance.However, the uniformity of the evolutionary rate is still valid as a firstapproximation.
In the remainder of this section, we shall examine theoretically the problemof constancy of the rate of substitution per year with respect to nearly neutralmutations. Let us denote by g the generation time in years and by v the muta-tion rate per gamete per generation. Then, for completely neutral mutations,the evolutionary rate per year is,(11) ki = vlg.If most of the gene substitutions are selectively advantageous, then(12) ki = 4Nesv/g.On the other hand, if most of the amino acid substitutions are slightly deleterious(s < 0) such that IN.sl < 1, then(13) k1 c: v/Neg,since the fixation probability is negatively correlated with IN. sl as in Figure 3.
If v/g (mutation rate per year) is really constant among various lines of higherorganisms, the simple neutral theory of the previous section is appropriate toexplain the observed uniformity of the evolutionary rate. On the other hand,if v, the mutation rate per generation, rather than vlg, is generally constant,slightly deleterious mutations are more likely to be the main source of genesubstitution as suggested by Ohta and Kimura [57]. They pointed out thatorganisms having a larger body size tend to have a smaller population numberand longer generation time and vice versa. Hence, the value of N. g in formula(13) could be nearly constant among various lines of organism.
Also, from formula (12), we can easily see that the adaptive gene substitutionwill create significant variations in the evolutionary rate, if N. and g are in-versely correlated. Thus, we conclude again that mutant substitutions at themolecular level are mostly selectively neutral or nearly so (very slightly dis-advantageous) and that Darwinian (definitely adaptive) mutant substitutionsshould represent only a minor fraction,

58 SIXTH BERKELEY SYMPOSIUM: KIMURA AND OHTA
5. Molecular biometry of amino acid composition
The amino acid composition of proteins and the base composition of DNAare products of molecular evolution. Since the nucleotide sequence of a genespecifies the amino acid sequence of a protein; in other words, because of"colinearity" between the two sequences, it is clear that the amino acid com-position of proteins reflects the base composition of DNA and vice versa.As early as 1961, when the three letter coding system was not yet exactly
known, Sueoka [62] noticed a correlation between the frequency of a particularamino acid and base frequency, such as between alanine and G-C content. AlsoJukes [22] estimated the base composition of hemoglobin genes from theiramino acid composition. Since then, the DNA code words have been completelydeciphered, and we are able to carry out such analyses on a firmer basis.Kimura [26] showed that average amino acid composition of proteins can be
predicted fairly well from the knowledge of the genetic code and by assumingrandom arrangements of the four kinds of bases within a cistron. This approachwas improved by King and Jukes [38] who estimated frequencies of four bases(A, U, G, C) directly from the amino acid composition and then used thesefrequencies for their calculation of the expected amino acid composition. Withthis improvement, the overall agreement between the observed and the expectedcompositions becomes much better. The only exception is arginine whose ob-served frequency is only half as high as expected under random arrangement ofbases.The method was further refined by Ohta and Kimura [55], but they arrived
at the same conclusion as King and Jukes with respect to the deficiency ofarginine. In addition, they developed a method of estimating base frequenciesof individual cistron using data on amino acid composition of its protein. Atpresent it is not feasible by means of biochemical method to measure directlythe base composition of individual genes. Thus, the refined method of estimatingbase frequencies of individual cistron as developed by Ohta and Kimura hassome use in the study of molecular evolution.Now, by inspection of the code table (Table I), one finds that the base com-
position at the first and second positions of the codon could be estimated fromthe amino acid composition. However, with respect to the third position thisappears to be impossible because of high "degeneracy." (For example, fourcodons having G in both the first and second positions always code for Glyindependent of the third position.)
Let us examine these points in more detail. Consider the second position,since the estimation is simplest in this position. The relative frequency of A(adenine) can be estimated without error by adding the relative frequencies oftyrosine, histidine, glutamine, asparagine, lysine, aspartic acid, and glutamicacid; in other words, by adding amino acids occurring in the column underletter A in the table (but disregarding two terminating codons). In symbols,

POPULATION GENETICS 59
(14) A2 = - ([Tyr] + [His] + [Gln] + [Glu] + [Asp] + [Asn] + [Lys]),n
where n is the total number of amino acids composing a protein, and [Tyr], andso forth, denote the number of tyrosine, and so forth, within the protein. Simi-larly, the sum of the frequencies of G and C (usually called "G-C content")can be estimated without error by
(15) G2 + C2 = 1 ([Ser] + [Pro] + [Thr] + [Ala] + [Cys]+ [Trp] + [Arg] + [Gly]).
The frequency of U (uracil) is then given by 1 - A2 - G2 -C2.Separation of G2 from C2, however, can only be achieved indirectly, since
serine contributes both to C and G. One way of achieving this is through itera-tion. Of the six codons of serine, four contribute to C and the remaining to G.By assuming that base frequencies at the first and second positions of codonsare statistically independent, we estimate the frequency of the group of fourserine codons having C in their second position by
(16) [Ser], = 2(U1 X C2)+ (Ser],2(lX 02) + (AlX G2) [e]where Ul is the frequency of U in the first position. The frequency of a groupof two codons having G in their second position is then
(17) [Ser12= [Ser] - [Ser]i.This type of separation is required to estimate all the base frequencies in thefirst position. For example, leucine enters both in U and C and we must separatesix codons coding for leucine into two groups. The frequency of the group of twocodons having U in the first position may be estimated by
(18) [Leu]1 = U1 + 201 [Leu].
Using this type of separation method and iteration by a computer, we haveestimated the base frequencies in the first position, as well as G and C in thesecond position. This is one place where professional statisticians can developa much better method of estimation.At any rate, from the analysis of 17 vertebrate proteins, we obtain results
that indicate that the base composition is generally different in the first andsecond position of the codon. Also, the results on the second position showedclearly that the base composition of the informational strand of DNA (that is,the strand actually used for transcription) is different from that of its comple-mentary strands. How such differences evolved, we believe, is an interestingand puzzling problem that needs further investigation. Previously, King andJukes [38] reported that G + A is not generally equal to C + U, indicating

60 SIXTH BERKELEY SYMPOSIUM: KIMURA AND OHTA
some nonrandomness in base arrangement. Our analyses confirmed their re-sults, and in particular, we found the relation A > U (in terms of RNA code).Also, the frequency distribution of G-C content at the second position showsthat its mean is approximately 42 per cent, agreeing well with the results ofchemical analysis of vertebrate nuclear DNA. However, its variance is abouttwo to three times larger than that expected under random arrangement ofbases, suggesting some nonrandomness.Such nonrandomness in base composition and arrangement must be, at least
partly, due to the functional requirement of each cistron (gene). In other words,cistrons must keep their own characteristic base composition for their function.Molecular evolution by nucleotide substitution must proceed without impairingsuch functional requirements, otherwise mutation cannot be tolerated bynatural selection (that is, cannot be selectively neutral). It is natural to think,then, that there should be some restriction or nonrandomness in the patternof amino acid substitutions in evolution.
Actually, Clarke [5] and Epstein [13] reported some nonrandomness inamino acid substitutions. They pointed out that the substitutions betweensimilar amino acids are more likely to occur than those between dissimilar ones.Clarke considered this fact to indicate Darwinian (that is, positively selected)substitutions. However, a much more plausible interpretation is that it impliesnon-Darwinian (that is, neutral) substitutions, as claimed by Jukes and King[23]. They pointed out that important adaptive changes should contain sub-stitutions between dissimilar amino acids.Let us investigate the pattern of amino acid substitution in the evolutionary
change of proteins. As we have mentioned already, the average amino acidcomposition of proteins can be predicted fairly well by the knowledge of thegenetic code and by assuming random arrangement of nucleotide bases withinthe genes. However, there are some significant deviations. In particular, thearginine content is much smaller than expected. In order to determine thecause of arginine deficiency, Ohta and Kimura [59] used the transition prob-ability matrix method. It consists of a 20 X 20 matrix giving transition prob-abilities from any one of the 20 amino acids to any other during a unit lengthof time in evolution. It is desirable to construct such a matrix based on a largebody of data. However, as a preliminary attempt, we used the "mutation prob-ability matrix" of Dayhoff, Eck, and Park [12]. This matrix was constructedby counting the number of "accepted point mutations" among closely relatedsequences, amounting to 814 mutations, taken from cytochrome c, globins,virus coat proteins, chymotrypsinogen, glyceraldehyde 3-phosphate dehy-drogenase, clupeine, insulin, and ferredoxin (see [12], p. 75 for details).By comparing this matrix M with the corresponding random matrix R made
by allowing only single random base substitutions (using the code table), aclear difference was recognized. The difference reflects the differential survivalof amino acid substitutions. Most noteworthy is the deficiency of evolutionaryinput of arginine, and this indicates that mutation to arginine is largely selected

POPULATION GENETICS 61
against in evolution of proteins. It is interesting to note, in this context, thatarginine is substituted not infrequently for other amino acid among hemoglobinvariants found in human populations. The eigenvector of M reflects the approxi-mate amino acid composition used for the construction of this matrix [12]. Italso represents the equilibrium composition. In order to compare the two equi-librium compositions corresponding to M and R, we also computed the eigen-vector of R. Figure 4 illustrates the relationship between the two eigenvectors.We also examined the hypothesis that the actual amino acid composition of
proteins represents a quasi-equilibrium of neutral mutations. We compared the
10 *Ala
Lys * GlyoL *Val/ *Leu
0
0
ThrAsp /Ser
cn 5 *GIluWaJ Phe Asn * Pro
HisGlnP eIle
O Tyr *Arg*CYS
*Met*Trp
00 5 10
Eigen vector of RFIGURE 4
Graph showing relationship between eigenvector of M and that of R with re-spect to amino acid composition of an average protein.

62 SIXTH BERKELEY SYMPOSIUM: KIMURA AND OHTA
eigenvector of M with the observed amino acid composition. For the observedvalues we used the average values obtained from Smith's data [61]. He com-piled amino acid compositions of 80 proteins taken from various organismsincluding vertebrates, bacteria, and viruses. Figure 5 illustrates the relationshipbetween the observed and the equilibrium compositions. Agreement betweenthe two seems to be satisfactory, and there is no marked discrepancy with re-spect to Arg.Through these analyses we have been led to the view that the amino acid
composition of proteins is determined largely by the existing genetic code and
Gln+Glu
Asn+Asp10
. Ala
M Ser HisVly
U *CysLys
0 Arg
- Equ~lie ru rqec °0
0~~~~~* ~~~~Tyr* ePhe
0
Met eNHisTrp *~Cys
0 510Equilibrium frequency(,,%)
FIGURE 5
Graph showing relationship between observed and equilibrium amino acidcompositions.

POPULATION GENETICS 63
the random nature of base changes in evolution. Small but significant devia-tions from such expectation can be accounted for satisfactorily by assumingselective constraint of amino acid substitutions in evolution.
6. Evolutionary change of genes and phenotypes
Since Darwin, a great deal has been written about evolution at the pheno-typic level. However, it is only in the past few years that we have started tounderstand evolution at the molecular level.In the field of evolutionary genetics, consensus appears to have been reached
among leading evolutionists of the world (except possibly Sewall Wright) thatnatural selection is omnipotent and is the most prevailing factor for evolutionarychange. This orthodox view (formed under the dominating influence of R. A.Fisher) also asserts that neutral mutant genes are very rare if they ever exist,and random genetic drift is negligible in determining the genetic structure ofbiological populations, except possibly for the case of the colonization of a newhabitat by a small number of individuals-the founder effect (see Mayr [44]).The neutral mutation-random drift theory, therefore, would be an open
challenge to this view if it were concerned with the same subject. However, wemust realize that we are concerned here with changes in DNA base (and, there-fore, amino acid) sequences that may have no clear cut and straightforwardcorrespondence with phenotypic change. It is with respect to the level of in-formation macromolecules that random drift plays a dominant role in largepopulation as well as small.
In the present paper, we have mainly concerned ourselves with amino acidsubstitutions, but in addition to these, duplication of DNA segments must bevery important in evolution, although they occur much less frequently. Themain evolutionary significance of duplication lies in the fact that it allows oneof the duplicated segments to accumulate mutations and acquire a new func-tion, while another segment retains the old function necessary to survive throughthe transitional period. This idea, which goes as far back as the great Drosophilaworkers of the Morgan school (see Bridges [1]), has recently been much ex-tended by Ohno [53] in relation to vertebrate evolution. It is likely that manyevolutionary innovations owe their origin to gene duplications.
In addition to such positive change, duplication must have caused a greatdeal of degeneration of genetic material due to accumulation of mutants byrandom drift that would have been harmful before duplication but have becomeneutral after duplication [49], [58]. This should be taken into account whenwe consider functional organization of genetic material in higher organisms.It is a well-known fact that if we estimate the total number of genes in man bysimply dividing the total number of nucleotide pairs per haploid DNA (some3 X 109) by the average number of nucleotide pairs per cistron (assumingaround 500), a very large number, amounting to several million is obtained(see [47], [65]). On the other hand, considerations based on classical genetic

64 SIXTH BERKELEY SYMPOSIUM: KIMURA AND OHTA
analyses and mutational load lead us to the estimated gene number of some3 X 104 [48]. Ohta and Kimura [58] claim that such discrepancy can be under-stood by noting that, as a whole, degeneration after duplication is more fre-quent than progressive organization so that a large fraction of DNA is non-informational in the sense that the base arrangement therein is irrelevant tothe organism's life.
Thus, the correspondence between phenotype and nucleotide sequence must,in general, be an extremely complicated one. It is possible that both loss offunction and acquisition of a new function must occur alternately at the samesite, and the adjustments involved must be intricate beyond our comprehension.For example, some mutants which were originally neutral and fixed by randomdrift might later become essential for the organism, after a series of gene sub-stitutions by natural selection, whose very advantage presupposes the existenceof originally neutral mutants.The neutral mutation-random drift theory allows us to make a number of
predictions, so we shall present some of them. First, through random fixationof selectively neutral mutants, genes of "living fossils" must have undergoneas many nucleotide (and amino acid) substitutions as the corresponding genesin more rapidly evolving species. Thus, underneath the constant morphologythat has been kept unchanged by incessant action of natural selection forhundreds of millions of years, a great flow of neutral or nearly neutral mutantstransforms the base sequence of genes tremendously in any organism. Bystudying a suitable molecule and using the observed changes as an "evolutionaryclock," and analyzing its information by sensitive biometrical methods withthe aid of computers, we hope to understand more thoroughly the early historiesof life and living organisms. Also, the method of "minimum evolution" byCavalli-Sforza and Edwards (see [4]) should have more relevance at the molec-ular than phenotypic level, as exemplified by the MBDC (minimum base dif-ference per codon) method of Jukes [22].Second, we should find in every species (with sufficiently large population
size), ample evidence for molecular evolution in progress in the form of proteinpolymorphism. Although accompanied by a spurious effect of balancing selec-tion due to associative overdominance, we believe that polymorphic allelesthemselves are selectively neutral [56]. In this sense, protein polymorphismsare transient rather than permanent. However, for our ephemeral existence,they are almost permanent, persisting millions of years before disappearing.This view, first put forward by one of us [27], has been revised and extendedby Kimura and Ohta [37]. One remark that we would like to make here is thatthe alternative model assuming overdominance plus truncation selection suchas the one proposed by Sved, Reed, and Bodmer [64], although widely acceptedat the moment, contains several difficulties. First, there is no assurance thatnatural selection mimics artificial selection in such a way that the number ofheterozygous loci is counted and population is sharply divided into two groupsbased on such loci ([10], p. 307). Secondly, this model predicts that the rate of

POPULATION GENETICS 65
inbreeding depression decreases as the inbreeding coefficient increases, but thisis contrary to most observational results. Thirdly, according to recent work ofMukai and Schaffer [46], the broad sense heritability H2 with respect to fitnessis very low. They extracted chromosomes from a natural population of Dro-sophila melanogaster, and by making random heterozygotes, obtained H2 =0.002. Then, they showed by simulation experiments on a computer that withsuch low heritability, truncation selection at the phenotypic level is not effec-tive enough to explain a large occurrence of isozyme polymorphisms withoutcreating a considerable magnitude of genetic load.
Despite several criticisms (for example, [60], [6]), we believe that evidenceis growing in our favor in support of the neutral mutation-random drift theoryof molecular evolution and polymorphism. Mather [41], commenting on theneutral theory, says that its acceptability depends on the "credibility of selec-tive neutrality." However, the history of the development of quantum me-chanics amply indicates that predictability and consistency are very much moreimportant than credibility for a scientific theory to be valid. In fact, it showsthat an apparently incredible theory can still be successful in science. Webelieve that our theory has now reached the stage where it should be put tothorough, critical test to determine its validity.
K K K K KWe would like to thank Doctors K. Mayeda, J. L. King, T. Jukes, and S.
Wright for valuable comments and criticisms.
REFERENCES
[1] C. B. BRIDGES, "Genes and chromosomes," The Teaching Biologist, Nov. (1936), pp.17-23.
[2] R. J. BRIYrmN and D. E. KOHNE, "Repeated segments of DNA," Sci. Amer., Vol. 222(1970), pp. 24-31.
[3] J. BuETrNER-JANuscH and R. L. HILL, "Evolution of hemoglobin in primates," EvolvingGenes and Proteins (edited by V. Bryson and H. J. Vogel), New York, Academic Press,1965, pp. 167-181.
[4] L. L. CAVALI-SFORZA and A. W. F. EDWARDS, "Phylogenetics analysis: Models andestimation procedures," Amer. J. Hum. Genet., Vol. 19 (1967), pp. 233-257.
[5] B. CLARKE, "Selective constraints on amino acid substitutions during the evolution ofproteins," Nature, Vol. 228 (1970), pp. 159-160.
[6] , "Darwinian evolution of proteins," Science, Vol. 168 (1970), pp. 1009-1011.[7] F. CRICK, Of Molecules and Men, Seattle and London, University of Washington Press,
1967.[8] J. F. CROW, "Molecular genetics and population genetics," Proceedings of the Twelfth
International Congress on Genetics, Idengaku, Fukyukai, Mishima, Shizuoka-ken, Japan,1969, Vol. 3, pp. 105-113.
[9] , "Genetic loads and the cost of natural selection," Mathematical Topics in Popu-lation Genetics (edited by K. Kojima), Berlin-Heidelberg, Springer-Verlag, 1970, pp. 128-177.

66 SIXTH BERKELEY SYMPOSIUM: KIMURA AND OHTA
[10] J. F. CROW and M. KIMURA, An Introduction to Population Genetics Theory, New York,Harper and Row, 1970.
[11] M. 0. DAYHOFF, Atlas of Protein Sequence and Structure, Vol. 4, Silver Spring, Md.,National Biomedical Research Foundation, 1969.
[12] M. 0. DAYHOFF, R. V. ECK, and C. M. PARK, "A model of evolutionary change in pro-teins," Atlas of Protein Sequence and Structure, Vol. 4, Silver Spring, Md., National Bio-medical Research Foundation, 1969, pp. 75-83.
[13] C. J. EPSTEIN, "Non-randomness of amino acid changes in the evolution of homologousproteins," Nature, Vol. 215 (1967), pp. 355-359.
[14] J. FELSENSTEIN, "On the biological significance of the cost of gene substitution," Amer.Nat., Vol. 105 (1971), pp. 1-11.
[15] R. A. FISHER, The Genetical Theory of Natural Selection, Oxford, Clarendon Press, 1930.[16] W. F. FITCH and E. MARKowITz, "An improved method for determining codon variability
in a gene and its application to the rate of fixation of mutations in evolution," Biochem.Genet., Vol. 4 (1970), pp. 579-593.
[17] W. F. FITCH, "Evolutionary variability in hemoglobins," Haematologie und Bluttrans-fusion (edited by H. Martin), Munich, J. F. Lehmanns Verlag, in press.
[18] J. B. S. HALDANE, "A mathematical theory of natural and artificial selection, Part 1,"Trans. Camb. Phil. Soc., Vol. 23 (1924), pp. 19-41.
(19] "The cost of natural selection," J. Genet., Vol. 55 (1957), pp. 511-524.[20] , "More precise expressions for the cost of natural selection," J. Genet., Vol. 57
(1960), pp. 351-360.[21] ,"A defense of beanbag genetics," Perspect. Biol. Med., Vol. 7 (1964), pp. 343-359.[22] T. H. JuKEs, "Some recent advances in studies of the transcription of the genetic mes-
sage," Advan. Biol. Med. Phys., Vol. 9 (1963), pp. 1-41.[23] T. H. JuKEs and J. L. KING, "Deleterious mutations and neutral substitutions," Nature,
Vol. 231 (1971), pp. 114-115.[24] M. KIMuRA, "Some problems of stochastic processes in genetics," Ann. Math. Statist.,
Vol. 28 (1957), pp. 882-901.[25] "Diffusion models in population genetics," J. Appl. Probability, Vol. 1 (1964), pp. 177-
232.[26] , "Genetic variability maintained in a finite population due to mutational produc-
tion of neutral and nearly neutral isoalleles," Genet. Res., Vol. 11 (1968), pp. 247-269.[27] "Evolutionary rate at the molecular level," Nature, Vol. 217 (1968), pp. 624-626.[28] , "The number of heterozygous nucleotide sites maintained in a finite population
due to steady flux of mutations," Genetics, Vol. 61 (1969), pp. 893-903.[29] ,"The rate of molecular evolution considered from the standpoint of population
genetics," Proc. Nat. Acad. Sci. U.S.A., Vol. 63 (1969), pp. 1181-1188.[30] , "The length of time required for a selectively neutral mutant to reach fixation
through random frequency drift in a finite population," Genet. Res., Vol. 15 (1970), pp.131-133.
[31] , "Theoretical foundation of population genetics at the molecular level," Theor.Pop. Biol., Vol. 2 (1972), pp. 174-208.
[32] M. KIMuRA and J. F. CROW, "The number of alleles that can be maintained in a finitepopulation," Genetics, Vol. 49 (1964), pp. 725-738.
[33] , "Natural selection and gene substitution," Genet. Res., Vol. 13 (1969), pp. 127-141.
[34] M. KIMURA and T. MARUYAMA, "The substitutional load in a finite population," Heredity,Vol. 24 (1969), pp. 101-114.
[35] M. KIMURA and T. OHrA, "The average number of generations until fixation of a mutantgene in a finite population," Genetics, Vol. 61 (1969), pp. 763-771.

POPULATION GENETICS 67
[36] , "The average number of generations until extinction of an individual mutant genein a finite population," Genetics, Vol. 63 (1969), pp. 701-709.
[37] , "Protein polymorphism as a phase of molecular evolution," Nature, Vol. 229(1971), pp. 467-469.
[38] J. L. KING and T. H. JuKEs, "Non-Darwinian evolution: random fixation of selectivelyneutral mutations," Science, Vol. 164 (1969), pp. 788-798.
[39] D. KOHNE, "Evolution of higher-organism DNA," Quart. Rev. Biophys., Vol. 33 (1970),pp. 327-375.
[40] C. D. LAIRD, B. L. MCCONAUGHY, and B. J. MCCARTHY, "Rate of fixation of nucleotidesubstitutions in evolution," Nature, Vol. 224 (1969), pp. 149-154.
[41] K. MATHER, "The nature and significance of variation in wild populations," Variationin Mammalian Populations (edited by R. J. Berry and H. N. Southern), New York,Academic Press, 1970, pp. 27-39.
[42] J. MAYNARD SmIm, " 'Haldane's dilemma' and the rate of evolution," Nature, Vol. 219(1968), pp. 1114-1116.
[43] , "The causes of polymorphism," Variation in Mammalian Populations (edited byR. J. Berry and H. N. Southern), New York, Academic Press, 1970, pp. 371-383.
[44] E. MAYR, Animal Species and Evolution, Cambridge, The Belknap Press of HarvardUniversity Press, 1963.
[45] P. J. McLAUGHLIN and M. 0. DAYHOFF, "Evolution of species and proteins: A timescale," Atlas of Protein Sequence and Structure (edited by M. 0. Dayhoff), Vol. 3, SilverSpring, Md., National Biomedical Research Foundation, 1969, pp. 39-46.
[46] T. MuKix and H. E. SCHAFFER, "Genetic consequences of truncation selection at thephenotypic level in Drosophila melanogaster," in preparation.
[47] H. J. MULLER, "Evolution by mutation," Bull. Amer. Math. Soc., Vol. 64 (1958), pp.137-160.
[48] , "The gene material as the initiator and the organizing basis of life," Heritagefrom Mendel (edited by R. A. Brink), Madison, University of Wisconsin Press, 1967,pp. 419-447.
[49] M. NEI, "Gene duplication and nucleotide substitution in evolution," Nature, Vol. 221(1969), pp. 40-42.
[50] , "Fertility excess necessary for gene substitution in regulated populations," Ge-netics, Vol. 68 (1971), pp. 169-184.
[51] C. NOLAN and E. MARGOLIASH, "Comparative aspects of primary structures of proteins,"Ann. Rev. Biochem., Vol. 37 (1968), pp. 727-790.
[52] C. NOLAN, E. MARGOLIASH, and D. F. STEINER, "Bovine proinsulin," Fed. Proc., Vol. 28(1969), p. 343.
[53] S. OHNO, Evolution by Gene Duplication, Berlin-Heidelberg, Springer-Verlag, 1970.[54] T. OHTA, "Fixation probability of a mutant influenced by random fluctuation of selection
intensity," Genet. Res., in press.[55] T. OHTA and M. KnmuRA, "Statistical analysis of the base composition of genes using
data on the amino acid composition of proteins," Genetics, Vol. 64 (1970), pp. 387-395.[56] , "Development of associative overdominance through linkage disequilibrium in
finite populations," Genet. Res., Vol. 16 (1970), pp. 165-177.[57] , "On the constancy of the evolutionary rate of cistrons," J. Mol. Evol., Vol. 1
(1971), pp. 18-25.[58] , "Functional organization of genetic material as a product of molecular evolu-
tion," Nature, Vol. 233 (1971), pp. 118-119.[59] , "Amino acid composition of proteins as a product of molecular evolution,"
Science, Vol. 174 (1971), pp. 150-153.[60] R. C. RICHMoND, "Non-Darwinian evolution: A critique," Nature, Vol. 225 (1970), pp.
1025-1028.

68 SIXTH BERKELEY SYMPOSIUM: KIMURA AND OHTA
[61] M. H. Smirm, "The amino acid composition of proteins," J. Theor. Biol., Vol. 13 (1966),pp. 261-282.
[62] N. SUEOKA, "Compositional correlation between deoxyribonucleic acid and protein," ColdSpring Harbor Symp. Quart. Biol., Vol. 26 (1961), pp. 35-43.
[63] J. A. SVED, "Possible rates of gene substitution in evolution," Amer. Nat., Vol. 102 (1968),pp. 283-292.
[64] J. A. SVED, T. E. REED, and W. F. BODMER, "The number of balanced polymorphismsthat can be maintained in a natural population," Genetics, Vol. 55 (1967), pp. 469-481.
[65] F. VoGEL, "A preliminary estimate of the number of human genes," Nature, Vol. 201(1964), p. 847.
[66] S. WmIGHT, "Evolution in Mendelian populations," Genetics, Vol. 16 (1931), pp. 97-159.[67] E. ZUCKERKANDL and L. PAULING, "Evolutionary divergence and convergence in pro-
teins," Evolving Genes and Proteins (edited by V. Bryson and H. J. Vogel), New York.Academic Press, 1965, pp. 97-166.