population reference bureau and hopkins population … · · 2018-03-19population reference...
TRANSCRIPT
Population Reference Bureau and Hopkins Population Center 5th Annual Symposium on Policy and Health
“The Effects of Military Deployment on Family Health”
Oct. 28, 2011 National Press Club, Washington, DC
David R. Segal, Professor of Sociology, and Director of the Center for Research on Military Organization, University of Maryland Robert W. Blum, William H. Gates Sr. Professor and Chair, Department of Population, Family and Reproductive Health, Johns Hopkins Bloomberg School of Public Health Cmdr. (Dr.) Gregory H. Gorman, U.S. Navy, Department of Pediatrics, Uniformed Services University and Walter Reed National Military Medical Center Valerie Maholmes, Director, Social and Affective Development/Child Maltreatment and Violence Program, Eunice Kennedy Shriver National Institute of Child Health and Human Development

The Demography of Military Families Symposium on Policy and Population Health
October 28, 2011
National Press Club, Washington DC
Sponsored by:
The Population Reference Bureau and The Hopkins Population Center
Dr. David R. Segal
Department of Sociology University of Maryland
2112 Art-Sociology Bldg. College Park, MD 20742
Center for Research on Military Organization

Figure 1. Participation in the US Armed Forces, 1801-2011 % of total US population in the armed forces
0%
1%
2%
3%
4%
5%
6%
7%
8%
9%
10%
1800 1820 1840 1860 1880 1900 1920 1940 1960 1980 2000
War of 1812 (1812-1815)
Mexican War (1846-1848)
Civil War (1861-1865)
World War I (1917-1918)
Spanish-American War (1898)
Korean War (1950-1953)
Vietnam War (1964-1973)
Gulf War (1991)
OEF & OIF (2001, 2003 - present)
World War II (1941-1945)
Sources: DoD Personnel and Military Casualty Statistics, 2000-2011 (http://siadapp.dmdc.osd.mil/personnel/MILITARY/miltop.htm) and the following U.S. Census Bureau publications: Historical Statistics of the United States: Colonial Times to 1970 (1975) (http://www.census.gov/prod/www/abs/statab.html), Historical National Population Estimates 1900-1999, Annual Estimates of the Resident Population for the United States, Regions, States, and Puerto Rico: April 1, 2000 to July 1, 2008 (http://www.census.gov/popest/states/NST-ann-est.html)
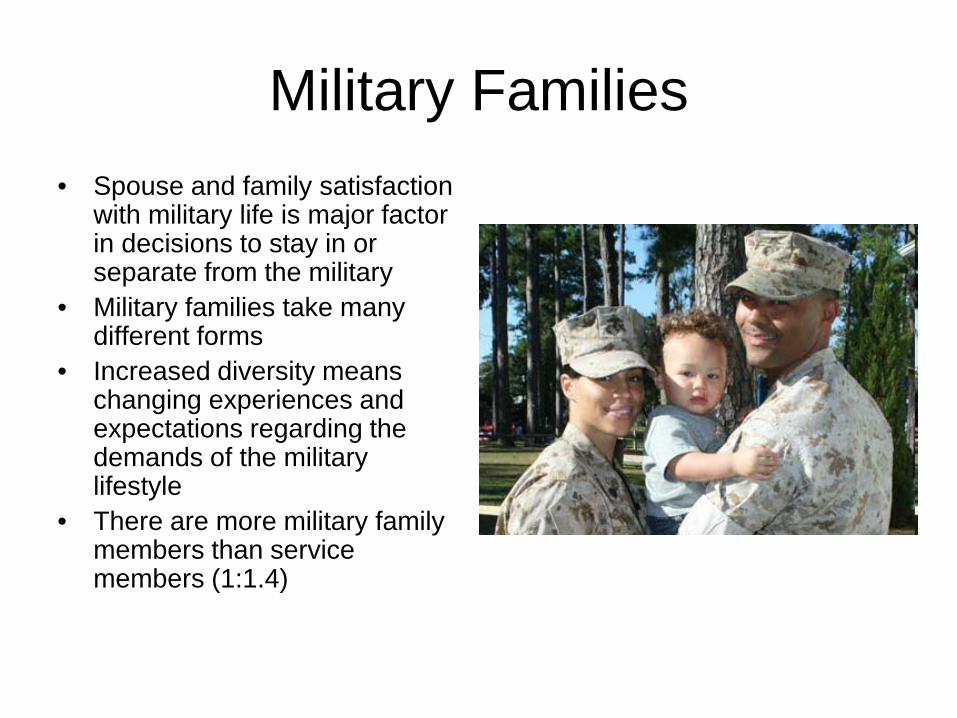
Military Families • Spouse and family satisfaction
with military life is major factor in decisions to stay in or separate from the military
• Military families take many different forms
• Increased diversity means changing experiences and expectations regarding the demands of the military lifestyle
• There are more military family members than service members (1:1.4)

Figure 2. Percent Married by Age and Sex for Military and Civilians in the Labor Force, 2009
Source: “Population Representation in the Military Services”, DoD 2009
0%
10%
20%
30%
40%
50%
60%
70%
80%
90%
100%
17 18 19 20 21 22 23 24 25 26 27 28 29 30 31 32 33 34 35 36 37 38 39 40 41 42 43 44 45+
Age (years)
Perc
ent M
arrie
d
Male Military Male Civilian Female Military Female Civilian
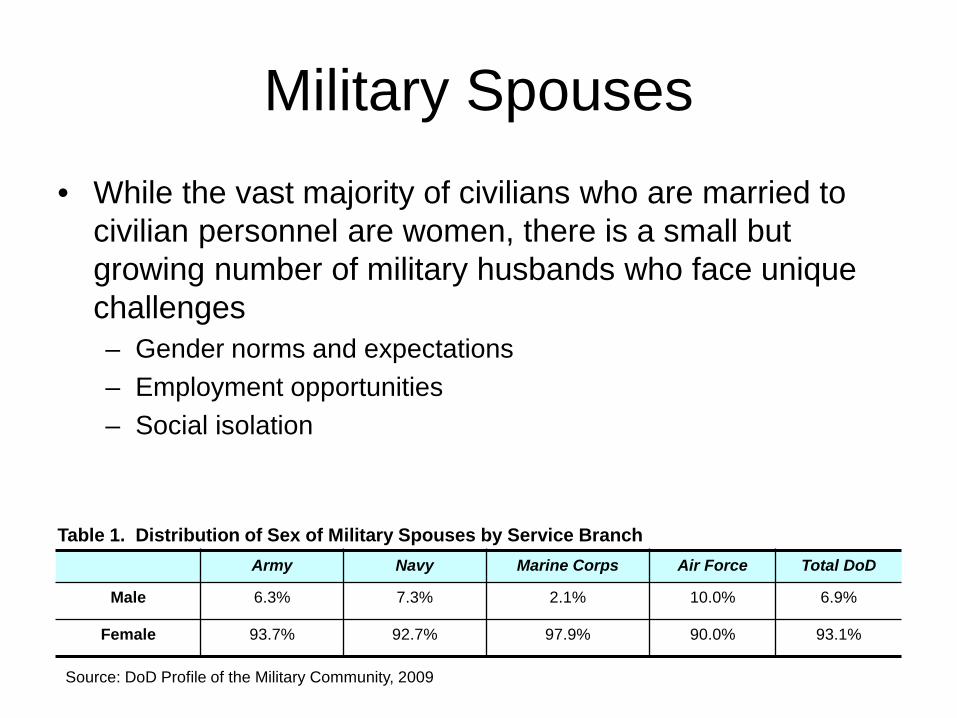
Military Spouses • While the vast majority of civilians who are married to
civilian personnel are women, there is a small but growing number of military husbands who face unique challenges – Gender norms and expectations – Employment opportunities – Social isolation
Army Navy Marine Corps Air Force Total DoD
Male 6.3% 7.3% 2.1% 10.0% 6.9%
Female 93.7% 92.7% 97.9% 90.0% 93.1%
Table 1. Distribution of Sex of Military Spouses by Service Branch
Source: DoD Profile of the Military Community, 2009
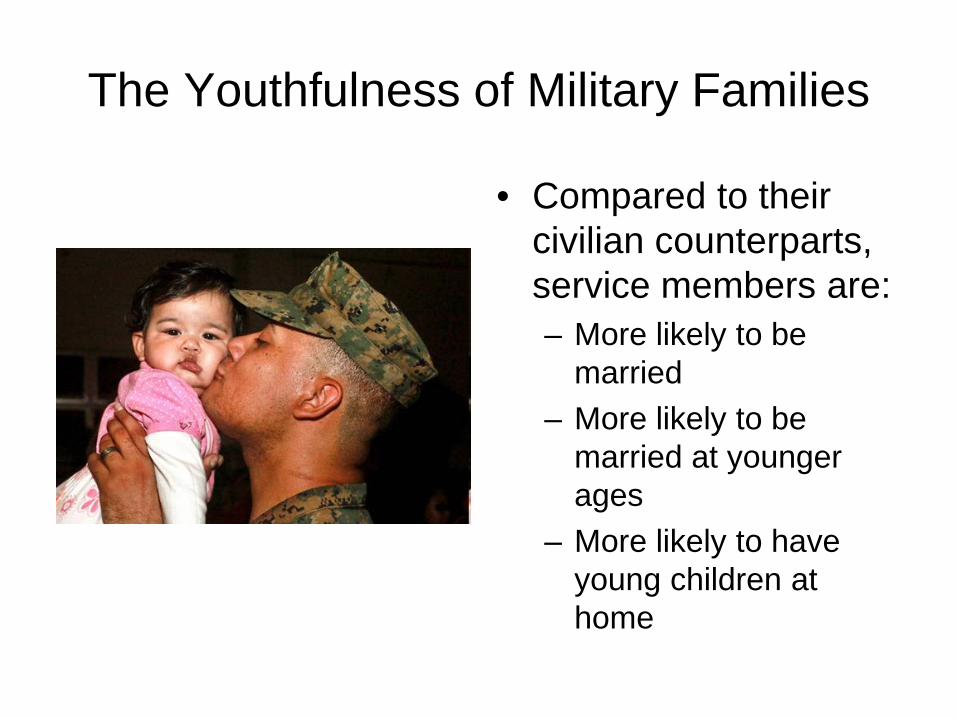
The Youthfulness of Military Families
• Compared to their civilian counterparts, service members are: – More likely to be
married – More likely to be
married at younger ages
– More likely to have young children at home
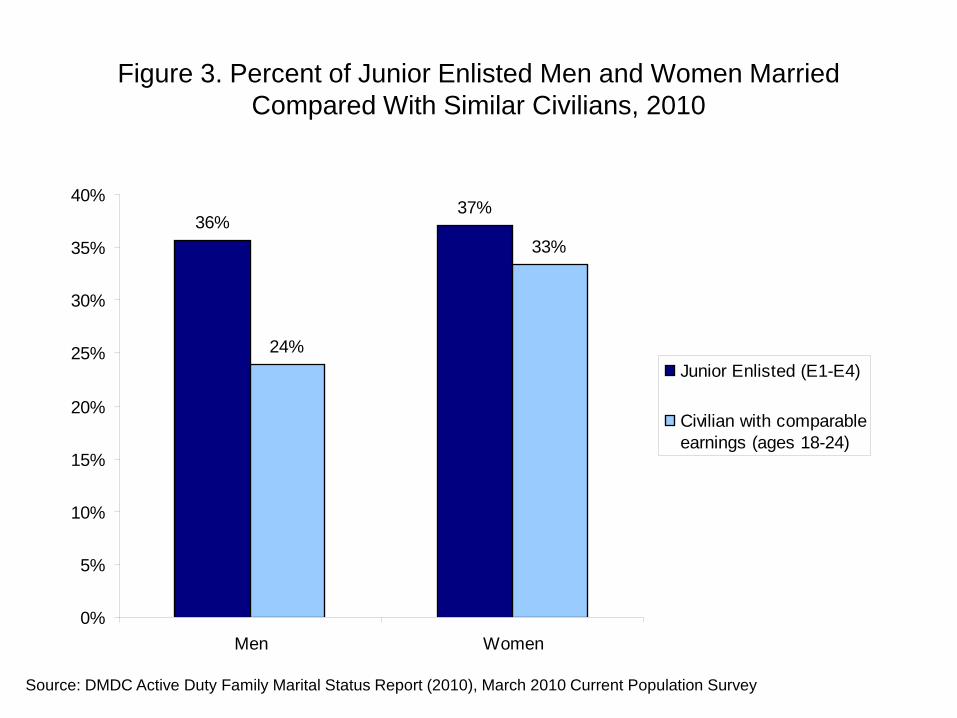
Figure 3. Percent of Junior Enlisted Men and Women Married Compared With Similar Civilians, 2010
36%37%
24%
33%
0%
5%
10%
15%
20%
25%
30%
35%
40%
Men Women
Junior Enlisted (E1-E4)
Civilian with comparableearnings (ages 18-24)
Source: DMDC Active Duty Family Marital Status Report (2010), March 2010 Current Population Survey

Figure 4. Age Distribution of Children in Military Families
0 to 542%
6 to 1131%
12 to 1823%
19 to 224%
• Of military families with children, 73% of children are under 12 years old
• Grade school children whose parents were cumulatively deployed 19 months or longer experienced negative academic performance compared with children whose parents had not deployed or deployed less than 19 months
Sources: DoD Profile of the Military Community, 2009; RAND “Effects of Soldiers’ Deployment on Children’s Academic Performance and Behavioral Health”, 2011

Moving with the Military • Military families are both
tied migrants and tied stayers
• Move on average every two to three years
• Move 2.4 times more than civilian families
• Move further distances than civilian families
Source: Cooney et al. “Moving with the Military”, 2009
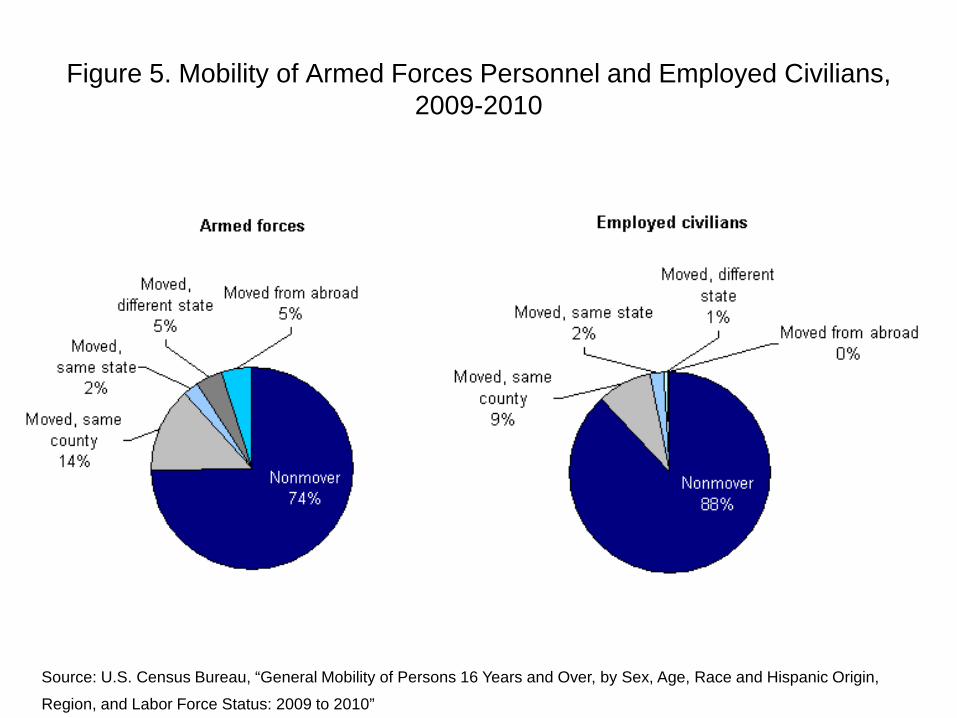
Figure 5. Mobility of Armed Forces Personnel and Employed Civilians, 2009-2010
Source: U.S. Census Bureau, “General Mobility of Persons 16 Years and Over, by Sex, Age, Race and Hispanic Origin,
Region, and Labor Force Status: 2009 to 2010”

Spouse Employment • Frequent relocation presents special challenges to civilian
spouses seeking employment • In labor market areas surrounding military bases, civilian
women experience: – Higher unemployment: 2.3 points higher than in other labor
market areas – Lower wages: 5% lower than in other labor market areas
• Employment and wage effects occur due to confluence of: – Human capital penalties associated with tied migration – Contextual effects of military presence – Employer monopsony
Source: Booth et al. 2000, Booth 2003
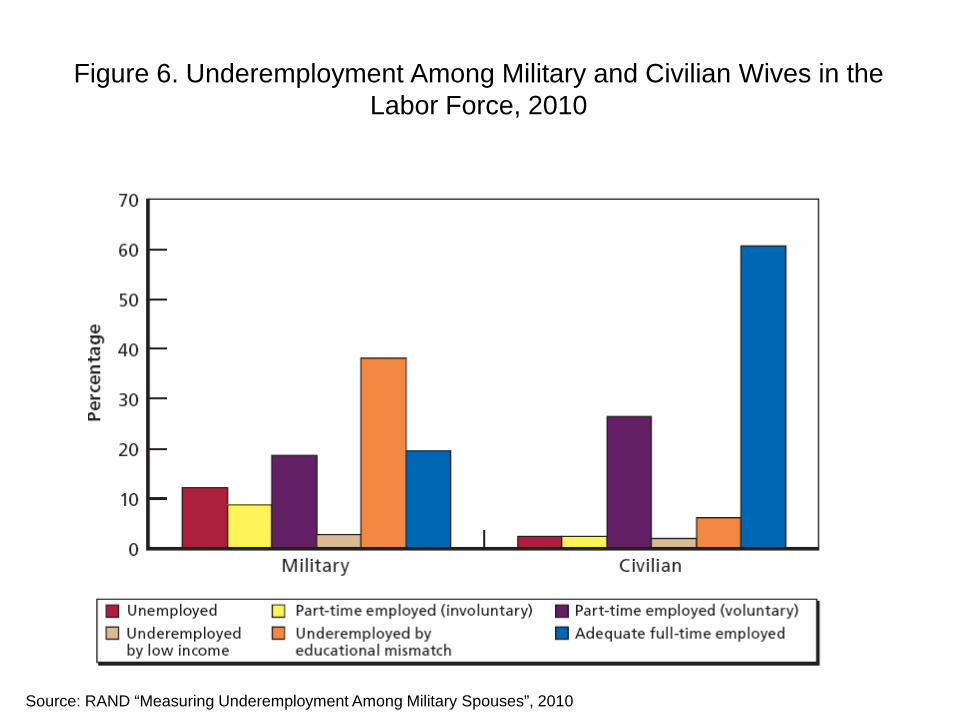
Figure 6. Underemployment Among Military and Civilian Wives in the Labor Force, 2010
Source: RAND “Measuring Underemployment Among Military Spouses”, 2010
Spouse Employment • Geographic mobility influences spouse satisfaction
– For each additional year of tour length, the likelihood of spouse dissatisfaction decreased by 4.2%
– For each additional year at current location, the likelihood of spouse dissatisfaction decreased by 5.6%
• Spouse satisfaction with job opportunities varies by gender, race, and class – Female spouses less dissatisfied than male spouses – Black spouses more dissatisfied than white spouses – Enlisted spouses more dissatisfied than officer’s spouses
Source: Cooney et al. “Moving with the Military”, 2009

Military Families Become Veteran Families
• The military is a short-term career for all but a few service members
• Average length of service approximately 7 years
• In 2009, approximately 180,00 personnel separated from the military – With 1.4 family members
for every service member, this means more than 250,000 military family members became veteran family members
Figure 7. Type of Separation, 2009
Source: DoD “Profile of the Military Community”, 2009

Figure 8. Unemployment Rate of Veterans and Nonveterans by Sex and Age (%), 2010
0
5
10
15
20
25
18-24 years 25-34 years 35-44 years 45-54 years 55-64 years
Male Veterans Male Nonveterans Female Veterans Female Nonveterans
Source: Bureau of Labor Statistics “Employment Situation of Veterans, 2010”
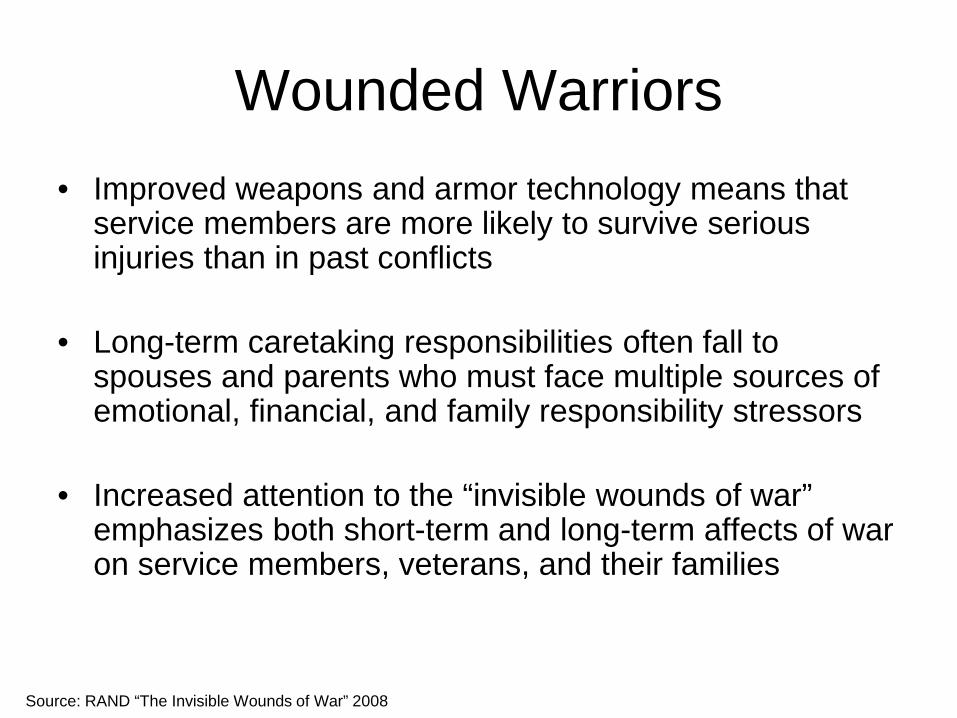
Wounded Warriors • Improved weapons and armor technology means that
service members are more likely to survive serious injuries than in past conflicts
• Long-term caretaking responsibilities often fall to spouses and parents who must face multiple sources of emotional, financial, and family responsibility stressors
• Increased attention to the “invisible wounds of war” emphasizes both short-term and long-term affects of war on service members, veterans, and their families
Source: RAND “The Invisible Wounds of War” 2008

Figure 9. Annual New PTSD and TBI Diagnoses, All
Services 2000-2010
0
5000
10000
15000
20000
25000
30000
35000
2000 2001 2002 2003 2004 2005 2006 2007 2008 2009 2010
PTSDTBI
Sources: Congressional Research Service: US Military Casualty Statistics (2010), DoD Defense and Veterans Brain Injury Center (2011)

Figure 10. Prevalence of Mental Health Conditions Following Deployment to OIF (%)
0.0
5.0
10.0
15.0
20.0
25.0
Depression Anxiety PTSD Any of the above
Pre-OIF 3 Months Post-OIF 12 Months Post-OIF

Conclusions
• The all-volunteer military will continue to be a demographically diverse force with more family members than service members – Diversity in military family demographics – Diversity in family structures
• Family satisfaction with military lifestyle affects service member satisfaction and decisions – Work-family conflict, morale, and job performance – Retention and career decisions

Conclusions • Potential strains of military lifestyle affect all
families, but expectations and needs can vary greatly by family characteristics – Service branch, active duty and reservist families – Gender of spouse – Education and social class – Race and ethnicity – Single parent and dual-service families
• Military service continues to affect veterans and families after service is completed – Employment and earnings – Physical and mental health
The Demography of Military Families Symposium on Policy and Population Health
October 28, 2011
National Press Club, Washington DC
Sponsored by:
The Population Reference Bureau and The Hopkins Population Center
Dr. David R. Segal
Department of Sociology University of Maryland
2112 Art-Sociology Bldg. College Park, MD 20742
Center for Research on Military Organization