population working group population projections 2010, 2035, 2060, 2110 december 10, 2010
TRANSCRIPT

Population Working GroupPopulation Projections 2010, 2035, 2060,
2110
December 10, 2010

“There are known knowns…there are known unknowns…But there are also unknown unknowns…things we don’t know we don’t know.”
2
Former Secretary of Defense Donald Rumsfeld
•October 15•October 26
• Sent email (10/27 /10) to County Planning Departments soliciting input
•November 9•November 22
3

•Various levels of geography•Based on published projections and existing data•Adjusted for economic downturn•Three scenarios; Low, Mid, High•Disaggregated to geographies using political boundaries and basin boundaries•Some data was not included but is very important for consideration in the WRDC process (“bin”)
4

•State•County•Basin•County-Basin portions•Basin-County portions•CCD, CDP, MPA, Incorporated Area
5

6

7

8

•DES Projections from 2006•MAG Projections by MPA•Projections by Incorporated Area for Gila, Pima and Pinal Counties•US Census Bureau, “Methodology and Assumptions for the Population Projections of the United States: 1999 to 2100
9

DES WebpageDES Webpage
10

11
US Census Projection to 2100US Census Projection to 2100

•Original DES state projection reduced for the economic downturn•US Census projections to 2100 used to extend state projections to 2110•US Census projection scenarios used to develop three State scenarios
12
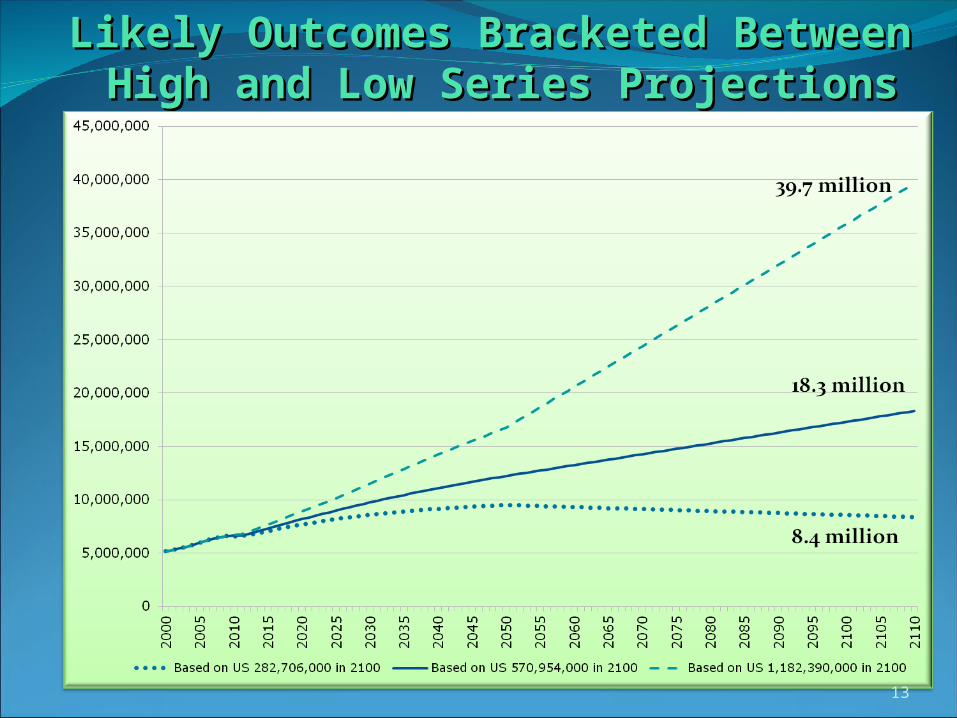
Likely Outcomes Bracketed Between Likely Outcomes Bracketed Between High and Low Series ProjectionsHigh and Low Series Projections
13
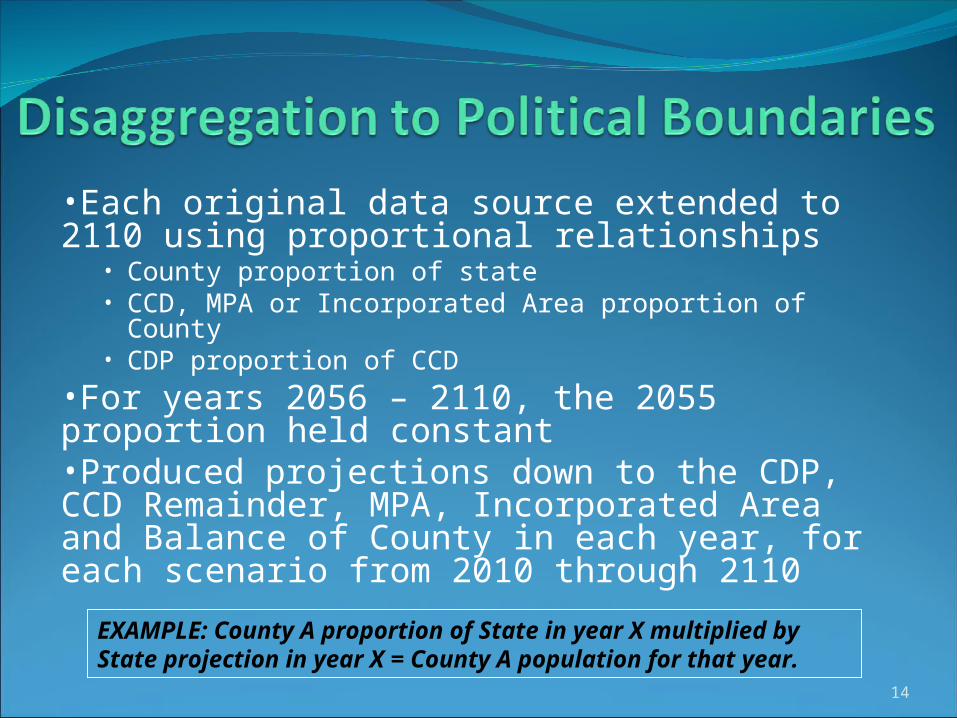
•Each original data source extended to 2110 using proportional relationships
• County proportion of state• CCD, MPA or Incorporated Area proportion of County• CDP proportion of CCD
•For years 2056 – 2110, the 2055 proportion held constant•Produced projections down to the CDP, CCD Remainder, MPA, Incorporated Area and Balance of County in each year, for each scenario from 2010 through 2110
EXAMPLE: County A proportion of State in year X multiplied by State projection in year X = County A population for that year. 14
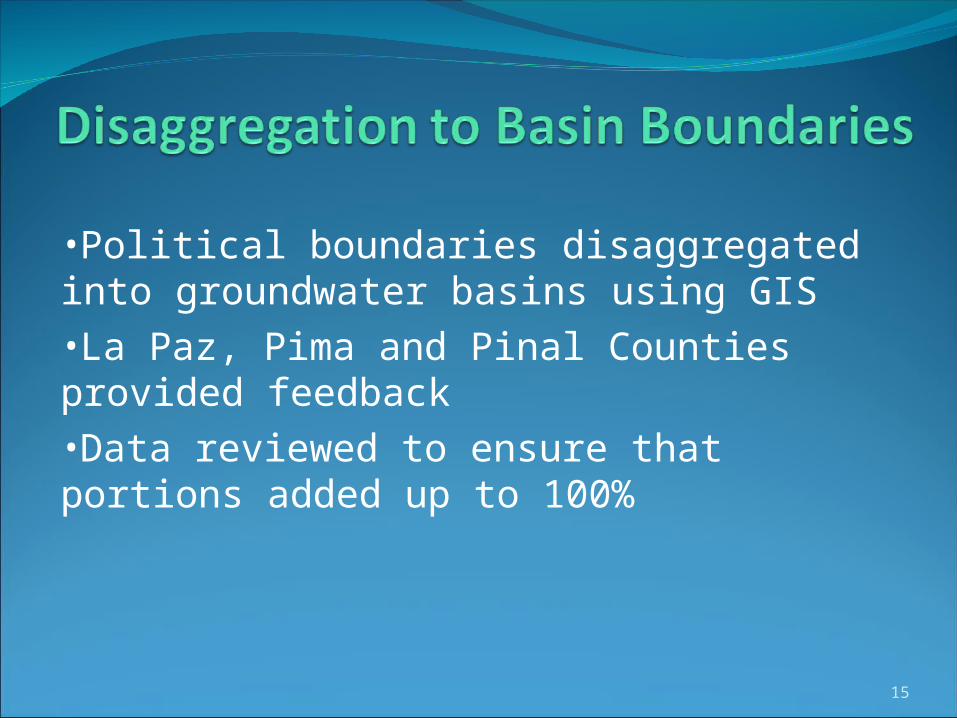
•Political boundaries disaggregated into groundwater basins using GIS•La Paz, Pima and Pinal Counties provided feedback •Data reviewed to ensure that portions added up to 100%
15

16

•ACCESS database created• Original projection data• Proportion of each political boundary and
basin•Queries allow ease of data extraction
• County• Basin • County-basin portions • Basin-county portions
17

Method Low Mid High Low Mid High Low Mid High Low Mid High
County 2010 2035 2060 2110
Apache 73,639 74,082 74,720 77,762 91,244 112,585 74,527 105,989 164,554 67,050 146,545 317,215
Cochise 137,468 138,296 139,487 157,221 184,479 227,628 153,129 217,775 338,106 137,766 301,103 651,777
Coconino 133,157 133,959 135,113 145,554 170,790 210,737 141,773 201,624 313,031 127,549 278,773 603,439
Gila 54,376 54,704 55,175 58,152 68,234 84,194 56,274 80,030 124,250 50,627 110,652 239,521
Graham 35,244 35,456 35,762 37,204 43,654 53,865 35,387 50,325 78,133 31,836 69,582 150,619
Greenlee 7,727 7,774 7,841 6,810 7,991 9,860 6,529 9,285 14,415 5,874 12,838 27,789
La Paz 21,304 21,432 21,617 23,426 27,488 33,917 22,129 31,471 48,861 19,909 43,514 94,191
Maricopa 3,969,960 3,993,865 4,028,272 5,342,734 6,269,032 7,735,346 5,535,205 7,871,942 12,221,606 4,979,844 10,884,054 23,559,919
Mohave 208,449 209,705 211,511 282,536 331,521 409,062 291,616 414,724 643,881 262,358 573,414 1,241,227
Navajo 115,945 116,643 117,648 139,718 163,942 202,288 138,683 197,230 306,210 124,769 272,698 590,289
Pima 1,007,896 1,013,965 1,022,700 1,223,828 1,436,009 1,771,889 1,236,744 1,758,846 2,730,702 1,112,658 2,431,850 5,264,048
Pinal 343,194 345,261 348,235 781,243 916,691 1,131,103 989,814 1,407,673 2,185,487 890,504 1,946,304 4,213,022
Santa Cruz 47,264 47,548 47,958 60,461 70,943 87,537 61,291 87,166 135,330 55,142 120,519 260,879
Yavapai 227,487 228,856 230,829 302,274 354,682 437,641 302,375 430,025 667,637 272,037 594,569 1,287,021
Yuma 205,971 207,211 208,996 270,308 317,173 391,359 272,760 387,908 602,248 245,394 536,337 1,160,969
STATE 6,589,080 6,628,757 6,685,863 8,909,230 10,453,870 12,899,009 9,318,236 13,252,013 20,574,451 8,383,314 18,322,751 39,661,922
Projections by County and ScenarioProjections by County and Scenario
18

•2056-2110 projections not model based•New demographic model projections for Arizona available in 2012•Regional assessment studies were not incorporated•US Census counts may be underreporting Indian Tribe populations•Development on State Lands adds layer of complexity•Not all County Planning departments had time to offer input •WRDC projections may not match other local and regional studies
19

NAME AFFILIATION NAME AFFILIATION
Jason Baran AMWUA Robert Kirk Navajo Nation
Phil Bashaw AZ Farm Bureau Jim Klinker AZ Farm Bureau
Perri Benemelis AZ Dept of Water Resources John Leeper Navajo Nation
Patrick Bray AZ Cattle Feeders’ Association Michael Liberti City of Tucson
Tom Buschatzke City of Phoenix Colleen McVey La Paz County
Jorge Canaca AZ Game and Fish Adam Miller City of Phoenix
Luana Capponi State Land Sharon Morris AZ Dept of Water Resources
Jim Chang AZ Dept of Commerce John Munderloh Town of Prescott Valley
Karen Collins SRP Shawn Murray City of Mesa
Rebecca Davidson SRP Pam Nagel AZ Dept of Water Resources
Kevin Davidson Mohave County Karen Nally Law Offices of K Nally
Norm DeWeaver Inter-Tribal Council of AZ Steve Olson AMWUA
Santiago Garcia Bureau of Reclamation David Plane University of AZ
Maureen George Law Offices of M George John Rasmussen Yavapai County
Angela Gotto Central AZ Association of Govts Steve Rossi City of Phoenix
Laura Grignano AZ Dept of Water Resources Bill Schooling AZ Dept of Commerce
Thomas Homan Gila County Jerry Stabley Pinal County
John Hunt Department of Agriculture Dean Trammel Tucson Water
David Iwanski City of Goodyear Dianne Yunker AZ Dept of Water Resources
Jeff Johnson Town of Taylor20
“…in the Inferno of Dante’s Divine Comedy, there is a special place in the Eighth Circle of Hell reserved for those who presume to peer too far into the future. Their punishment, for all eternity, is to have their heads permanently pivoted 180 degrees to the rear…”
21
Michael S. Teitelbaum, Department of Economic and Social Affairs, Population Division, United Nations
“Final” report and description of methodology will be forthcoming
22