populations disproportionately impacted by covid-19
TRANSCRIPT


Populations Disproportionately Impacted by COVID-19 Current State Assessment
ii
Executive Summary _________________________________________________________________________________ iii 1. Introduction_____________________________________________________________________________________ 1
1.1. Purpose of this report __________________________________________________________________________ 2 1.2. Methods and approach _________________________________________________________________________ 2 1.3. Report structure ______________________________________________________________________________ 2
2. Context: Vancouver before the pandemic ____________________________________________________________ 3 2.1. Unceded homelands ___________________________________________________________________________ 3 2.2. An inequitable city _____________________________________________________________________________ 3 2.3. Existing City of Vancouver policy foundations _______________________________________________________ 4
3. The COVID-19 pandemic in Vancouver ______________________________________________________________ 8 3.1. Transmission and prevention of COVID-19 _________________________________________________________ 8 3.2. The pandemic in BC: shock, waves and ongoing stress _______________________________________________ 9 3.3. Epidemiology of COVID-19 in Vancouver __________________________________________________________ 11 3.4. Epidemiology of COVID-19 among population groups in BC ___________________________________________ 14 3.5. A shift: multiple pandemics and the search for a new normal ___________________________________________ 16
4. Conceptualizing disproportionate impacts __________________________________________________________ 19 4.1. Public health frameworks ______________________________________________________________________ 19 4.2. Equity, human rights and determinants of health frameworks __________________________________________ 20 4.3. Developing an approach to assessing COVID-19 impacts in Vancouver __________________________________ 21
5. Assessing disproportionate impacts _______________________________________________________________ 23 5.1. Increased epidemiological risk from COVID-19 _____________________________________________________ 23 5.2. Increase in other health risks or harms ____________________________________________________________ 27 5.3. Barriers to preventive measures _________________________________________________________________ 32 5.4. Socioeconomic impacts of COVID response _______________________________________________________ 40 5.5. Racism, stigmatization and violence ______________________________________________________________ 50 5.6. Mental health impacts _________________________________________________________________________ 55
6. Assessing the current state ______________________________________________________________________ 65 6.1. Reframe: living with the new abnormal and multiple pandemics ________________________________________ 65 6.2. Rescale: acknowledging how many people are disproportionately impacted _______________________________ 65 6.3. Respond: naming inherent tensions in addressing impacts ____________________________________________ 66 6.4. Reset: shifting from emergency response to ongoing work ____________________________________________ 67 6.5. Relate: developing meaningful relationships with communities _________________________________________ 67 6.6. Recommit: moving upstream toward social sustainability ______________________________________________ 67
7. Conclusion: from pandemic response to a healthy city for all __________________________________________ 69

iii
Executive Summary
The COVID-19 pandemic has impacted virtually every person in Vancouver, but not everyone has been impacted equally. The inequities that become visible in public health emergencies like this pandemic are rarely created by the emergencies themselves. COVID-19 has clearly had disproportionate impacts on many members of the community, but these impacts also reflect pre-existing inequities in the social determinants of health. Vancouver’s challenge is to pursue a recovery that does not just return to “normal” without recognizing how pre-existing conditions of inequity exacerbated the impacts of COVID and disproportionately directed them to certain people and groups. Adaptation to the new reality offers an unprecedented opportunity for paradigmatic change and long-sought progress in working toward a more equitable and just society. Vancouver is an inequitable city that faces many longstanding barriers to social sustainability. The city has high rates of poverty, a high cost of living, unaffordable housing and a polarized distribution of income and wealth. The city’s diversity masks profound inequities experienced by people in many groups, such as: Indigenous peoples; racialized communities; immigrants and newcomers; people with disabilities; 2SLGBTQ+ people; women, girls and non-binary people; children, youth and seniors. There are significant gaps across the social determinants of health, including early childhood development, mental health, and differential access to healthy food options, sustainable transportation and walkable communities. Vancouver is also in a dual public health emergency, as it is an epicentre of a crisis relating to overdoses and deaths from a poisoned drug supply. The first “wave” of COVID-19 in spring 2020 was flattened by strong public health measures and widespread closures of workplaces and public places; it was not a legal “lockdown” but a de facto stay-at-home period for most of the population. This led to a summer of relaxed restrictions and outdoor social gatherings that did not result in increased cases of COVID-19. In the fall, however, most of the northern hemisphere has seen growth in COVID-19 transmission, and BC and Vancouver are following this trend: our second wave of cases has been much larger than the first. The provincial response continues to attempt to strike a balance between minimizing transmission and managing health care system demand; and modifying society to support physical and mental health, rebuild the economy and ensure social cohesion. New restrictions on social gatherings were introduced in November. A repeat of the broad closures in the spring is unlikely, but managing the pandemic remains a precarious and intense challenge. It is also a reminder that the challenges of responding to the pandemic are ongoing: although COVID-19 cases have often been framed in terms of “waves” of transmission, these are not discrete events but an ongoing public health emergency requiring an ongoing, adaptive response.. Epidemiological data identifies older adults and seniors as more likely to experience severe or life-threatening illness from COVID-19, and most public health frameworks for understanding populations disproportionately impacted focus on the disease itself. However, there are several gaps in this approach, including an ongoing lack of race-based health data, so other frameworks rooted in equity and human rights should also be used to understand impacts. This report develops a synthetic framework organized around six types of impacts, recognizing that people may experience multiple impacts or different mechanisms of impact simultaneously:
• Increased epidemiological risk from COVID-19, including people at greater risk of severe illness and death if exposed to COVID-19.
• Increase in other health risks and harms, including people who face increased barriers to accessing the health care system and those impacted by the ongoing public health emergency relating to overdoses and a poisoned drug supply.
• Barriers to preventive measures, including people experiencing homelessness or in other housing situations in which physical distancing and isolation are not possible; people unable to access relevant and appropriate information; and people working in essential services, such as health care, retail, grocery, delivery and transportation sectors.
• Socioeconomic impacts, including people unable to meet their basic needs; people facing increased financial stress; and people whose care obligations have an economic impact.

iv
• Racism, stigmatization and violence, including experiences in public spaces and community settings or in private spaces such as people’s homes.
• Mental health impacts, including isolation and a loss of connection and increased uncertainty, anxiety and stress.
The data that are available in each of these areas demonstrates a large scale of disproportionate impacts, and correlations with broader health inequities experienced by different population groups. While a comprehensive picture of disproportionate impacts across all of Vancouver’s population is not possible, the overall assessment is that the disproportionate impacts of COVID-19 reflect existing systems of power and privilege in society. Those who can confidently avoid the virus, those that have private space to isolate themselves, those that work in jobs that can be done from home, and those with ready access to mental health supports are disproportionately higher-income, white, English-speaking, and without chronic health conditions or disabilities. Everyone’s individual circumstances will vary, of course, but the pandemic makes apparent that inequities in the distribution of power, privilege and resources have direct health consequences. The report presents six recommendations for consideration:
• To reframe the pandemic as an ongoing part the context of an inequitable city, rather than a discrete and linear event, and to recognize that it will be experienced in different ways for different populations.
• To rescale the City’s understanding of the large number of people that may be disproportionately impacted by the pandemic, with a substantial share of the city’s population experiencing each of the types of impacts analyzed.
• To respond in a more intentional way that names and navigates the inherent tensions between individualized response to immediate needs and broader policy-level interventions that address systems at an upstream level.
• To reset the roles of both emergency operations and ongoing social policy work to recognize the need for an ongoing, longer-term response to the impacts of the pandemic.
• To relate to community knowledge in a coordinated and grounded way, and create systems to ensure that a broad range of evidence informs policy.
• Finally, to recommit to City policies like the Healthy City Strategy that can support ongoing efforts to address the root causes of systemic inequities in the social determinants of health in the city and build infrastructure for a stronger response to the disproportionate impacts of the pandemic. The City has a number of tools for a comprehensive approach to social development, from direct action and investment to partnerships and advocacy with other levels of government.
COVID-19 has been an unprecedented challenge for Vancouver in many ways. The speed at which emergency measures have been deployed is a credit to collective efforts. But the challenge in continuing to respond, to adapt and—eventually—to recover from the pandemic is to look beyond the immediate impacts and identify the policy, planning and investment levers that are available to address the root causes of the health inequities that are present in our city. The current state of a city impacted by COVID-19 is not so different from its state before the pandemic; many of the people most impacted were already disproportionately impacted by gaps in the social determinants of health.

1
1. Introduction
Photo by Edna Winty, licensed under creative commons: https://www.flickr.com/photos/ednawinti/49803039528/
Since March 2020, the COVID-19 pandemic has impacted and continues to impact virtually every person in Vancouver. All of the elements of urban life—homes, families, communities, public services, institutions, public spaces, transportation networks, workplaces and businesses—have undergone profound transformations. A level of social and economic upheaval has taken place that is unprecedented in modern times for its scale and speed. And the pandemic continues: until the virus’s spread can be stopped, most likely by immunization of a large proportion of the population, everyone in Vancouver will continue to be impacted by COVID-19. But, even though the pandemic has impacted the entire population, not everyone has been impacted equally. Ongoing outbreaks of COVID-19 in facilities like long-term care are resulting in horrifying rates of death among older adults, elders and seniors. COVID-19 can be a mild illness for some people but others face acute symptoms that may be life-threatening. Some people recover quickly, but others face long-lasting complications. People who were already experiencing homelessness and poverty in the city faced a loss of their most basic needs. Some people have had to make significant economic sacrifices or isolate themselves from their families and loved ones to protect themselves and others; others have found their relatively lower-wage jobs suddenly recognized as essential services and had to determine how to keep themselves safe. The inequities that become visible in public health emergencies are rarely created by the emergencies themselves. COVID-19 has clearly had disproportionate impacts on many members of the community, but these impacts also reflect pre-existing inequities in the social determinants of health. The pandemic shows the results, not the cause, of a society in which social and economic resources are not distributed equitably; where people are marginalized on the basis of their Indigeneity, racial identity, cultural identity, place of birth, ability, age, sex, gender or sexual orientation; and where a person’s health over the course of their life is significantly pre-determined by the context they are born in. COVID-19 necessitates an acute response to manage the virus and treat people with the illness, but it also adds new urgency to ongoing work to address these systemic gaps.

2
The initial response to the pandemic—widespread closures and universal advice to stay at home—was a blunt instrument to save lives and prevent the health care system from being overwhelmed. Now the paradigm is ongoing response and recovery: to reopen and rebuild society as much as possible while the virus continues to circulate, to manage and mitigate the risks of the disease while enabling people to resume their lives. This balancing act will be an extremely difficult public health policy challenge for months, if not years to come. But, in addition, there is a challenge to pursue a recovery that does not just return to “normal” without recognizing how pre-existing conditions of inequity exacerbated the impacts of COVID and disproportionately directed them to certain people and groups. The phrase “build back better” has become a political cliché, but adaptation to the new reality offers an unprecedented opportunity for paradigmatic change and long-sought progress in working toward a more equitable and just society.
1.1. Purpose of this report As part of the City of Vancouver’s recovery plan, this Current State Assessment creates an analytical framework to identify populations that have been disproportionately impacted by COVID-19. It incorporates a review and assessment of existing plans and policies; a synthesis of existing data sources with community-generated knowledge; a sector scan of other municipal responses; and lessons learned from the City’s initial response to the pandemic.
1.2. Methods and approach This report uses a mixed-methods approach to understanding the impacts of COVID-19 on different populations in the city. It relies heavily on quantitative population data, building on existing City work to maintain local and disaggregated indicators of population demographics, socioeconomic inequities and the social determinants of health. Because these city-specific data sources are not updated frequently enough to directly reflect the impacts of the pandemic, they are triangulated with more current regional, provincial or national data sources that provide more frequent or recent data. Although these quantitative data sources are important for understanding the broad makeup of Vancouver’s population and the scale of impacts that different populations have experienced, they also have many gaps. Numbers provide a partial picture of impact across the population, but people experience emergencies like the pandemic as individuals in their particular contexts. Grounded qualitative accounts are equally important in understanding how Vancouver has experienced the impacts of COVID-19. This report uses qualitative data sources as well, including published research and media reports; contributions made by City advisory bodies; and accounts and narratives shared with City staff as part of the City’s emergency operations response. This report is not intended to be a comprehensive account of all of the individual experiences people in the city have had during the pandemic; it is a high-level illustration of how impacts have been disproportionately distributed across the population. Ongoing dialogue with the community is essential to understand how the pandemic continues to disproportionately impact many people in the city.
1.3. Report structure This report is organized into a number of sections to build a composite picture of disproportionate impacts on Vancouver’s populations. Section 2 provides context for the pre-existing inequities in the social determinants of health in Vancouver, and inventories the City’s plans and policies that can provide a framework for responding. Section 3 provides a narrative of the pandemic’s progression in Vancouver and the current epidemiological state of COVID-19 in Vancouver. Section 4 reviews existing frameworks of the disproportionate impacts of the pandemic, and develops a synthetic conceptual framework for understanding different types of impacts in Vancouver. Section 5 uses the framework to assess how these impacts have been disproportionately distributed across populations in Vancouver. Finally, Section 6 offers some synthetic observations on the current state of Vancouver’s pandemic response and questions to consider for the future.

3
2. Context: Vancouver before the pandemic
2.1. Unceded homelands The City of Vancouver occupies the unceded homelands of the xʷməθkʷəy̓əm (Musqueam), Skwxwú7mesh (Squamish), and səlilwətaɬ (Tsleil-Waututh) Nations. This acknowledgement is especially important in times of crisis, as the need for an urgent response can de-prioritize ongoing work of decolonization and relationship-building. While this report is developed within the context of the City of Vancouver’s jurisdictional boundaries and institutions, ongoing work to re-centre the Indigenous laws, governance structures and relationships to these lands must continue. Musqueam, Squamish and Tsleil-Waututh have developed their own responses to the pandemic, including restrictions on visitors and travel to on-reserve communities, physical and mental health supports and assistance with basic needs. In many cases, Indigenous communities in British Columbia have maintained stricter restrictions than the provincial government to protect their communities. Some Nations have shared information about their response that can inform this report: a survey of Musqueam people, for instance, showed that nearly half of respondents were in “priority populations” experiencing health disparities that put them at greater risk of COVID-19, and over half live with or care for someone in this group.1 This has resulted in a very strong response when cases are detected in Indigenous communities: Squamish Nation managed an outbreak in one of their communities on the North Shore in August 2020, mobilizing resources to provide supplies and supports to the community.2 Musqueam contained an outbreak of COVID-19 in January 2021, protecting the community from widespread transmission.3 Canada’s colonial history has previously exposed Indigenous communities to contagious diseases and failed to provide health services and basic needs. The COVID-19 pandemic is a reminder of this trauma but also a reminder that Indigenous communities have dealt with pandemics before and have high levels of resilience, assets and tools to ensure community well-being.4
2.2. An inequitable city The boundaries of the City of Vancouver contain over 685 thousand people, and the city is the core of a metropolitan region of 2.7 million.5 Vancouver is the most densely populated large city in Canada, a model of some aspects of sustainable urban planning, and celebrates itself for its natural beauty and diverse population. The city’s economy has generally grown in recent years, with increasing GDP, growth in sustainable job sectors and relatively low levels of overall unemployment.6 Vancouver’s role as the core of a larger region means that it has higher levels of economic activity, services and infrastructure than similarly-sized municipalities.
1 Musqueam Indian Band, Community COVID-19 Report, July 2020. https://www.musqueam.bc.ca/wp-content/uploads/2020/07/MIBCommunityCOVID-19Report-July2020-FINAL.pdf, p. 10 2 Squamish Nation, COVID-19 Community Update for August 31, 2020, August 31 2020. https://www.squamish.net/covid-19-community-update-for-aug-31-2020/ 3 Musqueam Indian Band, COVID-19 update for Wednesday, January 13, 2021. https://www.musqueam.bc.ca/covid19-update-jan-13-21/ 4 First Nations Health Authority, Staying Connected During the Pandemic. https://www.fnha.ca/Documents/FNHA-Staying-Connected-During-the-COVID-19-Pandemic.pdf 5 Statistics Canada, Annual population estimates by age and sex, July 1, 2006 to 2019, Census Subdivisions, British Columbia, accessed through Community Data Program. 6 Vancouver Economic Commission, Economic Snapshot, accessed August 31, 2020. https://www.vancouvereconomic.com/economic-snapshot/

4
But Vancouver is also a very inequitable city that faces many longstanding barriers to social sustainability.7 One fifth of residents experience income poverty and are unable to meet basic needs, and another fifth make less than a living wage necessary for a modest standard of living in Vancouver.8 Many residents struggle to access affordable, suitable and accessible housing, with nearly half of rented households exceeding affordability benchmarks, but a substantial portion of existing and new housing is priced beyond the means of most residents. High rents also impact local businesses and services, including many non-profit organizations that residents depend on for accessing basic needs, community connections and resources. Vancouver is a very polarized city, with income more concentrated in top earners than most other cities in Canada, and the extremely high cost of land and housing means that wealth is probably even more unevenly distributed. The city’s diversity, meanwhile, can mask profound inequities experienced by Indigenous, racialized and immigrant communities. Income poverty is disproportionately experienced by people in these groups. Economic sectors that receive planning attention, such as the city’s green and high-tech sectors, are not equitably accessible to all people in the city; residents in racialized groups are more likely to work lower-paid jobs in service sectors. As the city has grown, many communities have seen a demographic shift with fewer racialized, immigrant or non-English speaking residents over time. Gentrification and displacement are significant issues in Vancouver, and the impacts of change in the city disproportionately impact people in these groups. And racism and other forms of systemic oppression give rise to violence: in 2018, there were 45% more police-reported hate crimes, per capita, in Metro Vancouver than for Canada as a whole.9 Across the social determinants of health, there are significant gaps in Vancouver. More than a third of kindergarten children in Vancouver are considered vulnerable on development benchmarks; this has profound effects throughout the course of life.10 Self-reported mental health is worse in Vancouver than in surrounding municipalities.11 Access to healthy food options, sustainable transportation and walkable communities differs substantially between central and outlying neighbourhoods, particularly in the south of the city. Before and during the pandemic, British Columbia has been in a public health emergency relating to overdoses and deaths from a poisoned drug supply. Vancouver has been an epicentre of this crisis. Since the emergency was declared in April 2016, there have been over 1,600 overdose deaths in the City of Vancouver.12 Health care workers, first responders, community volunteers and peers attend and reverse multiple overdoses every day. Criminalization, stigmatization, administrative barriers and the lack of a safe drug supply mean that people who use substances face disproportionate risk and few safe and supportive alternatives. Given these profound pre-existing health inequities, Vancouver is far from a socially sustainable community. Documenting how the COVID-19 pandemic has disproportionately impacted different populations in Vancouver must acknowledge the context in which many members of these populations also face differential access to resources, services, safety and opportunity.
2.3. Existing City of Vancouver policy foundations The City of Vancouver has enacted policies that respond to social inequity and work toward social sustainability for decades. This section reviews some of the recent efforts undertaken.
7 Figures in this section are mainly derived from Statistics Canada, 2016 Census of Population, unless otherwise noted. For more detailed data, indicators and context, please see the City’s Social Indicators and Trends reports, available at http://vancouver.ca/social-policy-research. 8 Estimate by City of Vancouver staff based on Living Wage for Families calculation adjusted for family size and compared to income tax data from Statistics Canada, T1 Family File, accessed through Community Data Program. 9 Statistics Canada, Police-reported hate crime, number of incidents and rate per 100,000 population, Census Metropolitan Areas, Table 35-10-0191-01. 10 UBC Human Early Learning Partnership, Early Development Instrument, Wave 7 results, 2017-2019. 11 Vancouver Coastal Health/Fraser Health, My Health My Community Survey, 2013-2014. 12 BC Coroners Service, Illicit Drug Toxicity Deaths in BC January 1, 2010 – December 31, 2020, https://www2.gov.bc.ca/assets/gov/birth-adoption-death-marriage-and-divorce/deaths/coroners-service/statistical/illicit-drug.pdf. Additional data from City of Vancouver internal tracking of police and fire department incidents.

5
City of Reconciliation Framework Vancouver declared a year of reconciliation in 2013, and followed up in 2014 with a commitment to become a City of Reconciliation, including an official acknowledgement by Vancouver City Council that the city occupies the unceded homelands of Musqueam, Squamish and Tsleil-Waututh. This commitment includes ongoing efforts to:
• Form a sustained relationship of mutual respect and understanding with local First Nations and the Urban Indigenous community, including key agencies;
• Incorporate a First Nations and Urban Indigenous perspective into our work and decisions; • Provide services that benefit members of the First Nations and Urban Indigenous community.
The City’s Reconciliation work includes a response to the Truth and Reconciliation Commission’s Calls to Action, including a number of items relevant to the pandemic response. Addressing longstanding health inequities, incorporating Indigenous healing practices and supporting Indigenous organizations are priorities that take on particular significance during the pandemic. As noted above, Musqueam, Squamish and Tsleil-Waututh have each led their own responses to the pandemic. Metro Vancouver Aboriginal Executive Council (MVAEC) has led an urban Indigenous pandemic response.
Healthy City Strategy In 2014, Vancouver City Council adopted the Healthy City Strategy as Vancouver’s social sustainability plan. The Strategy recognizes the interconnections between healthy people, communities and environments, and the fact that health is socially determined by a number of factors that are shaped at the local level. The Strategy commits the City, health authority and partners to collaborative action on 13 long-term goals:
• A Good Start: Vancouver's children have the best chance of enjoying a healthy childhood. • A Home for Everyone: A range of affordable housing choices is available for all Vancouverites. • Feeding Ourselves Well: Vancouver has a healthy, just, and sustainable food system. • Healthy Human Services: Vancouverites have equitable access to high-quality social, community, and
health services. • Making Ends Meet and Working Well: Our residents have adequate income to cover the costs of
basic necessities, and have access to a broad range of healthy employment opportunities. • Being and Feeling Safe and Included: Vancouver is a safe city in which residents feel secure. • Cultivating Connections: Vancouverites are connected and engaged in the places and spaces that
matter to us. • Active Living and Getting Outside: Vancouverites are engaged in active living and have
incomparable access to nature. • Lifelong Learning: Vancouverites have equitable access to lifelong learning and development
opportunities. • Expressing Ourselves: Vancouver has a diverse and thriving cultural ecology that enriches the lives of
residents and visitors. • Getting Around: Vancouverites enjoy safe, active, and accessible ways of getting around the city. • Environments to Thrive In: Vancouverites have the right to a healthy environment and equitable
access to liveable environments in which they can thrive. • Collaborative Leadership for A Healthy City for All: Leaders from the public, private, and civil
sectors in Vancouver work in integrated and collaborative ways toward the vision of a healthy Vancouver for all.

6
Significantly for the COVID-19 pandemic, the Healthy City Strategy recognizes the importance of upstream, preventive action as a way to shift the paradigm of how Vancouver promotes health and well-being for all residents. Acute health inequities in the city have resulted in a pattern of crisis response on the part of the City, health providers and others, and the Healthy City Strategy offers a framework to work more systematically and strategically toward prevention and addressing the root causes of health inequities. The Strategy includes a robust data monitoring program to track and report on a number of important health indicators for the city, its neighbourhoods and different groups such as Indigenous or racialized populations. Since 2019, Vancouver has joined the Partnership for Healthy Cities and is moving forward with developing new interactive data tools to engage the community in understanding and responding to the health inequities visible in these indicators. Since COVID-19, inequities in the social determinants of health have become more acute and more consequential for increasing the disproportionate impacts of the pandemic. An ongoing commitment to the Healthy City Strategy, and work toward policy change and other action that addresses health inequities is essential to reducing disproportionate impacts in future health emergencies.
Resilient Vancouver Strategy In 2016, the City of Vancouver joined the 100 Resilient Cities network and committed to developing a resilience strategy. This strategy acknowledges different understandings of the term resilience while identifying stresses and shocks that impact Vancouver’s resilience, and sets three goal areas for focused work:
• Thriving and Prepared Neighbourhoods, focusing on strengthening community connections, cultural and social infrastructure and local knowledge and creativity to enable communities to prepare and recover from disaster;
• Proactive and Collaborative City, focusing on equity and inclusion of underrepresented groups, increased organizational capacity and holistic and collaborative planning;
• Safe and Adaptive Buildings and Infrastructure, focusing on improving performance of buildings in an earthquake, making civic facilities more robust and collaborating to protect essential infrastructure.
The COVID-19 pandemic presents an obvious shock to the resilience of Vancouver, in that the pandemic very quickly became a significant emergency for the city. But the impacts of the pandemic also surface ongoing stresses to the city’s resilience. The COVID-19 pandemic represents the first activation of the City of Vancouver’s emergency operations centre since the resilience strategy was passed, and there are many lessons to be learned. A pandemic necessitates a different set of operational protocols and information flows from an earthquake, for instance, requiring many changes and new ways of coordinating an emergency response. But, most importantly, the pandemic has shown the importance and interconnection of the resilience strategy’s goals: community networks and organizations have been essential to mitigating the disproportionate impacts of the pandemic; holistic planning that incorporates equity principles is an ongoing effort; and anticipating how civic facilities can support new needs proved essential as community centres were repurposed and all of society grappled with a redefinition of essential services and supplies.
Toward an Equity Framework Building on the Healthy City Strategy, the City has been developing an Equity Framework in recent years. This will be an organizational-wide framework for the City’s internal systems and processes that intentionally and explicitly identifies systems of oppression and exclusion. City staff will be expected to consider past and present inequities and groups that have been excluded from the organization and its systems, and to work toward policy that centres those voices, particularly Indigenous and racialized voices, and delivers more equitable outcomes. The Framework as developed to date includes a number of important equity statements:
• Equity is both a process and an outcome.
7
• Equity names and addresses systemic inequities that benefit and favour some groups and often disproportionately impact cultural communities, Indigenous, Black and other racialized groups. Individuals and communities with intersecting identities of Indigeneity, race, gender, gender expression and sexual orientation, ability and class can be, and often are, negatively affected by favoured social systems.
• Therefore, equity commitments seek ways to transform current structures, policies, and processes in order to balance power and influence, expand access, and create new ways of walking together that nourish all people by embedding intersectionality in institutional and sectoral change.
• Equity amplifies and affirms the dignity and rights of all people by centering the diverse voices of Indigenous and racialized peoples and communities in creative and resilient processes, informed by Indigenous knowledge and different world views across the ways we do our work.
As a collective process with shared accountability, the Equity Framework proposes a number of commitments for City staff to incorporate into their work, supplemented by resources such as an intersectionality toolkit:
• We commit to doing equity work • We commit to creating spaces for learning • We commit to reflecting equity in City leadership • We commit to fostering strong relationships • We commit to adequately resource equity work
In the context of COVID-19 response and recovery, the Equity Framework is a reminder to frame and engage with the disproportionate impacts in a way that recognizes the particular context in which Indigenous and racialized groups have experienced the pandemic, and the intersectional identities through which people navigate systemic power structures; personal health and safety; and public health policies and guidance.

8
3. The COVID-19 pandemic in Vancouver
Nicolas Sassoon, “Tree Houses”, part of the City of Vancouver’s Platforms 2020 public art series.
3.1. Transmission and prevention of COVID-19 The coronavirus that causes COVID-19 is primarily transmitted by respiratory droplets from an infected person, whether or not they are showing symptoms; symptoms may take up to two weeks to appear. The biggest risk factor for spreading the disease is close contact with someone who sneezes, coughs, speaks or sings, with a secondary risk from infected surfaces or objects.13 Airborne transmission of the virus is possible in specific situations, notably medical respiratory interventions, but research continues to assess the likelihood of airborne transmission elsewhere.14 The BC Centre for Disease Control (BCCDC) advises that smaller droplets can accumulate in indoor, poorly-ventilated spaces shared by many people.15 There is currently no treatment or cure for COVID-19, only interventions to try to manage some of the symptoms of the disease. Many people experience a mild illness that can be managed at home over a relatively short period, but others face the danger of serious symptoms that may require hospitalization or threaten life. Some people also appear to experience long-term complications from COVID-19. The level and duration of immunity gained from having COVID-19 is also unclear. Preventing transmission of the virus is therefore a strong public health imperative. Frequent hand washing and maintaining a physical distance from other people when possible, or wearing a face mask when not, are the “layers of protection” that BC public health officials recommend.16 The directive to maintain physical distance from others poses obvious challenges to the economy, to infrastructure and to everyday life for people, especially in a densely-populated city.
13 World Health Organization, Q&A: How is COVID-19 transmitted?, July 2020. https://www.who.int/news-room/q-a-detail/q-a-how-is-covid-19-transmitted 14 World Health Organization, Modes of transmission of virus causing COVID-19: implications for IPC precaution recommendations, July 2020. https://www.who.int/news-room/commentaries/detail/modes-of-transmission-of-virus-causing-covid-19-implications-for-ipc-precaution-recommendations 15 BC Centre for Disease Control, How It Spreads, January 2021. http://www.bccdc.ca/health-info/diseases-conditions/covid-19/about-covid-19/how-it-spreads 16 BC Centre for Disease Control, Prevention and Risks, September 2020. http://www.bccdc.ca/health-info/diseases-conditions/covid-19/prevention-risks

9
The global pandemic has resulted in unprecedented and rapid research into potential vaccines, with many companies engaged in development and trials of potential vaccinations. In December, 2020, the first vaccines were approved for use by national regulators around the world. Health Canada authorized one vaccine developed by Pfizer-BioNTech on December 9, 202017; and another developed by Moderna on December 23, 2020.18 As of January 18, 2021, over 87 thousand people in BC had received the first dose of one of these vaccines.19 Limited supplies of vaccine mean that only health care workers, long-term care residents and people living in physically isolated Indigenous communities will be vaccinated, with additional deployment to ramp up to a mass vaccination program over the spring, summer and fall of 2021. Vaccination can be a path to effectively managing the pandemic and ending the public health emergency, but there are many variables that will impact progress toward this goal, including the emergence of new variants of the virus that may be more transmissible or that make vaccinations less effective. At minimum, people in Vancouver must face the reality of living with COVID-19 for most of 2021.
3.2. The pandemic in BC: shock, waves and ongoing stress
Figure 1 Daily new reported COVID-19 cases in British Columbia and Vancouver Coastal Health, March 1, 2020-January 31, 2021
COVID-19 was first identified in China in late 2019, with the first case outside China reported on January 13, 2020. On January 30, 2020, the World Health Organization (WHO) declared a Public Health Emergency of International Concern. Case counts increased in many countries through February and March, and the WHO declared a global pandemic on March 11.20 The pandemic continues to progress: by mid-January 2021, there had been nearly 90 million cases of COVID-19 worldwide reported to the WHO, with almost two million deaths.21
17 Government of Canada, Pfizer-BioNTech COVID-19 vaccine: What you should know, January 2021. https://www.canada.ca/en/health-canada/services/drugs-health-products/covid19-industry/drugs-vaccines-treatments/vaccines/pfizer-biontech.html 18 Government of Canada, Moderna COVID-19 vaccine: what you should know, January 2021. https://www.canada.ca/en/health-canada/services/drugs-health-products/covid19-industry/drugs-vaccines-treatments/vaccines/moderna.html 19 BC Centre for Disease Contro, COVID-19 Dashboard, accessed January 18, 2021. http://www.bccdc.ca/health-info/diseases-conditions/covid-19/data 20 World Health Organization, Rolling updates on coronavirus disease (COVID-19), July 2020. https://www.who.int/emergencies/diseases/novel-coronavirus-2019/events-as-they-happen 21 World Health Organization, WHO Coronavirus Disease (COVID-19) Dashboard, accessed January 12, 2020. https://covid19.who.int/.

10
The first case of COVID-19 in British Columbia was reported on January 26, 2020. Cases increased gradually through February and early March, at first from international travel and then from community transmission. Case counts increased more rapidly in mid-March, initially peaking in late March at under 100 new cases reported in a single day. On March 17, BC’s Provincial Health Officer declared a Public Health Emergency, and the BC government followed the next day by declaring a provincial state of emergency. Both declarations remain in effect. The initial response to the shock of COVID-19 in the community was an abrupt shutdown of many sectors of society. In just a few days, public health orders placed limits on public gatherings and closed businesses like restaurants, bars and personal services. On March 16, the City of Vancouver closed theatres, libraries and community centres. On March 17, the province announced that elementary and secondary classes would not resume after spring break. While BC and Vancouver never issued a lockdown or shelter-in-place order—to date, some Indigenous communities have pursued this response, but it has not been widespread—many people experienced a de facto lockdown through much of March and April. These public health measures successfully reduced new COVID-19 cases, except for a few outbreaks in workplaces and institutions. On May 6, the provincial government published its restart plan and began the progress of reopening businesses, services and in-province travel,22 but the balance between resuming previous levels of activity and avoiding an uncontrollable resurgence of the virus remained precarious. Case counts began growing again through July and August, reaching the same peak as in the early stages of the pandemic. The re-introduction of some targeted health restrictions slowed growth but cases continued to climb in September and October. Although other jurisdictions identified this as a second wave of the pandemic, BC health officials preferred to describe it as a second “ripple”23 as its progress was very different from the spring. Notably, hospitalization rates were well below the spring, and there were much fewer fatalities from the virus in the summer and fall. On September 9, the provincial government released its COVID-19 management plan for the fall, with an overall strategy that continues to attempt to strike a balance between minimizing transmission and managing health care system demand; and modifying society to support physical and mental health, rebuild the economy and ensure social cohesion.24
Figure 2 Selected indicators of COVID-19 waves relative to first peak in British Columbia pandemic, March 1-October 18, 2020
22 Government of British Columbia, BC’s Restart Plan, May 2020. https://www2.gov.bc.ca/gov/content/safety/emergency-preparedness-response-recovery/covid-19-provincial-support/bc-restart-plan 23 CBC News, B.C. closes nightclubs, banquet halls after confirming 429 new COVID-19 cases over long weekend, September 8, 2020. https://www.cbc.ca/news/canada/british-columbia/b-c-experiencing-a-2nd-ripple-of-covid-19-says-dr-bonnie-henry-1.5716065 24 Government of British Columbia, Management of COVID-19: Health Sector Plan for Fall/Winter 2020/21, September 2020. https://news.gov.bc.ca/files/COVID-19_fall-winter_preparation.pdf
11
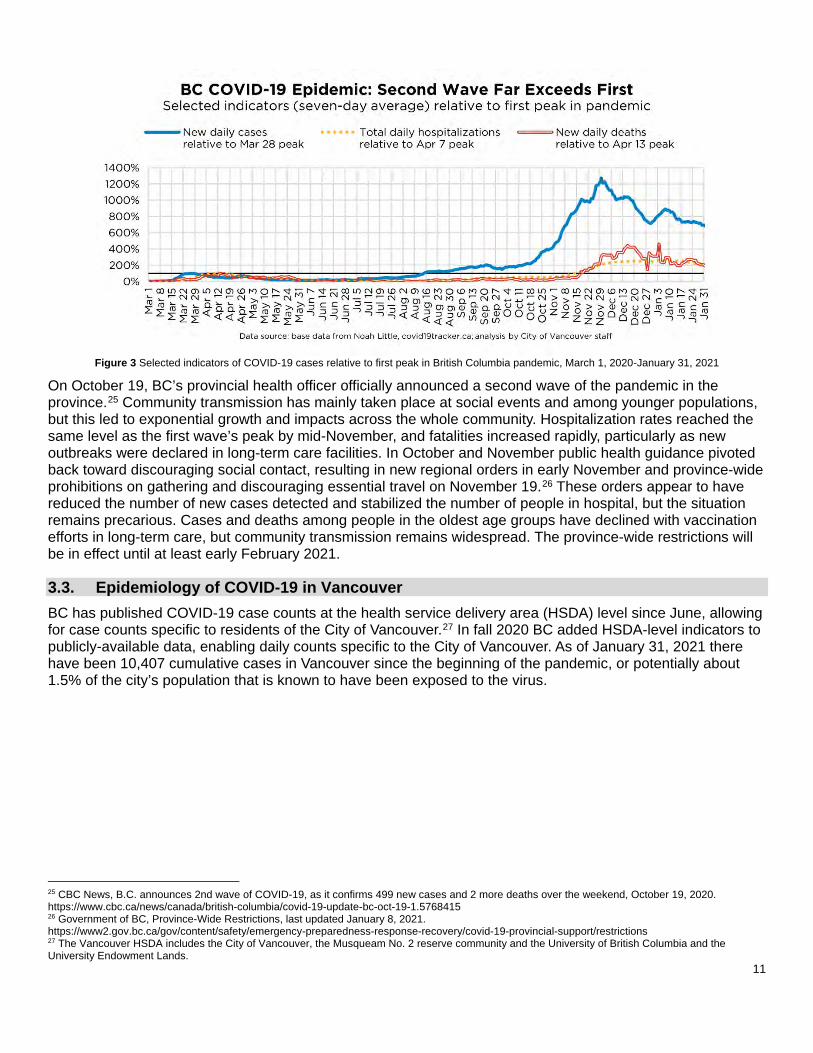
Figure 3 Selected indicators of COVID-19 cases relative to first peak in British Columbia pandemic, March 1, 2020-January 31, 2021
On October 19, BC’s provincial health officer officially announced a second wave of the pandemic in the province.25 Community transmission has mainly taken place at social events and among younger populations, but this led to exponential growth and impacts across the whole community. Hospitalization rates reached the same level as the first wave’s peak by mid-November, and fatalities increased rapidly, particularly as new outbreaks were declared in long-term care facilities. In October and November public health guidance pivoted back toward discouraging social contact, resulting in new regional orders in early November and province-wide prohibitions on gathering and discouraging essential travel on November 19.26 These orders appear to have reduced the number of new cases detected and stabilized the number of people in hospital, but the situation remains precarious. Cases and deaths among people in the oldest age groups have declined with vaccination efforts in long-term care, but community transmission remains widespread. The province-wide restrictions will be in effect until at least early February 2021.
3.3. Epidemiology of COVID-19 in Vancouver BC has published COVID-19 case counts at the health service delivery area (HSDA) level since June, allowing for case counts specific to residents of the City of Vancouver.27 In fall 2020 BC added HSDA-level indicators to publicly-available data, enabling daily counts specific to the City of Vancouver. As of January 31, 2021 there have been 10,407 cumulative cases in Vancouver since the beginning of the pandemic, or potentially about 1.5% of the city’s population that is known to have been exposed to the virus.
25 CBC News, B.C. announces 2nd wave of COVID-19, as it confirms 499 new cases and 2 more deaths over the weekend, October 19, 2020. https://www.cbc.ca/news/canada/british-columbia/covid-19-update-bc-oct-19-1.5768415 26 Government of BC, Province-Wide Restrictions, last updated January 8, 2021. https://www2.gov.bc.ca/gov/content/safety/emergency-preparedness-response-recovery/covid-19-provincial-support/restrictions 27 The Vancouver HSDA includes the City of Vancouver, the Musqueam No. 2 reserve community and the University of British Columbia and the University Endowment Lands.
12
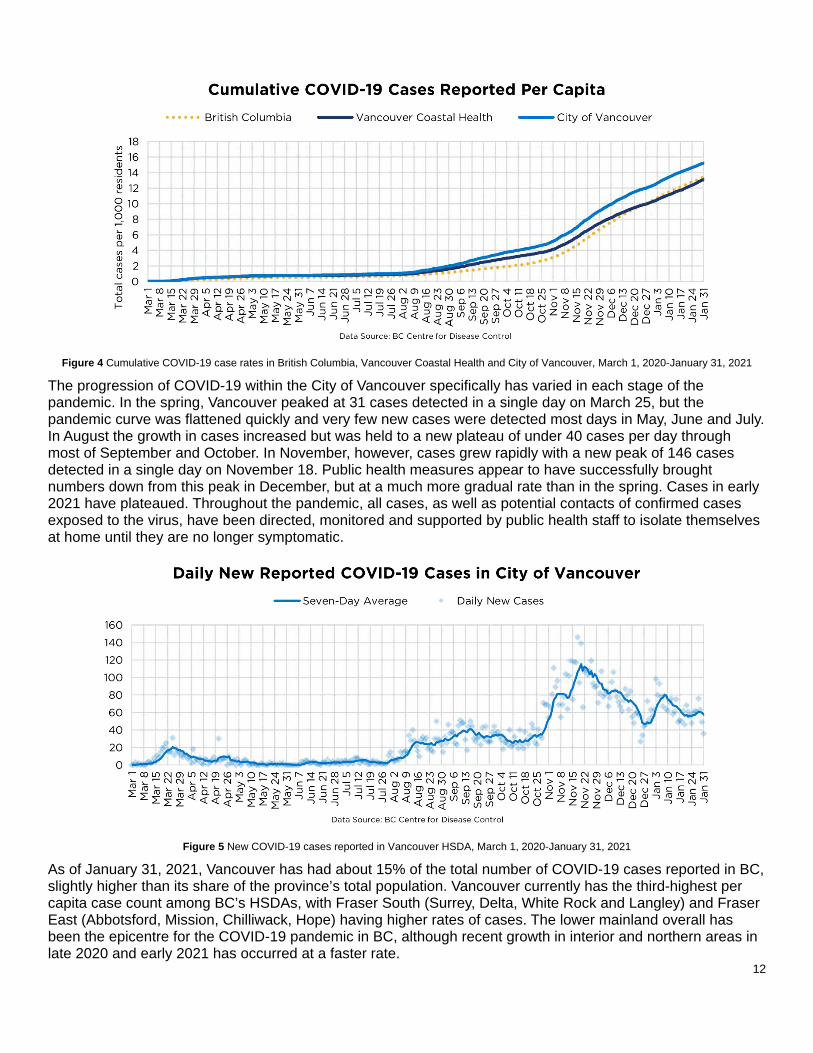
Figure 4 Cumulative COVID-19 case rates in British Columbia, Vancouver Coastal Health and City of Vancouver, March 1, 2020-January 31, 2021
The progression of COVID-19 within the City of Vancouver specifically has varied in each stage of the pandemic. In the spring, Vancouver peaked at 31 cases detected in a single day on March 25, but the pandemic curve was flattened quickly and very few new cases were detected most days in May, June and July. In August the growth in cases increased but was held to a new plateau of under 40 cases per day through most of September and October. In November, however, cases grew rapidly with a new peak of 146 cases detected in a single day on November 18. Public health measures appear to have successfully brought numbers down from this peak in December, but at a much more gradual rate than in the spring. Cases in early 2021 have plateaued. Throughout the pandemic, all cases, as well as potential contacts of confirmed cases exposed to the virus, have been directed, monitored and supported by public health staff to isolate themselves at home until they are no longer symptomatic.
Figure 5 New COVID-19 cases reported in Vancouver HSDA, March 1, 2020-January 31, 2021
As of January 31, 2021, Vancouver has had about 15% of the total number of COVID-19 cases reported in BC, slightly higher than its share of the province’s total population. Vancouver currently has the third-highest per capita case count among BC’s HSDAs, with Fraser South (Surrey, Delta, White Rock and Langley) and Fraser East (Abbotsford, Mission, Chilliwack, Hope) having higher rates of cases. The lower mainland overall has been the epicentre for the COVID-19 pandemic in BC, although recent growth in interior and northern areas in late 2020 and early 2021 has occurred at a faster rate.

13
Figure 6 Cumulative COVID-19 cases per capita by health service delivery area, through January 31, 2021
Since August, BC has also published a monthly dataset at the local health area (LHA) level, offering a broad district-level snapshot of the pandemic. As of the end of January 2021, the Centre North (DTES/Grandview-Woodland) LHA had the highest rate of COVID cases per capita, followed by South Vancouver, City Centre and Northeast areas. Each area has followed a different pattern in the pandemic. South Vancouver, for example, was impacted earlier in the pandemic by a number of long-term care outbreaks, but saw significant growth in cases again in November and December. There were very few occurrences of transmission among residents of the Downtown Eastside early in the pandemic, but early fall saw significant growth in COVID cases in this area. As discussed later in this report, many people in that area face disproportionate barriers to taking preventive measures, so an outbreak of cases is of special concern and puts relatively more people at greater risk if it cannot be managed quickly.
Figure 7 Cumulative COVID-19 cases per capita by local health area, through January 31, 2021

14
3.4. Epidemiology of COVID-19 among population groups in BC The BC Centre for Disease Control (BCCDC) publishes weekly data on the age and sex (as stored in health records) of people impacted by COVID-19. As of the end of January 2021, relatively few children under 10 have had reported COVID-19 cases. With the growth in cases among younger adults through the summer and fall, people in their 20s and 30s have become overrepresented in case counts, with people in their 60s and 70s underrepresented. However, more severe disease continues to disproportionately impact older adults and seniors: the median age of people hospitalized is 66, and the median age of people who have died is 86.28
Figure 8 Distribution of COVID-19 cases, hospitalizations, critical care admissions and deaths by age group, through January 30, 2021
Similarly, COVID-19 cases are more likely to result in severe or life-threatening outcomes for older adults, but with the additional observation that male-identified people appear to be more likely to experience severe or life-threatening disease than those who are female-identified. This is a global trend not fully understood.29
Figure 9 Rate of severe COVID-19 illness requiring hospitalization, critical care or leading to death, through October 15, 2020
28 BC Centre for Disease Control, British Columbia (BC) COVID-19 Situation Report Week 1: January 3-January 9, 2021. http://www.bccdc.ca/Health-Info-Site/Documents/COVID_sitrep/BC_COVID-19_Situation_Report_Jan_15_2021.pdf 29 Adam Moeser, COVID-19’s deadliness for men is revealing why researchers should have been studying immune system sex differences years ago, The Conversation, June 9, 2020. https://theconversation.com/covid-19s-deadliness-for-men-is-revealing-why-researchers-should-have-been-studying-immune-system-sex-differences-years-ago-138767

15
Very little information about other demographic identifiers, notably racial identity, is collected and reported in the BC health care system. In July, the provincial Office of the Human Rights Commissioner was tasked with developing principles for disaggregated data principles and practices.30 Its report, released in September, contains a number of important recommendations, including a framing that disaggregated data must be understood as a tool that is part of a process of respectful relationship-building in service of anti-racism and anti-oppression purposes.31 Implementing the recommendations, particularly changes to legislation, will take time, as will processes to ensure that data collection can take place safely, meaningfully and consistently in the health care system without impacting access to health care or services. The Canadian Institute for Health Information has proposed a framework for standardizing data collection categories for race and Indigenous identity, corresponding to categories used by Statistics Canada.32 As there is no administrative database in Canada capturing people’s Indigenous or racial identities, data collected in these categories relies on self-reporting by individuals. The First Nations Health Authority (FNHA) has linked provincial health data to report on COVID-19 cases and deaths among people with First Nations Status, one of the few indicators that can be derived from administrative datasets. Initially, First Nations communities saw a lower rate of COVID-19 than among BC’s overall population, and the FNHA credited the resilience and actions taken by Indigenous leaders to protect their communities with taking steps to avoid virus transmission and managing outbreaks that have occurred.33 While this leadership continues to effectively manage outbreaks, the FNHA now reports 2,761 cases of COVID-19 among people with First Nations Status in BC and 32 deaths, with a majority of these cases occurring outside of reserve communities.34 First Nations persons have made up 4.6% of total COVID-19 cases and 3.1% of deaths in British Columbia, disproportionate rates given that people with Status make up just under 3% of BC’s population.35 FNHA has also reported an outbreak among First Nations persons in the Downtown Eastside, with 155 cases reported in the Vancouver Centre North local health area (LHA) as of mid-November.36 To compare this to the overall population, as of the beginning of November 2020, about 15% of all COVID-19 cases in the Centre North LHA were First Nations persons,37 while people with First Nations Status make up just over 4% of the LHA’s total population.38 This is direct evidence of disproportionate impacts of COVID-19 on Indigenous communities in Vancouver; inequities in the social determinants of health and systems of colonization and oppression continue to disproportionately impact Indigenous Peoples in BC and create greater risk of severe disease.
30 CBC News, B.C. human rights commissioner ready to tackle race-based health data collection, July 10, 2020. https://www.cbc.ca/news/canada/british-columbia/race-based-data-collection-1.5645373 31 BC Office of the Human Rights Commissioner, Disaggregated demographic data collection in British Columbia: The grandmother perspective, September 2020. https://bchumanrights.ca/datacollection/ 32 Canadian Institute for Health Information, Proposed Standards for Race-Based and Indigenous Identity Data Collection and Health Reporting in Canada, 2020. https://www.cihi.ca/sites/default/files/document/proposed-standard-for-race-based-data-en.pdf 33 First Nations Health Authority, FNHA Reports 86 First Nations Cases of COVID-19 to June 14, 2020, June 26, 2020. https://www.fnha.ca/about/news-and-events/news/fnha-reports-86-first-nations-cases-of-covid-19-to-june-14-2020 34 First Nations Health Authority, Coronavirus disease (COVID-19) FNHA Public Health Response Community Situation Report, January 18, 2021. https://www.fnha.ca/Documents/FNHA-COVID-19-Public-Health-Response-Community-Situation-Report-January-18-2021.pdf 35 Statistics Canada, 2016 Census of Population. 36 First Nations Health Authority, Coronavirus disease (COVID-19) FNHA Public Health Response Community Situation Report, November 16, 2020. https://www.fnha.ca/Documents/FNHA-COVID-19-Public-Health-Response-Community-Situation-Report-November-16-2020.pdf 37 First Nations Health Authority, Coronavirus disease (COVID-19) FNHA Public Health Response Community Situation Report, November 5, 2020. https://www.fnha.ca/Documents/FNHA-COVID-19-Public-Health-Response-Community-Situation-Report-November-5-2020.pdf 38 Statistics Canada, 2016 Census of Population, custom tabulation accessed through Community Data Program.

16
In the absence of data that explicitly includes racial identity or other demographic factors, some researchers have attempted geographical correlations of case counts with other variables. Some of these studies have found correlations between higher numbers of COVID-19 cases and higher rates of immigrants and persons in racialized groups, notably Black residents.39 While this approach can raise important questions about the disproportionate impacts of the pandemic, in the case of BC COVID-19 data have generally not published at small enough geographies to draw definitive statistical conclusions, and many other factors can explain differences in case counts.40 Vancouver has both a diverse population and a relatively high number of COVID-19 cases compared to elsewhere in BC, but these are not necessarily related to each other. Relatively higher rates of COVID-19 cases in South Vancouver, for instance, may be explained situationally by the location of long-term care facilities that have had outbreaks, or demographically by the presence of more people working in essential services or living in multi-generational households. Ongoing monitoring of district- and potentially neighbourhood-level data, supplemented with local context and qualitative assessments of the relative risk in each area, will be essential to assess these factors. That said, there is evidence from other jurisdictions of disproportionate impacts of the COVID-19 pandemic on Indigenous and racialized populations, so an absence of direct data does not mean these impacts do not exist. Section 4 of this report triangulates multiple data sources, including qualitative and narrative data, to contextualize some of the broader impacts of the pandemic and assess how they have disproportionately fallen on certain communities within Vancouver. And ongoing efforts to advocate for and access more disaggregated data to directly measure the impacts of the pandemic will continue.
3.5. A shift: multiple pandemics and the search for a new normal As COVID-19 case counts have increased in BC over the summer, there has been a shift to younger adults being more likely to be impacted by the disease. This is a trend in many jurisdictions around the world. Prior to the province entering phase 2 of its recovery plan on May 19, people in their 20s and 30s made up 21% of total cases in Vancouver Coastal Health, but they made up a majority of cases in the summer and fall. The number of cases among seniors and older adults has been relatively constant, and a smaller rate of growth has been seen in children and youth, and in adults in their 40s and 50s. Importantly, throughout the pandemic, the majority of new cases have been linked to known clusters, notably exposure at social gatherings and events; only 20-25% of cases have been from community transmission of unknown origin.41
39 See e.g. Kate Choi et al, Studying the social determinants of COVID-19 in a data vacuum, May 10, 2020. https://osf.io/preprints/socarxiv/yq8vu/. 40 For discussion of this issue, see Jens von Bergmann, On Mixing COVID-19 And Census Data, May 27, 2020. https://doodles.mountainmath.ca/blog/2020/05/27/on-mixing-covid-19-and-census-data/ 41 BC Centre for Disease Control, British Columbia (BC) COVID-19 Situation Report Week 1: January 3-January 9, 2021. http://www.bccdc.ca/Health-Info-Site/Documents/COVID_sitrep/BC_COVID-19_Situation_Report_Jan_15_2021.pdf

17
Figure 10 Cumulative COVID-19 cases by age group in Vancouver Coastal Health region, March 1, 2020-January 31, 2020
This is strong evidence that people are responding in different ways to the ongoing COVID-19 pandemic, and that people in different age groups may be assessing their own risk in substantially different ways. Rather than the collective shock that impacted the community suddenly and acutely in March, perhaps COVID-19 in Vancouver and BC is now better understood as many different pandemics. For those who perceive themselves or people in their lives to be at greater risk of severe illness, such as older adults, people with disabilities or people with compounding health conditions, COVID-19 has been a constant risk that has not been changed with the re-opening of businesses, workplaces and travel; there has been one long “first wave” of the pandemic necessitating extreme caution and an emergency response. For some of those who perceive themselves to be at low risk, re-opening was a return to life as it was in the before times, and adjusting to new restrictions in the fall and winter has been extremely challenging. Given that the province’s strategy for COVID-19 will continue to be one of balancing disease management and prevention of transmission with avoiding the social and economic impacts of widespread closures, the acute and universal public health response seen in March and April is unlikely to be repeated, and there will continue to be divergence in how the pandemic is perceived and responded to among different populations. The impacts of COVID-19 are not equally distributed, and the pandemic can be understood as a plural emergency. There are many versions of the pandemic experienced simultaneously. Although the community is experiencing an ongoing second wave of transmission of the virus, linear narratives of response to recovery to restrictions do not fully capture the realities that many people in the community are experiencing simultaneously.

18
Since March 2020, multinational corporation Google has been publishing location-based data collected from people’s smartphones42 to understand the dynamics of how people’s movement around a city reflects a broader COVID-19 response. In Metro Vancouver, people whose locations are tracked by Google have returned to near-previous levels of visits to grocery stores since May: people who work in this industry have been considered essential services throughout the pandemic. On average, people captured in these data were about 10% more likely to be at residential locations and 40% less likely to be at workplaces through the summer and fall: this reflects both the transition to remote work for those who have been able to access it, but also the loss of employment for many. There has been a slight increase in the shift from physical workplaces to home with new public health measures since November 2020. Levels of visits to parks increased substantially over the summer—for those who were able to access these spaces, the outdoors has been a consistent outlet for exercise and socializing. With transit use decreased there is a risk that people with the means to do so are switching to private vehicles, creating a less equitable transportation system with lower service levels for essential workers, and an increase in the disproportionate social, environmental and health impacts of vehicle traffic.
Figure 11 Google mobility trends in Metro Vancouver, March 1, 2020-January 31, 2021
The overall current and future state of the COVID-19 pandemic(s) is one of profound uncertainty: fatigue at a long public health emergency, anxiety about resuming activities, the hope of mass vaccination balanced against uncertain timelines and the risk of complicating events. But, there is certainty that COVID-19 has exacerbated significant health inequities that are disproportionately experienced by many populations in Vancouver. Whether for emergency response, recovery, adaptation or anticipation, understanding, mitigating and changing the systems that give rise to these disproportionate impacts is essential. The next section of this report explores this in more detail.
42 This methodology necessarily excludes those without such a device, or people whose location Google does not know at all times; it is important to consider the equity gaps that may be present in these data.

19
4. Conceptualizing disproportionate impacts
Jag Nagra, “Frontline Workers”, part of the City of Vancouver’s Platforms 2020 public art series.
4.1. Public health frameworks Many existing frameworks exist for identifying populations disproportionately impacted by COVID-19, particularly those who are more likely to require acute medical care. The BCCDC, for instance, lists a number of “priority populations” who are more likely to be impacted by a severe case of the disease. Most of the populations listed are people who have specific health conditions that may exacerbate COVID-19:43
• People with chronic health conditions • Children with immune suppression • Children with medical complexity • HIV and COVID-19 • Tuberculosis and COVID-19 • People living with kidney disease • Patients receiving cancer treatment • People who may be or are experiencing violence • People who are unsheltered • People who use substances • People with disabilities
The Public Health Agency of Canada (PHAC) also provides a list of “vulnerable” populations who may be at risk of complications for the disease, organized into two tiers of vulnerability distinguishing between direct risk of severe disease and barriers to isolating or protection from the virus:44
• Anyone who is:
o an older adult o at risk due to underlying medical conditions (e.g. heart disease, hypertension, diabetes, chronic
respiratory diseases, cancer) o at risk due to a compromised immune system from a medical condition or treatment (e.g.
chemotherapy)
• Anyone who has:
o difficulty reading, speaking, understanding or communicating
43 BC Centre for Disease Control, Priority populations, 2020. http://www.bccdc.ca/health-info/diseases-conditions/covid-19/priority-populations 44 Public Health Agency of Canada, Vulnerable Populations, published May 28, 2020. https://www.canada.ca/en/public-health/services/publications/diseases-conditions/vulnerable-populations-covid-19.html

20
o difficulty accessing medical care or health advice o difficulty doing preventive activities, like frequent hand washing and covering coughs and
sneezes o ongoing specialized medical care or needs specific medical supplies o ongoing supervision needs or support for maintaining independence o difficulty accessing transportation o economic barriers o unstable employment or inflexible working conditions o social or geographic isolation, like in remote and isolated communities o insecure, inadequate, or nonexistent housing conditions
These lists tend to focus on the direct medical impacts of the pandemic, and provide important information and guidance for a public health response. However, as discussed in the previous section, the impacts of the pandemic response extend beyond these lists. Inequities in the broader social determinants of health have also been exacerbated by the pandemic, and it is important to recognize additional impacts beyond the presence and clinical path of the disease itself.
4.2. Equity, human rights and determinants of health frameworks A number of groups have identified equity-seeking populations who have been disproportionately impacted by the COVID-19 pandemic. The Canadian Human Rights commission provides an example of this approach, listing populations experiencing increased health, social and economic inequities during the pandemic:45
• People with disabilities • Indigenous peoples • Children • People in housing need or facing food insecurity • Women and children fleeing violence • Single parents • LGBTQ2I community • Canadians needing medical treatment • The elderly • People in correctional institutions
A number of human rights organizations also issued a statement in the early response to the pandemic calling for human rights-based oversight of governments’ pandemic response, noting that several groups are experiencing differential impacts that are being overlooked:46
• First Nations, Métis and Inuit communities • Black and other racialized communities (especially individuals of Asian origin) • The elderly • People living with disabilities • Women and children at risk of violence in the home • Refugees and migrants • People marginalized because of gender identity or sexual orientation • Minority official language communities • Prisoners • Sex workers • People who are homeless or living in inadequate housing • People who use drugs
45 Canadian Human Rights Commission, Statement - Inequality amplified by COVID-19 crisis, 2020. https://www.chrc-ccdp.gc.ca/eng/content/statement-inequality-amplified-covid-19-crisis 46 BC Office of the Human Rights Commissioner, A Call for Human Rights Oversight of Government Responses to the COVID-19 Pandemic, April 2020. https://bchumanrights.ca/a-call-for-human-rights-oversight-of-government-responses-to-the-covid-19-pandemic/

21
• Precariously-employed workers • Other at-risk communities
As discussed in section 2.3 of this report, the City of Vancouver is developing an Equity Framework to guide City processes and practices. As part of this work the City has published an introduction to intersectionality, which outlines systems of oppression and privilege experienced on the basis of a number of domains:47
• Indigeneity, race and ethnicity • Sex and gender identity • Transgender experience • Sexual orientation • Physical, mental and sensory ability • Languages known and used • Age • Income, wealth, class and type of work • Immigration and citizenship • Religion
An intersectional approach recognizes that inequities are compounded and interdependent, and arise from the intersection of multiple aspects of people’s identities: the experience of being racialized and queer is distinct from the experience of each identity in isolation. Individuals may also experience oppression on the basis of some aspects of their identity but privilege in others; it is a reminder that people’s experiences cannot be essentialized on the basis of part of their identities. Someone who is identified as both white and poor, for instance, experiences classism and oppression based on their low-income status, but also experiences privilege from their whiteness. From these frameworks and population lists, it is clear that a medical assessment of the impacts of COVID-19 is not sufficient to account for the impacts of the pandemic on equity-seeking groups. However, this approach also brings a number of challenges: it is difficult to disentangle a response to specific health emergencies such as COVID-19 from a broader project of addressing societal systems of power and oppression that give rise to ongoing inequities. Intersectionality is tremendously important to understanding individual experiences, but can often be difficult to operationalize into population-level data sources and scale to the level of public policy. This report surveys evidence for disproportionate impacts across population groups that experience inequity, but it is not a fully intersectional understanding of individual-level impacts.
4.3. Developing an approach to assessing COVID-19 impacts in Vancouver To synthesize and extend these frameworks, this report develops a conceptual model of six types of specific COVID-19 impacts that may be disproportionately experienced by people in the population: epidemiological risk directly from COVID-19 exposure and severe illness; increase in other health risks and harms; barriers to prevention; socioeconomic impacts; violence; and mental health. These impacts are ordered to indicate the relative risk of acute health impacts, but should not be understood to be hierarchical: many individuals, for instance, will experience significant direct impacts to their health or well-being from social, economic or mental health impacts, so these should not be seen as less important than acute disease from COVID-19. As well, these impacts are not exclusive: people may experience disproportionate impact in one, some or even all of these areas. Within each of these six types of impacts, a number of mechanisms are identified. For example, epidemiological risk to COVID-19 can arise from being part of a population that is more likely to experience serious or life-threatening illness; or it can arise from being employed in a health care setting and exposed to the virus in the course of caring for people with COVID-19. Again, these mechanisms are not exclusive, and individuals may experience disproportionate impacts in multiple ways simultaneously.
47 City of Vancouver, An Introduction to Intersectionality, winter/spring 2020.

22
Figure 12 Conceptual framework for understanding types and mechanisms of disproportionate impacts
For each of these types of impacts, the next section of this report reviews available data and existing knowledge to assess each impact through an equity perspective:
• How the mechanisms of impact may operate in the Vancouver context; • The relative scale of this impact among the overall City of Vancouver population; • Which population groups, such as Indigenous, racialized, immigrant and low-income groups, are
disproportionately likely to experience these impacts; and • Tools, data sources and gaps for ongoing monitoring of these impacts.
Increased epidemiological risk from COVID-19•Severe or life-threatening illness
Increase in other health risks and harms•Unable to access needed
health care•Increase in other health harms
Barriers to preventive measures•Unable to isolate•Unable to access information•Work in essential services
Socioeconomic impacts•Unable to meet basic needs•Loss of income and financial
stress•Care obligations
Racism, stigmatization and violence•In public spaces•In private spaces
Mental health impacts•Loss of connection•Anxiety, stress and uncertainty

23
5. Assessing disproportionate impacts
5.1. Increased epidemiological risk from COVID-19
Mechanisms of impact The goal of the coronavirus that causes COVID-19 is to reproduce itself within the living cells of an organism. As it spreads through the human population, the virus per se does not discriminate, and at the highest level everyone is equally at risk. However, as section 3.4 noted, health data shows clear differences in the severity of the illness among different population groups. And some people in the community are much more likely to come into contact with the virus by the nature of the work they do. Two distinct mechanisms, therefore, put people at increased epidemiological risk in the COVID-19 pandemic:
• Some people are more likely to experience severe or life-threatening illness with complications that will require hospitalization, intensive care or ventilation, or are more likely to lead to death. The public health frameworks for identifying vulnerable populations discussed in section 4.1 identify these groups based on available data on the pandemic to date: older adults and seniors, people with pre-existing health conditions and people with disabilities.
Scale of impact A large number of Vancouver residents may face increased risk of severe illness:
• 39% of BCCDC survey respondents in Vancouver self-report a health condition that increases risk of severe COVID-19 illness, and 26% of respondents are concerned for their own health.48
• 15% of the city’s population, about 98 thousand residents, are age 65 or older. About 5,100 of these residents live in collective seniors residences or nursing homes,49 where large numbers of outbreaks and a substantial proportion of deaths have occurred.
• 20% of people age 15 or older, about 107 thousand residents, report a disability. This includes 69 thousand people age 15-64 and 38 thousand people age 65 or older.50
Disaggregated and neighbourhood-level data The charts and maps on the following pages illustrate key indicators from the BCCDC’s population health survey, conducted in May 2020. They show:
• Older adults were much more likely to have other health conditions, but so were people with lower levels of formal education and people living in neighbourhoods in south Vancouver.
• People of colour, older adults, and people with lower incomes were more likely to be concerned for their own health, and people in eastern neighbourhoods were more likely to be concerned than people living downtown or on the west side of Vancouver.
48 BC Centre for Disease Control, May 2020 Your Story Our Future Survey. 49 Statistics Canada, 2016 Census of Population. 50 Statistics Canada, 2017 Canadian Survey on Disability, accessed through Community Data Program.

24
Figure 13 Vancouver residents with health conditions that may increase the risk of COVID-19 by population group and neighbourhood, May 2020

25
Figure 14 Vancouver residents reporting concern for their own health because of COVID-19 by population group and neighbourhood, May 2020

26
Intersecting inequities While age and health status are factors that can affect the entire population, people’s health status is not a neutral feature of their identity that can be separated from the societal context they live in. Inequities in the social determinants of health are more likely to lead to chronic health conditions that make severe illness from COVID-19 more likely.
• As discussed in previous sections, many Indigenous communities in BC are taking significant measures to protect the health of their communities. However, Indigenous people are disproportionately impacted by broader systemic inequities and colonial practices, reflected in disparities in many of the social determinants of health and barriers to accessing health care. As a result, Indigenous people are more likely to be impacted by many of the chronic health conditions and illness that can make COVID-19 illness more severe.
• While there is no direct data on COVID-19 cases and racial identity in BC, other jurisdictions have shown disproportionate impacts among racialized populations. In Toronto, many groups experience a higher rate of COVID-19 cases than the overall population, including: Latin American, Arab/Middle Eastern, Black, Southeast Asian and South Asian persons. By contrast, white and East Asian persons have a lower rate of COVID-19 cases in Toronto.51 Canada-wide survey data has shown Black respondents much more likely that non-Black respondents to know someone who has experienced COVID-19 symptoms, been hospitalized or died from the disease.52
• As with Indigenous persons, inequities in the social determinants of health are also disproportionately experienced by people in some racialized groups and this may result in increased likelihood of severe illness from COVID-19. In England, members of racialized groups are overrepresented in severe COVID-19 cases and deaths.53 In the Vancouver context, seniors and persons with disabilities are somewhat less likely to be identified as “visible minority” than people in the overall population;54 however, seniors in racialized groups are more likely to experience other barriers such as low incomes and language knowledge.55
• As noted, a global trend is that male-identified persons are more likely to experience severe or life-threatening illness from COVID-19. Females make up a majority of seniors, especially among older age groups, and represent a majority of cases in absolute numbers, but males in all age categories appear to be more likely to experience severe illness and be at greater risk of death.
• Trans and gender-diverse people face systemic barriers in accessing the health care system and are more likely to report poor health.
• To the extent that chronic conditions like HIV disproportionately impact queer communities they are also at greater risk of severe illness from COVID-19, though there are also important differences among 2SLGBTQQI groups. For example, bisexual-identifying adults in Metro Vancouver are more likely to report poor perceived physical health and the presence of a number of chronic conditions, while gay men, on average, report good health at the same rate as heterosexual people.56
• A survey of sex workers living near the DTES found a high level of concern about elevated risk of severe illness, due to pre-existing respiratory conditions or other factors that impact health.57
51 City of Toronto, COVID-19: Status of Cases in Toronto, accessed September 13, 2020. https://www.toronto.ca/home/covid-19/covid-19-latest-city-of-toronto-news/covid-19-status-of-cases-in-toronto/ 52 African-Canadian Civic Engagement Council, Impact of COVID-19: Black Canadian Perspectives, September 2, 2020. https://innovativeresearch.ca/wp-content/uploads/2020/09/ACCEC01-Release-Deck.pdf 53 Public Health England, Disparities in the risk and outcomes of COVID-19, August 2020. https://assets.publishing.service.gov.uk/government/uploads/system/uploads/attachment_data/file/908434/Disparities_in_the_risk_and_outcomes_of_COVID_August_2020_update.pdf 54 In the 2016 Census, 48% of people 65 and older are visible minority, compared to 52% of Vancouver’s overall population. In the 2017 Canadian Survey on Disability, 45% of people 15 and over with a disability are visible minority, compared to 49% of all people surveyed in Vancouver. Both figures derived from custom tables accessed through Community Data Program. 55 Among people age 65 and older in Vancouver, median income is over 50% lower for people in visible minority groups than for people not in visible minority groups. A large majority of people age 65 and over who do not have conversational knowledge of English identify with Chinese, Indian or Vietnamese origins. Both figures from Statistics Canada, 2016 Census of Population, custom tables accessed through Community Data Program. 56 Ellen Demlow et al, Disparities in health care access, lifestyle behaviours and health status among LGBTQ community in Metro Vancouver, British Columbia, presentation to Gay Men’s Health Summit, 2017. Data are based on the My Health My Community survey conducted in 2013/2014. 57 Jessi Taylor, COVID-19: Needs and Risk Assessment of Sex Workers in Metro Vancouver, March 2020. https://wish-vancouver.net/content/wp-content/uploads/2020/04/COVID-19-Needs-and-Risk-Assessment-of-Sex-Workers-in-Metro-Vancouver.pdf

27
• Income and wealth are strong predictors of health status, with lower-income residents much more likely to experience chronic conditions and barriers to good health. In Vancouver, people in the top 20% of the income distribution are almost 50% more likely than people in the bottom 20% to rate their own health as very good or excellent.58
Additional monitoring Ongoing epidemiological data will continue to provide regular updates on the disproportionate impacts and likelihood of severe illness among seniors and older adults. Additional data is collected on the comorbidity of other health conditions with COVID-19 cases. Daily updates on the pandemic in BC note any outbreaks that occur in health care settings. Ongoing gaps and opportunities include:
• There are currently no direct measures of whether members of racialized, immigrant, low-income or other population groups are disproportionately represented in COVID-19 case counts, hospitalizations and deaths in BC and Vancouver, reflecting systemic gaps in the collection and dissemination of disaggregated data in health care.
• Ongoing perception surveys by Statistics Canada and others can be used to understand how people perceive their own risk of severe illness from COVID-19. However, there is very little Vancouver-specific data available from these sources.
5.2. Increase in other health risks or harms
Mechanisms of impact As COVID-19 cases started to increased worldwide in February and March a key concern was protecting the capacity and safety of the health care system to respond. Media reports from other jurisdictions showed that the pandemic could overrun existing capacity, forcing health professionals to make impossible ethical choices to ration resources such as beds and ventilators and triage life-saving interventions. In BC, the release of an ethical framework in late March considered scenarios where the health of the population would need to outweigh the health of an individual in need of health treatment.59 The early pandemic response was heavily informed by a desire to avoid the scenarios seen in other jurisdictions where these ethical questions became ones of life or death for people in the health care system. The province achieved this by freeing as much capacity as possible in the health care system: from March 16 to early May, all non-essential surgeries were cancelled, ensuring capacity but impacting thousands of people who would otherwise have received medical treatment during this time. In the community a strong emphasis on preventing spread of the virus meant that public health advice was focused on universal advice to stay home and avoid contact with others. While these measures succeeded in slowing spread of the virus and protecting the health care system from being overwhelmed, they also created health risks and harms that disproportionately impacted specific populations. The mechanism for each of these measures is:
• Many people who faced cancelled surgeries were unable to access needed health care for the wide range of illness, injuries and chronic conditions that impact the population in non-pandemic times.
• And, while public health advice to isolate has negative effects across the community, isolation increases other physical health harms directly and acutely for people who use substances. The emergency measures put in place to respond to COVID-19 in many ways contradict measures to address the health emergency of the ongoing overdose crisis. People who use substances are put at greater risk by advice to isolate or restrictions on visitors, as they are then more likely to use alone.
58 Statistics Canada, 2015-2016 Canadian Community Health Survey, Vancouver-specific estimates from public use microdata file. 59 BC Centre for Disease Control, COVID-19 Ethical Decision-Making Framework, March 28, 2020. https://www2.gov.bc.ca/assets/gov/health/about-bc-s-health-care-system/office-of-the-provincial-health-officer/covid-19/ethics_framework_for_covid_march_28_2020.pdf

28
Scale of impacts Many Vancouver residents are impacted by reduced access to health care, whether before or during the pandemic:
• 22% of Vancouver respondents to the BCCDC survey in May reported difficulty accessing health care, and 36% reported that they were avoiding accessing the health care system.60
• As a pre-pandemic baseline, nearly one in four adults in Vancouver do not have a family doctor or other primary care provider.61
• About 4,600 surgeries in Vancouver Coastal Health were postponed during the early response to the pandemic.62 If these are distributed proportionately by population, this may include over 2,500 surgeries in the City of Vancouver.
Population-level measures of substance use specific to Vancouver are rare, but there are some national survey data available. And there is clear evidence that the ongoing drug overdose emergency has worsened during the COVID-19 pandemic:
• 3% of respondents to a national survey in 2017, potentially representing nearly a million people Canada-wide, had used illegal substances other than cannabis in the past year.63
• Potential years of life lost due to drug-induced deaths, prior to the current overdose crisis, was about 10% higher in the City of Vancouver than the province overall.64
• There have been over 1,600 overdose deaths in Vancouver since a public health emergency was declared in April 2016. Deaths increased substantially in the months since the COVID-19 pandemic: 2020 was a record year for overdose deaths in Vancouver and across British Columbia. The City of Vancouver had 408 deaths from overdoses in 2020.65
Disaggregated and neighbourhood-level data The charts and maps on the following page illustrate key indicators from the BCCDC’s population health survey, conducted in May 2020. They show:
• People of colour and people with lower incomes were more likely to have difficulty accessing health care, as were people in older age groups except for those in their 70s. The DTES stood out as the area where people reported the most difficulty.
• People age 80 and older, people in many racialized groups, people with lower incomes and women were all groups that were more likely to be avoiding health care entirely. Geographically, northeastern neighbourhoods had the highest rates of this indicator.
60 BC Centre for Disease Control, May 2020 Your Story Our Future Survey. 61 Vancouver Coastal Health/Fraser Health, My Health My Community Survey 2013/2014. 62 BC Ministry of Health, A Commitment to Surgical Renewal in B.C., Progress Report #2: June – July 2020, September 1, 2020. https://news.gov.bc.ca/files/2020_surgical-renewal-commitment-progress-report-June-July-2020.pdf 63 Health Canada, Canadian Tobacco, Alcohol and Drugs Survey (CTADS): summary of results for 2017. https://www.canada.ca/en/health-canada/services/canadian-tobacco-alcohol-drugs-survey/2017-summary.html 64 Indicator from BC Vital Statistics Agency published in BC Centre for Disease Control, BC Community Health Data, municipal profiles. http://communityhealth.phsa.ca/ 65 BC Coroners Service, Illicit Drug Toxicity Deaths in BC January 1, 2010 – December 31, 2020, January 25, 2021. https://www2.gov.bc.ca/assets/gov/birth-adoption-death-marriage-and-divorce/deaths/coroners-service/statistical/illicit-drug.pdf

29
Figure 15 Vancouver residents reporting difficulty accessing healthcare services by population group and neighbourhood, May 2020

30
Figure 16 Vancouver residents reporting avoiding healthcare by population group and neighbourhood, May 2020

31
Intersecting inequities While barriers to accessing health care can affect anyone facing an illness, injury or chronic condition, some populations groups are likely to have been disproportionately impacted:
• Many of the groups identified in the previous section as facing increased risk of severe illness from COVID due to other chronic conditions may also experience disproportionate impacts of other illnesses and barriers to accessing health care.
• Many common non-urgent surgeries, such as cataract surgery or joint replacements, are likely to be disproportionately needed by older adults and seniors. Given the high correlation between social determinants of health and chronic conditions, some other surgeries that were cancelled may disproportionately impact people in equity-seeking groups.
• Vancouver’s Urban Indigenous Peoples’ Advisory Committee identifies culturally responsive care as a key issue in the pandemic. The committee observes that “those who have experienced racism or discrimination within the healthcare system in the past are at a higher likelihood of choosing not to access critical supports in the midst of a pandemic, which could further complicate or exacerbate existing health concerns”, and that barriers and reluctance to visit pharmacies could disrupt vital medications for people.66
• People with lower incomes were more likely to have at least one chronic condition and experience difficulty accessing health care.67 Pre-pandemic data showed high correlations between the presence of multiple chronic conditions, lower incomes and lower levels of formal education in Metro Vancouver.68
The ongoing health emergency relating to overdose incidents and deaths in Vancouver also inequitably impacts many groups in the population, although a complete dataset is not available:
• The First Nations Health Authority reports that overdose deaths disproportionately impact First Nations residents. Across BC, there was a 93% increase in the number of deaths in early 2020 compared to the same period in 2019. First Nations residents have died at nearly six times the rate of other BC residents, with First Nations women dying at nearly nine times the rate of non-First Nations women.69
• However, among non-First Nations populations, men are overall disproportionately likely to overdose. Across BC, nearly 80% of overdose deaths reported by the BC Coroners Service in 2020 have been among male-identified people. The highest death rate is seen in people in their 40s.70
• The majority of overdoses in BC happen indoors. In Vancouver Coastal Health, nearly half of overdose deaths occur in what the coroner describes as “other residences”—shelters, SROs, supportive and social housing.71 Many operators of these buildings, which disproportionately house low-income residents in the DTES, banned visitors early in the pandemic, and these restrictions have still not been lifted at many sites.
• Many people who overdose have previously been in contact with the health care system. Previous data from the coroner showed that 56% of people who died of overdose had previously sought treatment for pain, and 52% had evidence of a diagnosable mental illness.72 There are many pathways to substance use, and an overdose death is often the end of a chain of events and systemic societal failures to care for people experiencing physical and mental illness or injuries.
66 Urban Indigenous Peoples Advisory Committee, Centering Community in the City’s COVID-19 Response, 2020. 67 BC Centre for Disease Control, COVID-19: Going Forward, August 13, 2020. https://news.gov.bc.ca/files/COVID-19_Going_Forward.pdf 68 Vancouver Coastal Health/Fraser Health, My Health My Community Survey 2013/2014. 69 First Nations Health Authority, COVID-19 Pandemic Sparks Surge in Overdose Deaths this Year, July 6, 2020. https://www.fnha.ca/about/news-and-events/news/covid-19-pandemic-sparks-surge-in-overdose-deaths-this-year 70 BC Coroners Service, Illicit Drug Toxicity Deaths in BC January 1, 2010 – July 31, 2020. https://www2.gov.bc.ca/assets/gov/birth-adoption-death-marriage-and-divorce/deaths/coroners-service/statistical/illicit-drug.pdf 71 BC Coroners Service, Illicit Drug Toxicity Deaths in BC January 1, 2010 – July 31, 2020. https://www2.gov.bc.ca/assets/gov/birth-adoption-death-marriage-and-divorce/deaths/coroners-service/statistical/illicit-drug.pdf 72 BC Coroners Service, Overdose Deaths in BC: Findings of Coroners’ Investigations, September 27, 2018. https://www2.gov.bc.ca/assets/gov/birth-adoption-death-marriage-and-divorce/deaths/coroners-service/statistical/illicitdrugoverdosedeathsinbc-findingsofcoronersinvestigations-final.pdf

32
Additional monitoring Data on the impacts that increased barriers to health care may have are fairly limited; future iterations of the My Health My Community survey are the most promising source of ongoing data on this topic. The City continues to monitor the ongoing overdose crisis, including weekly tracking of overdoses and deaths attended by first responders. The BC Coroners Service reports monthly on the number of deaths that occur along with key indicators of age, sex and location of injury. However, a number of gaps remain:
• There is very limited data available on the demographic characteristics of people impacted by substance use illness, overdose and deaths. As part of broader frameworks for collecting and publishing race-based health data there are opportunities to understand the differential impacts of two simultaneous public health emergencies.
5.3. Barriers to preventive measures
Mechanisms of impact The rapid global spread of the COVID-19 pandemic is unprecedented in modern times and difficult to control at a population level, but the spread of the virus occurs mainly due to close contact between individuals. Public health measures, notably physical distancing, can drastically reduce the risk of the virus being transmitted between people in most settings. But not everyone in the community is able to take this precaution. There are three mechanisms by which people are impacted by not being able to protect themselves from the virus:
• Some people are physically unable to isolate themselves from others, as they lack housing with suitable space to maintain distance from others. There is a spectrum of degrees to which this impact occurs: people may be experiencing homelessness; they may live in SROs and other forms of collective dwellings; or they may live in a private household but be unable to isolate due to crowding, caregiving or other factors.
• Some people are unable to access information about the pandemic to keep themselves safe. Information from health officials and governments has often been delivered only in English. People without access to the internet, especially seniors and older adults, may not be able to find timely and accurate information. And information needs to be delivered in a culturally appropriate and relevant way; universal messages may not always be well-received.
• Some people work in essential services that include interactions with the public. In these cases, their employment may put them in situations of greater risk or likelihood of exposure to the virus in these settings.
At a population level, there are multiple data sources that can indicate people whose housing situations impede physical distancing:
• Over 30% of Vancouver respondents to the BCCDC survey in May reported that they were not able to self-isolate.73
• The 2020 Metro Vancouver Homeless Count identified 2,095 individuals experiencing homelessness in March, 547 of whom were unsheltered.74
• Over 13 thousand Vancouver residents live in residences that Statistics Canada considers to be collective dwellings. Nearly nine thousand of these are health settings, including seniors residences and nursing homes as noted above, but this also includes 2,500 people in dwellings counted as lodging and rooming houses or hotels and 1,600 people in shelters.75
73 BC Centre for Disease Control, May 2020 Your Story Our Future Survey. 74 BC Non-Profit Housing Association, 2020 Homeless Count in Metro Vancouver: Preliminary Data Report, August 2020. https://vancouver.ca/files/cov/2020-homeless-count-metro-vancouver-preliminary-data-report.pdf 75 Statistics Canada, 2016 Census of Population.

33
• 8% of private households in the city, nearly 23 thousand residences, are assessed by the Canadian Mortgage and Housing Corporation’s (CMHC’s) occupancy standards to be not suitable for their occupants. This means that there are not enough bedrooms for the adults and/or children living in them to have their own space.
Indicators of barriers to information include language knowledge and access to technology and services include:
• 7% of Vancouver residents, nearly 43 thousand people, do not have conversational knowledge of English. 26% of residents (164 thousand people) usually use a non-English language at home, and 46% (284 thousand people) have a first language other than English.76
• In 2012, 11% of households in Metro Vancouver did not have home internet access.77 • In 2017, 9% of respondents to a City of Vancouver reported poor access to community, social and
health services.78 BC has published an extensive list of essential services during the pandemic.79 Workers in a number of industries have had to continue travelling to a workplace and interacting with the public throughout the pandemic:
• 7% of the city’s working population, about 24 thousand residents, work in health care occupations. This includes about 5,500 people working in nursing, 2,300 working as specialist physicians, 2,300 working as general practitioners, 2,300 working as medical technologists and 3,300 working as health care assistants.80
• More than 10% of employed people in Vancouver, some 35 thousand residents, work in retail industries. Notably, this includes about 8,300 people working in food and beverage stores and 4,500 working in health and personal care stores.81
• 5% of Vancouver’s workforce, over 16 thousand residents, work in manufacturing. Notably, this includes 4,100 working in food manufacturing.82
• 4% of Vancouver’s workforce, nearly 13 thousand residents, work in transportation and warehousing. During the pandemic, notable essential services included 1,200 residents in trucking, 2,100 in transit and taxi services and nearly 1,500 in postal services.83
Disaggregated and neighbourhood-level data The charts and maps on the following page illustrate key indicators from the BCCDC’s population health survey, conducted in May 2020. They show:
• Older adults were much more likely than younger residents to be able to self-isolate, as were people in southwestern neighbourhoods in the city. People with household income between $60 and $140 thousand were least likely to be able to self-isolate, likely corresponding with differences observed based on whether children are present in a household.
• People with higher levels of formal education, and people living in west side neighbourhoods, were much more likely to be working remotely.
• People with higher incomes and higher levels of formal education were much more likely to have sick leave, and to be able to physically distance themselves in the workplace.
76 Statistics Canada, 2016 Census of Population. 77 Statistics Canada, 2012 Canadian Internet Use Survey, table 22-10-0011-01. 78 City of Vancouver, 2017 Access to Services Survey. 79 Government of BC, List of COVID-19 Essential Services, June 12, 2020. https://www2.gov.bc.ca/gov/content/safety/emergency-preparedness-response-recovery/covid-19-provincial-support/essential-services-covid-19 80 Statistics Canada, 2016 Census of Population, custom tabulation accessed through Community Data Program. 81 Statistics Canada, 2016 Census of Population, custom tabulation accessed through Community Data Program. 82 Statistics Canada, 2016 Census of Population, custom tabulation accessed through Community Data Program. 83 Statistics Canada, 2016 Census of Population, custom tabulation accessed through Community Data Program.

34
Figure 17 Vancouver residents with ability to self-isolate by population group and neighbourhood, May 2020

35
Figure 18 Vancouver residents able to work remotely by population group and neighbourhood, May 2020

36
Figure 19 Vancouver residents with sick leave by population group and neighbourhood, May 2020

37
Figure 20 Vancouver residents able to physically distance at work, May 2020

38
Intersecting inequities Disproportionate impacts and barriers to distancing are experienced by members of equity-seeking groups:
• While the local First Nations whose homelands Vancouver occupies have led their own response to the pandemic, the urban Indigenous population in Vancouver is large and diverse and relies on public health advice and responses from local governments and health authorities. Indigenous people in Vancouver include at least 9,000 people identifying with First Nations all across Canada and North America, 4,400 who identify as Métis, over 100 identifying as Inuit and another 500 identifying in other ways or with multiple Indigenous groups. Only 49% of people identifying as Indigenous in Vancouver are Status First Nations.84
• In aggregate, Indigenous communities in Vancouver face systemic gaps in the determinants of health. Indigenous people in Vancouver are disproportionately likely to experience housing need and not have sufficient space to maintain physical distancing and isolation in case of exposure to COVID-19: nearly 40% of people counted in the city’s homeless count are Indigenous,85 and 12% of Indigenous private households fall below CMHC’s suitability benchmark, meaning these households are more likely than non-Indigenous households to experience crowding.86 Vancouver City Council’s Urban Indigenous People’s Advisory Committee identifies gaps in communication tools and accessible, appropriately delivered information as important issues in the pandemic, with a particular note that many Indigenous residents need communication technologies to connect with home communities far away.87
• The Metro Vancouver 2020 Homeless Count includes a question on racial identity; preliminary results show that some racialized groups, notably Black folks, are overrepresented in the region’s homeless population.88 Nearly 12% of “visible minority” households fall below suitability standards, again suggesting that crowding is more likely among racialized populations in aggregate.89
• Data from the UK and the USA have shown disproportionate impacts on racialized populations, due to employment, housing and/or family situations that may impede preventive measures.90
• Lone parent-led households face numerous social and economic barriers. Over 80% of lone parents in Vancouver are female-identified. 30% of lone parent households with children under 18 fall below CMHC suitability guidelines, double the rate of two-parent households.91
• Younger households are more likely to experience overcrowding. 11% of private households maintained by someone under 30 fall below CMHC’s suitability standards. Rented housing is more likely to be considered unsuitable than owned housing.92
• In a survey of DTES sex workers early in the pandemic, nearly 40% did not have a safe place to self-isolated. Over 45% reported having inadequate information to protect themselves.93
Vancouver has a relatively large population of people who do not speak English, and this intersects with other inequities. 20% of seniors 65 and over do not have knowledge of English, for instance, nearly three times the rate for the overall population. Non-English speakers are likely to identify with racialized groups; to be permanent residents or citizens by naturalization; to not have high levels of formal education; and to have relatively low incomes.
84 Statistics Canada, 2016 Census of Population. 85 City of Vancouver, Vancouver Homeless Count 2019. 86 Statistics Canada, 2016 Census of Population, custom tabulation accessed through Community Data Program. 87 Urban Indigenous Peoples Advisory Committee, Centering Community in the City’s COVID-19 Response, 2020. 88 BC Non-Profit Housing Association, 2020 Homeless Count in Metro Vancouver, preliminary data report. https://www.vancitycommunityfoundation.ca/sites/default/files/uploads/2020HomelessCount_MetroVan_PreliminaryDataReport.pdf 89 Statistics Canada, 2016 Census of Population, custom tabulation accessed through Community Data Program. 90 Partnership for Healthy Cities (2020). Webinar on COVID-19 Response. https://vital.ent.box.com/s/63qcyn8mb3rq8dnqvm6e8hp4lcjjqlid 91 Statistics Canada, 2016 Census of Population, custom tabulation accessed through Community Data Program. 92 Statistics Canada, 2016 Census of Population, custom tabulation accessed through Community Data Program. 93 Jessi Taylor, COVID-19: Needs and Risk Assessment of Sex Workers in Metro Vancouver, March 2020. https://wish-vancouver.net/content/wp-content/uploads/2020/04/COVID-19-Needs-and-Risk-Assessment-of-Sex-Workers-in-Metro-Vancouver.pdf

39
Figure 21 Rate within selected demographic groups of people who do not have conversational knowledge of English, 2016
A significant shift during the course of the pandemic has been a new societal understanding of many types of essential work: grocery store workers, cleaners and transportation workers, for instance, are seen in a new light. But the essential nature of this work is not reflected in income or safety measures for people in these areas. As well, Vancouver’s health care workforce also has a different profile from the city overall, creating disproportionate impacts to people providing care as part of their employment.
• There are clear inequities in which populations have been able to transition smoothly to remote work during the pandemic. Across Canada, higher-income couples with dual incomes are more likely to work in jobs that can be done remotely, while lower-income earners are more likely to need to be in a physical worksite. Higher levels of formal education also correlate with ability to work from home.94
• A national survey found Black respondents much more likely than non-Black respondents to be working in essential services requiring face-to-face interaction with other people. They were also more likely to perceive their commute to work by public transit to be unsafe.95
• 71% of Vancouver residents working in health occupations are identified as female in the census. People working in health occupations are more likely to be immigrants than residents working in other sectors. Health occupations have strong representation from some racialized groups, notably Filipino, Arab or South Asian, but less representation among Latin American or Southeast Asian residents. Relatively few Indigenous persons work in health occupations.96
• There are disparities within health occupations, with immigrants often overrepresented in lower-paid sectors. In particular, licensed practical nurses, orderlies and care aides are much more likely to be born outside of Canada than nurses or physicians.97
Inequities in transport to work prior to the pandemic reinforce these findings. In Vancouver, female workers, younger workers, racialized and immigrant workers and lower-income workers were all more likely to use public transit. Maintaining transit service levels to a level that avoids overcrowding is an essential health and equity policy.
94 Statistics Canada, Inequality in the feasibility of working from home during and after COVID-19, June 8, 2020. https://www150.statcan.gc.ca/n1/pub/45-28-0001/2020001/article/00029-eng.htm 95 African-Canadian Civic Engagement Council, Impact of COVID-19: Black Canadian Perspectives, September 2, 2020. https://innovativeresearch.ca/wp-content/uploads/2020/09/ACCEC01-Release-Deck.pdf 96 Statistics Canada, 2016 Census of Population, custom table accessed through Community Data Program. 97 Statistics Canada, 2016 Census of Population, custom table accessed through Community Data Program.

40
Figure 22 Rate of public transit as usual mode of travel to work among indicated population groups, 2016
Additional monitoring Ongoing engagement with people experiencing homelessness and organizations providing services to people in need can provide for a qualitative assessment of the impacts experienced by these populations. Ongoing gaps that can be addressed in the future include:
• There are no housing indicators tracked frequently enough to directly assess the impact of the pandemic on homelessness and access to secure and suitable housing.
• Labour force data is generally available only at the Metro Vancouver-wide level, meaning that municipality-specific data relies on the census every five years.
• Statistics Canada is beginning to incorporate demographics questions on people’s racial identities into the Labour Force Survey, so future monitoring can more directly measure the disproportionate impacts on different population groups.
5.4. Socioeconomic impacts of COVID response
Mechanisms of impact Many people have experienced economic impacts of the pandemic, but some groups have experienced more acute financial hardship. There are three mechanisms of this impact that can be assessed in the population:
• Some people are unable to meet basic needs such as housing, food, clothing, sanitation or health. This may be experienced by people who faced loss of income without ability to access federal and provincial income supports, but also those who found that the resources they relied on to access basic needs, such as public washrooms and community centres, were closed during the pandemic.
• Some people may be able to meet their basic needs but are still experiencing loss of income and financial stress which reduces their standard of living and creates uncertainty about their future.
• Some people have care obligations for children, elders, family members with existing health conditions or other loved ones that may force them to sacrifice income or social connections to protect the people they care for.
Scale of impacts Before COVID-19, a substantial share of Vancouver’s population already had inadequate income to meet their basic needs. The pandemic has certainly increased the number of people struggling with this challenge:
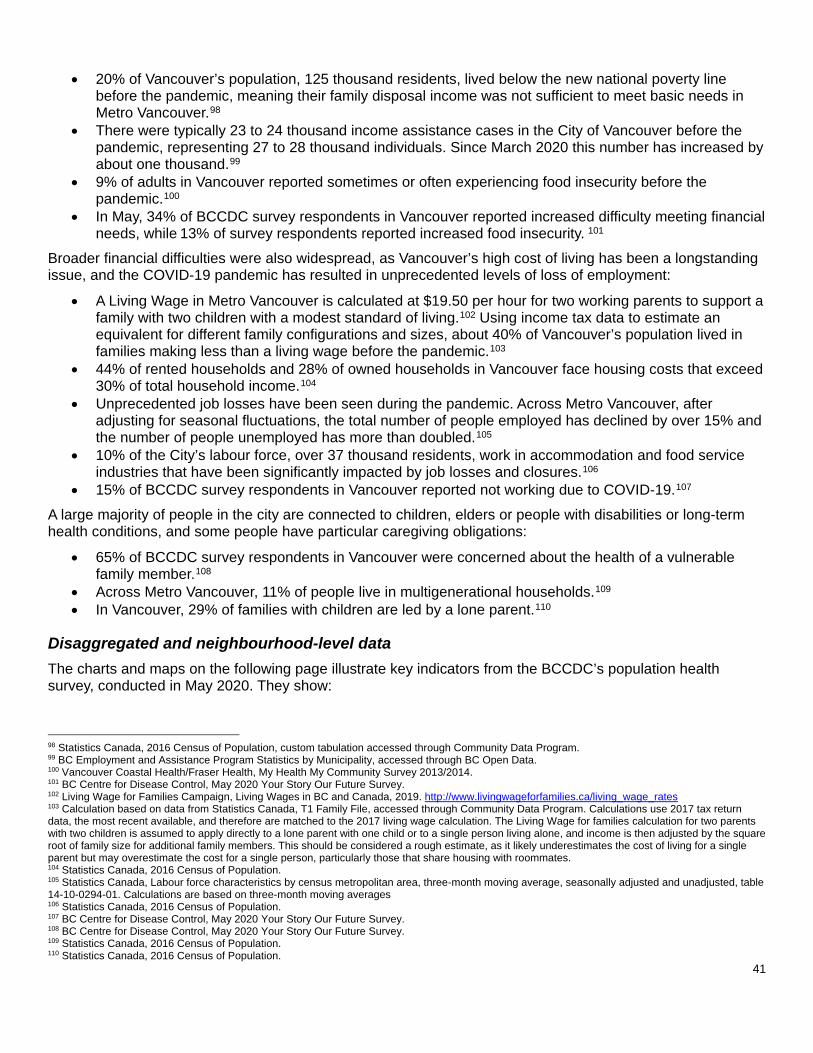
41
• 20% of Vancouver’s population, 125 thousand residents, lived below the new national poverty line before the pandemic, meaning their family disposal income was not sufficient to meet basic needs in Metro Vancouver.98
• There were typically 23 to 24 thousand income assistance cases in the City of Vancouver before the pandemic, representing 27 to 28 thousand individuals. Since March 2020 this number has increased by about one thousand.99
• 9% of adults in Vancouver reported sometimes or often experiencing food insecurity before the pandemic.100
• In May, 34% of BCCDC survey respondents in Vancouver reported increased difficulty meeting financial needs, while 13% of survey respondents reported increased food insecurity. 101
Broader financial difficulties were also widespread, as Vancouver’s high cost of living has been a longstanding issue, and the COVID-19 pandemic has resulted in unprecedented levels of loss of employment:
• A Living Wage in Metro Vancouver is calculated at $19.50 per hour for two working parents to support a family with two children with a modest standard of living.102 Using income tax data to estimate an equivalent for different family configurations and sizes, about 40% of Vancouver’s population lived in families making less than a living wage before the pandemic.103
• 44% of rented households and 28% of owned households in Vancouver face housing costs that exceed 30% of total household income.104
• Unprecedented job losses have been seen during the pandemic. Across Metro Vancouver, after adjusting for seasonal fluctuations, the total number of people employed has declined by over 15% and the number of people unemployed has more than doubled.105
• 10% of the City’s labour force, over 37 thousand residents, work in accommodation and food service industries that have been significantly impacted by job losses and closures.106
• 15% of BCCDC survey respondents in Vancouver reported not working due to COVID-19.107 A large majority of people in the city are connected to children, elders or people with disabilities or long-term health conditions, and some people have particular caregiving obligations:
• 65% of BCCDC survey respondents in Vancouver were concerned about the health of a vulnerable family member.108
• Across Metro Vancouver, 11% of people live in multigenerational households.109 • In Vancouver, 29% of families with children are led by a lone parent.110
Disaggregated and neighbourhood-level data The charts and maps on the following page illustrate key indicators from the BCCDC’s population health survey, conducted in May 2020. They show:
98 Statistics Canada, 2016 Census of Population, custom tabulation accessed through Community Data Program. 99 BC Employment and Assistance Program Statistics by Municipality, accessed through BC Open Data. 100 Vancouver Coastal Health/Fraser Health, My Health My Community Survey 2013/2014. 101 BC Centre for Disease Control, May 2020 Your Story Our Future Survey. 102 Living Wage for Families Campaign, Living Wages in BC and Canada, 2019. http://www.livingwageforfamilies.ca/living_wage_rates 103 Calculation based on data from Statistics Canada, T1 Family File, accessed through Community Data Program. Calculations use 2017 tax return data, the most recent available, and therefore are matched to the 2017 living wage calculation. The Living Wage for families calculation for two parents with two children is assumed to apply directly to a lone parent with one child or to a single person living alone, and income is then adjusted by the square root of family size for additional family members. This should be considered a rough estimate, as it likely underestimates the cost of living for a single parent but may overestimate the cost for a single person, particularly those that share housing with roommates. 104 Statistics Canada, 2016 Census of Population. 105 Statistics Canada, Labour force characteristics by census metropolitan area, three-month moving average, seasonally adjusted and unadjusted, table 14-10-0294-01. Calculations are based on three-month moving averages 106 Statistics Canada, 2016 Census of Population. 107 BC Centre for Disease Control, May 2020 Your Story Our Future Survey. 108 BC Centre for Disease Control, May 2020 Your Story Our Future Survey. 109 Statistics Canada, 2016 Census of Population. 110 Statistics Canada, 2016 Census of Population.

42
• People with relatively lower incomes, as well as people in many racialized groups, were more likely to be concerned about food security. Stark differences were also seen by level of formal education. Geographically, people in the DTES and in eastern and southeastern parts of the city were most likely to be concerned about food security.
• People not working were disproportionately likely to be young workers under 30, people of colour, or people with lower levels of formal education. Again, impacts were most acutely felt in the DTES and in eastern and southeastern parts of the city.
• People with relatively low incomes were the most likely to be experiencing financial stress during the pandemic, but disproportionate impacts were also seen among younger residents and people in many racialized groups. People in eastern neighbourhoods saw the highest rates of this indicator.
• Concern about future financial stress, however, saw the greatest variation by age. • A majority of people in most demographic groups and neighbourhoods were concerned about a family
member’s health, but the greatest concern was seen among younger and non-white residents.

43
Figure 23 Vancouver residents concerned about food security by population group and neighbourhood, May 2020

44
Figure 24 Vancouver resients not working due to COVID-19 by population group and neighbourhood, May 2020
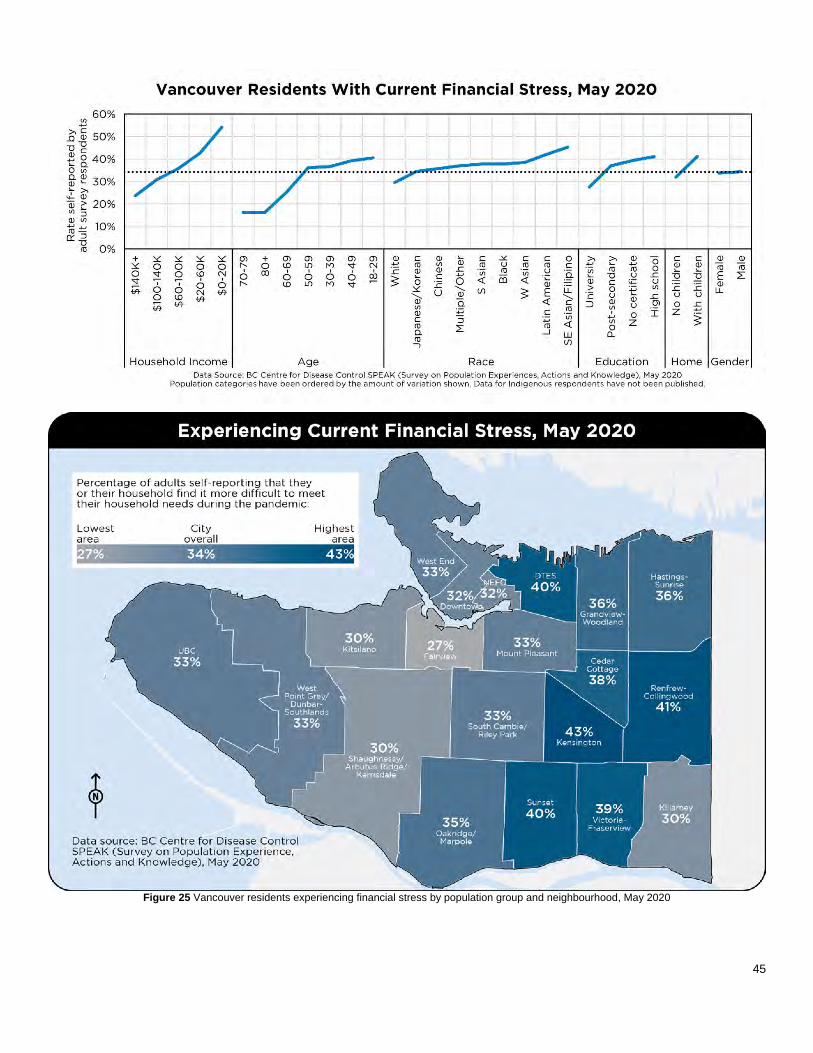
45
Figure 25 Vancouver residents experiencing financial stress by population group and neighbourhood, May 2020
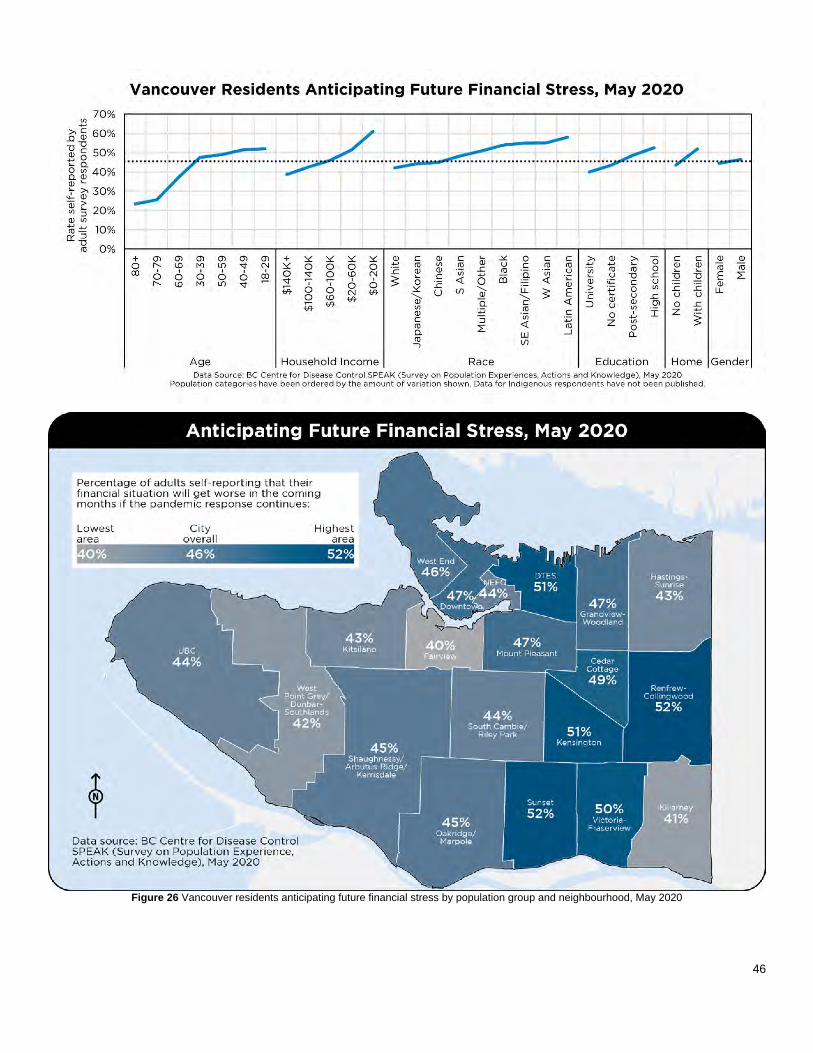
46
Figure 26 Vancouver residents anticipating future financial stress by population group and neighbourhood, May 2020

47
Figure 27 Vancouver residents concerned for a family member’s health by population group and neighbourhood, May 2020

48
Intersecting inequities Prior to the pandemic there was evidence of disproportionate impact in poverty rates: poverty does not strike randomly or separately from other health determinants and systemic inequities. Figure 28 below shows some demographic groups that can be identified from census data. Indigenous and racialized residents, particularly Black residents, were more likely to experience income poverty than white residents. Temporary residents, including people on work or study permits and people coming to Canada as refugee claimants, had a very high poverty rate, while new immigrants experienced poverty at a rate nearly double that of non-immigrants.
Figure 28 Vancouver poverty rate by selected demographic groups, 2016
Over the course of the pandemic, there have been a number of direct measures of how these inequities have been magnified and disproportionately impacted certain groups:
• Across Canada, while Indigenous respondents to a crowdsourced survey were only slightly more likely to report experiencing job loss than non-Indigenous respondents, they were much more likely to report difficulty meeting financial obligations or essential needs.111
• Job losses during the pandemic have disproportionately impacted people in racialized groups. As of August 2020, the unemployment rate in BC for people in visible minority groups is estimated to be 13.5%, compared to 10.3% for people in non-visible minority groups.112 In the 2016 census, the province-wide unemployment rate for both groups was 7%.113 In Vancouver, people in racialized groups are disproportionately employed in service and retail sectors that have been disproportionately affected by job losses.
• Survey respondents in racialized groups have been more likely to report financial difficulties as a result of the pandemic. Across Canada, West Asian, Filipino, Southeast Asian, Korean and Black respondents were most likely to report job loss or reduced hours. Respondents in all of the racialized groups that Statistics Canada records were more likely to report difficulty with financial obligations than white respondents, but Arab, Filipino, West Asian, Southeast Asian, Black, South Asian and Korean respondents in particular reported this at a high rate.114
111 Statistics Canada, Economic impact of COVID-19 among Indigenous people, July 14, 2020. https://www150.statcan.gc.ca/n1/pub/45-28-0001/2020001/article/00052-eng.htm 112 Statistics Canada, Labour Force Survey Supplement, August 2020, custom table accessed through Community Data Program. 113 Statistics Canada, 2016 Census of Population, custom tabulation accessed through Community Data Program. 114 Statistics Canada, Economic impact of COVID-19 among visible minority groups, July 6, 2020. https://www150.statcan.gc.ca/n1/pub/45-28-0001/2020001/article/00042-eng.htm

49
• Women face disproportionate caregiving obligations for children, and the closure of schools and childcare centres had a significant impact on the workforce. As different sectors re-open, the impact on women’s participation and employment rates is not yet clear; across Canada, about a third of mothers who had worked from home were concerned about transitioning back to a usual place of work.115
• People with disabilities were more likely to have low incomes before the pandemic. Median after-tax income for people with disabilities age 25-64 in 2017 was $31 thousand, well below a living wage.116
• Across Canada, households with children were significantly more likely to experience food insecurity during the pandemic than households without children: nearly one in five households with children reported experiencing food insecurity. Not surprisingly, food insecurity was also correlated with loss of employment.117
• A survey of DTES sex workers found that most had stopped working early in the pandemic, and those that were experienced significant loss of income and difficulty meeting basic needs. As with other less formal parts of the economy, people engaged in sex work have barriers accessing the income supports that governments made available. Many people engaged in sex work also have family care obligations so a loss of income affects their families as well and makes safety concerns at work even more acute.118
• Across Canada, immigrants, particularly immigrant men, were significantly more likely to be concerned about their ability to meet financial needs than people born in Canada.119
As one partial indicator of how caregiving obligations can be disproportionately distributed across the population, Figure 29 below shows that 7% of all female-identified persons in Vancouver are lone parents, compared to just 1% of male-identified. People in Indigenous and racialized groups are more likely than white folks to be lone parents, as are people with non-English first languages and immigrants who have been in Canada for more than five years. Lone parents are also overrepresented among lower-income residents.
Figure 29 Percentage of population in indicated categories who are lone parents, 2016
115 Statistics Canada, Labour Force Survey, August 2020, The Daily September 4, 2020. https://www150.statcan.gc.ca/n1/daily-quotidien/200904/dq200904a-eng.htm 116 Statistics Canada, Canadian Survey on Disability 2017, accessed through Community Data Program. 117 Statistics Canada, Food insecurity during the COVID-19 pandemic, May 2020, June 24, 2020. https://www150.statcan.gc.ca/n1/pub/45-28-0001/2020001/article/00039-eng.htm 118 Jessi Taylor, COVID-19: Needs and Risk Assessment of Sex Workers in Metro Vancouver, March 2020. https://wish-vancouver.net/content/wp-content/uploads/2020/04/COVID-19-Needs-and-Risk-Assessment-of-Sex-Workers-in-Metro-Vancouver.pdf 119 Statistics Canada, The social and economic concerns of immigrants during the COVID-19 pandemic, May 1, 2020. https://www150.statcan.gc.ca/n1/pub/45-28-0001/2020001/article/00012-eng.htm

50
Additional monitoring Direct measures of income specific to Vancouver’s population generally come from data sources that are not updated quickly or frequently enough to assess the impacts of the pandemic. However, there is an opportunity to triangulate different sources to provide a more up-to-date picture:
• Ongoing contact with community organizations and service providers can provide a qualitative assessment of the socioeconomic impacts of the pandemic.
• Region-wide data, such as the Labour Force Survey, can provide an indication of ongoing job loss and fluctuations in specific sectors.
• Further access to administrative datasets held by senior levels of government, such as people receiving the Canadian Emergency Response Benefit, could provide more timely information about the dynamics of people’s incomes in the pandemic.
5.5. Racism, stigmatization and violence
Mechanisms of impact At the same time as COVID-19 has spread through the community, incidences of hate and violence have increased. The early spread of the virus from China was early fuel for racist reactions and violence against Asian people. Anti-Indigenous racism was seen in increased acts of violence and research into systemic racism within the health care system.120 And the pandemic has spread at the same time as a growing movement for racial justice, particularly for addressing anti-Black racism. At the same time as the community must collectively respond to the spread of the virus, we must also confront the systemic forms of racism that are institutionalized in society, including the health care system. For this report, there are two distinct mechanisms by which people are disproportionately impacted by violence in the pandemic:
• Some people experience violence in public spaces and community settings. Public acts of racist violence have been recorded in Vancouver, impacting not just the victims of those acts but also diminishing people’s sense of safety, trust and belonging in their community.
• Some people experience violence in private settings including at home. The pandemic response and direction to stay at home cuts off outlets and traps people with abusive partners. People engaged in sex work have fewer outlets and supports to address unsafe situations.
Scale of impacts Vancouver celebrates the diversity of its population: a majority of the population are identified with Indigenous or racialized groups; nearly half of Vancouver residents were born outside of Canada; and the census records at least 168 languages that are known in the city. However, systemic racism and other forms of oppression are still present in Vancouver, and indicators both before and during the pandemic show how that violent expressions of oppression are far too common:
• Vancouver had a relatively large number of hate crimes before COVID-19. Across Metro Vancouver, there were 220 police-reported hate crimes in 2019, an increase over previous years. The region’s rate of 8.2 hate crimes per 100 thousand residents was higher than the national average and higher than most large metropolitan areas in Canada.121 This does not include incidents not reported to the police.
• The Vancouver Police Department has noted an increase in hate crimes during the pandemic: as of July the police had identified 155 files associated with hate in 2020, compared to 69 in the same period in 2019.122
120 Government of BC, In Plain Sight: Addressing Indigenous-specific Racism and Discrimination in B.C. Health Care, November 2020. https://engage.gov.bc.ca/app/uploads/sites/613/2020/11/In-Plain-Sight-Full-Report.pdf 121 Statistics Canada, Police-reported hate crime, number of incidents and rate per 100,000 population, Census Metropolitan Areas, table 35-10-0191-01. 122 Vancouver Police Department, VPD says hate incidents still prevalent throughout the city, news release, July 17, 2020. https://mediareleases.vpd.ca/2020/07/17/vpd-says-hate-incidents-still-prevalent-throughout-the-city/

51
• Across Canada, crowdsourced data collected in May showed that survey respondents in a racialized (“visible minority”) group were much more likely to perceive more frequent harassment or attacks since the start of the pandemic. 21% of visible minority respondents perceived attacks as happening “sometimes” or “often”, compared to 10% of non-visible minority respondents. 18% of visible minority respondents perceived an increase in violence since the pandemic, compared to 6% of non-visible minority respondents.123 Similar indicators are seen for Indigenous survey respondents.124
• Before the pandemic, 65% of Vancouver adults reported feeling safe walking in their neighbourhood at night. However, this rate was lower among women, people born outside of Canada, and people in Indigenous and racialized groups.125
Measuring the impact of violence in private settings is more difficult to measure at a population scale, but some indicators based on available data include:
• Across Metro Vancouver in 2018, there were 668 children, 4,408 partners and 244 seniors who experienced family violence that was recorded in police reports.126 It should be noted that a majority of family violence incidents are never reported to the police.127
• Before the pandemic, crisis calls to Battered Women’s Support Services averaged 18 thousand annually. Since the pandemic they report a 300% increase in call volume.128
• Past studies have estimated that there are up to 2,600 people engaged in sex work in Vancouver, of which 80% may work indoors.129
Disaggregated and neighbourhood-level data The charts and maps on the following page illustrate key indicators from the BCCDC’s population health survey, conducted in May 2020. They show:
• Older residents, except for those over 80, were more likely to feel a strong sense of community belonging than younger residents.
• White and South Asian residents, and people with higher incomes, were more likely to feel a sense of belonging than people in other racialized groups and people with lower incomes.
• People in downtown neighbourhoods generally had a weaker sense of belonging, along with people living in Oakridge and Marpole. Dunbar-Southlands, West Point Grey and Grandview-Woodland had the highest rates of people reporting a sense of belonging.
123 Statistics Canada, Perceptions of personal safety among population groups designated as visible minorities in Canada during the COVID-19 pandemic, July 8, 2020. https://www150.statcan.gc.ca/n1/pub/45-28-0001/2020001/article/00046-eng.htm 124 Statistics Canada, Perceptions of safety of Indigenous people during the COVID-19 pandemic, August 14, 2020. https://www150.statcan.gc.ca/n1/pub/45-28-0001/2020001/article/00071-eng.htm 125 Vancouver Coastal Health/Fraser Health, My Health My Community Survey 2013/2014. 126 Statistics Canada, Family violence in Canada: A statistical profile, 2018. https://www150.statcan.gc.ca/n1/en/catalogue/85-002-X201900100018 127 Based on the 2014 General Social Survey on Victimization, people who experienced violence reported to police for only 30% of incidents. See Statistics Canada, Incidents of self-reported violent victimization that were reported to police in the past 12 months by sex of victim, table 35-10-0120-01. 128 Battered Women’s Support Services, Battered Women’s Support Services in need of more crisis line volunteers as support for domestic violence victims and survivors expand, August 28, 2020. https://www.bwss.org/battered-womens-support-services-in-need-of-more-crisis-line-volunteers-as-support-for-domestic-violence-victims-and-survivors-expand/ 129 Canadian Public Health Association, Sex Work in Canada: the Public Health Perspective, December 2014. https://www.cpha.ca/sites/default/files/assets/policy/sex-work_e.pdf

52
Figure 30 Vancover residents with strong community belonging by population group and neighbourhood, May 2020

53
Figure 31 Vancouver residents with a weak sense of community belonging by population group and neighbourhood, May 2020

54
Intersecting inequities Racism and stigmatization are expressions of systemic forms of discrimination and oppression, and so they are tautologically disproportionate impacts:
• Vancouver’s Urban Indigenous Peoples’ Advisory Committee identifies the “over-policing and discrimination” of Indigenous communities in the DTES as its first major gap to address, calling for public health advice and enforcement measures to recognize systemic injustice and be carried out in a sensitive and culturally safe way.130
• As noted, national surveys have found that respondents in racialized groups are more likely to identify race-based violence occurring than people in other population groups. There are important differences between groups as well. Black, Korean, Chinese and Filipino respondents across Canada were most likely to perceive a high frequency of race-based harassment and attacks. However, Chinese, Korean, Southeast Asian, Filipino and Japanese respondents were most likely to perceive an increase in these incidents during the pandemic.131
• As the pandemic has progressed and younger people make up a greater share of COVID-19 cases, some forms of stigmatization are disproportionately experienced by youth. In a Canada-wide survey in July, people under age 35, especially younger women, were more likely than other age groups to fear experiencing stigmatization as public health restrictions were loosened. Seniors were much less likely to fear stigmatization.132
• Similarly, people who perceive themselves as having lower incomes are more likely to fear stigmatization than people who perceive themselves as having enough money to meet their needs.133
• Across Canada, immigrants were significantly more likely to fear stigmatization than non-immigrants.134 In survey data, immigrants were significantly more likely to be concerned about violence in the home and family stress from confinement than non-immigrants.135
Among police-reported hate crimes before the pandemic, race and ethnicity were the most common motivation, and anti-Black racism was the most common specific motivation documented by police. While there are important limits to the usefulness of police data in understanding systemic racism, this is a clear indicator that racism and violence were present in Canada before COVID-19, so an increase in violence during the pandemic disproportionately exacerbates a disproportionate baseline.
130 Urban Indigenous Peoples Advisory Committee, Centering Community in the City’s COVID-19 Response, 2020. 131 Statistics Canada, Perceptions of personal safety among population groups designated as visible minorities in Canada during the COVID-19 pandemic, July 8, 2020. https://www150.statcan.gc.ca/n1/pub/45-28-0001/2020001/article/00046-eng.htm 132 Statistics Canada, Fear of COVID-19 related stigmatization, July 15, 2020. https://www150.statcan.gc.ca/n1/pub/45-28-0001/2020001/article/00051-eng.htm 133 Statistics Canada, Fear of COVID-19 related stigmatization, July 15, 2020. https://www150.statcan.gc.ca/n1/pub/45-28-0001/2020001/article/00051-eng.htm 134 Statistics Canada, Fear of COVID-19 related stigmatization, July 15, 2020. https://www150.statcan.gc.ca/n1/pub/45-28-0001/2020001/article/00051-eng.htm 135 Statistics Canada, The social and economic concerns of immigrants during the COVID-19 pandemic, May 1, 2020. https://www150.statcan.gc.ca/n1/pub/45-28-0001/2020001/article/00012-eng.htm

55
Figure 32 Police-reported hate crime motivated by specifc race or ethnicity, 2014-2019
Additional monitoring Aggregating the many ways in which systemic racism and oppression are expressed—explicitly and implicitly, interpersonally or institutionally—is challenging, so population-level indicators of stigmatization and violence are limited to police or other incident data or perception-based surveys. As part of broader efforts to collect and publish disaggregated data it can be expected that more surveys will address the perceptions of people in racialized groups. As well, some specific population health surveys should make intentions to collect data on the different experiences of different groups in Vancouver:
• The future iteration of the My Health My Community survey, which collects important indicators on people’s sense of belonging, safety and experiences in the community, is expected to launch in the near future.
5.6. Mental health impacts
Mechanisms of impact As the pandemic enters its second year, the mental health impacts on the population are widespread. A public health imperative to stay apart impacts people’s need for connection. And a long emergency with profound changes to everyday life does not yet have a clear resolution in sight. There is hope for the deployment of mass vaccination, but “solving” COVID-19 is far from a certainty. There are two distinct mechanisms by which the pandemic may disproportionately impact the mental health of some Vancouver residents:
• Some people have experienced a loss of connection, in a city that has already been known for isolation, loneliness and a lack of social support networks. This may result from physical barriers created by public health advice to keep distance and a lack of physical mobility, or from social and emotional barriers to forming and maintaining connections. While many people and communities have shown resilience in finding new ways to connect, new technologies for communication and connection do not replace interpersonal interactions, and these technologies are not equitably accessible across the population. As the winter months approach and outdoor spaces become less comfortable and accessible, people may face increased isolation as the pandemic continues.
• There is widespread anxiety, stress and uncertainty about the pandemic and what course it will take in the near and distant future. This affects people in many ways, not least is how people define their own risk and the impacts the pandemic has had on them.

56
Scale of impacts Some indicators of the scale of impacts on social connections in Vancouver are:
• In Vancouver, 110 thousand people, 18% of the population, live alone.136 • Before the pandemic, 50% of adults had fewer than four people in their support network that they could
confide in or turn to for help. Only 54% of adults had a strong or somewhat strong sense of belonging to their community.137
Anxiety, stress and uncertainty are widespread across the population, but some specific measures of how this impact may disproportionately land on certain members of the community are:
• 18% of adults in Vancouver reported fair or poor mental health before the pandemic.138 • 49% of Vancouver respondents to the BCCDC survey reported worsening mental health in May. 139 • 18% of Vancouver respondents reported being extremely or quite stressed in May.140
Disaggregated and neighbourhood-level data The charts and maps on the following page illustrate key indicators from the BCCDC’s population health survey, conducted in May 2020. They show:
• Younger adults, white and South Asian residents and female residents were all more likely to report worsening mental health. Geographically, there is a clear pattern of people in more central neighbourhoods being more likely to report worsening mental health, reflecting the younger demographics of these areas.
• Stress was highest among people in their 40s, with younger people generally more likely to report high levels of stress than older people. There was also a clear gradient by income. The highest rates of stress were seen among residents of the Downtown Eastside.
• A majority of parents in most age groups and neighbourhoods reported that school closures and other factors had increased their child’s stress in May 2020. Oakridge/Marpole and Renfrew-Collingwood were exceptions to this pattern.
• People in their 30s and with higher levels of formal education were most likely to report that they found the pandemic to be thought-consuming. Rates were highest in central neighbourhoods but also higher on the city’s west side than the east side.
• Feelings of helplessness showed the greatest variation by people’s racial identities, with Black folks least likely to feel helpless and Japanese and Korean residents most likely to feel helpless. Residents of Kensington and Northeast False Creek were most likely to report helplessness, with a general pattern of midtown neighbourhoods having a higher rate of this indicator.
• Interestingly, feelings of control did not mirror feelings of helplessness; instead, male and white respondents were most likely to feel in control.
136 Statistics Canada, 2016 Census of Population. 137 Vancouver Coastal Health/Fraser Health, My Health My Community Survey 2013-2014. 138 Vancouver Coastal Health/Fraser Health, My Health My Community Survey 2013-2014. 139 BC Centre for Disease Control, May 2020 Your Story Our Future Survey. 140 BC Centre for Disease Control, May 2020 Your Story Our Future Survey.

57
Figure 33 Vancouver residents reporting worsening mental health by population group and neighbourhood, May 2020
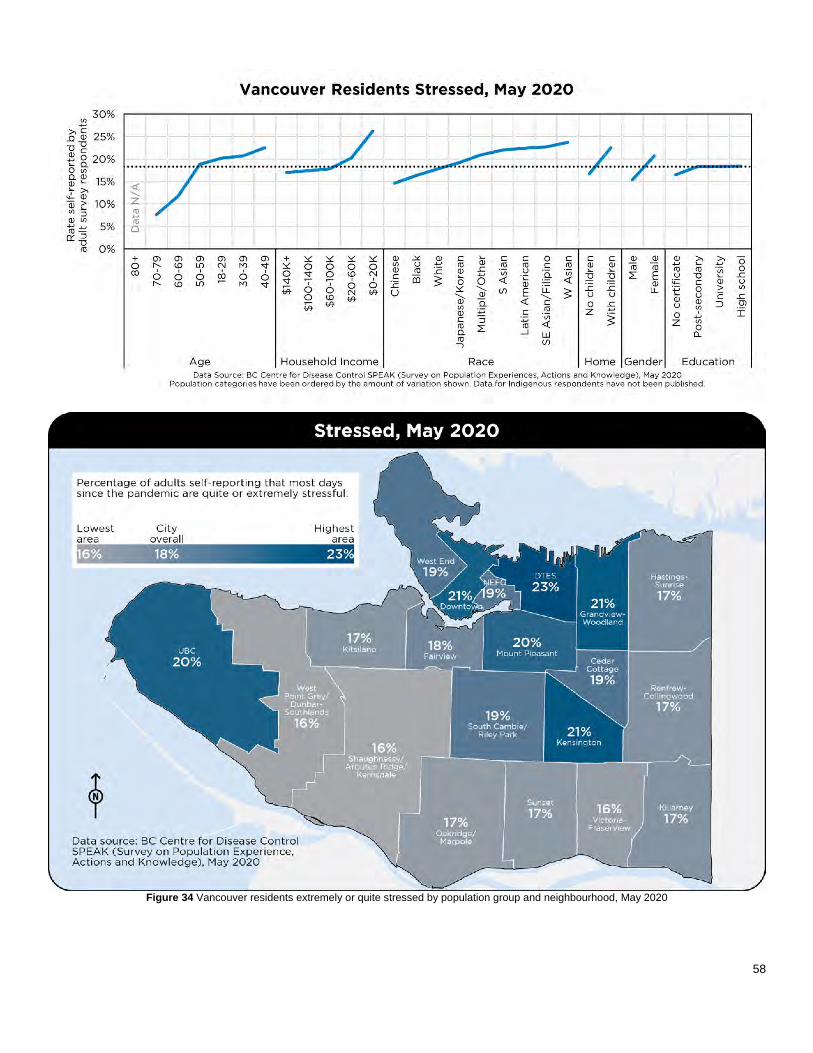
58
Figure 34 Vancouver residents extremely or quite stressed by population group and neighbourhood, May 2020
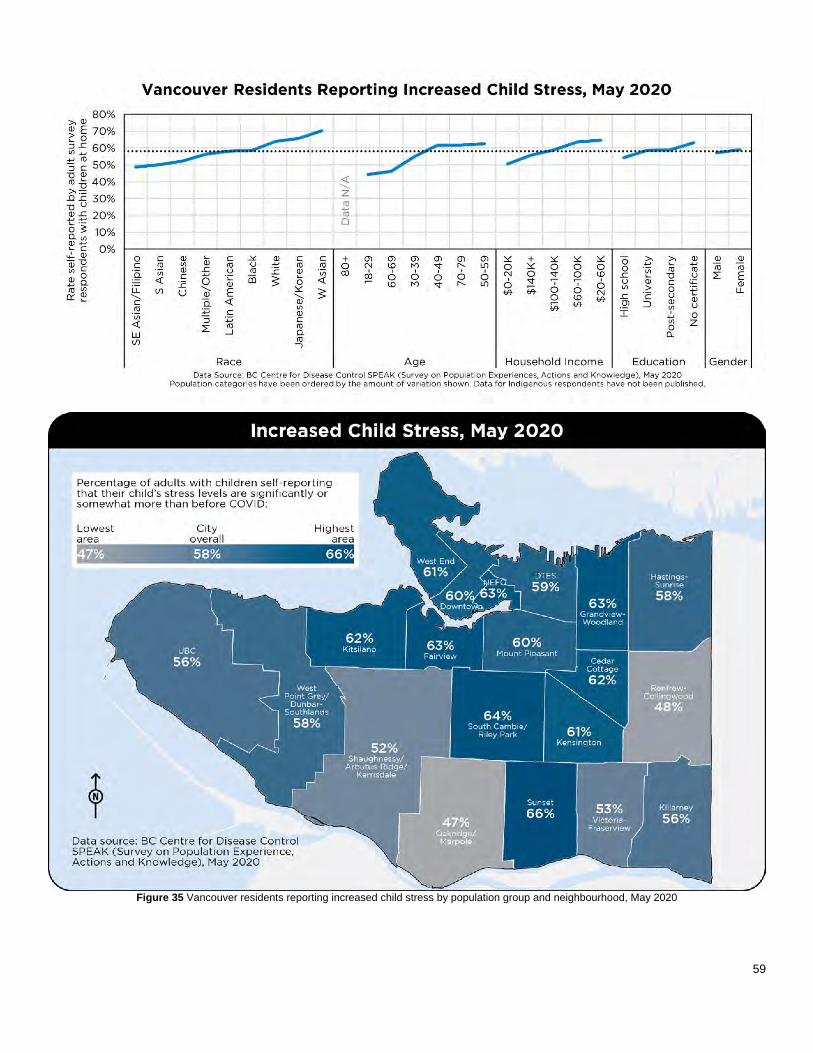
59
Figure 35 Vancouver residents reporting increased child stress by population group and neighbourhood, May 2020

60
Figure 36 Vancouver residents who find COVID-19 thought-consuming by population group and neighbourhood, May 2020

61
Figure 37 Vancouver residents feeling helpless by population group and neighbourhood, May 2020

62
Figure 38 Vancouver residents feeling in control by population group and neighbourhood, May 2020

63
Intersecting inequities As a high level indicator of the risk of isolation, Figure 39 below shows the rate at which people in selected demographic groups live alone. Older adults and seniors are the most likely to fall into this category, with nearly 30% of Vancouverites 65 and older living on their own. Indigenous, Black and white residents are more likely to live alone than people in other racialized groups. People with English mother tongue are more likely to live alone than people with other first languages. And people living alone make up a disproportionate share of those with relatively lower incomes.
Figure 39 Rate of people in indcated groups that live alone, 2016
Throughout the pandemic, there have been a number of surveys and other tools to understand the differential mental health impacts of the pandemic on different populations:
• Across Canada, Indigenous survey respondents were more likely to report poor and worsening mental health, and increased stress and anxiety, than non-Indigenous respondents. Indigenous women were particularly impacted.141
• Across Canada, respondents in visible minority groups are more likely to report poor mental health and symptoms of anxiety than white respondents. There are also important differences between people with different racial identities: South Asian, Black and Filipino respondents were most likely to self-report fair or poor mental health; South Asian and white respondents were more likely to say that their mental health had worsened because of physical distancing; and Filipino, South Asian and Black respondents were most likely to describe symptoms consistent with a generalized anxiety disorder.142
141 Statistics Canada, Indigenous people and mental health during the COVID-19 pandemic, June 23, 2020. https://www150.statcan.gc.ca/n1/pub/45-28-0001/2020001/article/00035-eng.htm 142 Statistics Canada, The mental health of population groups designated as visible minorities in Canada during the COVID-19 pandemic, September 2, 2020. https://www150.statcan.gc.ca/n1/pub/45-28-0001/2020001/article/00077-eng.htm

64
• Before the pandemic, there were differences in mental health by sex and gender. Female-identified people in Vancouver were a bit less likely than male-identified folks to report good mental health.143 Since the pandemic, there is evidence that mental health impacts have been disproportionately felt by self-identified women and people who identify outside of a binary conception of sex and gender. Across Canada, nearly two-thirds of gender diverse respondents to a national survey reported fair or poor mental health, a much higher rate than those who identified as female or male. Female-identifying and gender-diverse respondents were more likely than male-identified respondents to report worsening mental health. More than 60% of gender diverse respondents reported moderate or severe symptoms of generalized anxiety disorder during the pandemic.144
• Across Canada, children and youth face particular challenges for good mental health. In 2019, nearly 20% of youth age 15-17 reported fair or poor mental health, and 57% of respondents to a crowdsourced survey in that age group have reported worsening mental health during the pandemic.145
• Across Canada, survey respondents who parent children with disabilities express particular concern for their children’s well-being, including mental health, loneliness and isolation.146
• For seniors, there is a known correlation between social isolation and mortality.147 In Vancouver seniors are much less likely to have four or more people in their support networks.148
• Among crowdsourced survey respondents, recent immigrants have been more likely to report poor mental health while established immigrants have been more likely to report good mental health. A majority of recent immigrant respondents have indicated worsening mental health during the pandemic, and recent immigrant respondents are also more likely to report symptoms of generalized anxiety disorder than other respondents.149
Additional monitoring As with experiences of oppression, mental health, social connections, belonging and other indicators are tremendously important but difficult to find timely local data for. Ongoing perception-based surveys are essential to capture trends in the mental health impacts disproportionately experienced by different groups in the population.
143 Vancouver Coastal Health/Fraser Health, My Health My Community Survey 2013-2014. 144 Statistics Canada, Gender differences in mental health during the COVID-19 pandemic, July 9, 2020. https://www150.statcan.gc.ca/n1/pub/45-28-0001/2020001/article/00047-eng.htm 145 Statistics Canada, Canadian Health Survey on Children and Youth, 2019, July 23, 2020. https://www150.statcan.gc.ca/n1/daily-quotidien/200723/dq200723a-eng.htm 146 Statistics Canada, The impact of the COVID-19 pandemic on Canadian families of children with disabilities, August 27, 2020. https://www150.statcan.gc.ca/n1/pub/45-28-0001/2020001/article/00066-eng.htm 147 Statistics Canada, Social isolation and mortality among Canadian seniors, June 17, 2020. https://www150.statcan.gc.ca/n1/pub/82-003-x/2020003/article/00003-eng.htm 148 Vancouver Coastal Health/Fraser Health, My Health My Community Survey 2013-2014. 149 Statistics Canada, Mental Health Status of Canadian Immigrants During the COVID-19 Pandemic, July 14, 2020. https://www150.statcan.gc.ca/n1/pub/45-28-0001/2020001/article/00050-eng.htm

65
6. Assessing the current state
Sunny Nestler, “Conework Floe”, part of the City of Vancouer’s Platforms 2020 public art series.
For each of the six impact areas described, there is clear evidence of disproportionate impacts that correlate strongly to ongoing health inequities. The coronavirus per se does not discriminate, but people, institutions and systems do, and the result is an ongoing pandemic that exacerbates Vancouver’s pre-existing issues of an inequitable distribution of resources, barriers to access for many populations and systemic racism and other forms of discrimination. COVID-19 is a shock, and now an ongoing stress, for our community, but responding to the virus is not separate from ongoing work toward equity, resilience and a healthy city. This section assesses the current state by offering recommendations for how the immediate COVID response and recovery work can be connected to ongoing policy challenges and opportunities.
6.1. Reframe: living with the new abnormal and multiple pandemics A first key finding is that the pandemic has progressed and continues to progress at different rates for people based on their own health status, their family and social context, the employment sector they work in and other factors. Rather than understanding the pandemic in a linear way—from “response” to “reopen” to “recovery”, for instance, or from “first wave” to “second wave”—it is instead better to understand that Vancouver is in the midst of multiple versions of a pandemic simultaneously. After a state of emergency approaching its second year, some people are still acutely aware of the risks of COVID-19 while others find the secondary and unintended impacts of the public health response to be of greater concern. There is no one narrative of the pandemic: some people have not changed their orientation to it since March, while others are anxious to return to the activities that they knew in the before times. While vaccination is underway, the realities of COVID-19 are unlikely to change immediately. Adaptation is likely a better framing for Vancouver’s efforts than recovery, and the impacts of the pandemic should be seen as an ongoing part of the context that City policy responds to. We will be living with COVID-19 for some time to come, and it will continue to be experienced in very different ways across the population.
6.2. Rescale: acknowledging how many people are disproportionately impacted In each of the impacts identified in this report, an important observation is that the number of people impacted is great. While not everyone experiences all compounding impacts or inequities together, it is still the case that the pandemic exaggerates and exacerbates inequities at a scale that Vancouver has not seen in recent times. A number of indicators—people with medical conditions that increase the risk of severe illness, people living with income poverty unable to meet basic needs, people with worsened mental health—show that disproportionate impacts are experienced by a very large number of people. If 250 thousand people in this city make less than a living wage necessary to achieve a basic standard of living, this necessitates a large scale and systemic policy response; individualized interventions cannot be delivered at that volume.

66
And, indeed, the scale of the pandemic is such that some policies from senior levels of government have changed more quickly than has been possible before. The Canadian Emergency Response Benefit may have decoupled people’s basic needs from the necessity of employment income; it remains to be seen if it will continue in a form that leads to a universal income, but it illustrates that systemic change is possible. There are, of course, unavoidable limits on finances and jurisdictional mandate that municipalities face; Vancouver cannot deliver social programs that reallocate resources at the scale that the provincial and federal governments can. But the City does have the opportunity to think more systemically about its own role and mandate in the pandemic, and the resources, spaces and infrastructure that it does have available. The rapid closure of community centres and other services early in the pandemic had severe consequences and impacted people’s access to basic needs and connections to community supports. This led to missed opportunities to demonstrate safe ways to keep essential community services open and operating. There is also an opportunity to think regionally. Many other municipalities in Metro Vancouver have attempted to respond to the needs of populations disproportionately impacted by the pandemic, but there has been a lack of regional coordination and collaboration on these issues. Particularly when such a large number of people are impacted, there is an opportunity to recognize that these impacts are common across boundaries and to pursue mechanisms by which municipalities can learn from each other and develop a coordinated response. Anticipating inequities and working collaboratively to identify disproportionately impacted groups at the beginning of the pandemic would also have supported a stronger response and recovery: gaps in the scale of response for seniors, persons with disabilities, children and youth were apparent.
6.3. Respond: naming inherent tensions in addressing impacts Significant efforts in Vancouver’s response have gone to addressing the immediate and specific needs of people experiencing the greatest level of vulnerability. The City developed online and print tools to identify food assets and gaps and connect service providers to people needing meals. The City provided sanitation, water and washroom facilities in the Downtown Eastside and along Kingsway. These should be seen as important successes, and there is a compelling moral argument to prioritizing these kinds of interventions, especially if policies of senior governments are not adequate to support populations that experience multiple disproportionate impacts. If these efforts demonstrate the importance of policies that enable food access and food security, or that ensure basic needs like washrooms and hygiene can be met, then there is also an important opportunity to scale these efforts up. However, as long as resources are seen to be limited, there will be a necessary tension between individualized efforts and larger-scale policy change, and limits on what can be achieved one project or one piece of infrastructure at a time. Given the number of people experiencing disproportionate impacts in the city, a choice to focus on individuals with the greatest immediate need will necessarily mean that some others are not addressed. Limits on personnel, relationships and resources will limit the number of people that can be supported at a time. In public health the “prevention paradox” refers to the fact that the greatest impact is often achieved by population-wide initiatives rather than those that target people at highest risk. Moving to upstream, preventive measures is a better strategy for addressing the overall health of a community, but it comes with the trade-off that direct measures to address immediate needs may be missed. These tensions are built into the practice of social planning and policy, and navigating how to balance both upstream and downstream efforts is an ongoing challenge, but also a core part of the work. In the specific context of COVID-19, there is an opportunity for the City to be more intentional about the balance it is striking and to articulate the niche that the City government can occupy in the context of the disproportionate impacts of the pandemic across the population.

67
6.4. Reset: shifting from emergency response to ongoing work If balancing these priorities is a difficult part of social planning generally, it is likely even more difficult in the context of an emergency operation that is almost entirely focused on immediate and rapid response to a crisis. As part of reframing the pandemic, it may be appropriate to re-evaluate and re-scope the role of local and regional emergency operations centres in relation to core and ongoing policy work, and develop clearer mandates for how the disproportionate impacts of the pandemic can be addressed. In particular, if the pandemic is reframed to be an ongoing challenge rather than a discrete event, then there will be a need for much longer-term planning than an emergency response can provide. Emergency responses enable rapid deployment of short-term resources but are less equipped to develop broader policy responses. The initial activation of Vancouver’s Emergency Operations Centre took place in the context of a response to a sudden shock, and it was scaled up through a mass migration of staff from multiple City departments to the EOC. As the pandemic progresses, there is an opportunity to be more thoughtful about the ongoing role for all City and regional departments and partners. The challenge is to determine how a strategic, sustained response can be delivered through these organizational structures.
6.5. Relate: developing meaningful relationships with communities Given the breadth of the pandemic, grounding policy and projects in evidence is essential to ensure a response to systemic inequities and disproportionate impacts. As noted throughout the previous section, though, data that is both Vancouver-specific and timely is difficult to find. Data will be imperfect, so it will continue to be necessary to triangulate multiple sources or interpolate city-level data from provincial or national numbers. And, this also underscores the importance of community knowledge and experience as an input. Early in the pandemic, staff relationships with organizations serving people with disabilities helped surface disproportionate impacts long before they began appearing in survey data. Grounding policy in community knowledge is essential. This also demonstrates the importance of the non-profit sector in serving the city’s different communities and populations who have had different experiences with COVID-19. Non-profit organizations are a key delivery mechanism of social services, but also play a key role in convening and amplifying the needs of different communities. The sector itself has been impacted substantially by the pandemic and efforts to stabilize and support non-profit organizations are essential to supporting populations disproportionately impacted by the pandemic. The challenge for the City’s ongoing response is how to coordinate its many relationships with community members, groups and organizations. There are a number of opportunities for stronger data infrastructure or relationship management software; for better documentation of inputs and systematized follow-up across the City organization; and dedicating sufficient time for staff to share knowledge and pursue collaborative solutions.
6.6. Recommit: moving upstream toward social sustainability And, finally, a common theme to all of these recommendations is that the pandemic response should not be seen as separate from ongoing policy work. As noted throughout this report, it is hard to disentangle the disproportionate impacts of the COVID-19 pandemic from broader projects toward health, equity, resilience and sustainability. Existing policy, notably the Healthy City Strategy, already contains a substantive framework for understanding the social determinants of health and taking action to address inequities within them. The forthcoming Equity Framework strengthens a collective understanding and responsibility to address how systemic racism and other forms of oppression have been reflected in the City’s plans, priorities and allocation of resources.

68
Supporting and resourcing these ongoing efforts is challenging, especially in a state of emergency. But the opportunity is significant as well. A renewed Healthy City Strategy, with a more intentional equity focus, could be a powerful tool for a stronger and clearer role for the City in addressing the disproportionate impacts of the ongoing pandemic. A paradigm shift to focus on systems and policies rather than solely crisis response would help contextualize COVID-19 as an emergency that reveals, rather than creates, a profoundly inequitable city. And it creates space for a collective, collaborative approach to building a socially sustainable city, one that is much better equipped to respond to the disproportionate impacts of a global pandemic because of its ongoing effort to address the root causes of those impacts. COVID-19 has shown that there are clear health consequences to land use, housing, employment and economic planning decisions, and that the most essential services that keep our city functioning depend on people who face significant health inequities. Major planning projects like the Vancouver Plan or the forthcoming update to Metro Vancouver’s Regional Growth Strategy have an opportunity for much stronger intentions toward a healthy, equitable and resilient city.

69
7. Conclusion: from pandemic response to a healthy city for all
For over ten months, the COVID-19 pandemic has acutely impacted the population, economy and services of everyone in Vancouver. But these impacts have not been equitably felt by everyone in the city. For ten months, the City of Vancouver organization, together with partners from other levels of government and the community, have made extraordinary efforts to deliver an emergency response that pivots quickly to address immediate needs. As the pandemic approaches its second year, however, and as signs of hope appear in the form of vaccination against COVID-19, it is timely to ask what a more sustainable and preventive approach might have looked like. As in any emergency, responding to the downstream impacts of a crisis is a resource-intensive process that quickly becomes difficult to scale to the level of impact experienced by the community. COVID-19 certainly has unique features and unique challenges that have necessitated a bespoke response. The City’s emergency operations centre had to rapidly develop a model for remote operations to avoid physical crowding. Social services have had to develop new ways to connect with people distantly, an extra challenge for population groups that do not have ready access to technology. To be sure, many individuals have faced particular challenges during this time that acute interventions have made a material difference in addressing. But this report has shown that the current state of disproportionate impacts of the pandemic is, in aggregate, not so different from the pre-existing health inequities that were present in our city. Overall, the COVID-19 pandemic has shown the health challenges Vancouver was already facing, not created new ones. In the best-case scenario, where worldwide vaccinations are successful in bringing the pandemic under control, where people can travel and gather and socialize and be in physical contact with each other, it will be important to remember the lessons of the pandemic. The social determinants of health are not abstractions; they materially affect the health and well-being of the population. Inequities in income, housing, employment and access to services and supports have a direct connection to the level of exposure people have to a serious disease. The material consequences of racism and other forms of discrimination are measured in people’s health and people’s lives. It is well past time to see health—more specifically, health equity—as an outcome of all policies, plans and investments made by the City. Nineteen years ago, the City adopted a definition of sustainability that includes social, environmental and economic components, but Vancouver has yet to demonstrate what a socially sustainable city can look like. Seven years ago the City adopted Healthy City targets to address early childhood vulnerability, to reduce poverty, to promote belonging and safety, connections and resilience across the population, but these targets are still a long way from being achieved. Perhaps this is the uncertainty of the current state: COVID-19 has shown the need for paradigmatic shifts in how people can meet their basic needs, connect with each other and have equitable access to healthy environments, but it will be all too easy to forget this lesson after the virus fades away. Next pandemic, what needs to be different? How can we get there?
Bagua Artist Association, “Roadside Diary”, part of the City of Vancouver’s Platforms 2020 public art series