porcine gd t lymphocytes can be categorized into two ... · porcine gd t lymphocytes can be...
TRANSCRIPT

of June 1, 2018.This information is current as
to Expression of CD2 and Level of TCRDevelopmentally Distinct Subsets accordingCategorized into Two Functionally and
T Lymphocytes Can BeδγPorcine
Katerina Stepanova and Marek Sinkora
http://www.jimmunol.org/content/190/5/2111doi: 10.4049/jimmunol.1202890January 2013;
2013; 190:2111-2120; Prepublished online 28J Immunol
Referenceshttp://www.jimmunol.org/content/190/5/2111.full#ref-list-1
, 12 of which you can access for free at: cites 39 articlesThis article
average*
4 weeks from acceptance to publicationFast Publication! •
Every submission reviewed by practicing scientistsNo Triage! •
from submission to initial decisionRapid Reviews! 30 days* •
Submit online. ?The JIWhy
Subscriptionhttp://jimmunol.org/subscription
is online at: The Journal of ImmunologyInformation about subscribing to
Permissionshttp://www.aai.org/About/Publications/JI/copyright.htmlSubmit copyright permission requests at:
Email Alertshttp://jimmunol.org/alertsReceive free email-alerts when new articles cite this article. Sign up at:
Print ISSN: 0022-1767 Online ISSN: 1550-6606. Immunologists, Inc. All rights reserved.Copyright © 2013 by The American Association of1451 Rockville Pike, Suite 650, Rockville, MD 20852The American Association of Immunologists, Inc.,
is published twice each month byThe Journal of Immunology
by guest on June 1, 2018http://w
ww
.jimm
unol.org/D
ownloaded from
by guest on June 1, 2018
http://ww
w.jim
munol.org/
Dow
nloaded from

The Journal of Immunology
Porcine gd T Lymphocytes Can Be Categorized into TwoFunctionally and Developmentally Distinct Subsets accordingto Expression of CD2 and Level of TCR
Katerina Stepanova*,† and Marek Sinkora*
Porcine gd T cells have two levels of TCRgd expression. Whereas TCRgdmed cells are mostly CD2+CD82 and CD2+CD8+,
TCRgdhi cells are highly enriched for CD22CD82. This distribution is independent of bacterial colonization and it is already
established in the thymus prior to export of gd cells to the periphery. Sorting and cultivation experiments revealed that CD22
CD82 gd cells are unable to acquire CD2 and CD8, whereas CD2+ subsets can gain or loose CD8. There is also differential
susceptibility for proliferation between CD2+ and CD22 gd cells. Although CD22CD82 almost do not proliferate, proliferation of
CD2+CD82 and CD2+CD8+ is substantial. Population of CD22 gd cells is also absent in CD1+ immature thymocytes. Additionally,
subpopulations of CD2+ and CD22 gd cells in the thymus differ in expression of auxiliary surface molecules such as CD25,
CD45RA/RC, and MHC class II. Moreover, TCRgdhi cells can generate TCRgdmed cells but never the opposite. The only
exception is the thymus, where a few TCRgdmed cells can be induced to TCRgdhi but only under IL-2 influence. The repertoire
of TCRd is polyclonal in all subsets, indicating that there is the same extent of diversification and equal capability of immune
responses. Results collectively indicate that CD2 expression determines two lineages of gd cells that differ in many aspects.
Because CD22 gd cells are missing in the blood of humans and mice but are obvious in other members of gd-high species such
as ruminants and birds, our findings support the idea that circulating CD22 gd T cells are a specific lineage. The Journal of
Immunology, 2013, 190: 2111–2120.
Swine belong to the group of gd-high species in which gdT lymphocytes are not preferentially limited to epitheliaand may account for .70% of all T cells (1, 2). Tra-
ditionally, gd T cells in swine are subdivided into three subsetsbased on their expression of CD2 and CD8 and include CD22
CD82, CD2+CD82, and CD2+CD8+ cells (3–7). These individualsubsets differ in their homing characteristic (8) and cytotoxicactivities (7, 9). However, except for the indication that CD82
can differentiate into CD8+ gd T cells (10), there is no reportshowing whether the CD2/CD8 subsets represent separate andindependent lineages or whether they represent subsequentlydeveloping subsets. Ontogenetic and developmental studies inthe thymus indicate separate lineage commitment (5, 11). Incontrast, results of recent work (12) point to a possibility thatthe CD22CD82 subset is mostly composed of naive cells, whereasCD2+CD82 cells may represent an effector/memory subset, andCD2+CD8+ gd T cells probably represent terminally differentiated
cells. This would correspond with the finding that the latter subsetis cytotoxic (7, 9) and would indicate that CD2/CD8 subpopula-tions of gd T cells represent subsequently developing stages.It is generally accepted that unlike ab T cells, gd T lymphocytes
develop in the thymus without any selection for preantigen recep-tors (such as pre-TCRab) and also without any CD3lo or TCRlo
transitional stage (5, 11, 13, 14). However, it is known that TCRcan be expressed on gd T cells in two densities: medium and high(15, 16). Unfortunately, the relevance of TCRgdmed/hi expressionwas never studied in more detail. Studies in ab T cells indicatethat the differential expression level of TCR may be a result ofactivation and is regulated by tyrosine kinase Lck (17).Our previous studies revealed the basic distribution and phe-
notypic profile of porcine gd T cells (3, 12, 18), their ontogeny (3,11), their development in the thymus (5, 11, 13), and the repertoirediversification of their TCR (19). In this study, we used high-speedflow cytometry sorting and cultivation techniques to characterizedifferent subpopulation of gd T cells defined by TCRgd, CD2, andCD8 expression. Results show many differential features of CD22
CD82 versus CD2+CD82 and CD2+CD8+ gd T cells and collec-tively indicate that CD2 expression determines two lineages of gdcells in swine.
Materials and MethodsExperimental animals
Animals used in the study were Minnesota miniature/Vietnam-Asian-Malaysian crossbred piglets bred in Novy Hradek (3, 20). All pigs werehealthy and normal at slaughter. Germ-free piglets were recovered fromgilts by hysterectomy at day 112 of gestation. Gestation age was calculatedfrom the day of mating. After birth, germ-free piglets were kept in isolatorunits under germ-free conditions at all times and monitored for the un-wanted appearance of bacteria. All animal experiments were approved bythe Ethical Committee of the Institute of Microbiology, Czech Academy ofScience, according to guidelines in the Animal Protection Act.
*Department of Immunology and Gnotobiology, Institute of Microbiology of theAcademy of Sciences of the Czech Republic, v.v.i., 549 22 Novy Hradek, Czech Re-public; and †Faculty of Science, Charles University, 128 40 Prague 2, Czech Republic
Received for publication October 16, 2012. Accepted for publication December 19,2012.
This work was supported by Czech Science Foundation Grant P502/12/0110, GrantAgency of Charles University Grant 43-251119, and by the Institutional ResearchConcept of the Institute of Microbiology of the Academy of Sciences of the CzechRepublic, v.v.i. RVO: 61388971.
Address correspondence and reprint requests to Dr. Marek Sinkora, Department ofImmunology and Gnotobiology, Institute of Microbiology of the Czech Academyof Science, v.v.i., Doly 183, 549 22 Novy Hradek, Czech Republic. E-mail address:[email protected]
Abbreviations used in this article: MHC-II, MHC class II; pAb, polyclonal Ab; SLA-DR, swine MHC class II leukocyte Ag type DR.
Copyright� 2013 by The American Association of Immunologists, Inc. 0022-1767/13/$16.00
www.jimmunol.org/cgi/doi/10.4049/jimmunol.1202890
by guest on June 1, 2018http://w
ww
.jimm
unol.org/D
ownloaded from

Preparation of cell suspensions
Cell suspensions were prepared essentially as previously described (3, 21).Briefly, heparinized (20 U/ml; LECIVA-Zentiva) blood was obtained byintracardial puncture. Cell suspensions from the spleen and thymus wereprepared in cold PBS by carefully teasing the tissues using forceps andthen by passage through a 70-mm mesh nylon membrane. In the case of theblood and spleen, lymphocyte fractions were purified using a Histopaque-1077 (Sigma-Aldrich, St. Louis, MO) gradient centrifugation. Beforestaining for flow cytometry, all cell suspensions were washed twice in coldPBS containing 0.1% sodium azide and 0.2% gelatin from cold water fishskin (PBS-GEL; all chemicals were from Sigma-Aldrich), filtered througha 70-mm mesh nylon membranes, and cell numbers were determined bya hemacytometer.
Immunoreagents
The following mouse anti-pig mAbs, whose source and specificity weredescribed earlier (3, 4, 21), were used as primary immunoreagents: anti-TCRgd (PPT26, IgG1; PPT16, IgG2b; or PGBL22A, IgG1), anti-CD1 (76-7-4, IgG2a), anti-CD2 (MSA4, IgG2a; or 1038H-5-37, IgM), anti-CD8(76-2-11, IgG2a; or PT36B, IgG1; VMRD, Pullman, WA), anti-CD25(K231-3B2, IgG1), anti-CD45RA (FG2F9, IgG1), anti-CD45RC (MIL5,IgG1), and anti–swine MHC class II (MHC-II) leukocyte Ag type (SLA-DR; 1038H-12-34, IgM). Goat polyclonal Abs (pAbs) specific for mouseIg subclasses labeled with FITC, PE, PE/Cy5 (alternatively PE/Cy7), orallophycocyanin were used as secondary immunoreagents (South-ernBiotech, Birmingham, AL). All immunoreagents were titrated for op-timal signal/noise ratios. In the case of indirect subisotype staining,primary isotype-matched mouse anti-rat mAbs were used as negativecontrols. Secondary pAbs were tested for cross-reactivity (no primarymAbs) and also for cross-reactivity with primary isotype-mismatchedmouse anti-pig mAbs. No background or false staining was observed. Insome cases, directly labeled anti-TCRgd/PE-DY747 mAb (PPT16; Exbio,Prague, Czech Republic) and/or different directly labeled mAbs were used.These were labeled with Zenon labeling technology (Molecular Probes,Eugene, OR) according to a protocol recommended by the manufacturer.
Staining of cells
Staining of cells for flow cytometry was performed as described previously(3, 11, 21) by indirect subisotype staining. Briefly, multicolor staining wasdone using cells that had been incubated with a combination of three(three-color staining) or four (four-color staining) primary mouse mAbs ofdifferent subisotypes. Cells were incubated for 30 min and subsequentlywashed twice in PBS-GEL. Mixtures of goat secondary pAbs conjugatedwith different fluorochromes were then added to the cell pellets in ap-propriate combinations. After 15 min, cells were washed three times inPBS-GEL and analyzed by flow cytometry. In some experiments, directstaining was used to elucidate the effect of direct versus indirect staining.In that case, the procedure was the same as described above but only one30-min incubation step was used. In the case of intracellular staining, cellsthat had been indirectly stained for cell surface molecules were subse-quently intracellularly stained using an IntraStain kit according to a pro-tocol recommended by the manufacturer (DakoCytomation, Glostrup,Denmark).
Flow cytometry and cell sorting
Samples were measured or sorted on standard FACSCalibur or FACSAriaIII flow cytometers, respectively (Becton Dickinson ImmunocytometrySystems, Mountain View, CA). In each measurement, 300,000–700,000events were collected. Sorted cells were collected into 1) inactivated FBS(PAA, Pasching, Austria) in the case of cultivation, or 2) empty tubes in thecase of PCR amplification. Electronic compensation was used to eliminateresidual spectral overlaps between individual fluorochromes. Forwardscatter area/forward scatter width parameters were used for elimination ofdoublets. PCLysis or FACSDiva software (Becton Dickinson Immunocy-tometry Systems) was used for data processing.
Proliferation assay and CFSE labeling
Proliferation history of cells was determined by CFSE (Sigma-Aldrich)using techniques described previously (22). Briefly, suspensions of 4 3107/ml fresh cells or 1 3 106/ml sorted cells in PBS or PBS with 5% FBS,respectively, were stained by 5 mM/ml CFSE solution under vigorousmixing for 5 min. Final suspension was 103 diluted by PBS supplementedwith 5% FCS, washed three times in the same diluting solution, resus-pended in culture medium, and cultivated. After cultivation, suspensionswere stained by indirect subisotype staining as described above and ana-lyzed by flow cytometry.
Cell cultures and stimulation in vitro
Cell cultures were done in RPMI 1640 medium supplemented withL-glutamine and 25 mM HEPES, 10% FBS, 100 U penicillin, and 0.1 mg/ml streptomycin (all chemicals were from PAA). Final concentration ofcells was always set to 2 3 106 cells/ml and cells were cultivated with oneof the following: 50 ng/ml PMA (Sigma-Aldrich), 100 U/ml porcine rIL-2 (RayBiotech, Norcross, GA), 10 ng/ml porcine rIL-4 (ProSpec, NessZiona, Israel), 5 mg/ml Con A (Sigma-Aldrich), or without any stimula-tion. As a control, a part of the cells was also stored at 4˚C. Some com-binations of the above-mentioned activators were also used and PMAwassometimes used with 1 mg/ml ionomycin (Sigma-Aldrich). Culturing timeswere 3, 4, or 7 d.
Confocal microscopy
Confocal microscopy was done to test the effect of cross-linking withsecondary pAbs to patching and capping of stained molecules. Cell sus-pensions from the spleen were washed in cold PBS, followed by incubationfor 30 min at 4˚C or 37˚C with directly labeled or unlabeled primary anti-TCRgd, anti-CD2, and anti-CD8 mAbs. Afterward, cells were washedtwice in PBS and 1) in the case of directly labeled mAbs fixed with 2%paraformaldehyde for 15 min, or 2) in the case of unlabeled mAbs incu-bated with the appropriate fluorescence-labeled secondary pAbs for anadditional 30 min at 4˚C or 37˚C, washed twice in PBS, and fixed with 2%paraformaldehyde. Resulting cell suspensions were visualized by OlympusIX-81 microscope equipped with SV-1000 confocal system and analyzedby Olympus FV10-ASW 2.0 viewer software (Olympus, Tokyo, Japan).Cell suspensions were also analyzed by flow cytometry for the number ofpositive cells and expression level of stained molecules.
PCR amplification and CDR3 spectratyping
The diversity in the TCRd repertoire is overwhelmingly determined by thediversity in the d-chain third complementary region (CDR3). Thus, sepa-ration of CDR3 regions for TCRd on polyacrylamide sequencing gelsprovides a clonotypic analysis of porcine gd T cells showing their level ofdiversification (19). This procedure for measuring CDR3 polymorphism iscalled spectratyping and was performed essentially as described previously(5, 12, 13, 19). Briefly, 50,000 or 100,000 sorted cells were immediatelyafter sort dissolved in 0.5 ml TRI Reagent (Sigma-Aldrich). In a particularanalysis, only the same amount of sorted cells was used for preparation ofRNA and cDNA (by random hexamer primers). Gene segments for VDJregions of TCRd1 (TRDV1) were PCR amplified and efficiency of PCRamplification was checked on agarose gels. Amplified segments were nextreamplified only for CDR3 regions using 32P-labeled primers and theproduct was separated on sequencing gels. Gels were dried and imageswere obtained by fluorescent image analyzer FLA-7000 (Fujifilm, Tokyo,Japan).
Statistical analysis
Data are expressed as the means 6 SD. Differences among the medianfrequency values for sorted and thereafter cultivated populations at 37˚Cand 4˚C were analyzed by one-way ANOVA and a Dunnett multiplecomparison test. Difference between populations of cells originating fromone sample were analyzed by a paired t test. All other comparisons wereanalyzed by an unpaired t test. In all analyses, GraphPad Prism4 software(GraphPad Software, San Diego, CA) was used. A p value ,0.05 wasconsidered statistically significant.
Resultsgd T cells have two levels of TCRgd expression
Natural expression of TCR on porcine gd T lymphocytes occurs intwo densities: medium and high (Fig. 1A). These two subsets aredifferentially distributed among CD2/CD8 gd T cells. AlthoughTCRgdmed cells are preferentially CD2+ (either CD2+CD8+ orCD2+CD82), TCRgdhi cells are mostly CD22CD82.
Indirect staining causes patching of molecules on the surfaceof positive cells but there is no capping, colocalization,induced antigenic modulation, receptor-mediated endocytosis,or activation
Indirect subisotype staining was mostly used reporting this study.Although we can easily control cross-reactivity and nonspecificbinding of used secondary pAbs, we cannot rule out potential cross-
2112 TWO FUNCTIONAL SUBSETS OF PORCINE gd T CELLS
by guest on June 1, 2018http://w
ww
.jimm
unol.org/D
ownloaded from

linking of key signaling molecules on the surface of cells. For thisreason, an effect of direct and indirect staining on the patching andcapping of stained molecules on the surface of gd T cells wasstudied by confocal microscopy (Fig. 1B). Direct staining alwaysproduced uniform circumferential fluorescence of TCRgd, CD2,and CD8 on gd T cells independently of cultivation temperature(Fig. 1B, cells B1–B6). In contrast, indirect staining always pro-duced patching of surface molecules (Fig. 1B, cells B7–B12).Formation of patches after cross-linking with secondary pAbs at4˚C (Fig. 1B, cells B7–B9) indicate that retention of TCRgd, CD2,and CD8 does not require a dynamic cellular response and wasa result of cross-linking alone. This is in agreement with the ob-servation that there was no induced capping and no clear colo-calization of TCRgd/CD2/CD8 (Fig. 1B, cells B7–B9 and cellsB10–B12). Moreover, the possibility of induced antigenic modu-lation and/or receptor-mediated endocytosis by indirect stainingwas excluded by examination of the same cells by flow cytometry(Fig. 1B). If any of these effects would have taken place, thereshould have been numerical and/or expression level differencesbetween samples kept at 4˚C and at 37˚C, which were not observed.
The effect of indirect staining on the responsiveness of gd T cellswas also examined in a culture. Table I shows that behavior of gdT cells that were cultivated either unstained or prestained by in-direct staining is comparable. In agreement with confocal mi-croscopy, there are no differences in proliferation activity (TableI, left two columns), modulation of TCRgd expression level (TableI, right two columns), and/or alteration of CD2/CD8 phenotype(data not shown). This type of analysis also allows examination ofthe effect of various activators and their combinations. The resultsshow that proliferation of gd T cells occurs spontaneously inmedium alone and can be significantly (p, 0.01) increased by IL-2 and Con A activation (Table I, left two columns). There was nosynergistic effect of IL-2 with either PMA or Con A. Althoughionomycin increased proliferation caused by PMA, the differenceswere not statistically significant. For this reason and also becauseof low cell viability and peculiar scatter characteristic of gd
T cells after ionomycin treatment, activation by PMA plus iono-mycin was not further used in this study. Modulation of TCRgdexpression level (Table I, right two columns) occurs also sponta-neously in medium alone and can be significantly (p , 0.01)increased, namely by IL-2 activation. In fact, stimulation by IL-2was significantly different from any other treatment. Again, ad-dition of IL-2 does not synergize with PMA or Con A.
Sorted TCRgdmed and TCRgdhi subsets have different features
Spleen was chosen for most sorting experiments because thereis approximately the same CD2/CD8 gd T cell subsets ratio (12).In any case, confirmation experiments done on other tissues hadcomparable outputs (data not show). Sorted cells were cultivatedfor 2–7 d without any activators (at 4˚C or 37˚C) or supplementedwith PMA, IL-2, or IL4 (Fig. 2). Results show that sortedTCRgdmed cells (Fig. 2A) are unable to increase TCR expressionand never become TCRgdhi (Fig. 2C). In contrast, there is alwaysa part of sorted TCRgdhi cells (Fig. 2B) that spontaneously decreaseTCR expression (Fig. 2D). This downregulation occurs fast and isdetectable within hours. Downregulation of TCRgd does not oc-cur at 4˚C (Fig. 2D; see data for 4˚C) and is independent of anti-TCRgd mAb, direct or indirect staining procedures, and theparticular fluorochrome used (data not shown). Supplementedactivators can enhance the downregulations so that PMA had thehighest impact, followed by IL-2 and IL-4 (Fig. 2D).Analysis of CD2/CD8 subpopulations within TCRgdmed or
TCRgdhi sorted cells revealed that sorted TCRgdmed cells aremostly composed of CD2+CD82 and CD2+CD8+ gd T cells (Fig.
FIGURE 1. gd T cells have two levels of TCRgd expression. (A)
Splenocytes from 2- to 8-wk-old piglets were triple stained by anti-
TCRgd, anti-CD2, and anti-CD8 and expression level of TCRgd is shown
for gated CD22CD82, CD2+CD82, and CD2+CD8+ gd T cells. Flow
cytometry results are representative of all analyzed animals (12 in total).
Indirect staining causes patching but no capping, colocalization, or re-
ceptor-mediated endocytosis. (B) Splenocytes from 5-wk-old piglets were
triple stained by anti-TCRgd, anti-CD2, and anti-CD8 directly at 4˚C (B1–
B3) or 37˚C (B4–B6) or indirectly at 4˚C (B7–B9) or 37˚C (B10–B12),
and positive gd T cells were analyzed by confocal microscopy. In each
staining, 50 positive gd T cells were scored and representative results are
shown. The same cells were also analyzed by flow cytometry for the
frequency of positive gd T cells (the percentages shown in each exami-
nation) and expression level of stained molecules (data not shown).
Table I. Effect of different activators and indirect prestaining on proliferative activity and phenotype modulation of gd T cellsin vitro
Proliferating gdUnstained
Proliferating gdPrestained
TCRgdhi CellsUnstained
TCRgdhi CellsPrestained
4˚C N/A N/A 33 6 5 28 6 5Medium alone 7 6 6 5 6 4 45 6 5 40 6 3PMA 10 6 7 7 6 2 35 6 3 40 6 6PMA plus IL-2 22 6 10 28 6 7 44 6 6 48 6 4PMA plus ionomycin 19 6 12 19 6 13 46 6 5 42 6 5IL-2 30 6 5 33 6 3 60 6 6 62 6 5IL-4 4 6 2 3 6 1 46 6 8 44 6 9Con A 35 6 13 35 6 12 44 6 4 43 6 5Con A plus IL-2 37 6 13 32 6 15 44 6 5 45 6 6
The splenocytes isolated from 4-wk-old pigs were divided into two groups from which cells in one group were left unstained, whereas cells in secondgroup were prestained by indirect staining with anti-TCRgd, anti-CD2, and anti-CD8. Each group was thereafter divided into two subgroups, and cells inone subgroup from each group were loaded by CFSE. All four subgroups were thereafter cultivated for 4 d under different conditions, and cells loaded byCFSE were analyzed by flow cytometry for the frequency of proliferating gd T cells, whereas cells without CFSE were analyzed for the proportions ofTCRgdhi cells and also individual CD2/CD8 subpopulations of gd T cells (data not shown) after final restaining with the same Abs. Cells kept at 4˚C didnot change expression of cell surface molecules and had the same phenotype as fresh splenocytes. Values represent mean 6 SD obtained from fouranimals. There were no statistically significant differences between unstained and prestained samples.
The Journal of Immunology 2113
by guest on June 1, 2018http://w
ww
.jimm
unol.org/D
ownloaded from
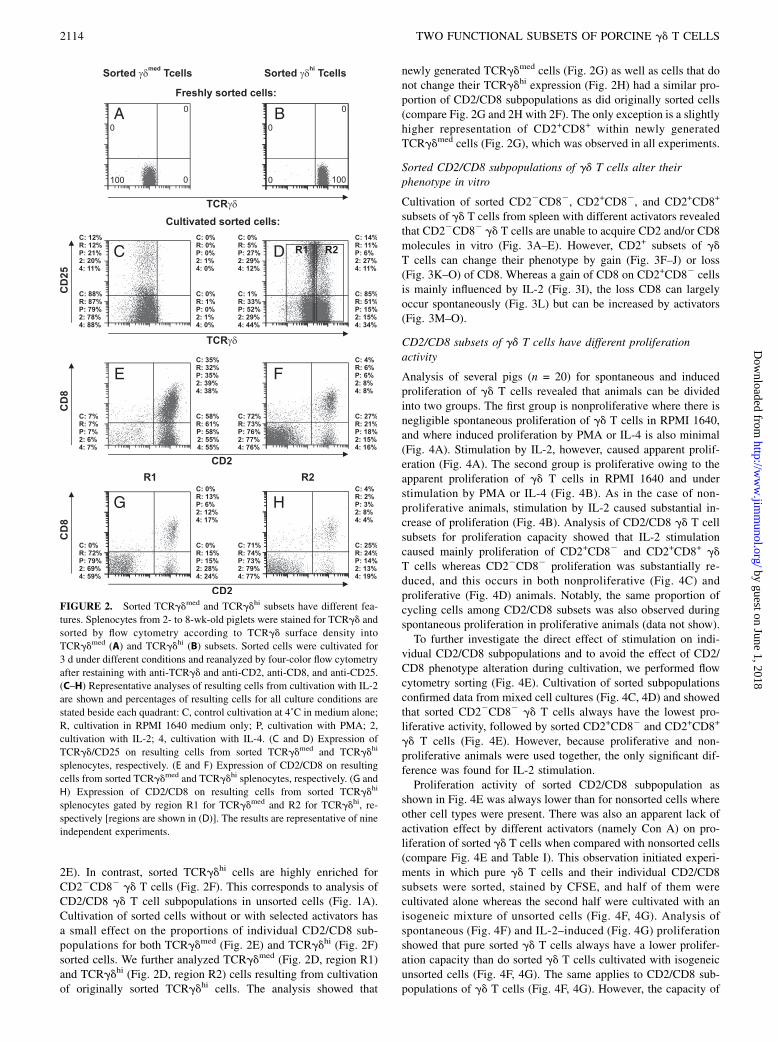
2E). In contrast, sorted TCRgdhi cells are highly enriched forCD22CD82 gd T cells (Fig. 2F). This corresponds to analysis ofCD2/CD8 gd T cell subpopulations in unsorted cells (Fig. 1A).Cultivation of sorted cells without or with selected activators hasa small effect on the proportions of individual CD2/CD8 sub-populations for both TCRgdmed (Fig. 2E) and TCRgdhi (Fig. 2F)sorted cells. We further analyzed TCRgdmed (Fig. 2D, region R1)and TCRgdhi (Fig. 2D, region R2) cells resulting from cultivationof originally sorted TCRgdhi cells. The analysis showed that
newly generated TCRgdmed cells (Fig. 2G) as well as cells that donot change their TCRgdhi expression (Fig. 2H) had a similar pro-portion of CD2/CD8 subpopulations as did originally sorted cells(compare Fig. 2G and 2H with 2F). The only exception is a slightlyhigher representation of CD2+CD8+ within newly generatedTCRgdmed cells (Fig. 2G), which was observed in all experiments.
Sorted CD2/CD8 subpopulations of gd T cells alter theirphenotype in vitro
Cultivation of sorted CD22CD82, CD2+CD82, and CD2+CD8+
subsets of gd T cells from spleen with different activators revealedthat CD22CD82 gd T cells are unable to acquire CD2 and/or CD8molecules in vitro (Fig. 3A–E). However, CD2+ subsets of gd
T cells can change their phenotype by gain (Fig. 3F–J) or loss(Fig. 3K–O) of CD8. Whereas a gain of CD8 on CD2+CD82 cellsis mainly influenced by IL-2 (Fig. 3I), the loss CD8 can largelyoccur spontaneously (Fig. 3L) but can be increased by activators(Fig. 3M–O).
CD2/CD8 subsets of gd T cells have different proliferationactivity
Analysis of several pigs (n = 20) for spontaneous and inducedproliferation of gd T cells revealed that animals can be dividedinto two groups. The first group is nonproliferative where there isnegligible spontaneous proliferation of gd T cells in RPMI 1640,and where induced proliferation by PMA or IL-4 is also minimal(Fig. 4A). Stimulation by IL-2, however, caused apparent prolif-eration (Fig. 4A). The second group is proliferative owing to theapparent proliferation of gd T cells in RPMI 1640 and understimulation by PMA or IL-4 (Fig. 4B). As in the case of non-proliferative animals, stimulation by IL-2 caused substantial in-crease of proliferation (Fig. 4B). Analysis of CD2/CD8 gd T cellsubsets for proliferation capacity showed that IL-2 stimulationcaused mainly proliferation of CD2+CD82 and CD2+CD8+ gdT cells whereas CD22CD82 proliferation was substantially re-duced, and this occurs in both nonproliferative (Fig. 4C) andproliferative (Fig. 4D) animals. Notably, the same proportion ofcycling cells among CD2/CD8 subsets was also observed duringspontaneous proliferation in proliferative animals (data not show).To further investigate the direct effect of stimulation on indi-
vidual CD2/CD8 subpopulations and to avoid the effect of CD2/CD8 phenotype alteration during cultivation, we performed flowcytometry sorting (Fig. 4E). Cultivation of sorted subpopulationsconfirmed data from mixed cell cultures (Fig. 4C, 4D) and showedthat sorted CD22CD82 gd T cells always have the lowest pro-liferative activity, followed by sorted CD2+CD82 and CD2+CD8+
gd T cells (Fig. 4E). However, because proliferative and non-proliferative animals were used together, the only significant dif-ference was found for IL-2 stimulation.Proliferation activity of sorted CD2/CD8 subpopulation as
shown in Fig. 4E was always lower than for nonsorted cells whereother cell types were present. There was also an apparent lack ofactivation effect by different activators (namely Con A) on pro-liferation of sorted gd T cells when compared with nonsorted cells(compare Fig. 4E and Table I). This observation initiated experi-ments in which pure gd T cells and their individual CD2/CD8subsets were sorted, stained by CFSE, and half of them werecultivated alone whereas the second half were cultivated with anisogeneic mixture of unsorted cells (Fig. 4F, 4G). Analysis ofspontaneous (Fig. 4F) and IL-2–induced (Fig. 4G) proliferationshowed that pure sorted gd T cells always have a lower prolifer-ation capacity than do sorted gd T cells cultivated with isogeneicunsorted cells (Fig. 4F, 4G). The same applies to CD2/CD8 sub-populations of gd T cells (Fig. 4F, 4G). However, the capacity of
FIGURE 2. Sorted TCRgdmed and TCRgdhi subsets have different fea-
tures. Splenocytes from 2- to 8-wk-old piglets were stained for TCRgd and
sorted by flow cytometry according to TCRgd surface density into
TCRgdmed (A) and TCRgdhi (B) subsets. Sorted cells were cultivated for
3 d under different conditions and reanalyzed by four-color flow cytometry
after restaining with anti-TCRgd and anti-CD2, anti-CD8, and anti-CD25.
(C–H) Representative analyses of resulting cells from cultivation with IL-2
are shown and percentages of resulting cells for all culture conditions are
stated beside each quadrant: C, control cultivation at 4˚C in medium alone;
R, cultivation in RPMI 1640 medium only; P, cultivation with PMA; 2,
cultivation with IL-2; 4, cultivation with IL-4. (C and D) Expression of
TCRgd/CD25 on resulting cells from sorted TCRgdmed and TCRgdhi
splenocytes, respectively. (E and F) Expression of CD2/CD8 on resulting
cells from sorted TCRgdmed and TCRgdhi splenocytes, respectively. (G and
H) Expression of CD2/CD8 on resulting cells from sorted TCRgdhi
splenocytes gated by region R1 for TCRgdmed and R2 for TCRgdhi, re-
spectively [regions are shown in (D)]. The results are representative of nine
independent experiments.
2114 TWO FUNCTIONAL SUBSETS OF PORCINE gd T CELLS
by guest on June 1, 2018http://w
ww
.jimm
unol.org/D
ownloaded from

individual CD2/CD8 subpopulations of gd T cells to proliferateremains unchanged: CD22CD82 gd T cells always have thelowest proliferative activity followed by sorted CD2+CD82 andCD2+CD8+ gd T cells (Fig. 4F, 4G).
Thymic gd T cells can be divided into three subsets accordingto level of TCRgd and the expression of the CD1 molecule
Expression density of TCRgd on thymocytes is medium and high(Fig. 5A), resembling the periphery. However, thymic gd T cellscontain developing precursors that can be identified by expressionof CD1 (5, 11, 13). Whereas CD1+ gd thymocytes are strictly
TCRgdmed, CD12 gd thymocytes can be TCRgdmed or TCRgdhi
(Fig. 5A). These three subsets differ in expression of CD2 andCD8 (Fig. 5B) and also CD25, SLA-DR (MHC-II), and CD45RC/RA (Fig. 5C). TCRgdmedCD1+ thymocytes are characteristic ofthe highest frequencies of CD2+CD82 and CD2+CD8+ whereasCD22CD82 cells are almost absent (Fig. 5B). TCRgdmedCD1+
thymocytes also express low amounts of CD45RC, CD25, andSLA-DR molecules (Fig. 5C). In contrast, TCRgdmedCD12 thy-mocytes contain all CD2/CD8 subpopulations but most abundantare CD2+CD82 cells (Fig. 5B). TCRgdmedCD12 thymocytes alsocontain low frequencies of CD45RC+, CD25+, or SLA-DR+ cells
FIGURE 3. Sorted CD2/CD8 subpopulations
of gd T cells alter their phenotype in vitro.
Splenocytes from 2- to 8-wk-old piglets were
stained for TCRgd, CD2, and CD8 and sorted
by flow cytometry into CD22CD82 (A–E),
CD2+CD82 (F–J), and CD2+CD8+ (K–O) gd
T cell subsets. Sorted cells were cultivated for
3 d under different conditions (individual col-
umns) and reanalyzed by three-color flow
cytometry after restaining with the same mAbs.
Cells kept at 4˚C did not change expression of
cell surface molecules and had the same phe-
notype as freshly sorted splenocytes. Stimula-
tion by Con A had a similar effect as cultivation
in medium only (data not shown). The results
are representative of 13 independent experi-
ments.
FIGURE 4. CD2/CD8 subsets of gd T cells have
different proliferation activity. Fresh splenocytes were
labeled with CFSE, cultivated for 4 d in medium alone
(RPMI 1640) or with PMA, IL-2, or IL-4, and finally
cell surface stained for TCRgd, CD2, and CD8.
Representative analysis of CFSE fluorescence of all gd
T cells for groups of animals that showed low (A) or
high (B) spontaneous proliferation activity under dif-
ferent cultivation conditions (z-axis) is shown. Further
analysis (C, D) of IL-2–stimulated gd T cells from (A)
and (B), respectively, for proliferation activity of in-
dividual CD2/CD8 subsets (z-axis) is also shown. (E)
Results of the second type of experiment that involves
the same cell surface staining, flow cytometry sorting
of individual CD2/CD8 gd T cell subpopulation, la-
beling with CFSE, cultivation for 4 d under different
conditions (x-axis), and cell surface restaining. The
proportions of proliferating cells (with decreased
CFSE fluorescence) for sorted CD22CD82 (white
bars), CD2+CD82 (gray bars), and CD2+CD8+ (black
bars) gd T cells are shown. Bars represent mean values
and error bars represent 6 SD obtained from five
animals. The last experiments (F, G) involved the same
type of experiments and analysis as described for (E),
but whereas a half of sorted cells was cultivated alone
(white bars), the second half was cultivated with iso-
geneic mixture of unsorted cells (black bars). Culti-
vation in medium alone (F) or with IL-2 (G) is shown.
The result is representative of two independent ex-
periments with the same outcome. *p , 0.05.
The Journal of Immunology 2115
by guest on June 1, 2018http://w
ww
.jimm
unol.org/D
ownloaded from

(Fig. 5C). Finally, TCRgdhiCD12 thymocytes are characteristic bya predominance of CD22CD82 cells (Fig. 5B), which is similar toblood. This subset has a much higher amount of CD45RC ex-pression than TCRgdmed thymocytes and also higher expression ofCD25 and SLA-DR (Fig. 5C).
Sorted gd thymic subsets can change their phenotype duringcultivation
Whereas sorted TCRgdmedCD1+ thymocytes (Fig. 6A) keep thesame TCRgd/CD1 phenotype during cultivation, even with acti-vators (Fig. 6B), sorted TCRgdmedCD12 (Fig. 6C) and TCRgdhi
CD12 (Fig. 6E) thymocytes can change their phenotype in vitro(Fig. 6D and 6F, respectively). Similarly to their peripheralcounterparts, a portion of TCRgdhiCD12 thymocytes (Fig. 6E)becomes TCRgdmedCD12 (Fig. 6F). This downregulation ofTCRgd occurs quickly (it is visible in a day), spontaneously, andit can be increased by activators, especially using PMA (data notshown). In contrast, a small fraction of sorted TCRgdmedCD12
thymocytes (Fig. 6C) can become TCRgdhiCD12 (Fig. 6D). Thisupregulation of TCRgd occurs very slowly (few cells can bedetected after 3 d but a significant amount at day 7), only by IL-2stimulation, and could not be observed in any analyzed tissueexcept the thymus.When TCRgdmedCD12 thymocytes were sorted (Fig. 6C) and
thereafter cultivated (Fig. 6D), we analyzed resulting cells forCD45RC, CD25, and SLA-DR expression (Fig. 6G–I). The resultsshowed that newly generated TCRgdhiCD12 cells appear only inIL-2–conditioned cultures (Fig. 6G–I, white dashed bars) witha similar phenotype as freshly isolated TCRgdhiCD12 thymocytes(Fig. 6G–I, gray bar for 4˚C) but are significantly different fromoriginal TCRgdmedCD12 cells (Fig. 6G–I, white bar for 4˚C).Newly generated TCRgdhiCD12 cells have much higher expres-sion of CD45RC than do parental TCRgdmedCD12 cells and alsohigher expression of CD25 and SLA-DR. In contrast, TCRgdmed
CD12 cells that keep their phenotype during cultivation (Fig. 6G–I, white bars except for 4˚C) do not change their CD45RC, CD25,and SLA-DR expression (Fig. 6G–I, compare the white bars of theother four treatment groups with white bar for 4˚C). However,when cultures were prolonged to 7 d, resulting TCRgdmedCD12
cells increased their CD45RC, CD25, and SLA-DR expression(data not shown). This increase occurs spontaneously but to alesser extent than for newly generated TCRgdhiCD12 cells.
FIGURE 5. Thymic gd T cells can be divided into three subsets
according to level of TCRgd and the expression of CD1 molecule. Freshly
isolated thymocytes were gated by three regions according to their ex-
pression of TCRgd and CD1 (A). Cells inside these three regions were
analyzed for proportion of CD2/CD8 subsets (B) or for expression of
CD45RC, CD25, or SLA-DR (C). Bars represent mean values and error
bars represent 6SD obtained from at least four animals.
FIGURE 6. Sorted gd thymic subsets can change their phenotype during
cultivation. According to expression of TCRgd/CD1 as shown in Fig. 5A,
three population of gd T cells were sorted by flow cytometry as pure
subpopulations and analyzed just after sorting (A, C, E) and also after 7-d
cultivation and restaining (B, D, F). (B, D, and F) Representative analyses
of gd thymocytes cultivated with IL-2. Whereas upregulation of TCRgd,
shown in (D), occurs only with IL-2, downregulation of TCRgd, shown in
(F), occurs with various activators and also spontaneously. Restaining of
resulting cells, shown in (B), (D), and (F), in some cases also involved anti-
CD45RC, anti-CD25, anti-SLA-DR, and anti-CD2/anti-CD8 mAbs. The
proportions of CD45RC+ (G), CD25+ (H), SLA-DR+ (I), and CD2/CD8 (J)
subpopulation cells among particular gated TCRgd/CD1 subsets are also
shown for 3-d cultivation. Different cultivation conditions are shown on the
x-axis for (G)–(I). Note that RPMI stands for cultivation in medium alone,
and cells kept at 4˚C did not change expression of cell surface molecules
and had the same phenotype as freshly isolated thymocytes. Bars represent
mean values and error bars represent 6SD obtained from four animals.
Analysis for CD2/CD8 subpopulations (J) is shown only for IL-2–condi-
tioned cultivation because it generates TCRgdhiCD12 from TCRgdmed
CD12 gd T cells. *p , 0.05, **p , 0.01, ***p , 0.001.
2116 TWO FUNCTIONAL SUBSETS OF PORCINE gd T CELLS
by guest on June 1, 2018http://w
ww
.jimm
unol.org/D
ownloaded from

When TCRgdhiCD12 thymocytes were sorted (Fig. 6E) andthereafter cultivated (Fig. 6F), we also analyzed resulting cells forCD45RC, CD25, and SLA-DR expression (Fig. 6G–I). The resultsshow that newly generated TCRgdmedCD12 cells have compara-ble expression of CD45RC, CD25, and SLA-DR (Fig. 6G–I,compare the gray dashed bars of the other four treatment groupswith the gray bar for 4˚C). The only exception is increased CD25expression in PMA-stimulated cultures. TCRgdhiCD12 cells thatkept their phenotype during cultivation are also mostly compara-ble in expression of CD45RC, CD25, and SLA-DR (Fig. 6G–I,compare the gray bars of the other four treatment groups with thegray bar for 4˚C). Again, the only exception is CD25 expression inPMA- and IL-2–stimulated cultures. Differential increase in CD25expression results in a significant difference of CD25 expressionbetween TCRgdhiCD12 and TCRgdmedCD12 cells that are theproduct of sorted and cultivated TCRgdhiCD12 thymocytes andfor all culture conditions except PMA (Fig. 6H, compare gray andgray dashed bars).In agreement with the finding that sorted (Fig. 6A) and thereafter
cultivated (Fig. 6B) TCRgdmedCD1+ thymocytes keep the samephenotype during cultivation, we mostly did not observe signifi-cant changes in expression of CD45RC, CD25, and SLA-DR (Fig.6G–I, compare the black bars of the other four treatment groupswith the black bar for 4˚C). The only exception was increasedexpression of CD25 in PMA-conditioned cultures.The last analysis of sorted and cultivated TCRgd/CD1 gd
thymocyte subsets includes an examination of proportional dis-tribution of CD2 and CD8 expression on the resulting cells (Fig.6J). Results show that whereas TCRgdmedCD1+ and TCRgdhi
CD12 thymocytes did not change their proportions of CD2/CD8subsets, TCRgdmedCD12 thymocytes are enriched for the CD2+
CD8+ subset (compare Fig. 6J with Fig. 5B). Analysis of newlygenerated TCRgdmedCD12 cells originating from TCRgdhiCD12
cells have a decreased proportion of the CD22CD82 subset to thedetriment of CD2+CD82 and CD2+CD8+ subsets (Fig. 6J). Incontrast, newly generated TCRgdhiCD12 cells originating fromTCRgdmedCD12 cells have an increased proportion of the CD22
CD82 subset to the detriment of CD2+CD82 and CD2+CD8+
subsets (Fig. 6J).
Analysis of TCR diversity in sorted subpopulations ofperipheral and thymic gd T cells
The diversity of the TCRd repertoire in flow cytometry–sortedsubpopulations of gd T cells was studied by CDR3 spectratyping(Fig. 7). Only the Vd1 family was studied because it is the mostvaried family (containing .30 members) whereas the rest of theVd families (Vd2–Vd5) contains one to two members (19).Analyses of sorted TCRgdmed and TCRgdhi (Fig. 7A, 7B) andCD2/CD8 (Fig. 7C–E) subpopulations of gd T cells isolated fromspleen showed that their Vd1 repertoire is diverse (polyclonal) inall sorted subpopulations. Note that gd T cells isolated from theblood gave the same results (data not shown). Similar analysis ofCDR3 polymorphism for sorted TCRgd/CD1 subpopulations ofgd thymocytes (Fig. 7F–H) showed also polyclonal Vd1 repertoire.
TCRgdmed cells do not lose TCR completely as evidenced byintracellular staining
In some experiments, TCRgd downregulation occurs to the levelresembling TCRgd2 cells. To exclude the possibility that TCRgdis completely lost from the surface but cells maintain TCRgd incytoplasm, we performed intracellular staining for TCRgd (Fig.8). Staining of cells by both mAbs PPT16 and PPT26 (recognizingCD3 molecule expressed specifically on gd T cells) showed aclear subpopulation of intracellularly positive but extracellularly
negative cells for TCRgd (Fig. 8A and 8B respectively, regionR2). Further analysis of this population indicated that these cellsresemble ab (Fig. 8D) rather than gd T lymphocytes (Fig. 8C).Such an explanation is possible mainly because PPT16 and PPT26are directed against the CD3-specific form exclusively expressedwith TCRgd. This was confirmed by staining for CD3 (Fig. 8E)where the frequency of CD3+ TCRgd2 ab T cells (20%) corre-sponds to the proportion of cells in region R2 (Fig. 8A, 8B). It islikely that fixation during intracellular staining changes the CD3molecule to a form that can be recognized by mAbs against theCD3-specific forms for TCRgd, such as PPT16 and PPT26. Whenwe used TCRgd-specific mAb PGBL22A that recognizes the samecells as PPT16 or PPT26 (Fig. 8F), the artifact of intracellularstaining was eliminated (Fig. 8G). Moreover, this staining usingPGBL22A mAb (Fig. 8G) proved that TCRgd molecules are notcompletely lost from the surface during downregulation and thatall gd T cells are included in the analyses. Evidence that PPT16and PPT26 mAbs recognize the same gd T cells as PGBL22A isalso shown (compare Fig. 8H with 8F).
DiscussionData reported in this study describe populations of porcine gdT cells differing in expression of their TCR. Evidence that TCRgdis expressed differently can be found in other reports (15, 16), butto our knowledge this phenomenon was never studied in detail.Porcine TCRgdmed and TCRgdhi cells are distributed differentlyamong CD2/CD8 subsets, which are know to home differentiallyinto various lymphatic tissues. Whereas CD22CD82 are prefer-entially TCRgdhi and are enriched in the blood, CD2+CD82 and
FIGURE 7. Analysis of Vd1 diversity in sorted subpopulations of gd
T cells. Splenic gd T cells (A–E) and gd thymocytes (F–H) were sorted by
flow cytometry according to their phenotype (depicted above each line)
and their cDNAwas analyzed by CDR3 spectratyping for Vd1. The results
are representative of five independent experiments. Note that sorted cells
from the blood gave the same output as from the spleen.
The Journal of Immunology 2117
by guest on June 1, 2018http://w
ww
.jimm
unol.org/D
ownloaded from

CD2+CD8+ are prevalently TCRgdmed and accumulate in othertissues (8). Such findings are in accordance with reported findingsin cows, where CD8+ and CD82 gd T cells also exhibit a definedtissue tropism. This unequal distribution throughout different tis-sues is probably connected to their differential expression of L-selectin and E-selectin ligand (23). Moreover, another work incows showed that CD8+/2 gd T cell subpopulations differ in ex-pression of many other molecules such as galectin-1, prolactin,IgE-dependent histamine-releasing factor, epidermal growth fac-tor, IL-10 or Gro-g, IL-1, CD44, CD18, and MHC class I (15).Interestingly, although authors of these findings did not studydifferential level of TCRgd expression, they noted that CD8+ gd
T cells express lower levels of TCR. These findings collectivelyindicate that gd T cells with different level of TCRgd and CD2/CD8 phenotype express auxiliary surface molecules and producesoluble factors that influence the immune system and explaintissue-specific accumulation of gd T cell subsets. Similar tissuetropism and functional difference between gd T cell subpopu-lations can be found also in humans and mice, although most ofthese studies discriminate gd T cell subpopulations on the basis oftheir TCR usage.Our studies indicate that CD2+ and CD22 gd T cell subsets
represent two independent lineages. This is not only because ofdifferential expression of TCR but mainly because whereas CD22
gd T cells cannot change their CD2/CD8 expression, CD2+ gd Tcan modulate CD8 expression. There is also differential suscep-tibility for proliferation between CD2+ and CD22 gd T cells.Although CD22CD82 almost do not proliferate, proliferation ofCD2+CD82 and CD2+CD8+ is substantial. Lower proliferationof CD22 gd T cells was also observed in mice (24). A populationof CD22 gd T cells is also absent in CD1+ immature thymocytes.Moreover, our earlier finding shows that there is a substantialdifference between CD2+ and CD22 subsets in expression ofCD25, CD11b, SWC1, SWC7, MHC-II, and the family of CD45molecules (12). The conclusion that CD2+ and CD22 gd T cell aretwo lineages is also supported by the finding that they differ inexpression of TCRg-chains (8). Furthermore, findings in cowsshow that these two lineages differ in expression of non–TCRgdcell Ags WC1 and GD3.5, in expression of cell adhesion mole-cules, and in ability to infiltrate into inflammatory sites (15, 23). Inany case, these two lineages are equally capable of immune
responses because analysis of CDR3 length polymorphismshowed equal diversification of Vd1 with no restriction of TCRrepertoire. Moreover, existence and behavior of these two lineagesare independent of gut colonization because germ-free animalswere comparable to conventional ones (data not shown).Human and mice gd T cells are generally considered CD2+ (25–
27), thus resembling the CD2+ gd T cell lineage in swine. Thisis in sharp contrast with porcine CD22 gd T cells, which are nu-merous and preferentially reside in the blood. High occurrence ofCD22 gd T cells is not unique to pigs but also for other membersof gd-high species such as sheep (28, 29), cattle (30), and birds(31). These findings together support the idea that CD22 gd
T cells are a specific lineage, and this lineage is missing in theblood of humans and mice. This may also be the reason why gdT cells in humans and mice constitute a minority of T cells in thecirculation. There are only a few examples in which CD22 gdT cells were found in humans and mice. Such examples are mouseintestinal (24) or vaginal gd T cells (27). Other examples inhumans are some leukemias (32), autoimmune disorders (33), orsome particular individuals (26, 34). Loss of circulating gd T cellsin humans and mice can be connected with nonfunctional ortho-logs of WC1 genes known in ruminants and pigs (35). In contrast,CD2+ gd T cells in humans and mice can be clearly CD8+ orCD82 (26, 36). We show in this study that CD8 expression can bemodulated on CD2+ gd T cells in both ways. Moreover, our earlierwork indicated that a CD2+CD8+ subpopulation is more maturethan CD2+CD82 (12). Such a conclusion agrees with other studiesin humans where CD8+ gd T cells were shown to have attributesof regulatory cells (37). Also, some studies indicate that CD2+
CD82 gd T cells can be precursors of CD2+CD8+ gd T cells (10,38). These findings collectively indicate that the CD8 moleculecan be modulated on the surface according to actual functionalstatus of CD2+ gd T cells.Sorting experiments show that CD8 expression can bemodulated
on CD2+ gd T cells and that TCRgd can be downregulated, whichis in agreement with studies in mice (16). However, analysis ofresulting cells from cultures of TCRgdhi/TCRgdmed sorted cellsdoes not indicate any significant change in composition of CD2/CD8 subpopulation (Fig. 2). This indicates that downregulation ofTCRgd can clearly occur on CD22CD82 gd T cells in vitro. Incontrast, when freshly isolated cells were analyzed, CD22CD82
FIGURE 8. TCRgdmed cells do not lose TCR completely, as evidenced by intracellular staining. Lymphocytes from the blood were cell surface stained by
anti-CD2, anti-CD8, and either PPT26 (A) or PPT16 (B) mAbs, fixed, intracelullarly stained with either PPT16 (A) or PPT26 (B) mAbs, and analyzed for
intracellular and extracellular expression of TCRgd. Two regions, R1 and R2, were set according to TCRgd expression in (A) and (B) and CD2/CD8
phenotype of gated cells were analyzed further [(C) for R1, and (D) for R2]. Note that analysis in (C) and (D) are shown for R1 and R2 from (B), but results
for R1 and R2 from (A) were the same. Analyses of the same cells double stained extracellularly by anti-CD3 and PPT16 or PPT26 mAbs (E), extra-
cellularly by PGBL22A and PPT16 or PPT26 mAbs (F), intracelullarly by PGBL22A and extracellularly by PPT16 or PPT26 mAbs (G), and extracellularly
by PPT16 and PPT26 mAbs (H) are also shown.
2118 TWO FUNCTIONAL SUBSETS OF PORCINE gd T CELLS
by guest on June 1, 2018http://w
ww
.jimm
unol.org/D
ownloaded from

gd T cells are practically absent from the TCRgdmed compart-ment. Therefore, there has to be some factors that keep expressionof TCRgdhi on the CD22CD82 subset in vivo. In this study wewere unable to identify those factors, although the potential re-quirement for these factors was identified by addition of unsortedcells, which reconstitute the proliferation activity of pure gd
T cells. Another possibility can be fast turnover of TCRgd asshown for TCRab (17), which can be constitutive or ligand-induced and is dependent on protein kinase C (39), and is main-tained in vivo but not in vitro. Such a conclusion would corre-spond to our observation that partial loss of TCRgd expressionoccurs in hours and this cannot be explained by mRNA modula-tion and/or proliferation of cells. In vitro experiments excludethe possibility that it is caused by early capping and receptor-mediated endocytosis due to cross-linking of molecules by indi-rect staining. In any case, more experiments are needed to showwhat is responsible for the high expression of TCR on CD22
CD82 gd T cells in vivo. Our work indicates that distribution ofCD2/CD8 subsets among TCRgdhi and TCRgdmed cells in vivo istightly regulated and is already established in the thymus prior toexport of gd T cells to the periphery. In connection with possibledifferent regulation of the TCR level in vitro and in vivo, we alsocannot exclude the possibility that CD2+ gd T cells can acquireand/or that CD22 gd T cells can lose the CD2 molecule in vivo,which was never observed in vitro. This has to be true at least inthymus where CD22 gd T cells are generated from CD2+CD1+
immature thymocytes (5, 11).Sorted gd T lymphocytes are clearly less sensitive to activation
of proliferation by different activators than unsorted gd T cells.Because there is no effect of indirect staining on the proliferativeresponse of gd T cells, decreased proliferation cannot be ex-plained by cross-linking of signaling molecules. More likely, aneffect of activators on gd T cells is indirect and is mediated byother cell types such as sensitive to Con A and IL-2 activation, andthese cells are missing in sorted cells. This would agree withstudies showing that CD4+ ab T cells are involved (40). In thisrespect, IL-2 is the best candidate for this indirect function butit is probably not the only factor, as evidenced by the inability tofully reconstitute proliferation potential of sorted cells.Thymic gd T cells are characterized by the occurrence of CD1+
immature cells (13) that are always TCRgdmed. Finding that CD1+
gd thymocytes are composed exclusively of CD2+CD82 andCD2+CD82 subsets agrees with previous work showing that theearliest precursors are CD1+CD2+CD82 gd T cells whereas CD1+
CD2+CD8+ gd T cells are their progeny (5, 11). Apparently, CD8molecules can be acquired even in immature stages. Also, CD22
CD82 gd T cells are missing from the CD1+ compartment, whichindicates that they arise after CD1 downregulation. With regard toCD12 gd thymocytes, distribution of CD2/CD8 subsets amongTCRgdhi and TCRgdmed cells resembles the periphery. TheseTCRgdhiCD12 and TCRgdmedCD12 subsets are probably expor-ted from thymus differently; that is, whereas TCRgdhiCD12 cells(CD22 lineage) are circulating and remain in the blood,TCRgdmedCD12 cells (CD2+ lineage) are preferentially homing totissues. However, there is some difference between CD12
TCRgdhi and TCRgdmed thymocytes. It appears that TCRgdhi
CD12 thymocytes are fully mature with many CD45RA/RC- andCD25-expressing cells, which is characteristic of the periphery(12). Similarly to the blood, they can also easily and quicklydownregulate TCRgd. In contrast, TCRgdmedCD12 are still insome transitional stage as evidenced by the low proportion ofCD45RA/RC+ and CD25+ cells. Moreover, there is still a rela-tively high proportion of CD22CD82 gd T cells that probablyfurther mature into TCRgdhi cells. Finally, at least a part of these
cells is capable of upregulation of TCRgd, which can never bedetected in peripheral gd T cells. Significantly, newly generatedTCRgdhi cells show high expression of CD45RA/RC, CD25, andMHC-II. These findings indicate that TCRgdmedCD12 thymocytesmay need further maturation and upregulation of CD45RA/RC,CD25, and MHC-II once they reach their final destination in solidtissues.
AcknowledgmentsWe gratefully acknowledge Lucie Poulova, Mirka Lantova, Marta Stojkova,
and Sarka Pfeiferova for excellent technical assistance. We also give grat-
itude to NancyWertz from the University of Iowa (Iowa City, IA) for critical
reading of the manuscript and to Jan Stepan for assistance and help
throughout this project. We are grateful to the following researchers for
the gifts of mAbs: Joan K. Lunney and Patricia Boyd from the Animal Par-
asitology Institute (Beltsville, MD), Karin Haverson from the University
of Bristol (Bristol, U.K.), Huaizhi Yang from the Institute of Animal Health
(Pirbright, U.K.), Christopher R. Stokes from the University of Bristol,
Mark D. Pescovitz from Indiana University (Indianapolis, IN), David H.
Sachs and Christine A. Huang from Massachusetts General Hospital
(Charlestown, MA), andWilliamC. Davis fromWashington State University
(Pullman, WA).
DisclosuresThe authors have no financial conflicts of interest.
References1. Hein, W. R., and C. R. Mackay. 1991. Prominence of gd T cells in the ruminant
immune system. Immunol. Today 12: 30–34.2. Sinkora, M., and J. E. Butler. 2009. The ontogeny of the porcine immune system.
Dev. Comp. Immunol. 33: 273–283.3. Sinkora, M., J. Sinkora, Z. Rehakova, I. Splıchal, H. Yang, R. M. Parkhouse, and
I. Trebichavsk. 1998. Prenatal ontogeny of lymphocyte subpopulations in pigs.Immunology 95: 595–603.
4. Sinkora, M., J. E. Butler, W. Holtmeier, and J. Sinkorova. 2005b. Lymphocytedevelopment in fetal piglets: facts and surprises. Vet. Immunol. Immunopathol.108: 177–184.
5. Sinkora, M., J. Sinkorova, Z. Cimburek, and W. Holtmeier. 2007. Two groups ofporcine TCRgd+ thymocytes behave and diverge differently. J. Immunol. 178:711–719.
6. Yang, H., and R. M. E. Parkhouse. 1996. Phenotypic classification ofporcine lymphocyte subpopulations in blood and lymphoid tissues. Immunology89: 76–83.
7. Yang, H., and R. M. E. Parkhouse. 1997. Differential expression of CD8 epitopesamongst porcine CD8-positive functional lymphocyte subsets. Immunology 92:45–52.
8. Saalmuller, A., W. Hirt, and M. J. Reddehase. 1990. Porcine g/d T lymphocytesubsets differing in their propensity to home to lymphoid tissue. Eur. J. Immunol.20: 2343–2346.
9. de Bruin, M. G. M., E. M. A. van Rooij, J. J. M. Voermans, Y. E. de Visser, A. T.J. Bianchi, and T. G. Kimman. 1997. Establishment and characterization ofporcine cytolytic cell lines and clones. Vet. Immunol. Immunopathol. 59: 337–347.
10. Wen, K., T. Bui, G. Li, F. Liu, Y. Li, J. Kocher, and L. Yuan. 2012. Character-ization of immune modulating functions of gd T cell subsets in a gnotobiotic pigmodel of human rotavirus infection. Comp. Immunol. Microbiol. Infect. Dis. 35:289–301.
11. Sinkora, M., J. Sinkorova, and W. Holtmeier. 2005a. Development of gd thy-mocyte subsets during prenatal and postnatal ontogeny. Immunology 115: 544–555.
12. Stepanova, K., and M. Sinkora. 2012. The expression of CD25, CD11b, SWC1,SWC7, MHC-II, and family of CD45 molecules can be used to characterizedifferent stages of gd T lymphocytes in pigs. Dev. Comp. Immunol. 36: 728–740.
13. Sinkora, M., J. Sinkora, Z. Rehakova, and J. E. Butler. 2000. Early ontogeny ofthymocytes in pigs: sequential colonization of the thymus by T cell progenitors.J. Immunol. 165: 1832–1839.
14. Xiong, N., and D. H. Raulet. 2007. Development and selection of gd T cells.Immunol. Rev. 215: 15–31.
15. Meissner, N., J. Radke, J. F. Hedges, M. White, M. Behnke, S. Bertolino,M. Abrahamsen, and M. A. Jutila. 2003. Serial analysis of gene expression incirculating gd T cell subsets defines distinct immunoregulatory phenotypes andunexpected gene expression profiles. J. Immunol. 170: 356–364.
16. Tauchi, Y., G. Matsuzaki, H. Takimoto, Y. Yoshikai, and K. Nomoto. 1992. Anew subpopulation of intestinal intraepithelial lymphocytes expressing high levelof T cell receptor gd. Eur. J. Immunol. 22: 2465–2468.
17. D’Oro, U., M. S. Vacchio, A. M. Weissman, and J. D. Ashwell. 1997. Activationof the Lck tyrosine kinase targets cell surface T cell antigen receptors for ly-sosomal degradation. Immunity 7: 619–628.
The Journal of Immunology 2119
by guest on June 1, 2018http://w
ww
.jimm
unol.org/D
ownloaded from

18. Sinkora, M., J. Sinkorova, and J. E. Butler. 2002. B cell development and VDJrearrangement in the fetal pig. Vet. Immunol. Immunopathol. 87: 341–346.
19. Holtmeier, W., W. Geisel, K. Bernert, J. E. Butler, M. Sinkora, Z. Rehakova,J. Sinkora, and W. F. Caspary. 2004. Prenatal development of the porcine TCR drepertoire: dominant expression of an invariant T cell receptor Vd3-Jd3 chain.Eur. J. Immunol. 34: 1941–1949.
20. Sinkora, M., J. Sun, J. Sinkorova, R. K. Christenson, S. P. Ford, and J. E. Butler.2003. Antibody repertoire development in fetal and neonatal piglets, VI: B celllymphogenesis occurs at multiple sites with differences in the frequency of in-frame rearrangements. J. Immunol. 170: 1781–1788.
21. Sinkora, M., K. Stepanova, J. E. Butler, D. Francis, K. Santiago-Mateo,H. Potockova, K. Karova, and J. Sinkorova. 2011. Ileal Peyer’s patches are notnecessary for systemic B cell development and maintenance and do not con-tribute significantly to the overall B cell pool in swine. J. Immunol. 187: 5150–5161.
22. Sinkora, M., K. Stepanova, and J. Sinkorova. 2012. Different anti-CD21 anti-bodies can be used to discriminate developmentally and functionally differentsubsets of B lymphocytes in circulation of pigs. Dev. Comp. Immunol. 10.1016/j.dci.2012.10.010.
23. Wilson, E., M. K. Aydintug, and M. A. Jutila. 1999. A circulating bovine gdT cell subset, which is found in large numbers in the spleen, accumulates in-efficiently in an artificial site of inflammation: correlation with lack of expressionof E-selectin ligands and L-selectin. J. Immunol. 162: 4914–4919.
24. Van Houten, N., P. F. Mixter, J. Wolfe, and R. C. Budd. 1993. CD2 expression onmurine intestinal intraepithelial lymphocytes is bimodal and defines proliferativecapacity. Int. Immunol. 5: 665–672.
25. Groh, V., S. Porcelli, M. Fabbi, L. L. Lanier, L. J. Picker, T. Anderson,R. A. Warnke, A. K. Bhan, J. L. Strominger, and M. B. Brenner. 1989.Human lymphocytes bearing T cell receptor g/d are phenotypically diverse andevenly distributed throughout the lymphoid system. J. Exp. Med. 169: 1277–1294.
26. Jitsukawa, S., F. Faure, M. Lipinski, F. Triebel, and T. Hercend. 1987. A novelsubset of human lymphocytes with a T cell receptor-g complex. J. Exp. Med.166: 1192–1197.
27. Rakasz, E., M. Hagen, M. Sandor, and R. G. Lynch. 1997. gd T cells of themurine vagina: T cell response in vivo in the absence of the expression of CD2and CD28 molecules. Int. Immunol. 9: 161–167.
28. Mackay, C. R., M. F. Beya, and P. Matzinger. 1989. g/d T cells express a uniquesurface molecule appearing late during thymic development. Eur. J. Immunol.19: 1477–1483.
29. Witherden, D. A., N. J. Abernethy, W. G. Kimpton, and R. N. Cahill. 1995.Antigen-independent maturation of CD2, CD11a/CD18, CD44, and CD58 ex-pression on thymic emigrants in fetal and postnatal sheep. Dev. Immunol. 4: 199–209.
30. Clevers, H., N. D. MacHugh, A. Bensaid, S. Dunlap, C. L. Baldwin, A. Kaushal,K. Iams, C. J. Howard, and W. I. Morrison. 1990. Identification of a bovinesurface antigen uniquely expressed on CD42CD82 T cell receptor g/d+
T lymphocytes. Eur. J. Immunol. 20: 809–817.31. Vainio, O., B. Riwar, M. H. Brown, and O. Lassila. 1991. Characterization of the
putative avian CD2 homologue. J. Immunol. 147: 1593–1599.32. Sugimoto, T., S. Imoto, Y. Matsuo, K. Kojima, M. Yasukawa, T. Murayama,
J. Kohfuku, I. Mizuno, K. Yakushijin, A. Sada, et al. 2001. T-cell receptor gd T-cell leukemia with the morphology of T-cell prolymphocytic leukemia anda postthymic immunophenotype. Ann. Hematol. 80: 749–751.
33. de Paoli, P., D. Gennari, G. Basaglia, P. Martelli, and G. Santini. 1990. Pheno-typic analysis of a CD22CD3+ T cell receptor gd lymphocyte subset. Immunol.Lett. 23: 195–198.
34. Faure, F., S. Jitsukawa, S. Meuer, C. Bohuon, F. Triebel, and T. Hercend. 1988.Identification of a CD22CD3+ T cell receptor-g+ peripheral blood lymphocytesubpopulation. J. Immunol. 140: 2128–2132.
35. Guzman, E., S. Price, H. Poulsom, and J. Hope. 2012. Bovine gd T cells: cellswith multiple functions and important roles in immunity. Vet. Immunol. Immu-nopathol. 148: 161–167.
36. Sato, K., K. Ohtsuka, H. Watanabe, H. Asakura, and T. Abo. 1993. Detailedcharacterization of gd T cells within the organs in mice: classification into threegroups. Immunology 80: 380–387.
37. Bhagat, G., A. J. Naiyer, J. G. Shah, J. Harper, B. Jabri, T. C. Wang, P. H. Green,and J. S. Manavalan. 2008. Small intestinal CD8+TCRgd+NKG2A+
intraepithelial lymphocytes have attributes of regulatory cells in patients withceliac disease. J. Clin. Invest. 118: 281–293.
38. Choi, K. D., and H. S. Lillehoj. 2000. Role of chicken IL-2 on gd T-cells andEimeria acervulina-induced changes in intestinal IL-2 mRNA expression and gdT-cells. Vet. Immunol. Immunopathol. 73: 309–321.
39. Dietrich, J., C. Menne, J. P. Lauritsen, M. von Essen, A. B. Rasmussen,N. Ødum, and C. Geisler. 2002. Ligand-induced TCR down-regulation is notdependent on constitutive TCR cycling. J. Immunol. 168: 5434–5440.
40. Elloso, M. M., H. C. van der Heyde, A. Troutt, D. D. Manning, andW. P. Weidanz. 1996. Human gd T cell subset-proliferative response to malarialantigen in vitro depends on CD4+ T cells or cytokines that signal throughcomponents of the IL-2R. J. Immunol. 157: 2096–2102.
2120 TWO FUNCTIONAL SUBSETS OF PORCINE gd T CELLS
by guest on June 1, 2018http://w
ww
.jimm
unol.org/D
ownloaded from