pore structure and tracer migration behavior of typical
TRANSCRIPT
ORIGINAL PAPER
Pore structure and tracer migration behavior of typical Americanand Chinese shales
Qin-Hong Hu1,2 • Xian-Guo Liu1 • Zhi-Ye Gao3 • Shu-Gen Liu4 • Wen Zhou4 •
Wen-Xuan Hu5
Received: 11 May 2015 / Published online: 16 September 2015
� The Author(s) 2015. This article is published with open access at Springerlink.com
Abstract With estimated shale gas resources greater than
those of US and Canada combined, China has been
embarking on an ambitious shale development program.
However, nearly 30 years of American experience in shale
hydrocarbon exploration and production indicates a low
total recovery of shale gas at 12 %–30 % and tight oil at
5 %–10 %. One of the main barriers to sustainable devel-
opment of shale resources, namely the pore structure (ge-
ometry and connectivity) of the nanopores for storing and
transporting hydrocarbons, is rarely investigated. In this
study, we collected samples from a variety of leading
hydrocarbon-producing shale formations in US and China.
These formations have different ages and geologic char-
acteristics (e.g., porosity, permeability, mineralogy, total
organic content, and thermal maturation). We studied their
pore structure characteristics, imbibition and saturated
diffusion, edge-accessible porosity, and wettability with
four complementary tests: mercury intrusion porosimetry,
fluid and tracer imbibition into initially dry shale, tracer
diffusion into fluid-saturated shale, and high-pressure
Wood’s metal intrusion followed with imaging and ele-
mental mapping. The imbibition and diffusion tests use
tracer-bearing wettability fluids (API brine or n-decane) to
examine the association of tracers with mineral or organic
matter phases, using a sensitive and micro-scale elemental
laser ablation ICP-MS mapping technique. For two
molecular tracers in n-decane fluid with the estimated sizes
of 1.39 nm 9 0.29 nm 9 0.18 nm for 1-iododecane and
1.27 nm 9 0.92 nm 9 0.78 nm for trichlorooxobis (triph-
enylphosphine) rhenium, much less penetration was
observed for larger molecules of organic rhenium in shales
with median pore-throat sizes of several nanometers. This
indicates the probable entanglement of sub-nano-sized
molecules in shales with nano-sized pore-throats. Overall
findings from the above innovative approaches indicate the
limited accessibility (several millimeters from sample
edge) and connectivity of tortuous nanopore spaces in
shales with spatial wettability, which could lead to the low
overall hydrocarbon recovery because of the limited frac-
ture–matrix connection and migration of hydrocarbon
molecules from the shale matrix to the stimulated fracture
network.
Keywords Shale � Nanopore � Connectivity � Diffusion �Imbibition
1 Introduction
Since 2000, the technological development of horizontal
drilling and hydraulic fracturing in US has led to a dramatic
increase in hydrocarbon (gas and oil) production from
shale formations, changing the fossil energy outlook in the
US and worldwide (DOE 2009; Jarvie 2012; EIA 2014).
& Qin-Hong Hu
1 China University of Geosciences (Wuhan), Wuhan 430074,
China
2 The University of Texas at Arlington, Arlington, TX 76019,
USA
3 State Key Laboratory of Petroleum Resources and
Prospecting, China University of Petroleum, Beijing 102249,
China
4 State Key Laboratory of Oil and Gas Reservoir Geology and
Exploitation, Chengdu University of Technology,
Chengdu 610059, China
5 Nanjing University, Nanjing 210093, China
Edited by Xiu-Qin Zhu
123
Pet. Sci. (2015) 12:651–663
DOI 10.1007/s12182-015-0051-8
The production of shale hydrocarbon has recently
increased significantly, and it is predicted that the pro-
duction of shale gas will account for 50 % of total dry gas
production in the USA by 2040, an increase from 34 % in
2011 (EIA 2014). Likewise, US tight oil production is 1.8
million barrels per day (accounting for 28 % of total US
production) in 2012 and 2.8 million barrels (35 %) in 2013,
and projected to be 4.8 million barrels in 2019 to provide
more than a quarter of the 18.8 million barrels of oil that
the US currently consumes daily.
Despite the increased gas and oil production from shale
formations, analyses of data from 65,000 shale wells in 30
shale gas and 21 tight oil fields in the US led Hughes
(2013a, b) to argue that the shale revolution will be hard to
sustain. The data indicate that the production from a given
well would decline rapidly within a few years. For exam-
ple, wells in the top five US shale gas (Marcellus, Hay-
nesville, Barnett, Fayetteville, and Eagle Ford) plays
typically produce 80 %–95 % less gas after 3 years, and
the productivity of new wells in two leading tight oil plays
(Bakken and Eagle Ford) drops by about 60 % within the
first year. The total gas recovery from the Barnett, the most
developed shale play, is reported to be only 8 %–15 % of
gas-in-place in 2002 (Curtis 2002), and 12 %–30 % in
2012 (King 2012). The recovery rate for tight oil is even
lower at 5 %–10 % (Hoffman 2012), for example, the oil
recovery rate in the middle member Bakken formation
ranges from 2 % to 5 % to as high as 20 % (Jarvie 2012).
With estimated shale gas resources greater than that of
US and Canada combined, China has been embarking on
an ambitious shale development program. China has sev-
eral types of shale (by area: 26 % marine, 56 % marine-
terrestrial transitional, and 18 % terrestrial), whereas
nearly all the US producing shales are of marine type (Zou
et al. 2013). Sinopec (China) has recently reported that its
first marine shale well (Jiao-Ye #1HF, drilled on Feb. 14,
2012 and completed on Nov. 24, 2012) initially produced
2.0 9 105 m3 gas/day, and maintained a stable daily pro-
duction of 6.6 9 104 m3 over the next 7 months. This
production behavior, though of limited duration, is con-
sistent with the 60 % 1st-year decline observed in US shale
wells.
Shale geology could be a bottleneck to its sustainable
development. While Hughes’ articles (2013a, b) mentioned
this steep decline and low overall recovery, investigations
into their root cause(s) are surprisingly scarce (Hu and
Ewing 2013). This work highlights the studies of root
causes from pore structure and fluid migration in the tight
matrix of several leading US and China shales. China has
so far drilled about 300 shale wells, dwarfed by the 80,000
US wells. A comparative analysis of pore structure and its
resultant fluid migration behavior is critically important.
Low recovery, coupled with the relatively high cost of
shale hydrocarbon development and the sharp drop in oil
price that started in 2014, is the main barrier to sustainable
development of US and China shale.
Fluid flow and solute transport in rock are macroscopic
consequences of the pore structure, which integrates
geometry (e.g., pore size and shape, pore size distribution;
Bear 1972) and topology (e.g., pore connectivity; Dullien
1992). Especially when pore connectivity is low, topolog-
ical factors outweigh the better known geometrical factors
(Ewing and Horton 2002; Hu et al. 2012; Hunt et al. 2014).
However, the prevalence of low pore connectivity in tight
shales, and its impacts on fluid flow and chemical transport,
is poorly documented and understood. This work examines
the potential of low pore connectivity of typical American
and Chinese shales, and its effects on fluid flow and
chemical transport.
2 Materials and methods
2.1 Samples
The research objective of this work is to examine the pore
structure (especially connectivity) characteristics of several
shale samples from active and leading onshore US and
China plays for hydrocarbon production (Table 1). These
shale samples have different geologic ages, mineralogy,
total organic carbon (TOC), kerogen types, and maturation
levels. For example, the Chinese shales generally have
much higher thermal maturation (with R0 values at about
3 %) than American ones (Table 1). Various geologic
controls on pore connectivity have not been systematically
studied in the literature.
Located in the Fort Worth Basin in north-central Texas,
the Barnett shale (the birth place of the ‘‘shale revolution’’)
is a Mississippian-age marine shelf deposit, ranging in
thickness from about 60 m (200 feet) in the southwest
region to 305 m (1000 feet) to the northeast. The formation
is a black, organic-rich shale (total organic carbon at
0.4 %–10.6 %, with an average of 4.0 %; Loucks and
Ruppel 2007) composed of fine-grained, siliciclastic rocks
with low permeability (70–5000 nD [nano-Darcy]) (Grie-
ser et al. 2008; Loucks et al. 2009). The Barnett shale play
currently has some 18,000 producing wells (Nicot et al.
2014). The reservoir produces at commercially viable
levels only with hydraulic fracturing that establishes long
and wide fractures, which connect large surface areas of
the formation through a complex fracture network. How-
ever, gas production in such tight shale is still technically
challenging, partly from the lack of the understanding of
nanopore structure characteristics of the shale matrix.
The 120 foot long (37 m) Blakely #1core (API 42-497-
33041), taken from southeastern Wise County within the
652 Pet. Sci. (2015) 12:651–663
123
Fort Worth Basin, includes part of the upper Barnett Shale
(2166–2169 m below ground surface (bgs), the Forestburg
Limestone (2169–218 mbgs), and the upper part of the
lower Barnett Shale (2181–2202 mbgs) (Loucks and
Ruppel 2007). We obtained core samples from this Blakely
#1 well, courtesy of the core repository of the Texas
Bureau of Economic Geology, representing five depths
separated by at most 10 m: 2167 m (7109 ft; upper Bar-
nett), 2175 m (7136 ft; Forestburg Limestone), and
2185 m (7169 ft), 2194 m (7199 ft) and 2200 m (7219 ft);
all from the upper part of the lower Barnett) (Table 2).
Since around 2008, U.S. natural gas drillers, stung by
decade-low gas prices from the over-supply of shale gas,
have focused significant efforts on producing oil from the
liquids-rich shale plays, such as Eagle Ford. The Eagle
Ford shale of southeast Texas, covering 23 counties, is
currently one of the most active shale hydrocarbon plays in
the U.S. It trends across Texas from the Mexican border up
into East Texas, roughly 80 km wide and 644 km long with
an average thickness of 76 m, at depths ranging from 1220
to 3660 ft. The amount of technically recoverable oil in the
Eagle Ford is estimated by the U.S. DOE to be 3.35 billion
barrels of oil. The high percentage of carbonate makes the
Eagle Ford shale brittle and ‘‘fracable’’ for the production
of oil, condensate, and gas.
Eagle Ford shale samples in this work come from two
sources: an outcrop and core samples from several depths.
The Comstock West outcrop sample from Val Verde Co.
was collected in Highway 90 about 50 km north-west of
Del Rio, Texas (Slatt et al. 2012). The outcrop sample has
an average TOC value of 5.3 %, and contains Type II
kerogen, making it an excellent marine oil and gas source
rock. However, at this location, the rocks are thermally
immature with Tmax values of 423–429 �C and average R0
of 0.53 %. The sample is calcareous with an average
CaCO3 content of 64 %. Core samples from the J.A.
Leppard #1 well (API 42-025-30389) in Bee County were
obtained from the Texas Bureau of Economic Geology.
Samples from three typical shale formations in south-
west China are studied in this work (Table 1): they are
cores from an exploratory shale well (Jinye Well No. 1),
and surface samples from two well-studied outcrops in
Xishui Qilong Village for the Longmaxi Formation and
Xiadong Jiulongwan for the Doushantuo Formation (Xie
et al. 2008).
The Sichuan basin is an oil-bearing and gas-rich basin
with an extensive development of the Lower Silurian
Longmaxi Formation shale in southwestern China (south-
eastern Sichuan and western Hubei-eastern Chongqing)
(Zou et al. 2013). The Longmaxi Formation contains
0.2 %–6.7 % of total organic carbon. The organic matter is
over-mature, with Ro ranging from 2.4 % to 3.6 %, and
dominated by Type II kerogen. Porosity measured on core
samples of the shale from the Longmaxi Formation in
exploratory wells ranges from 0.58 % to 0.67 % (Liu et al.
2011). The microporosity observed in thin sections of the
shale is about 2 %, and dominated by intercrystalline and
intragranular pores, with the pore size ranging from
100 nm to 50 lm. There are some differences between the
Longmaxi Formation shale and the Barnett shale. The
former is buried more deeply, with a higher degree of
thermal evolution, lower gas content, denser, and more
quartz of terrigenous origin (Liu et al. 2011).
In the Sichuan basin and its surrounding areas, shale gas
in Lower Cambrian Niutitang Formation is distributed over
all areas except for the eroded region in West Sichuan.
Generally thicker than 40 m, its thickness increases from
the central Sichuan to the north, the east, and the south. The
Table 1 Typical hydrocarbon-producing shales in China and USA tested in this work
Well/
sample ID
Formation Geologic age
(millions years ago)
Depth below
ground, m
Location TOC,
wt%
Ro, %
EF outcrop Eagle Ford (EF) Late Cretaceous
(99.6–65.5)
Surface
outcrop
Comstock, Val Verde Co., TX 5.3 0.53
Leppard
#1 (LP)
4143.9–4165.8 Bee Co., TX NA NA
Blakely #1
(BL)
Barnett (B) Mississippi
(359.2–318.1)
2166.8–2200.4 Wise Co., TX 3.08–6.62 *1.35
TZ-4H Longmaxi (LMX) Early Silurian
(443.7–428.2)
Surface
outcrop
Qilong Village, Xishui,
Guizhou
6.23 NA
Jinye Well
No. 1
Niutitang (NTT; also known
as Qiongzhusi)
Early Cambrian
(542.0–513.0)
136.7–220.5 Wazhi Village, Liujiazhen,
Rong County, Sichuan
0.2–11.5 2.11–3.74
YC01-72D Doushantuo (DST) Sinian (800–570) Surface
outcrop
Jiulongwan, Yichang, Hubei 9.68 NA
Average of 31 Barnett core samples from 4 wells including Blakely #1 (Loucks and Ruppel 2007)
NA not available
Pet. Sci. (2015) 12:651–663 653
123

Niutitang shale has a high organic carbon content, more
than 2 % in most areas of Sichuan Basin. This formation is
mature or over-mature. It is also deeply buried (more than
7 km in the west, the north and the east), and has evolved
for a long time with complex preservation conditions
which inhibit exploration and development. The most
favorable exploration region lies in the south of Sichuan
Basin, and the second most favorable areas are in western
Hubei and eastern Chongqing (Liu et al. 2011; Sun et al.
2011; Guo 2013). Jinye well No. 1 is the first Sinopec shale
gas well for obtaining geological parameters in southern
Sichuan, and was cored with a total core length of 101.3 m
in the Niutitang Formation and used in this study (Table 1).
2.2 Mercury intrusion and pore characteristics
Pore structure characterization of shale samples includes
measuring their porosity, particle and bulk density, total
pore surface area, and pore size distribution with mercury
injection capillary pressure (MICP). Porosity and pore-
throat distribution were analyzed using a mercury intrusion
porosimeter (AutoPore IV 9510; Micromeritics Instrument
Table 2 Basic pore structure characteristics from MICP analyses
Sample IDa Porosity, % Total pore
area, m2/g
Median pore-throat
diameter (volume), nmbCharacteristic
length, nmcPermeability,
nD
Effective
TortuositydLe/L
d
EF outcrop 7.85 6.38 22.7 7.2 258 80.5 2.51
EF LP4146e 3.28 7.16 6.5 4.1 2.72 1814 7.71
EF LP4155 1.56 3.14 9.5 3.2 1.60 NA NA
EF LP4155e 2.58 5.49 8.0 3.2 2.46 2815 8,52
EF LP4157 3.11 5.58 17.4 6.4 2.97 2191 8.26
EF LP4166e 1.75 2.48 23.5 3.2 1.60 3867 8.23
B BL2167 1.98 4.87 5.9 4.8 1.35 2136 6.51
B BL2167 1.54 3.67 6.1 3.5 1.48 2026 5.58
B BL2175e 0.294 0.061 2698 13.7 3.24 1759 2.27
B BL2175 0.223 0.225 30.0 12.2 1.18 1784 1.99
B BL2185e 0.711 1.01 21.9 5.2 0.52 8699 7.86
B BL2185 0.555 1.02 7.0 4.6 1.05 2045 3.37
B BL2194 5.08 13.5 5.9 4.5 4.22 2273 10.7
B BL2194 4.84 13.0 5.9 4.0 3.71 2316 10.6
B BL2200 3.89 9.25 6.5 4.5 2.65 3845 12.2
B BL2200 3.27 7.51 6.7 3.6 2.78 3694 11.0
LMX TZ-4H 3.83 10.3 6.3 3.0 3.91 NA NA
LMX TZ-4H 5.45 17.5 5.0 3.1 5.38 2214 11.0
NTT JY#1-137 1.49 1.01 65.9 11.0 9.58 NA NA
NTT JY#1-137 1.18 1.10 20.9 6.5 1.99 1805 4.62
NTT JY#1-189 1.44 2.61 11.5 3.3 1.35 NA NA
NTT JY#1-189 1.80 3.62 8.7 4.0 1.60 3683 8.13
NTT JY#1-220 3.91 9.07 8.3 3.3 3.66 NA NA
NTT JY#1-220 4.39 7.86 10.3 5.7 6.64 1068 6.84
NTT JY#1-220 2.33 8.25 4.1 3.8 1.99 4103 9.77
DST YC01-72D 7.81 6.86 41.5 4.0 5.88 1413 10.5
a Numbers are the sample depths in a well (e.g., BL-2167 denotes sample location at 2167 m of the Blakely #1 well)b Pore-throat diameter at which the volume of intruded mercury is 50 % of final valuec The characteristic (or threshold) length which is the pore-throat diameter corresponding to the threshold pressure Pt (psia); Pt is determined at
the inflection point of the cumulative intrusion curve when mercury starts to percolate the whole sampled NA not available. Some early measurements do not produce the effective tortuosity results, as the tortuosity calculation uses data points beyond
the threshold pressure which is near 3-nm lower limit of the MICP instrument; recent measurements with more pressure measurement points
consistently generate the tortuosity valuese These two sample cubes are detected to contain micron size fractures which lead to larger median pore-throat diameters than their non-
fractured duplicate sample
654 Pet. Sci. (2015) 12:651–663
123
Corporation, Norcross, GA). In addition, the MICP
approach can also indirectly evaluate other pore charac-
teristics, such as permeability and tortuosity (Webb 2001;
Gao and Hu 2013).
Each shale sample (rectangular prisms with the largest
linear dimension at either 10 or 15 mm) was oven-dried at
60 �C for at least 48 h to remove moisture, and cooled to
room temperature (*23 �C) in a desiccator with less than
10 % relative humidity before the MICP test. Samples
were then evacuated to 50 lm Hg (6.7 Pa, or 99.993 %
vacuum). During a MICP test, each sample underwent both
low-pressure and high-pressure analyses. The highest
pressure produced by our MICP instrument is 60,000 psia
(413 MPa), corresponding (via the Washburn equation) to
a pore-throat diameter of about 3 nm. Under low-pressure
analysis, the largest pore-throat diameter recorded by
MICP is about 36 lm for a narrow-bore sample holder
(called penetrometer) for samples with low (down to about
0.5 %) porosity. Equilibration time (minimum elapsed time
with mercury volume change \0.1 lL, before proceeding
to the next pressure) was chosen to be 50 s.
As reported by Gao and Hu (2013), permeability for the
shale samples was calculated from the MICP data by the
method of Katz and Thompson (1986, 1987). Effective
tortuosity s, another important parameter which indicates
pore connectivity, can also be derived from MICP data
(Hager 1998; Webb 2001).
s ¼ffiffiffiffiffiffiffiffiffiffiffiffiffiffiffiffiffiffiffiffiffiffiffiffiffiffiffiffiffiffiffiffiffiffiffiffiffiffiffiffiffiffiffiffiffiffiffiffiffiffiffiffiffiffiffiffiffiffiffiffiffiffiffiffiffiffiffi
q24k 1 þ qVtotð Þ
Z g¼rc;max
g¼rc;min
g2fV gð Þdgs
; ð1Þ
where q is fluid density, g/cm3; k is permeability, lm2; Vtot
is total pore volume, mL/g;R g¼rc;max
g¼rc;ming2fV gð Þdg is pore-
throat volume distribution by pore-throat size. Effective
tortuosity s is related to the effective diffusion coefficient
and travel distance of molecules by the following equation
(Epstein 1989; Hu and Wang, 2003; Gommes et al. 2009):
s ¼ D0
De
¼ 1
/Le
L
� �2
; ð2Þ
where D0 is the aqueous diffusion coefficient and De
effective diffusion coefficient in porous media, m2/s; Le is
actual distance, m, traveled by a fluid particle as it moves
between two points in a porous medium, which are sepa-
rated by a straight line distance L, m; / is porosity.
2.3 Spontaneous fluid imbibition and tracer
migration
Because the concentration profile of various tracers pro-
vides a useful indication of the connectivity of a porous
medium (Hu et al. 2012; Ewing et al. 2012), tracers were
emplaced several different ways: by spontaneous
imbibition (Sect. 2.3), by diffusion (Sect. 2.4), and by
injection under pressure (Sect. 2.5).
Spontaneous imbibition is a capillary force-driven pro-
cess during which a wetting fluid displaces a non-wetting
fluid only under the influence of capillary pressure.
Because of the mathematical analogy between diffusion
and imbibition, liquid imbibition can be used to probe a
rock’s pore connectivity (Hu et al. 2012). Imbibition tests,
which are much faster than diffusion tests, involve expos-
ing one face of a rock sample to liquid (for example, water,
API brine or n-decane), and monitoring the fluid mass
uptake over time (e.g., Hu et al. 2001; Schembre and
Kovscek 2006). Using the network modeling results of
Ewing and Horton (2002), we can probe pore connectivity,
as indicated by the slope of log (imbibed liquid mass)
versus log (time). The imbibition behavior—whether the
imbibition slope is �, � changing to �, or � —conve-
niently classifies a rock’s pore connectivity (Hu et al.
2012).
All sides of cm-sized cubes, except the top and bottom,
were coated with quick-cure transparent epoxy to avoid
evaporation of the imbibing fluid from, and reduce vapor
transport and capillary condensation through, the side
surfaces of the sample. The experimental procedure and
data processing of imbibition tests were described in detail
by Hu et al. (2001). Samples were first oven-dried at 60 �Cfor at least 48 h, in order to achieve a constant initial water
saturation state, before being subjected to the imbibition
experiments. During the imbibition tests with water or API
brine, beakers of water were placed inside the experimental
chamber to maintain a high and constant humidity level;
these water beakers were removed for n-decane imbibition.
The top of the side-epoxied samples was loosely covered
with thin Teflon film, with a small hole left for air escape
and co-current imbibition. The sample bottom was sub-
merged to a depth of about 1 mm in the fluid reservoir. The
imbibition rate was monitored by automatically recording
the sample weight change over time.
In addition to replicate imbibition tests with de-ionized
water being performed on the same sample (re-dried
between runs), tracer imbibition experiment was conducted
in API brine or n-decane fluid. Shales contain distinct
phases of oil-wetting organic matter (e.g., kerogen) and
water-wetting minerals, and tracers in two fluids (API brine
and n-decane) are used to interrogate the wettability and
connectivity of organic matter and mineral pore spaces.
The organic fluid (n-decane) is expected to be preferen-
tially attracted to the hydrophobic component (e.g., organic
particles) of the shale matrix, with reported organic
(kerogen) particle sizes ranging from less than 1 lm to tens
of lm (Loucks et al. 2009; Curtis et al. 2012). Organic
grains are found to be dispersed through the Barnett shale
matrix (Hu and Ewing 2014), with their connection to
Pet. Sci. (2015) 12:651–663 655
123

mineral phases unknown. An understanding of the distri-
bution and migration of the hydrocarbons stored in pores in
these organic grains is critically needed.
API brine is made of 8 % NaCl and 2 % CaCl2 by
weight (Crowe 1969). Tracer imbibition test of API brine
contains both non-sorbing (perrhenate) and sorbing (cobalt,
strontium, cesium, and europium, with different sorption
extents) tracers, and were prepared using ultrapure (Type
1) water and [99 % pure reagents (NaReO4, CoBr2,
SrBr2�2H2O,CsI, and EuBr3�6H2O; Sigma-Aldrich Co., St.
Louis, MO). Concentrations used were 100 mg/L KReO4,
400 mg/L CoBr2, 400 mg/L SrBr2, 100 mg/L CsI, and
200 mg/L EuBr3.
Dissolved in n-decane, organic phase tracer chemicals
were [99 % pure tracer element-containing organic
reagents: 1-iododecane {CH3(CH2)9I, molecular weight of
268.18 g/mol} and trichlorooxobis (triphenylphosphine)
rhenium(V){[(C6H5)3P]2ReOCl3, molecular weight
833.14 g/mol}. The elements iodine (I) and rhenium (Re)
of these organic chemicals are detected by LA–ICP–MS
for the presence of these two organic tracers in shale.
Trichlorooxobis (triphenylphosphine) rhenium (referred as
organic-Re in this paper) was first dissolved in acetone
solvent until over-saturation, filtered to obtain the saturated
liquid, and then added to n-decane at a volume ratio of
2 %. Organic-I (1-iododecane) was directly added to
n-decane fluid at a volume ratio of 1 %.
We use jmol software (http://jmol.sourceforge.net/) to
estimate the structural dimensions of these organic tracers.
The organic-I has a diameter at 1.39 nm length
(L) 9 0.29 nm width (W) 9 0.18 nm height (H), while the
structural dimensions of organic-Re molecules are 1.27 nm
L 9 0.92 nm W 9 0.78 nm H, with its width and height
larger than organic-I.
After tracer imbibition tests of 12–24 h in either API
brine or n-decane fluids, the shale samples were lifted out
of the fluid reservoir, flash-frozen with liquid nitrogen, kept
at -80 �C in a freezer, freeze-dried as a batch at -50 �Cand near-vacuum (less than 1 Pa) for 48 h, then stored at
\10 % relative humidity prior to the analyses by laser
ablation inductively coupled plasma-mass spectrometry
(LA-ICP-MS).
2.4 Saturated diffusion
Chemical diffusion within fluid-saturated shale was mea-
sured following Hu and Mao (2012). Dry shale samples
were evacuated for nearly 24 h at 99.99 % vacuum, and
saturated by allowing non-traced fluid to invade the evac-
uated sample. Samples were then exposed (1 face only) to a
tracer-containing fluid (either API brine or n-decane) in a
reservoir. At fixed diffusion times (generally 1 day for
1 cm-sided cubes, and 2–4 days for 1.5-cm cubes),
individual shale samples were removed from the reservoir
and processed (liquid nitrogen freezing, freeze-drying, and
dry-storing) for tracer mapping.
2.5 Wood’s metal intrusion
Wood’s metal intrusion, and consequent SEM imaging and
LA-ICP-MS mapping, provides a direct assessment of
surface-accessible pore structure. Rock pore networks are
examined by injecting the sample with molten Wood’s
metal alloy (50 % Bi, 26.7 % Pb, 13.3 % Sn, and 10 % Cd;
melting point around 78 �C), a method pioneered by
Swanson (1979) and Dullien (1981). Because of its high
bismuth (Bi) content, Wood’s metal alloy does not shrink
as it solidifies (Hildenbrand and Urai 2003). Because this
metal alloy is solid below 78 �C, pore structures filled by
Wood’s metal alloy can be readily imaged and mapped for
the presence of alloy component elements. Injecting mol-
ten Wood’s metal alloy also offers the possibility of
‘‘freezing’’ the invaded network at any stage of the injec-
tion, allowing micro-structural studies to be made on the
iteratively filled pore networks (Kaufmann 2010).
Wood’s metal alloy impregnation on shales was carried
out at Kaufmann’s laboratory at Empa (Zurich, Switzer-
land), which is capable of injecting the alloy at pressures up
to 6000 bars (600 MPa or 87,023 psi). This corresponds to a
pore-throat diameter of 2.35 nm; this estimation is based on
the Washburn equation (1921), using a surface tension of
0.4 N/m and a contact angle of 130� for Wood’s metal (Darot
and Reuschle 1999). Shale samples (about 5 9 5 9 5 mm3)
were first dried at 110 �C for 1 week, then glued to the
bottom of a cell, which was then filled with solid Wood’s
metal pieces. The cell was closed by a piston and heated to
85 �C under vacuum (\5 Pa); O-rings connecting the piston
to the cell wall are able to bear pressures of more than 6,000
bars (Kaufmann 2010). Once the metal was molten, a load
was applied to the piston by means of a press in controlled
load mode. Pressure in the cell was increased by 7 MPa/min
until the maximum pressure was reached; the maximum
pressure was then held for 15 min. After that, the tempera-
ture was decreased at a cooling rate of about 1 �C/min to
solidify Wood’s metal in the intruded pore spaces. During
this solidifying step, the load was regulated to maintain the
desired pressure. Once cool, the alloy-impregnated sample
was taken out of the cell and cut horizontally in the middle of
the sample height, to allow tracing Wood’s metal alloy
intrusion from the sides. One piece was cut to 150 lm thick,
polished, and mounted on a glass slide, and imaged with an
environmental SEM (Quanta 200, FEI, Hillsboro, OR) using
back-scattered electrons (Dultz et al. 2006).The other cut
piece was used for LA-ICP-MS elemental mapping, using
the distribution of Wood’s metal alloy component (e.g., Pb)
to identify surface-accessible connected pore spaces.
656 Pet. Sci. (2015) 12:651–663
123
2.6 LA-ICP-MS elemental mapping
For tracer imbibition, saturated diffusion, and Wood’s
metal intrusion tests, tracer concentrations at spatially
resolved (mostly at 100 lm for cm-sized samples) loca-
tions were measured using laser ablation followed by LA-
ICP-MS. The laser ablation system (UP-213, New Wave;
Freemont, CA) used a 213 nm laser to vaporize a hole in
the shale sample at sub-micron depths; elements entrained
in the vapor were analyzed with ICP-MS (PerkinElmer/
SCIEX ELAN DRC II; Sheldon, CT). For various tests
described here, this LA-ICP-MS approach can generate
2-D and 3-D maps of chemical distributions in rock at a
spatial resolution of microns, and a concentration limit of
low mg/kg (Hu et al. 2004; Hu and Mao 2012; Peng et al.
2012).
First we spot-checked for the presence of tracers at the
sample’s bottom (reservoir) and top faces, then the sample
was cut dry in the middle from the top face, transverse-
wise with respect to the imbibition/diffusion direction. A
grid of spot analyses were then performed by LA-ICP-MS
on the saw-opened interior face to map the tracer distri-
bution within the shale sample, with a two-grid scheme to
capture the tracer penetration into the samples from the
edge. The first grid used an area of about
10 mm 9 0.3 mm (in the direction of imbibition/diffu-
sion), close to the sample bottom, with 100 lm laser spot
size and 100 lm spacing between spots in the imbibition/
diffusion direction. This fine gridding scheme was per-
formed in the area close to the bottom of the sample in the
flow direction, because this area can have a steep tracer
concentration gradient over a short distance. A second grid
was then used to the right of the first grid at *800 lm
spacing among laser spots to capture the possible presence
of tracers away from the bottom edge.
3 Results and discussion
3.1 Mercury intrusion
As measured by MICP, pores in American and Chinese
shales are predominantly in the nm size range with a
measured median pore-throat diameter of 4.1–65.9 nm
(Table 2). Excluding a few samples with fractures, 80 %–
95 % of matrix pore-throat sizes by volume are smaller
than 100 nm. For example, duplicate measurements of
Longmaxi Formation samples (LMX TZ-4H in Table 2)
show a porosity of 3.83 % and 5.45 %, median pore-throat
sizes of 6.3 and 5.0 nm, with nearly 50 % of the pore-
throat sizes located in 3–5 nm range and 90 %–95 %
smaller than 100 nm. This is consistent with other literature
values. For the Longmaxi shale samples from the
Changxin#1 well drilled in southeastern region of the
Sichuan Basin, Chen et al. (2013) reported that the average
porosity is 5.68 %. The micropores in the shale observed
by the SEM are dominated by intergranular (dissolution)
mineral pores, intergranular gaps, intragranular pores, the
organic matter micropores, and micro-fractures. The mer-
cury intrusion porosimetry results show that the maximum
radius of the pore-throat is 33 nm, with the average at
10 nm (Chen et al. 2013).
While the presence of nanopores in shales has been well
recognized since the first application of Ar-ion milling and
field-emission SEM imaging (Loucks et al. 2009) to indi-
cate the dominant organic nanopores in Barnett shales,
larger pores cannot be discounted in their roles of mass
transport and connecting nanopore regions. Pores less than
3 nm can be quantified with approaches such as low-
pressure gas sorption isotherm, but such small pores
probably do not play critical roles in hydrocarbon move-
ment (Javadpour et al. 2007). When small pores or narrow
pore-throats have diameters in the same order of magnitude
as the chemicals, the steric hindrance effect can be sig-
nificant (Hu and Wang 2003). Most hydrocarbon species of
interests have a molecular diameter from 0.5 to 10 nm
(Nelson 2009), and therefore probably the pore systems
that contribute to hydrocarbon movement are these con-
nected ones with pore sizes of 5–100 nm.
Using SEM/field-emission SEM methods to determine
porosities of a range of shale, Slatt and O’Brian (2011) and
Slatt et al. (2013) reported that micropores ([1 lm in pore
length and nanopores (\1 lm) are subequal. The microp-
ores are commonly porous floccules (clumps of electro-
statically charged clay flakes arranged in edge–face or
edge–edge card house structure) of up to 10 lm in diam-
eter, which are not often seen or identified in ion-milled
shale surfaces, perhaps due to the collapse of floccules
during milling (Slatt et al. 2013). For the Eagle Ford shale
with a high carbonate content, Slatt et al. (2012) reported
the presence of lm-sized pore types from coccospheres
(internal chambers and hollow spines are up to 1 lm in
diameter and several lm in length) and foraminifera (their
internal chambers can be 10 lm in diameter). Our MICP
analyses, performed on individual 1 cm sized cubes,
observed appreciable lm-sized pores, with [1 lm sized
pores account for 10 %–20 % for American and Chinese
shales studied in this work.
Since core samples are not readily available, we com-
pare the outcrop with core samples for Eagle Ford Lower
Shale, and observe a quite different behavior. The outcrop
sample has a unimodal pore-throat size (at 95 %) located at
10–50 nm, compared to 30 %–44 % for three core sam-
ples. Pore-throats for the core samples are widely dis-
tributed from 3 nm to 36 lm, though most of them (70 %–
80 %) are smaller than 100 nm. The disparity between
Pet. Sci. (2015) 12:651–663 657
123
outcrop and core samples is also reflected in median pore-
throat sizes, as well as permeability with a difference of a
factor of 100. However, caution needs to be extended when
using data from outcrop samples to infer underground
conditions.
Matrix permeabilities for these twelve American and
Chinese shales, at a total of 24 MICP measurements, are
0.52–9.6 nD (Table 2), as estimated by the method of Katz
and Thompson (1986, 1987). This is consistent with
reported permeabilities of 1–10 nD by Heller and Zoback
(2013), who used a pulse-decay permeameter with helium
(more labor- and instrumentation-intensive) on 1–2 mm
sized Barnett chips. The matrix permeabilities for Lower
Eagle Ford shale from a well at different depths (4053.2 to
4087.8 m) range from 0.44 to 23.3 nD (5.82 ± 6.89,
N = 14) (David Maldonado, 2012, personal communica-
tion), measured by the Gas Research Institute (GRI) (cru-
shed rock) method (Luffel et al. 1993; Guidry et al. 1996).
Our MICP technique, with cm-sized samples under con-
fined pressure conditions and at an analytical cost (and
sample mass) required of less than 10 % of amount of
sample required for the GRI method, consistently produces
comparable permeability values of 1.60–2.97 nD for the
Leppard #1 core samples (Table 2).
MICP data can also be used with Hager’s (1998) method
to estimate effective tortuosity values, which characterize
the convoluted pathways of fluid flow through porous
systems (e.g., Epstein 1989; Hu and Wang 2003; Gommes
et al. 2009). Following Gommes et al. (2009) approach
(Eq. 2) of relating geometrical tortuosity to the travel paths
that molecules will need to follow through a porous med-
ium, the Le/L ratios for the American and Chinese shales
are on the order of 2–11 (Table 2). These relatively large
values of tortuosity imply that fluid within the tight shale
formations will need to make its way through some tortu-
ous pathways in order to migrate from one location to
another. For example, a tortuosity Le/L of 11 for Longmaxi
Formation sample means that it will take 11 cm for fluid to
travel a linear distance of 1 cm in that formation. This is
consistent with the findings from other approaches pre-
sented in this paper, which indicate that the nanopores of
the tight shale formations are poorly connected so that
fluids require much time to find connected pathways to
travel a limited distance.
3.2 Spontaneous fluid imbibition and tracer
migration
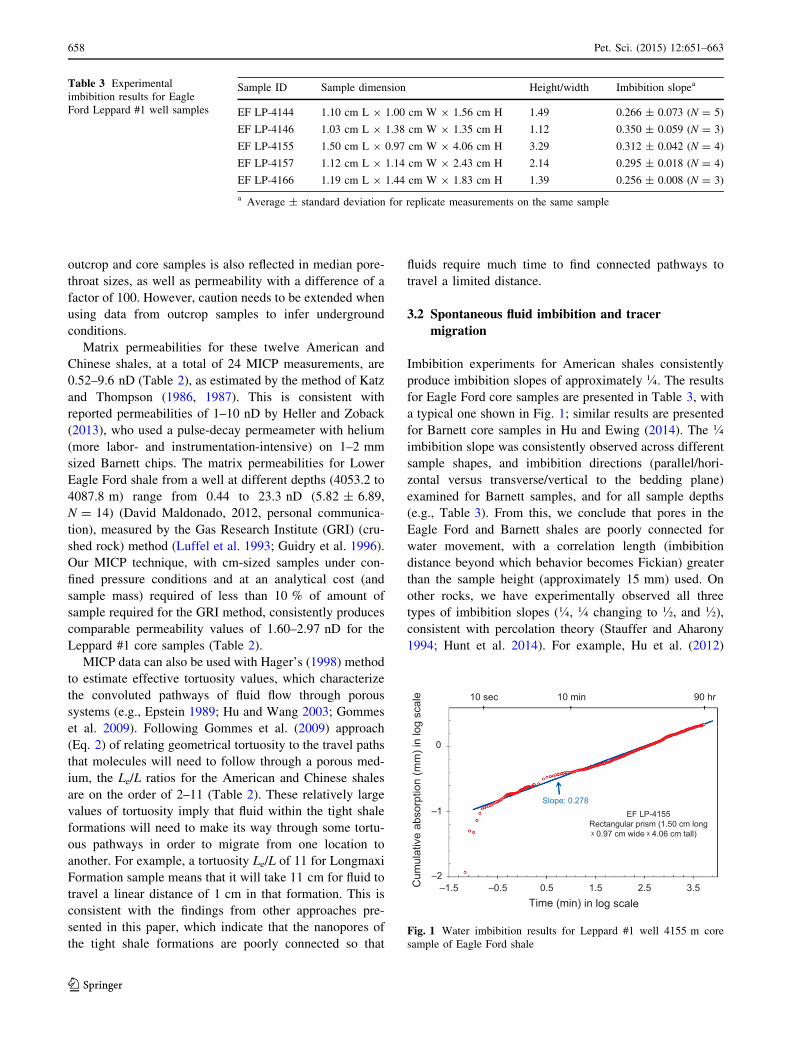
Imbibition experiments for American shales consistently
produce imbibition slopes of approximately �. The results
for Eagle Ford core samples are presented in Table 3, with
a typical one shown in Fig. 1; similar results are presented
for Barnett core samples in Hu and Ewing (2014). The �imbibition slope was consistently observed across different
sample shapes, and imbibition directions (parallel/hori-
zontal versus transverse/vertical to the bedding plane)
examined for Barnett samples, and for all sample depths
(e.g., Table 3). From this, we conclude that pores in the
Eagle Ford and Barnett shales are poorly connected for
water movement, with a correlation length (imbibition
distance beyond which behavior becomes Fickian) greater
than the sample height (approximately 15 mm) used. On
other rocks, we have experimentally observed all three
types of imbibition slopes (�, � changing to �, and �),
consistent with percolation theory (Stauffer and Aharony
1994; Hunt et al. 2014). For example, Hu et al. (2012)
Table 3 Experimental
imbibition results for Eagle
Ford Leppard #1 well samples
Sample ID Sample dimension Height/width Imbibition slopea
EF LP-4144 1.10 cm L 9 1.00 cm W 9 1.56 cm H 1.49 0.266 ± 0.073 (N = 5)
EF LP-4146 1.03 cm L 9 1.38 cm W 9 1.35 cm H 1.12 0.350 ± 0.059 (N = 3)
EF LP-4155 1.50 cm L 9 0.97 cm W 9 4.06 cm H 3.29 0.312 ± 0.042 (N = 4)
EF LP-4157 1.12 cm L 9 1.14 cm W 9 2.43 cm H 2.14 0.295 ± 0.018 (N = 4)
EF LP-4166 1.19 cm L 9 1.44 cm W 9 1.83 cm H 1.39 0.256 ± 0.008 (N = 3)
a Average ± standard deviation for replicate measurements on the same sample
10 sec 10 min 90 hr
0
–1
–2–1.5 –0.5 0.5 1.5 2.5 3.5
Time (min) in log scale
Cum
ulat
ive
abso
rptio
n (m
m) i
n lo
g sc
ale
Slope: 0.278EF LP-4155
Rectangular prism (1.50 cm longᵡ 0.97 cm wide ᵡ 4.06 cm tall)
Fig. 1 Water imbibition results for Leppard #1 well 4155 m core
sample of Eagle Ford shale
658 Pet. Sci. (2015) 12:651–663
123

observed the � slope across all aspect ratios for Berea
sandstone samples, indicating its well-connected pore
spaces.
In addition to fluid imbibition tests to probe the pore
connectivity, some tracer imbibition tests were conducted
and resultant tracer penetration distance was mapped using
LA-ICP-MS. The mapping result for API brine-tracer
imbibition into the interior face of a Longmaxi shale
sample (LMX DZ-4H) is shown in Fig. 2. When imbibition
proceeds from this initially dry sample, capillary-driven
advective flow produces a relatively steep imbibition front
for non-sorbing ReO4-. At about 1 mm into the matrix
from the edge, the tracer is only distributed at about
1–4 mg/kg (compared with a measured mean concentration
of 807 mg/kg within 2 lm of the edge on the imbibing
face; in other words, the connected porosity away from the
edge is only about 0.5 %–2 % of the total pore space),
from the imbibition test of 47.5 h. Such a result indicates
the limited pore connectivity for brine fluid flow and tracer
movement, with the connected pore spaces limited to the
sub-mm range from the sample edge in Longmaxi shale;
similar results are observed for Barnett shale (Hu and
Ewing 2014).
3.3 Saturated diffusion
Figure 3 presents 2-D tracer concentration profiles in
n-decane fluid for a Niutitang shale (NTT JY#1-137) after
25 h diffusion time. Two molecular tracers in n-decane
fluid have the sizes of 1.39 nm 9 0.29 nm 9 0.18 nm for
organic-I (Fig. 3a) and 1.27 nm 9 0.92 nm 9 0.78 nm for
organic-Re (Fig. 3b). Much less diffusive penetration was
observed for larger molecules of organic-Re inside a
sample with 47 %–66 % pore-throat sizes between
3–50 nm (measured characteristic pore-throat sizes from
MICP are 6.5–11.0 nm, when fluid mercury starts to per-
colate across the whole sample; Table 2). This result
indicates the entanglement of nano-sized molecules in
nanopore spaces of tight samples. Comparatively, the
narrower sized organic-I is present nearly throughout the
whole sample, indicating that this shale sample has oil-
wetting characteristics and possesses well-connected pore
spaces for hydrophobic molecules to move, barring the
very sensitive molecular size effect. The practical impli-
cation is that the out-diffusion of nm-sized hydrocarbon is
expected to be slow, of limited quantity, and largely lim-
ited to a small distance from rock matrix into a fracture;
this will affect the hydrocarbon recovery in stimulated
shale reservoirs.
3.4 Limited edge-accessible porosity from Wood’s
metal intrusion
The Barnett shale sample from 2185 m (B BL-2185) was
injected with Wood’s metal alloy at 1542 bars (154 MP).
At this pressure, pore-throats of diameter greater than
9.2 nm are invaded. For this sample, SEM images show
that there is little connected matrix porosity farther than
about 60 lm from the sample’s edge (figure not shown);
Wood’s metal mainly occupies small cracks and matrix
pores connected to the sample surface. As in the case for
mercury intrusion, the sample was externally and uni-
formly surrounded by non-wetting molten Wood’s metal
alloy, with even pressurization to reduce experiment-re-
lated fractures.
The sample was also mapped by LA-ICP-MS for more
sensitive detection of the presence of Wood’s metal com-
ponent elements (Bi, Cd, Pb, and Sn). Distribution of all
these elements inside the shale sample was similar, so only
the plot for Pb is presented (Fig. 4). Wood’s metal alloy
has 26.7 % Pb (267,000 mg/kg), consistent with the
807
281
97.8
34
11.8
4.13
1.44
0.5
1000
3000
5000
7000
9000
μm
μm4000 2000 0
ReO4-mg/kg
Fig. 2 API brine-tracer imbibition penetration profile in LMX TZ-4H
sample of Longmaxi shale, mapped on the interior face for non-
sorbing ReO4-; imbibition time 47.5 h. This 5000 lm 9 9575 lm
grid nearly covers whole sample, with a mapping routine of 100 lm
laser spot size and 500 lm spacing between spots. The bottom (tracer
imbibing) face is shown to the bottom of the figure. The LA-ICP-MS
detection limit and background levels in the clean sample for Re are
about 0.05 and 0.5 mg/kg (used as the smallest value for 8-scale color
scheme), respectively. The largest value of color scale (807 mg/kg) is
the averaged Re concentration of 81 measurements obtained on the
imbibing face (807 ± 391 mg/kg)
Pet. Sci. (2015) 12:651–663 659
123

concentration detected by LA-ICP-MS, but its natural
abundance in the shale matrix is only about 0.5 mg/kg.
Lead is, therefore, an excellent proxy for the presence of
Wood’s metal inside the sample, identifying porous regions
that are connected to the sample’s exterior. LA-ICP-MS
has a higher chemical resolution and larger observation
scales than SEM, though lower spatial resolution, and
reveals connected pore spaces that are not visible with
SEM imaging. Wood’s metal penetrates all pore spaces (at
the resolution of 100-lm laser spot) within this sample
with a dimension of 7.0 mm 9 7.75 mm, as seen from the
concentrations uniformly across the sample at above the
0.5 mg/kg background level. However, the surface-acces-
sible connected pores constitute a very low percentage of
the interior volume. Detected Pb concentrations in the
interior area are only in the range of 10,000 mg/kg, com-
pared to 267,000 mg/kg for the Pb content in Wood’s metal
itself. Even under a high pressure of 1542 bars, a mean
connected porosity therefore comprises about 4 % of
interior pore volume of this sample, consistent with other
results of this work with respect to limited pore connec-
tivity for tight shales.
Organic-lmg/kg
μm90007000500030001000
1000
3000
5000
7000
μm
31.2
19.1
11.7
7.15
4.37
2.67
1.64
1
Organic-Remg/kg
μm90007000500030001000
1000
3000
5000
7000
μm
60
33.4
18.6
10.4
5.78
3.22
1.8
1
(a)
(b)
Fig. 3 Saturated diffusion test results for NTT JY#1-137 sample of Niutitang Shale Formation using n-decane fluid with tracers of organic
iodine and organic rhenium of different molecular sizes. The total grid size is 10,000 lm 9 8050 lm to cover whole sample, and mapped with a
100 lm laser spot size and two-grid scheme of variable spacing between spots; the white areas indicate the regions of concentration below the
LA-ICP-MS detection limit
660 Pet. Sci. (2015) 12:651–663
123

4 Conclusions
We investigated pore geometry and topology in several
typical American and Chinese shales, and their implica-
tions for fluid movement and tracer migration. Our
experimental approaches included mercury porosimetry,
spontaneous imbibition and tracer migration, tracer diffu-
sion, and Wood’s metal intrusion under high pressures.
Consistent with other reports, we found that these shale
pores are predominantly in the nm size range, with a
median pore-throat diameter of 4.1–65.9 nm. It is expected
that the shale’s geometrical properties—low porosity and
small pore-throat size—will yield extremely low diffusion
and imbibition rates.
Using multiple characterization approaches to infer the
shale’s topology, we also found consistent evidences that
pore connectivity in these shales could be quite low for a
particular probing fluid of either API brine or n-decane.
Tracer diffusion inside the shale matrix was not well
described by classical Fickian behavior; the anomalous
behavior suggested by percolation theory gave a better
description. The spontaneous imbibition tests saw an
imbibition slope characteristic of low-connectivity mate-
rial. Our different methods assessing edge-accessible
porosity—following spontaneous imbibition, diffusion, and
high pressure intrusion—consistently showed a steep
decline in accessible porosity with distance from the
sample exterior. In fact, Wood’s metal concentration in the
interior is only about 4 % under high pressures, which
indicates that only a limited number of the interior pores
are connected to the outside by a continuous pathway.
Because shale has both mineral (water-wetting) and
organic (kerogen; water-repelling) pores, a fluid-based
approach such as spontaneous imbibition and diffusion are
expected to give lower accessible porosity profiles than
will pressure-injected Wood’s metal, which accesses both
the water-wet and oil-wet pores. But despite Wood’s metal
accessing both kinds of pores, it consistently shows the
steep decline in accessible porosity with distance that is
characteristic of low pore connectivity. All results con-
verge into findings that pores more than a few mm inside a
sample are unlikely to be connected to the exterior, with
additional implications of molecular size effects, as shown
from our tracers of different sizes. In terms of hydrocarbon
production, matrix pores more than a few mm from an
induced fracture are only sparsely connected to fracture
network and the producing borehole.
The consequences of low pore connectivity, specifically
distance-dependent accessible porosity, will lead to an
initial steep decline in production rates and low overall
recovery. Once the hydrocarbons residing in the fracture
network are exhausted, hydrocarbon replenishment from
shale matrix (i.e., ‘‘matrix feeding’’) is limited by the
slower anomalous diffusion through the shale matrix, and
Pbmg/kgμm
6000
4000
2000
00 2000 4000 6000 μm
267000
40577
6167
937
142
21.7
3.29
0.5
Fig. 4 2-D LA-ICP-MS mapping of Pb (lead) distribution in B BL-2185 m sample following Wood’s metal alloy injection at a pressure of 1542
bars; laser spot size is 100 lm and spacing between spots is 250 lm
Pet. Sci. (2015) 12:651–663 661
123
reduced by the fraction of the matrix that is actually
accessible.
This study addresses knowledge gaps regarding pore
connectivity in typical American and Chinese shales. We
show that pore connectivity may be a dominant constraint
on diffusion-limited hydrocarbon transport. Pore connec-
tivity at the nanoscale may be the cause of underlying steep
first-year declines in hydrocarbon production, as well as the
low overall recovery observed in hydraulic fractured
shales.
Acknowledgments Funding for this project was partially provided
by the following three State Key Laboratories in China: State Key
Laboratory of Oil and Gas Reservoir Geology and Exploitation,
Chengdu University of Technology, Chengdu (PLC-201301); State
Key Laboratory of Organic Geochemistry, Chinese Academy of
Sciences, Guangzhou (No. OGL-201402); the Foundation of State
Key Laboratory of Petroleum Resources and Prospecting, China
University of Petroleum, Beijing (No. PRP/open-1403). The authors
would like to thank Harold Rowe and Roger Slatt for providing
Barnett and Eagle Ford samples. Laboratory assistance from Troy
Barber, Yuxiang Zhang, Golam Kibria, and Francis Okwuosa is also
much appreciated.
Open Access This article is distributed under the terms of the
Creative Commons Attribution 4.0 International License (http://crea
tivecommons.org/licenses/by/4.0/), which permits unrestricted use,
distribution, and reproduction in any medium, provided you give
appropriate credit to the original author(s) and the source, provide a
link to the Creative Commons license, and indicate if changes were
made.
References
Bear J. Dynamics of fluid in porous media. New York: Dover
Publications; 1972.
Chen WL, ZhouW LuoP, et al. Analysis of the shale gas reservoir in
the Lower Silurian Longmaxi Formation, Changxin 1 well,
Southeast Sichuan Basin, China. Acta Petrol Sin. 2013;29(3):
1073–86 (in Chinese).
Crowe CW. Methods of lessening the inhibitory effects to fluid flow
due to the presence of solid organic substances in a subterranean
formation. U.S. Patent Office 3482636, patented on 9 Dec 1969.
Curtis JB. Fractured shale-gas systems. AAPG Bull. 2002;86(11):
1921–38.
Curtis ME, CardottBJ SondergeldCH, et al. Development of organic
porosity in the Woodford shale with increasing thermal maturity.
Int J Coal Geol. 2012;103:26–31.
Darot M, Reuschle T. Direct assessment of Wood’s metal wettability
on quartz. Pure Appl Geophys. 1999;155(1):119–29.
DOE (Department of Energy). Modern shale gas development in the
United States: A primer. 2009.
Dullien FAL. Wood’s metal porosimetry and its relation to mercury
porosimetry. Powder Tech. 1981;29:109–16.
Dullien FAL. Porous media: fluid transport and pore structure. 2nd
ed. San Diego: Academic Press; 1992.
Dultz S, Behrens H, Simonyan A, et al. Determination of porosity and
pore connectivity in feldspars from soils of granite and saprolite.
Soil Sci. 2006;171(9):675–94.
EIA (Energy Information Administration). Annual energy outlook
2014: with projections to 2040. U.S. Department of Energy,
DOE/EIA-0383, released on May 7, 2014. Available at http://
www.eia.gov/forecasts/AEO/. Accessed 28 Jan 2015.
Epstein N. On tortuosity and the tortuosity factor in flow and diffusion
through porous media. Chem Eng Sci. 1989;44(3):777–9.
Ewing RP, Horton R. Diffusion in sparsely connected pore spaces:
temporal and spatial scaling. Water Resour Res.
2002;38(12):1285. doi:10.1029/2002WR001412.
Ewing RP, Liu CX, Hu QH. Modeling intragranular diffusion in low-
connectivity granular media. Water Resour Res.
2012;48:W03518. doi:10.1029/2011WR011407.
Gao ZY, Hu QH. Estimating permeability using median pore-throat
radius obtained from mercury intrusion porosimetry. J Geophys
Eng. 2013;10:025014. doi:10.1088/1742-2132/10/2/025014.
Gommes CJ, Bons AJ, Blacher S, et al. Practical methods for
measuring the tortuosity of porous materials from binary or gray-
tone tomographic reconstructions. AIChE J. 2009;55:2000–12.
Grieser WV, Shelley RF, Johnson BJ, et al. Data analysis of Barnett
shale completions. SPE J. 2008. doi:10.2118/100674-PA.
Guidry FK, Luffel DL, Curtis JB. Development of laboratory and
petrophysical techniques for evaluating shale reservoirs. GRI
(Gas Research Institute) Final Report GRI-95/0496, 1996.
Guo TL. Evaluation of highly thermally mature shale-gas reservoirs
in complex structural parts of the Sichuan Basin. J Earth Sci.
2013;24(4):863–73.
Hager J. Steam drying of porous media. Ph.D. Thesis. Department of
Chemical Engineering, Lund University, Sweden. 1998.
Heller R, Zoback M. Laboratory measurements of matrix permeabil-
ity and slippage enhanced permeability in gas shales. Soc Pet
Eng, SPE 168856. 2013.
Hildenbrand A, Urai JL. Investigation of the morphology of pore space
in mudstones-first results. Mar Pet Geol. 2003;20(10):1185–200.
Hoffman T. Comparison of various gases for enhanced oil recovery
from shale oil reservoirs. This paper was presented for presen-
tation at the eighteenth SPE improved oil recovery symposium
held in Tulsa, OK, pp. 14–18, SPE 154329. 2012.
Hu QH, Wang JSY. Aqueous-phase diffusion in unsaturated geolog-
ical media: a review. Crit Rev Environ Sci Technol.
2003;33(3):275–97.
Hu QH, Mao XL. Applications of laser ablation-inductively coupled
plasma-mass spectrometry in studying chemical diffusion,
sorption, and transport in natural rock. Geochem J.
2012;46(5):459–75.
Hu QH, Ewing RP. Comment on ‘‘Energy: a reality check on the
shale revolution’’ (Hughes, J.D., Nature, Vol. 494, p. 307–308.
doi:10.1038/494307a. http://www.nature.com/nature/journal/
v494/n7437/full/494307a.html. Accessed 21 Feb 2013.
Hu QH, Ewing RP. Integrated experimental and modeling approaches
to studying the fracture-matrix interaction in gas recovery from
Barnett Shale. Final Report, Research Partnership to Secure
Energy for America (RPSEA), National Energy Technology
Laboratory, Department of Energy. 2014.
Hu QH, Persoff P, Wang JSY. Laboratory measurement of water
imbibition into low-permeability welded tuff. J Hydrol.
2001;242(1–2):64–78.
Hu QH, Ewing RP, Dultz S. Pore connectivity in natural rock.
J Contam Hydrol. 2012;133:76–83.
Hu QH, Kneafsey TJ, Wang JSY, et al. Characterizing unsaturated
diffusion in porous tuff gravels. Vadose Zone J.
2004;3(4):1425–38.
Hughes JD. Drill, Baby, Drill: can unconventional fuels usher in a
new era of energy abundance? Post Carbon Institute. 2013a.
Hughes JD. Energy: a reality check on the shale revolution. Nature.
2013;494:307–8.
Hunt AG, Ewing RP, Ghanbarian B. Percolation theory for flow in
porous media. 3rd ed., Lecture notes in physicsHeidelberg:
Springer; 2014. p. 880.
662 Pet. Sci. (2015) 12:651–663
123

Jarvie DM. Shale resource systems for oil and gas: part 1—shale-gas
resource systems. In: Breyer JA, editor, Shale reservoirs—giant
resources for the 21st century. AAPG Memoir; 2012, 97: 69–87.
Javadpour F, Fisher D, Unsworth M. Nanoscale gas flow in shale gas
sediments. J Can Pet Technol. 2007;46(10):55–61.
Katz AJ, Thompson AH. A quantitative prediction of permeability in
porous rock. Phys Rev B. 1986;34:8179–81.
Katz AJ, Thompson AH. Prediction of rock electrical conductivity
from mercury injection measurements. J Geophys Res.
1987;92(B1):599–607.
Kaufmann J. Pore space analysis of cement-based materials by
combined nitrogen sorption: Wood’s metal impregnation and
multi-cycle mercury intrusion. Cement Concr Compos.
2010;32(7):514–22.
King GE. Hydraulic fracturing 101. SPE 152596. 2012.
Liu SG, Ma WX, Luba J, et al. Characteristics of the shale gas
reservoir rocks in the Lower Silurian Longmaxi Formation, east
Sichuan Basin, China. Acta Petrol Sin. 2011;27(8):2239–52 (in
Chinese).
Loucks RG, Reed RM, Ruppel SC, Jarvie DM. Morphology, genesis,
and distribution of nanometer-scale pores in siliceous mudstones
of the Mississippian Barnett Shale. J Sediment Res.
2009;79(11–12):848–61.
Loucks RG, Ruppel SC. Mississippian Barnett Shale: lithofacies and
depositional setting of a deep-water shale-gas succession in the
Fort Worth Basin, Texas. AAPG Bull. 2007;91(4):579–601.
Luffel DL, Hopkins CW, Schettler PD. Matrix permeability mea-
surement of gas productive shales. SPE 26633. 1993.
Nelson PH. Pore-throat sizes in sandstone, tight sandstone, and shale.
AAPG Bull. 2009;93(3):329–40.
Nicot J-P, Scanlon BR, Reedy RC, Costley RA. Source and fate of
hydraulic fracturing water in the Barnett shale: a historical
perspective. Environ Sci Technol. 2014;48(4):2464–71.
Peng S, Hu QH, Ewing RP, et al. Quantitative 3-D elemental mapping
by LA-ICP-MS of basalt from the Hanford 300 area. Environ Sci
Tech. 2012;46:2035–42.
Schembre JM, Kovscek AR. Estimation of dynamic relative perme-
ability and capillary pressure from countercurrent imbibition
experiments. Transp Porous Media. 2006;65:31–51.
Slatt RM, O’Brien NR. Pore types in the Barnett and Woodford gas
shales: contribution to understanding gas storage and migration
pathways in fine-grained rocks. AAPG Bull. 2011;95(12):2017–30.
Slatt RM, O’Brien NR, Miceli R, et al. Eagle Ford condensed section
and its oil and gas storage and flow potential. AAPG Annual
Convention and Exhibition, Long Beach, California, 22–25 April
2012. Search and Discovery Article #80245. 2012.
Slatt RM, O’Brien NR, Molinares-Blanco C et al. Pores, spores,
pollen and pellets: small, but significant constituents of resources
shales. SPE 168697/URTeC 1573336. 2013.
Stauffer D, Aharony A. Introduction to percolation theory. 2nd ed.
London: Taylor and Francis; 1994.
Sun W, Liu SG, Ran B, et al. General situation and prospect
evaluation of the shale gas in the Niutitang Formation of Sichuan
Basin and its surrounding area. J Chengdu Univ Technol
(Science and Technology Edition). 2011;39(2):170–75 (in
Chinese).
Swanson BF. Visualizing pores and nonwetting phase in porous rock.
J Petrol Technol. 1979;31:10–8.
Washburn EW. Note on a method of determining the distribution of
pore sizes in a porous materials. Proc Natl Acad Sci USA.
1921;7:115–6.
Webb PA. An introduction to the physical characterization of
materials by mercury intrusion porosimetry with emphasis on
reduction and presentation of experimental data. Micromeritics
Instrument Corporation. 2001.
Xie GW, Zhou CM, McFadden KA, et al. Microfossils discovered
from the Sinian Doushantuo Formation in the Jiulongwan
section, East Yangtze Gorges area, Hubei Province, South
China. Acta Palaeontologica Sinica. 2008;47(3):279–91 (in
Chinese).
Zou CN, Tao SZ, Yang Z, et al. Development of petroleum geology in
China: discussion on continuous petroleum accumulation.
J Earth Sci. 2013;24(4):796–803.
Pet. Sci. (2015) 12:651–663 663
123