porphyry indicator minerals (pims) and vectoring and...
TRANSCRIPT

Porphyry indicator minerals (PIMS) and porphyry vectoring and fertility tools (PVFTS)
Pete Hollings, David R Cooke, Paul Agnew, Michael Baker, Zhaoshan Chang, Jamie J. Wilkinson, Noel C. White, Lejun Zhang, Jennifer Thompson,
Ayesha Ahmed, J. Bruce Gemmell, Nathan Fox, Huayong Chen, Clara Wilkinson
– Indicators of mineralization styles and recorders of hypogene geochemical dispersion halos
Epidote – albite alteration in McLeod Hill quartz monzodiorite,
Yerington, Nevada

Porphyry ore deposit geologyPorphyry ore deposit geology
1 km
3 km3 = 9 billion tonnes of ore65 million tonnes of Cu
>110 million tonnes of S
Chuquicamata, Eocene-Oligocene porphyry belt, Northern Chile (Courtesy of CODELCO)Chuquicamata, Eocene-Oligocene porphyry belt, Northern Chile (Courtesy of CODELCO)
Giant geochemical anomaliesGiant geochemical anomalies

After Holliday and Cooke (2007); Cooke et al. (2014, 2017)
Porphyry districts
• Hydrous, multi‐phase, oxidised intrusive complex
• Peripheral styles of mineralisation (epithermal, skarn)
• Huge 3D volumes of hydrothermal alteration
• Distinctive alteration and magmatic mineral chemistry

Definitions
Porphyry indicator minerals (PIMS): • Minerals that can be used to potentially help to identify the presence of, or potential for, porphyry
and other styles of mineralisation (fingerprints)
Cerro Casale district, ChileCerro Casale district, Chile
Porphyry vectoring and fertility tools (PVFTS): • Minerals that can be used to predict the likely direction
and distance to mineralized centres, and the potential metal endowment of a district (footprints)

Enabling technologiesUnlocking the exploration potential of mineral chemistry
LA‐ICP‐MS• Method for rapid acquisition of multi‐element mineral chemistry data
• Significantly lower detection limits than electron microprobe and other techniques
• New developments in automated data reduction and quality control are about to facilitate more efficient and consistent data processing
SWIR• Rapid, reliable clay mineral identification technique
• Revolutionized alteration mapping in lithocaps and high sulfidation epithermal environments

Porphyry indicator minerals (PIMS)Geochemical fingerprints of porphyry deposits
• PIMS have distinctive trace element compositions• Distinct from local country rocks (e.g., zircon) • Distinctive of particular mineralization styles
and/or alteration zones (e.g., magnetite)
• Ideally, PIMS should be resistate, so that they can be preserved in stream sediments, till, etc.
• Zircon, magnetite, apatite, tourmaline, garnet, epidote, pyrite, andradite, gold
• Some PIMS require bedrock sampling to be used in exploration
• Plagioclase, (chlorite)
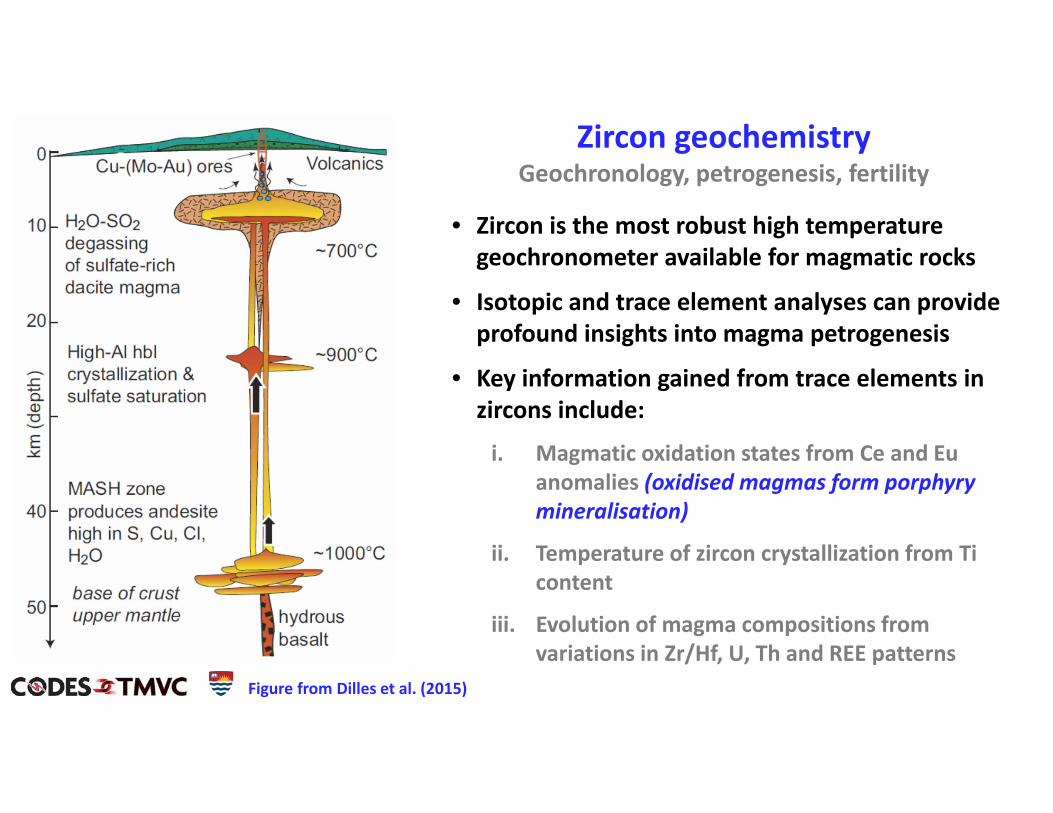
Zircon geochemistryGeochronology, petrogenesis, fertility
• Zircon is the most robust high temperature geochronometer available for magmatic rocks
• Isotopic and trace element analyses can provide profound insights into magma petrogenesis
• Key information gained from trace elements in zircons include:
i. Magmatic oxidation states from Ce and Euanomalies (oxidised magmas form porphyry mineralisation)
ii. Temperature of zircon crystallization from Ti content
iii. Evolution of magma compositions from variations in Zr/Hf, U, Th and REE patterns
Figure from Dilles et al. (2015)

• Larger Paleozoic porphyry deposits of the Central Asian orogenic belt have zircons with high Ce4+/Ce3+ (Shen et al., 2015)
1
Batu Hijau porphyry Cu‐AuTampakan porphyry Cu‐AuDexing porphyry Cu‐Mo‐AuJiama porphyry skarn Cu‐Mo‐AuSar Chesmeh porphyry Cu‐Mo‐Au
Nannihu porphyry Mo‐WYuchiling porphyry MoSungun porphyry Cu‐MoQulong porphyry Cu‐Mo
Fertile BarrenYellowstone rhyoliteBandelier rhyoliteHawkin S‐type daciteKadoona (‐type daciteBishop TuffLucerne reduced granite
Lu et al. (2016)
Fertile
Barren
(Ce/Nd)/Y
10000*(Eu/Eu
*)/Y
100
10
1
0.1
0.010.01 0.10.0010.0001
(Water con
tent)
(Oxidation state of magma)
Degree of hornblende fractionation
Zircon – A porphyry indicator mineralMagmatic oxidation state, water content, degree of fractionation
• Barren Paleozoic granitoids in the Lachlan Fold belt, Australia, have low Ce4+/Ce3+ ratios (Belousova et al., 2006)
Shen et al. (2015)
Ce4+/Ce3
+
Cu (Mt)
300
250
150
100
0
200
50
0 2 4 6 8 10 12 14

Zircon Eu/Eu* and Ce4+/Ce3+ anomalies – a product of titanite fractionation? (Loader et al., 2017)
• Loader et al. (2017) showed that small amounts of titanitecrystallisation can produce zircon Eu/Eu* and Ce4+/Ce3+ anomalies
• Titanite fractionation will deplete REE from the melt
• MREE are more depleted than LREE or HREE during this process
• Sm and Gd more depleted than Eu
• This process could produce false positives for porphyry explorers applying zircon as a PIM in regional exploration
0,1
1
10
100
1000
La Ce Pr Nd Pm Sm Eu Gd Tb Dy Ho Er Tm Yb Lu
mel
t/cho
ndrit
e
% titanite crystallisation
Loader et al. (2017)

Hornblende geochemistry – petrogenesis and fertility
• high Si, low Al, Ca and alkalis group in intermediate‐felsic rocks ‐shallow crystallization
• high alkali, Al and Ca, low Si group in intermediate‐mafic rocks ‐ crystallising at deeper crustal levels.
Hollings et al. (2013)
Cao et al. (2018)
• Zoning suggests mixing of the two magmas
• Presence of both groups in a single sample indicates interaction and phenocryst exchange between the two parental magmas

Porphyry indicator minerals – Plagioclase (Williamson et al. 2016)
Cu in plagioclase (ppm)
Sr/Y in plagioclase
Excess Al
Anorthite %
An % Excess Al
Cu (ppm)Sr/Y
Excess AlAn %
Position along the LA‐ICP‐MS point traverseA B
A
B
A
B
Williamson et al. (2016)
• Plagioclase from fertile porphyry systems contains ‘excess’ Al related to high melt water contents
• It may record injections of hydrous fluid or fluid‐rich melts into the sub‐porphyry magma chamber
• Excess Al may exclude copper from plagioclase, enriching the remaining melts in Cu

Porphyry indicator minerals – Magnetite
• Magnetite is resistive and easily separated, making it an attractive PIM candidate
• Two decades of research have shown that major and trace element ratios can effectively discriminate magmatic and hydrothermal magnetite from a diversity of ore deposit types
• Fine exsolution lamellae can affect magnetite LA‐ICP‐MS analyses• Magnetite is prone to diffusional resetting by post‐crystallization
hydrothermal fluids – care must be taken in data interpretation
Al/Ti
0.01
10
1.0
0.1
100
0.001 0.01 0.1 1.0 10 100
MagmaticHydrothermal
V/Ti
Cross (2000)
Dare et al. (2014)
Ilmenite exsolution lamellae in magnetite, Grasberg50 µm
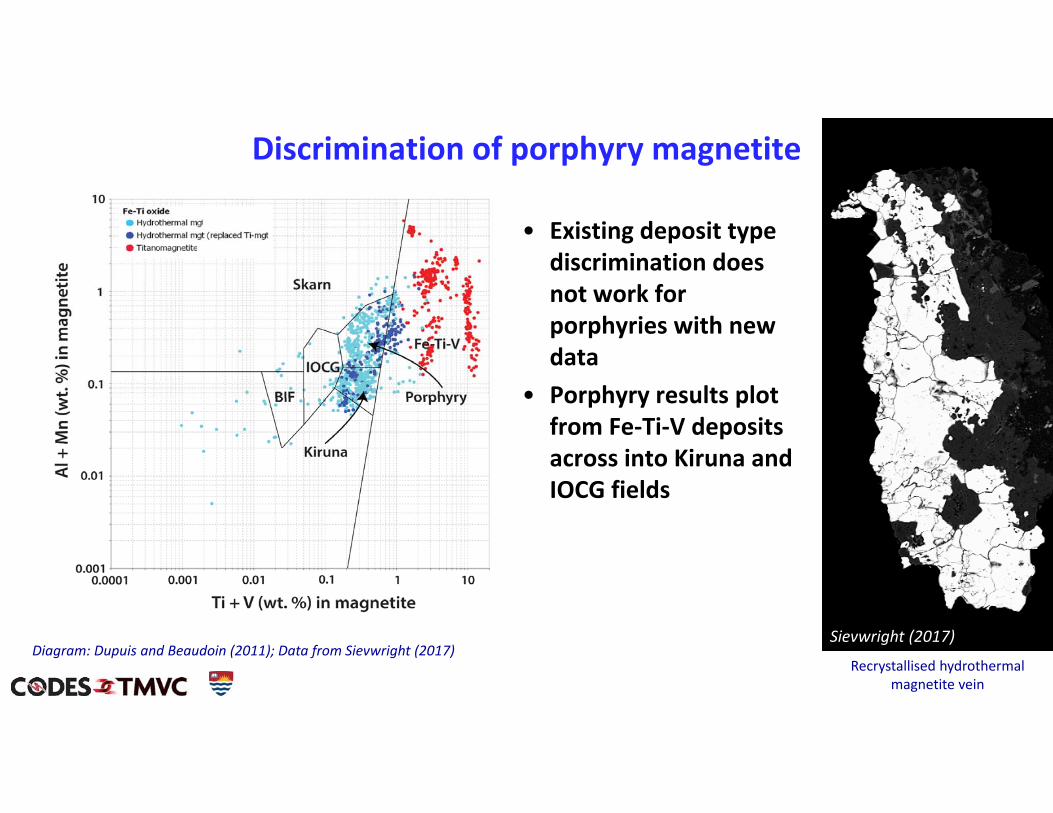
Discrimination of porphyry magnetite
• Existing deposit type discrimination does not work for porphyries with new data
• Porphyry results plot from Fe‐Ti‐V deposits across into Kiruna and IOCG fields
Diagram: Dupuis and Beaudoin (2011); Data from Sievwright (2017)Recrystallised hydrothermal
magnetite vein
Sievwright (2017)

Magnetite alteration association
• Hydrothermal magnetite derived from different porphyry alteration domains can be discriminated
• DP1 is mainly controlled by Co+ Mg‐ and Al‐• DP2 is mainly controlled by V+ Co‐ and Mg‐
Colour
Weak Propylitic
Unaltered
Propylitic
Potassic-Propylitic
Potassic-Phyllic
Potassic
Phyllic
Argillic-intermediateAlteration
Sievwright (2017) Magnetite in chalcopyrite

Porphyry indicator minerals – Apatite
• Apatite chemistry and luminescence discriminates magmatic and hydrothermal apatites from different porphyry alteration zones (Bouzari et al., 2016; Loader, 2017)
Bouzari et al. (2016)
Bouzari et al. (2016)

Discrimination of porphyry‐related apatite
DP2‐3‐1 = 1.034⋅logMg – 3.069⋅logMn + 4.045⋅logY + 3.368⋅logCe –3.127⋅logEu – 0.2322⋅logDy – 0.7732⋅logYb –0.1035⋅logPb –1.228⋅logTh – 0.2231⋅logU – 4.263DP2‐3‐2 = 1.888⋅logMg – 1.839⋅logMn – 4.813⋅logY – 0.3218⋅logCe– 3.421⋅logEu+ 10.67⋅logDy – 5.662⋅logYb + 1.706⋅logPb –1.043⋅logTh + 1.803⋅logU + 14.24
Mao et al. (2016)
• Discriminant projection analyses can distinguish apatite from magmatic and a variety of hydrothermal environments, including porphyries (Mao et al., 2016)
• Porphyry apatite • Low Mg, Dy, Pb, U • High Mn, Y, Ce, Eu, Yb, Th

Igneous apatite potential
• Redox sensitivity of apatite chemistry (Mn & V)• No fertility discrimination but broad separation of porphyry types• Does not take into account complex apatite paragenesis
AlkalicCu-Au
OxidisedCu-Mo(-Au)
Low fO2Cu-Mo/Au
Rukhlov et al. (2017)
Miles et al. (2012)
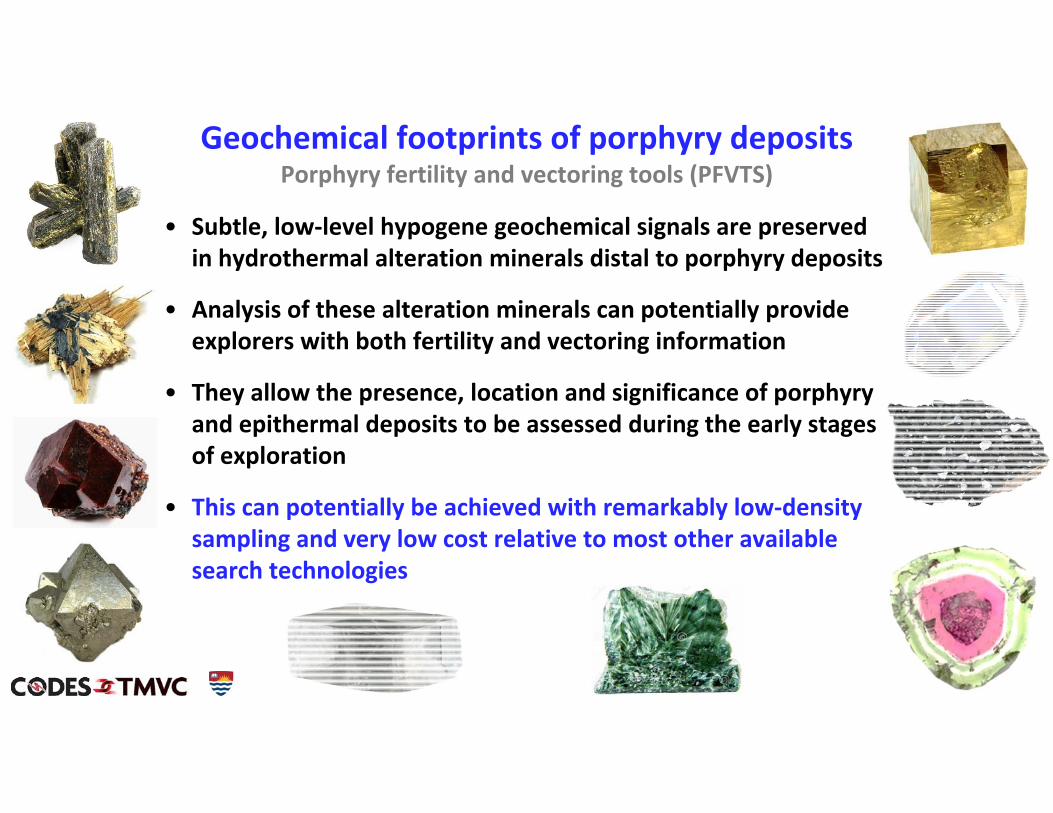
Geochemical footprints of porphyry depositsPorphyry fertility and vectoring tools (PFVTS)
• Subtle, low‐level hypogene geochemical signals are preserved in hydrothermal alteration minerals distal to porphyry deposits
• Analysis of these alteration minerals can potentially provide explorers with both fertility and vectoring information
• They allow the presence, location and significance of porphyry and epithermal deposits to be assessed during the early stages of exploration
• This can potentially be achieved with remarkably low‐density sampling and very low cost relative to most other available search technologies

Propylitic alteration: a distal indicator of porphyry Cu deposits
2-6km
Slide courtesy of Paul Agnew
Modified after Holliday and Cooke (2007)
2-6 km
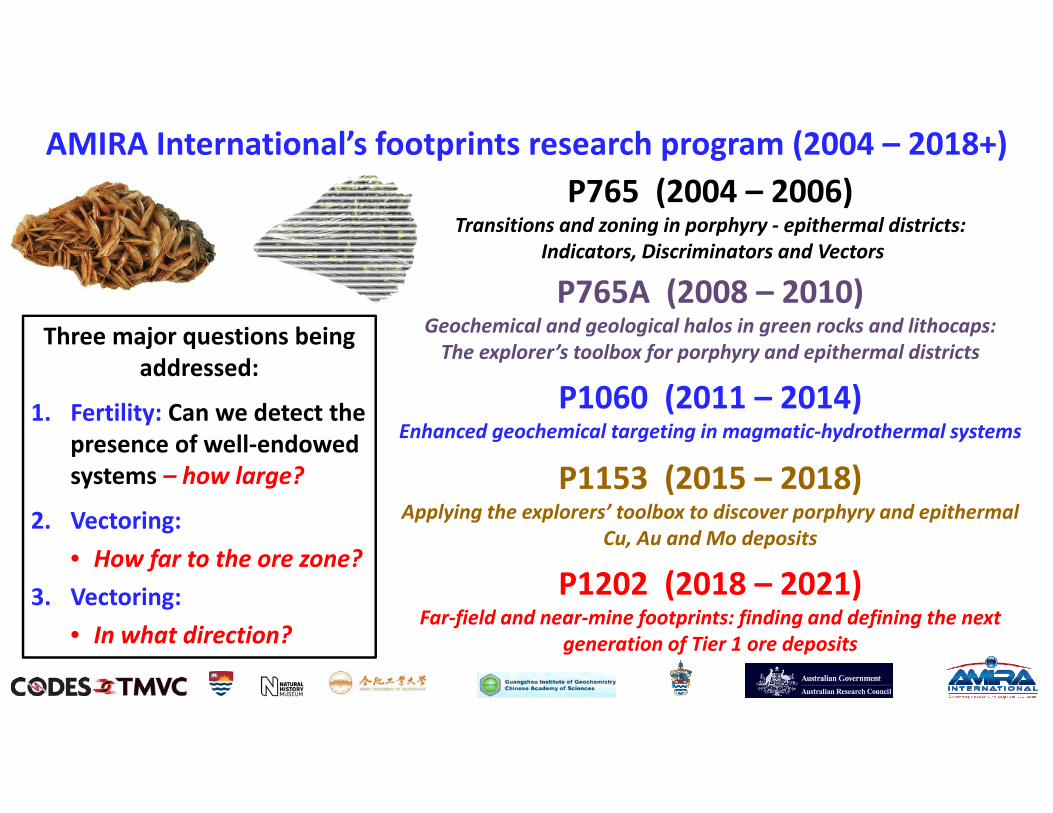
AMIRA International’s footprints research program (2004 – 2018+)P765 (2004 – 2006)
Transitions and zoning in porphyry ‐ epithermal districts:Indicators, Discriminators and Vectors
P765A (2008 – 2010)Geochemical and geological halos in green rocks and lithocaps:The explorer’s toolbox for porphyry and epithermal districts
P1060 (2011 – 2014)Enhanced geochemical targeting in magmatic‐hydrothermal systems
P1153 (2015 – 2018)Applying the explorers’ toolbox to discover porphyry and epithermal
Cu, Au and Mo deposits
Three major questions being addressed:
1. Fertility: Can we detect the presence of well‐endowed systems – how large?
2. Vectoring: • How far to the ore zone?
3. Vectoring: • In what direction?
P1202 (2018 – 2021)Far‐field and near‐mine footprints: finding and defining the next
generation of Tier 1 ore deposits

Porphyry footprints – Arsenic in epidoteFertility indicator – Baguio district, Philippines (Cooke et al., 2014)
0
40
80
120
160
200
0 500 1,000 1,500 2,000 2,500 3,000 3,500 4,000Distance (m)
As (p
pm)
B'A CPyrite halo
Green rocks
Green rocks
Pyrite halo
Potassic zo
nePotassic zo
ne
Pyrite ha
lo
Pyrite ha
loreplacement epidote vein epidote skarn epidote whole rock
Mexico skarn prospectGeochemical anomaly
Black MtSmall porphyry Cu‐Au
Nugget HillLarge porphyry Cu‐Au
A
B
B’
C

Size of symbols proportional to ppm; Maximum symbol size = 84 ppm
No Sr depletion
1000 mBase map modified from Garwin (2000)
Sr in chlorite (sample mean values)
0.1
1.0
10.0
100.0
1000.0
10000.0
500 1500 2500 3500 4500 5500
W traverseSW traverse (original)SW traverse 2010
Bambu
2009 traverse north
2009 traverse southWhole rock
Ti/Sr
Porphyry footprints – Ti/Sr in chloriteVectoring tool – Batu Hijau, Indonesia (Wilkinson et al., 2015)
• Chlorite trace element ratios provide vectors to the mineralized centre of Batu Hijauwithin 2.5 km (potentially up to 5 km for some trace elements) • Trace element substitution into the chlorite crystal
lattice is strongly controlled by temperature
Distance to centre (m)Distance = ln {[Ti/Sr]/3x10‐6 } ‐0.0088Batu HijauBatu Hijau

Green rock vectoring – Example from Resolution, Arizona, USA
• Provided as green rock blind test site to P765A by Rio Tinto
• Porphyry Cu‐Mo deposit with total inferred resource of 1.624 Gt at 1.47% Cu and 0.037% Mo
Data from Resolution Copper and Rio Tinto websiteshttp://www.resolutioncopper.com; http://www.riotinto.com

Reproduced from Hehnke et al. (2012)

Rio Tinto blind site – plan viewRio Tinto blind site – plan view10036354 10036354
10036353 10036353 10036355 10036355
10036356 10036356 100363571003635710036358 10036358 1003635910036359
10036360100363601003636110036361
1003636210036362
10036363100363631003636410036364
2 km
500 m
N
S
Projectio
n on
to N‐S cross‐sectio
n

Pseudo‐cross‐section: view westPseudo‐cross‐section: view west
10036354 10036354
10036353 10036353
10036355 10036355 10036356 10036356 1003635710036357
10036358 10036358 1003635910036359
1003636010036360
1003636110036361
10036362100363621003636310036363
1003636410036364
2 km
SouthSouth NorthNorth

Distances calculated using Batu Hijau Ti/Sr proximitor
Northing
Elevation (m
)
300
‐300
0
4682500 4683000 4683500 4684000
Northing 4683375Elevation ‐1000m
‐600
‐900
S‐N cross‐section;colours are Ti/Sr bins
X = ln [ Ti / 97988 Sr]
‐0.0059
Green Rock Tools – Validation from Blind Sites
AB

Rio Tinto’s ResponseA B
Resolution Porphyry Cu‐Mo Deposit
Resolution, Arizona Excellent results from 12 samples on a 2 km‐long
section that passed through the deposit

Porphyry footprints – combining epidote and chloriteTaldy Bulak, Kyrgyzstan
0 250 500 km
Southern Tien Shan Paleozoic Fold BeltNorthern and middle Tien Shan Paleozoic Arc
Major orogenic gold deposits
Porphyry Copper
Russia
China
Kazakhstan
Tajikistan
Uzbekistan
KyrgyzstanChina
Daugystau6 Moz
Muruntau > 110 Moz.
Zarmitan6 Moz
Jilau 3 Moz
Kumtor (10 Moz)
Oyu Tolgoi(50 Moz)
Kharmagtai(> 5 Moz)
Tashkent
BishkekAlmaty
Beijing
Ulaanbatar
Almalyk (>2 GT @ 0.4% Cu 0.4g/t Au; 80 Moz Au)
Tuwu
Taldy Bulak Mongolia
After image from Ivanhoe Mines Website, 2003
A blind test site provided to AMIRA P765A by Andrew Wurst (Gold Fields)

!
!
!!!
!
!
!!
!
!
! !
!!
!
!!
!!
!
!(!
!
!
!
!
!
!!
!!
!
!!
!
!
!
!
!
!!
!!!
!
!
!
!
!!
!(!
!!!
!!
!(!!
!(!
!!
!
! !!(!(!!!!
!!
!!!
! !( !(
!!
!!
Andash Au‐CuSkarns and Porphyry
Taldybulak Au‐Cu Porphyry
TokhtonasaiAu‐Cu Skarns
!
!
!!!
!
!
!!
!
!
! !
!!
!
!!
!!
!
!(!
!
!
!
!
!
!!
!!
!
!!
!
!
!
!
!
!!
!!!
!
!
!
!!!
!(!
!!!
!!
!(!!
!(!
!!
!
! !!(!(!!!!
!!
!!!
! !( !(
!!
!!
Andash Au‐Cuskarns and Porphyry
Taldy BulakAu‐Cu porphyry
TokhtonasaiAu‐Cu skarns
Taldy Bulak, KyrgyzstanVectoring tools – combining epidote and chlorite data
! ! !!
!!
!
!
!!
!!
!
!!
!!!! !
!!!!!!
!
!!
!
!
!
!
!!
!!! !
!! !
!!!!! !
!!!!!!
!!
!(!!!!!!!
!!!
!! !
!
!! !
!
!
!
Barkol Au‐CuProspect
N
YoungerDevonianCover
! ! !!
!!
!
!
!!
!!
!
!!
!!!! !
!!!!!!
!
!!
!
!
!
!
!!
!!! !
!! !
!!!!! !
!!!!!!
!!
!(!!!!!!!
!!!
!! !
!
!! !
!
!
!
Barkol Au‐Cuprospect
10 km
YoungerDevonianCover
Ordovician ArcHost Rocks
Ordovician ArcHost Rocks
250 m
DevonianCover
Au‐Cu Porphyry
Ordovician archost rocks
Model Mt Au (g/t) Cu (%) Au (Moz) Cu (Mlb)May 08 (indicated) 79 0.63 0.17 1.61 301May 08 (inferred) 163 0.58 0.14 3.03 492
A blind test site provided to AMIRA P765A by Andrew Wurst (Gold Fields)
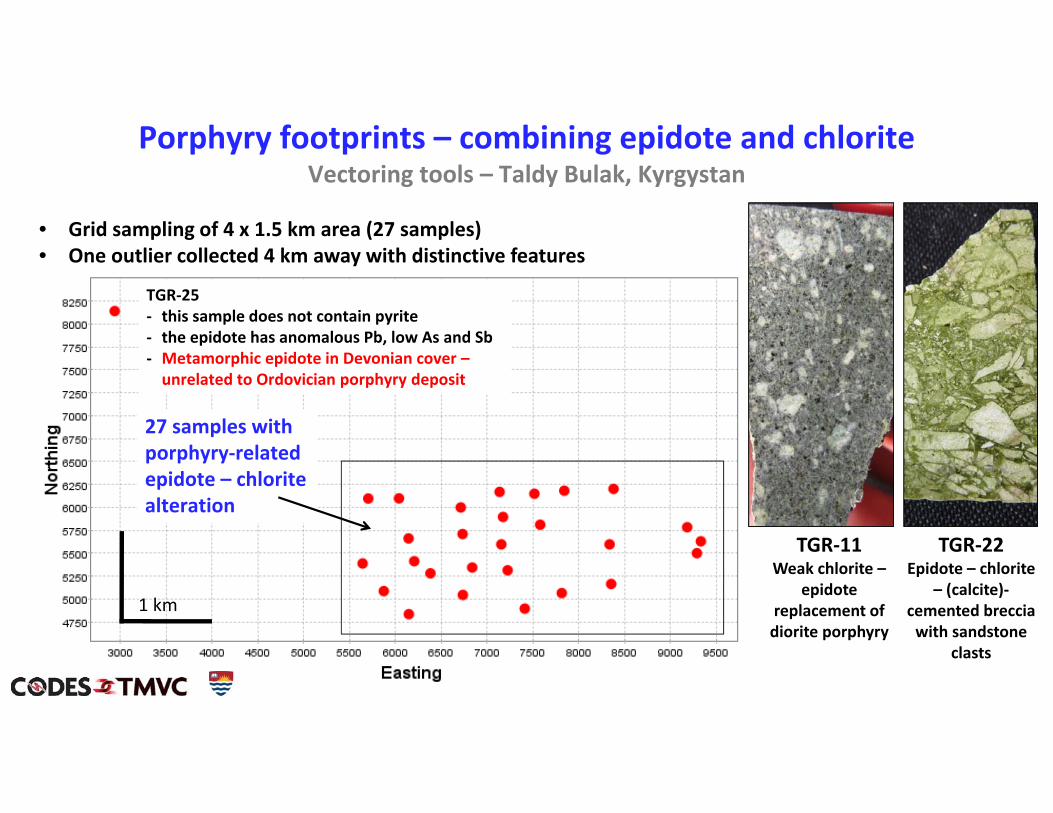
Porphyry footprints – combining epidote and chloriteVectoring tools – Taldy Bulak, Kyrgystan
• Grid sampling of 4 x 1.5 km area (27 samples)• One outlier collected 4 km away with distinctive features
TGR‐25‐ this sample does not contain pyrite‐ the epidote has anomalous Pb, low As and Sb‐ Metamorphic epidote in Devonian cover –unrelated to Ordovician porphyry deposit
1 km
27 samples with porphyry‐related epidote – chlorite alteration
TGR‐11Weak chlorite –
epidotereplacement of diorite porphyry
TGR‐22Epidote – chlorite
– (calcite)‐cemented breccia with sandstone
clasts

Porphyry footprints – combining epidote and chloriteVectoring tools – Taldy Bulak, Kyrgystan
7
11
Epidote
Chlorite
2D‐grid sampling allowed for contouring of results
200 m
Taldy Bulak, Kyrgyzstan Contouring of epidote and
chlorite LA‐ICPMS data
EpidoteEpidote ChloriteChlorite
500 m500 m
No epidote or chlorite
600 pm Cu in soil anomaly

Cathedral Peak lithocap, Cerro Casale, ChileCathedral Peak lithocap, Cerro Casale, Chile
Porphyry vectoring and fertility tools – LithocapsSWIR, whole rock and mineral geochemistry

Lithocap exploration – alunite SWIR peak shifts
Higher Na/(Na+K) ratio indicates higher formation temperature (Stoffregen and Cygan, 1990)
Wavelength position of the alunite absorption feature at 1480 nm – Chang et al. (2011)
• In the Mankayan lithocap, alunite absorption peak at ~1480 nm shifts to higher position closer to intrusive centre
Mankayan lithocapPhilippines Wavelength position (nm)

Lithocap exploration – whole rock geochemistry data (filtered)
• In the Mankayan lithocap, quartz‐alunite‐altered rocks show spatial variations in Sr/Pb ratios that vector towards the FSE porphyry deposits
Only plotting alunite‐bearing samples with < 0.1% Cu, Au < 0.1 ppm Au – Chang et al. (2011)Also La/Pb increases; Hg, Ag, Ag/Au, Te, As/Zn decrease
~ 4,000 ppm Pb
Pb Pb Sr
Alunite crystals – PIXE imagesSamples distal to FSE Proximal
~ 7,000 ppm Pb ~ 950 ppm SrMankayan lithocapPhilippines

Epidote crystals – image source: http:// www. gemselect.com/other‐info/ epidote‐unakite.php
Conclusions• There are several magmatic and hydrothermal minerals that show considerable potential as PIMS and/or PVFTS
• Access to LA‐ICP‐MS technology is mostly through university laboratories – this needs to change for widespread uptake
• Contribution to a major porphyry discovery would help to validate these approaches and to facilitate their widespread acceptance as geochemical exploration techniques
• We predict that some of these are likely to become routine tools used by explorers over the next decade
• New and emerging technologies need to be embraced by industry if geochemistry is to maintain a critical role in the discovery of new resources over the next decade