port dock 5 conceptual alternatives … dock 5 conceptual...city-owned boardwalk at the shore side...
TRANSCRIPT
OBEC Consulting Engineers
Corporate Office: 920 Country Club Road, Suite 100B
Eugene, Oregon 97401 541.683.6090
PORT DOCK 5 CONCEPTUAL ALTERNATIVES ANALYSIS SUMMARY REPORT For the
Port Dock 5 Pier Approach – Structural Renovation Design Project Newport, Oregon
October 11, 2016
TABLE OF CONTENTS Page No.
Executive Summary ............................................................................................................................. 1 Introduction ........................................................................................................................................... 1 Project Goals ........................................................................................................................................ 2 Design Criteria ..................................................................................................................................... 4 Conceptual Alternatives ..................................................................................................................... 4 Evaluation of Alternatives .................................................................................................................. 9 Miscellaneous Items ............................................................................................................................. 9 Conclusions and Recommendations ................................................................................................ 10 FIGURES Figure No. Alternative 1 - Plan ........................................................................................................................... 1a Alternative 1 - Section ...................................................................................................................... 1b Alternative 2 - Plan ........................................................................................................................... 2a Alternative 2 - Section ...................................................................................................................... 2b Alternatives 1 & 3 - Plan ................................................................................................................. 3a Alternatives 1 & 3 - Section ............................................................................................................ 3b Traffic Circulation Plan ..................................................................................................................... 4a Traffic Circulation Section ................................................................................................................ 4b TABLES Table 1: Alternative 1 Cost Estimate Table 2: Alternative 2 Cost Estimate Table 3: Alternative 1+3 Cost Estimate Table 4: Alternative 2+3 Cost Estimate Table 5a: Professional Services Estimate – Alternative 1 Table 5b: Professional Services Estimate – Alternative 2 Table 5c: Professional Services Estimate – Alternative 1+3 Table 5d: Professional Services Estimate – Alternative 2+3 Table 6: Final Evaluation Table 7: Potential Funding Resources APPENDICES Appendix 1: 2011 Port Dock 5 Inspection Survey Appendix 2: Geotechnical Memorandum
Port Dock 5 Conceptual Alternatives Analysis Summary Report OBEC Job No. 860-01 Port Dock 5 Page 1 Newport, Oregon
PORT DOCK 5 CONCEPTUAL ALTERNATIVES ANALYSIS SUMMARY REPORT For the
Port Dock 5 Pier Approach – Structural Renovation Design Project Newport, Oregon
Executive Summary The Port of Newport's Port Dock 5 is in need of structural rehabilitation. OBEC Consulting Engineers (OBEC) conducted an evaluation of alternatives to implement the rehabilitation. Three alternatives were considered: 1) repairing the existing structure; 2) replacing the existing structure; and 3) replacing the structure with an enlarged and enhanced structure. The results of the OBEC's analysis led to the recommendation for implementing Alternative 2, with the following caveats. Alternative 2 meets a majority of the Port's goals and would be the most expeditious in allowing full function of the dock for the long term. Alternative 3 rated highest overall in the evaluation process. Due to the existing structural condition of the Dock 5 piles, the anticipated lengthy permitting time frame, and the significant cost of Alternative 3, the logical path to achieving Alternative 3 is to approach it in phases. If grant funding for Alternative 3 appears likely within a few years, the Port should consider implementing Alternative 1for the lowest cost in the near future and then expanding to Alternative 3. Another solution could be to approach the renovation in three phases, beginning with Alternative 1 as Phase 1, installing a new deck as detailed for Alternative 2 as Phase 2, then expanding the deck and adding piles as detailed in Alternative 3 for Phase 3. Throughout this evaluation it is assumed either Alternative 1 or Alternative 2 has been constructed prior to Alternative 3 and is incorporated into the Alternative 3 structure.
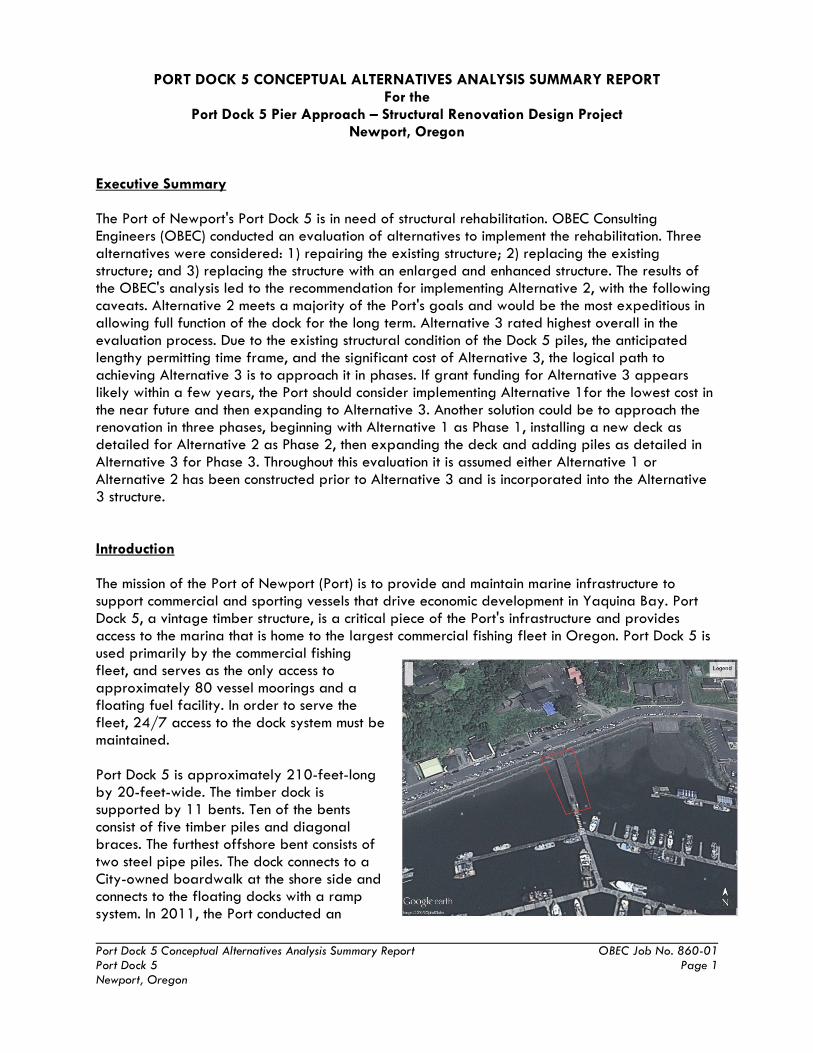
Introduction The mission of the Port of Newport (Port) is to provide and maintain marine infrastructure to support commercial and sporting vessels that drive economic development in Yaquina Bay. Port Dock 5, a vintage timber structure, is a critical piece of the Port's infrastructure and provides access to the marina that is home to the largest commercial fishing fleet in Oregon. Port Dock 5 is used primarily by the commercial fishing fleet, and serves as the only access to approximately 80 vessel moorings and a floating fuel facility. In order to serve the fleet, 24/7 access to the dock system must be maintained. Port Dock 5 is approximately 210-feet-long by 20-feet-wide. The timber dock is supported by 11 bents. Ten of the bents consist of five timber piles and diagonal braces. The furthest offshore bent consists of two steel pipe piles. The dock connects to a City-owned boardwalk at the shore side and connects to the floating docks with a ramp system. In 2011, the Port conducted an

Port Dock 5 Conceptual Alternatives Analysis Summary Report OBEC Job No. 860-01 Port Dock 5 Page 2 Newport, Oregon
internal inspection of the dock and concluded that the Port Dock 5 timber substructure, including piles and cross bracing, is in critical condition and needs to be replaced. The inspection was performed by Pete Dale, a former Port Project Manager. OBEC reviewed Mr. Dale's summary report, which is included as Appendix 1. Several contributing factors lead us to believe that the current condition of the Dock 5 timber pile support system is not serviceable, including: the extensive pile structural deterioration noted in the original report; the five years since the inspection during which the deterioration has certainly progressed; our own visual assessment of the deteriorated structural bracing system for the piles; and witness accounts of the offshore end of the dock swaying side to side when vehicular traffic drives on the dock. Repair of timber piles or bracing in this advanced state of deterioration is not practical or cost effective. In 2012, the ramp to the floating docks was replaced with a new aluminum ramp system supported by steel piles. Due to the unknown current structural capacity, vehicular traffic on the dock is currently restricted to the first 50 feet. OBEC was retained by the Port in August of 2016 to perform an alternatives analysis to identify a preferred structural rehabilitation and/or replacement strategy for Port Dock 5. On August 31st, OBEC led a kickoff workshop with key stakeholders, including dock users, Port staff, and other key community members, to help better define the problem, determine the overall project goals, communicate the design criteria, and brainstorm structural repair and replacement alternatives. Following the project kickoff workshop, OBEC completed an alternatives analysis looking at three alternatives that represented: 1) a cost- and safety-driven rehabilitation replacing only the deteriorated pile support system; 2) a complete replacement of the dock in kind; and 3) a complete replacement and improvement of the dock. This report presents our summary of the evaluation method, results, and recommendations of the alternatives analysis. Project Goals During the kickoff workshop, seven key project goals were identified: safety, function, environment, cost, maintenance, access during construction, and future expandability. Each of these goals will be used to evaluate the three design alternatives. Below is a summary of how each of these goals is addressed. A number of additional project preferences were noted during the kickoff workshop that could potentially be implemented with any of the three alternatives at additional project cost. Safety – The primary purpose of this project is to replace the deteriorated substructure of the existing dock. A successful project alternative will address long-term durability and stability issues with the existing dock, restore the full existing functionality of the dock, including vehicle access, and provide a minimum design life of at least 40 years. Function – This goal represents the dock’s ability to meet the needs of the commercial fishing fleet, such as commercial dock sales, and vehicle and pedestrian access. It also represents the dock’s ability to meet code requirements, such as fire suppression and ADA requirements. In order of priority, preferences for enhancements to be addressed include upgraded utilities (both fire suppression and electrical capacity), vehicular parking on the dock, an offshore turn-around to improve vehicular circulation, a more functional receiving and staging area at the offshore end of the dock, and a permanent bathroom facility on the dock.

Port Dock 5 Conceptual Alternatives Analysis Summary Report OBEC Job No. 860-01 Port Dock 5 Page 3 Newport, Oregon
Environmental – Each alternative was evaluated on a basis of the likely environmental and permitting challenges that must be overcome to allow construction. Evaluation will be based on cost, time, risk, and overall project feasibility. Special consideration was given to project concepts that were more likely to meet permitting requirements through self-mitigation. Cost – This goal represents the up-front capital costs required to construct each alternative. As part of this evaluation, a planning-level cost estimate was completed for the three alternatives. Understanding that grants and other external funding sources are considered a likely means of financing the project, each alternative has been evaluated based on its likelihood to qualify for federal or state funding. Maintenance – Long-term costs associated with upkeep and maintenance were assessed qualitatively for each of the alternatives. This category was evaluated based on the predicted lifespan of each alternative and what long-term maintenance needs are predicted over the desired 40-year lifespan. Additionally, each alternative’s maintenance requirements were evaluated based on the likelihood of future temporary closures to the dock as a result of deterioration or maintenance activities. Construction Access – It is imperative that the floating docks remain open 24/7 during construction and that both pedestrian access and utilities are maintained with minimal disruption. Each alternative was evaluated on the basis of keeping access open throughout construction. Each alternative was evaluated for constructability, and requirements such as: necessary temporary accesses, construction staging, and short-term dock closures (<24 hour). Future Expansion – Each of the alternatives were evaluated on their ability to incorporate future phases of construction to reach a full build out solution. The evaluation criteria for this goal includes how readily the structure can be expanded, as well as how easily the future expansion can be conducted in a manner that achieves each of the other six project goals. Additional Stakeholder Notes: The driveway and any future parking needs to accommodate large pickup trucks and
delivery vans. The dock will need to integrate with existing City of Newport facilities at the shore. The dock should maintain an industrial/commercial feel to best serve the fishing community
and minimize tourist loitering. Restricting access with gates is not considered a benefit. Providing a hoist is not considered a benefit. An evaluation of the best option for extending the lifespan of the piles (galvanizing vs.
coated vs. cathodic protection), is separate from the alternatives evaluation. Current landing area for the ramp is structurally and functionally obsolete; consideration
should be made for replacement in the future. This will not be considered in the alternatives evaluation.
At this time, no viable alternate permanent access to the dock could be identified. Tsunami loading will not be considered in the evaluation.
Port Dock 5 Conceptual Alternatives Analysis Summary Report OBEC Job No. 860-01 Port Dock 5 Page 4 Newport, Oregon
Design Criteria The following criteria were used for the analytical and objective concept evaluations: 2015 IBC with Oregon Amendments
o Basic Wind Speed, 3 sec gust = 115 MPH o Wind Exposure = D o Risk Category = I o Importance Factors Iw= 1, Ie= 1, Is= 1 o Seismic Site Class = D o Seismic Design Category = D, Sds = 1.14g, S1= 0.71g
Pile capacities – proposed piles are 24" dia x .500" open end pipe embedded 30 feet into the siltstone
o Allowable bearing capacity = 120 tons o Allowable uplift capacity = 47 tons
Tsunami – do not design for tsunami Live Loads:
o Vehicle loads F350 extended bed/quad cab five-ton truck, max axle load = 7,000 lbs Box Van 10-ton vehicle, max axle load = 16,000 lbs Solid tire forklift, Hyster S50CT (assumed), 5,000 lbs capacity, max axle
load = 12,000 lbs o Distributed load on deck = 50 PSF (pedestrian and minor permanent loads such
as dumpsters, totes, and portable toilets) o Ground snow load = 2 PSF
No mooring or berthing loads Design Life = 40 years (Alternatives 2 and 3 will realistically provide a structural design
life of 75 years due to modern design codes and materials) Datum used for site elevations is MLLW. Top of deck and mudline elevations are based on
measurements taken by Kent Gibson, the Port Harbormaster, on 9-8-16. Top of siltstone bedrock is assumed to be elevation -23.5 feet MLLW based on a nearby
2000 boring log, the 2012 pile driving log, and jet probe data from 1992. (See Appendix 2)
Conceptual Alternatives Three alternatives were considered for this evaluation process. Conceptual design was performed for each of the three alternatives (approximately 10 to 15% design completion). The design incorporated the above goals and design criteria. A construction cost estimate was then prepared for each alternative. The anticipated accuracy of the cost estimate and the contingency allowance is based on the Association for the Advancement of Cost Engineering (AACE) recommended practice 18R-97. Using these guidelines, and the 10 to 15% design completion level, a reasonable expectation of accuracy is +/- 30%. Structural analysis for wind, seismic, and vehicle loads was performed using RISA and L-Pile software.
Port Dock 5 Conceptual Alternatives Analysis Summary Report OBEC Job No. 860-01 Port Dock 5 Page 5 Newport, Oregon
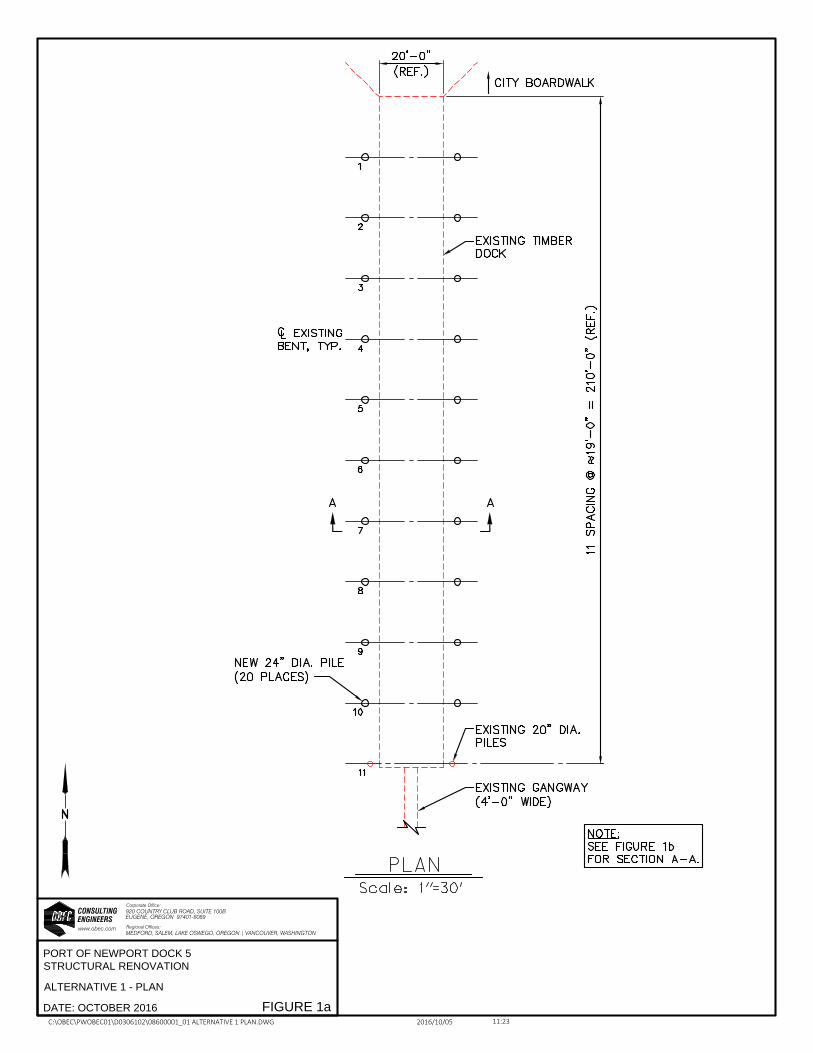
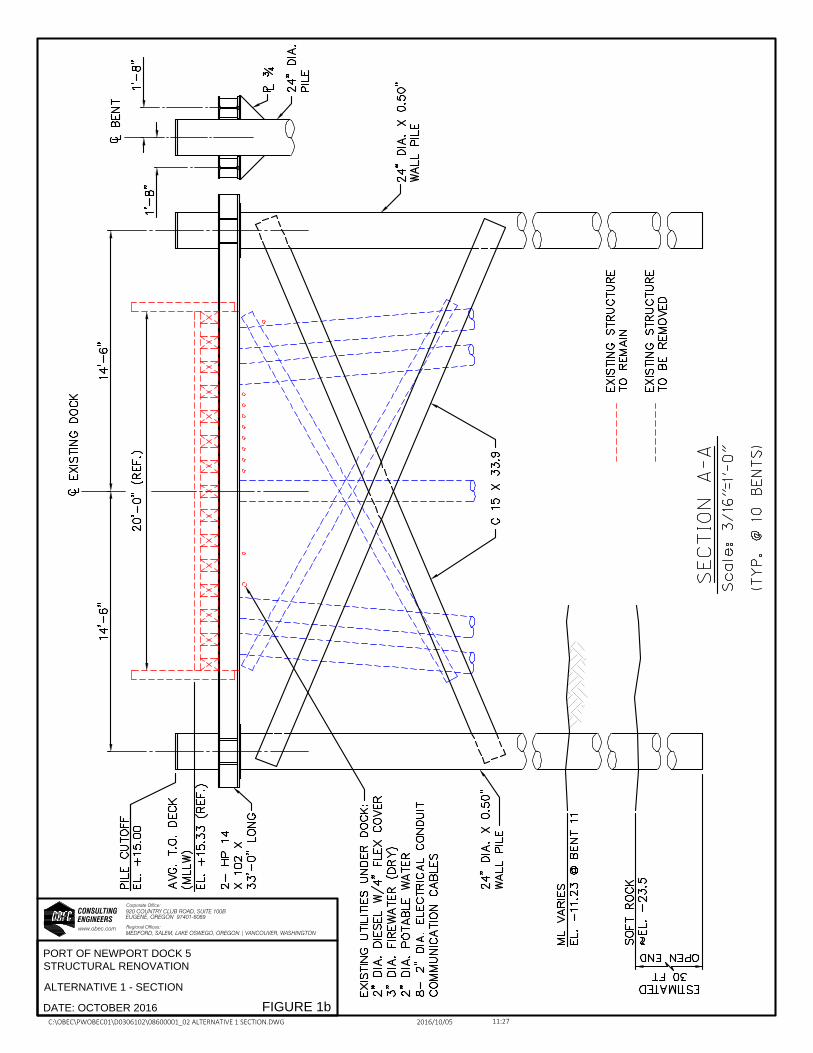
Alternative 1 – Replace Existing Substructure Summary – The concept proposes to replace each of the 10 remaining timber pile bents with two 24-inch pipe piles and a steel beam cap spanning between the piles. The footprint of the deck will remain the same. The timber deck, stringers, and railings would remain in place. Figures 1a and 1b present the plan and section of Alternative 1. The distance between new piles is dictated by the distance required to clear the embedded tips of the outside timber batter piles. Safety – OBEC understands from the Port that the existing dock timber decking and stringers have been maintained and are in serviceable condition. Our assessment of the safety goal for Alternative 1 is based on the assumption that the existing deck timber is in serviceable condition. OBEC has not conducted a condition assessment to verify the existing condition. We recommend a condition assessment including representative testing of deck and stringer timbers be performed prior to proceeding with Alternative 1. A cost for this assessment has been included in Table 5a. The proposed replacement piles and pile caps will provide structural integrity for the substructure. This alternative does not address utilities, so no safety enhancement will be realized for the utilities. Function – Alternative 1 will allow vehicle access to be re-instated on the dock to pre-closure levels. No improvement in traffic flow or structural capacity will be included. ADA access and the fire suppression system will not be addressed. None of the preferred enhancements to function would be addressed with this alternative. Environmental – The proposed 20 replacement piles will be installed outside the existing dock footprint, which will be considered an impact by the regulatory agencies. The additional area is approximately 170 SF, or a 4% increase. OBEC believes this impact will be mitigated by the removal of 50 creosote timber piles and approximately 30 creosote timber braces. This project should fall within the regulatory agencies programmatic maintenance permit. It is estimated it will take approximately one year to procure environmental permits from the time design work begins. OBEC does not believe Alternative 1 will trigger a requirement to provide stormwater treatment. However, there is a risk that NMFS will require it. The pile driving must take place within the in-water work window, which is currently November 1 through February 15th. Pile installation will require an impact hammer. Noise dampening methods, such as a bubble curtain and/or a cushion, will be employed. A marine mammal watch will be required. Cost – The cost estimate for Alternative 1 is presented in Table 1. Alternative 1 is the lowest cost alternative. Maintenance – We propose to apply a high quality, corrosion-resistant coating on the piles and caps. Over the 40 year life of the piles and caps, this coating may need to be touched up on occasion if it is damaged. The timber deck will most likely need periodic replacement of deteriorated elements, if not complete replacement, within the 40-year life of the piles. We estimate the average annual cost of replacing deteriorated timber deck elements to be $20,000. This cost is not included in the cost estimate for Alternative 1. The Port should expect maintenance costs to vary year-by-year and a maintenance plan and budget should be established for the timber deck.
Port Dock 5 Conceptual Alternatives Analysis Summary Report OBEC Job No. 860-01 Port Dock 5 Page 6 Newport, Oregon
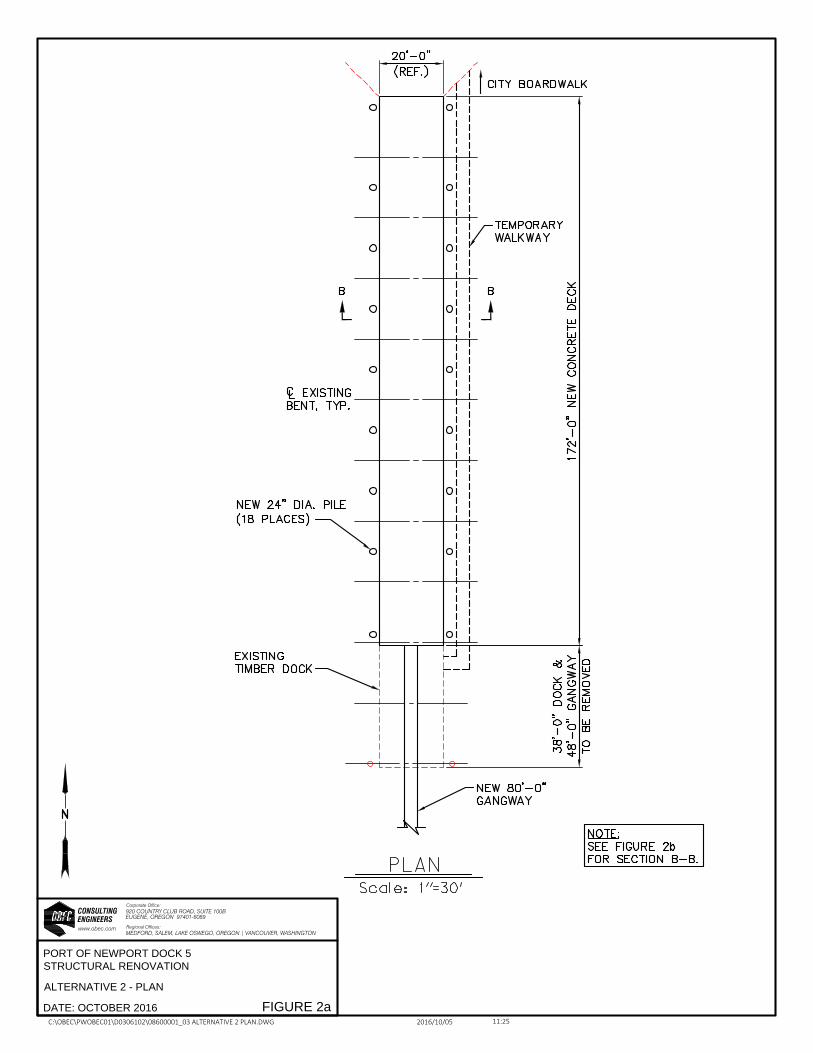
Construction Access – OBEC has spoken to two marine contractors with experience driving piles in Yaquina Bay, and at Port Dock 5 in particular, regarding contractor and pedestrian access during the pile replacement work. It is feasible to get a derrick barge adjacent to the near shore end of the dock during high tide. Looking at the predicted tide gages in November of 2017, it appears that near-shore work on the piles would be able to proceed during daylight hours three days a week for about 10 hours a day. It would not be safe to have pedestrians on the dock while pile setting and driving is taking place. Therefore, a temporary alternate access will be required. Installing a float in the existing gap between Dock 5 and Dock 3 floats is recommended to provide access when the contractor is required to block access to Dock 5. It is estimated blocking access to Dock 5 will be required for15 to 20 days, total, or two to three days a week over a six-week period between November and February. We understand the Port has floats available that could be used for the alternate access. The cost of installing the floats is included in the mobilization estimate. Future Expansion – The Alternative 1 piles and pile caps are designed to accommodate future construction of a concrete deck to replace the timber deck, upgrade utilities, and/or expand the footprint of the dock to enhance traffic flow and add parking. Therefore, Alternative 1 could form the foundation for proceeding with Alternative 2 and then Alternative 3 in the long term. No changes in the Alternative 1 design or cost estimate would be required to proceed with Alternatives 2, and eventually 3, in the future. The new Alternative 1 piles would be installed with extra height to allow raising the elevation of the deck in the future to accommodate stormwater drainage for Alternatives 2 and 3. Alternative 2 – Replace Entire Structure in the Existing Alignment Summary – This concept proposes to replace the entire fixed dock structure in the same location with steel piles, steel pile caps, and a concrete deck. The dock plan dimensions will not change. Figures 2a and 2b present the plan and section of Alternative 2. Safety – The proposed complete replacement will provide structural integrity for a 40-year life. The traffic flow will remain unchanged. Electric and fire suppression upgrades will enhance safety for tenants. Function – Alternative 2 will allow vehicle access to be re-instated on the dock in accordance with the project design criteria. ADA access conforming to the ADA-ABA Chapter 10 will be required. It is not practical for Port Dock 5 to meet the general ADA gangway slope requirements. Section 1003.2.1.3 allows an exception for which gangways 80 feet or longer are not required to meet the 1V:12H slope requirement. We recommend shortening the fixed dock to allow an 80-foot-long gangway. This will require deleting 38 feet of the dock, or two structural bents. The 80-foot gangway would have a slope at MLLW of approximately 1V:5H. (The existing gangway slope is approximately 1V:3H). Installing the 80-foot gangway will most likely necessitate modifying the main marina landing floatation to accommodate the additional gangway load. A cost estimate has been included in Table 2 to modify the float. The fire suppression system will be upgraded to comply with current NFPA requirements to a standpipe at the offshore end of the dock. The electrical power supply is proposed to be upgraded to a system capable of serving two 50 amp 125/250V receptacles per vessel. The
Port Dock 5 Conceptual Alternatives Analysis Summary Report OBEC Job No. 860-01 Port Dock 5 Page 7 Newport, Oregon
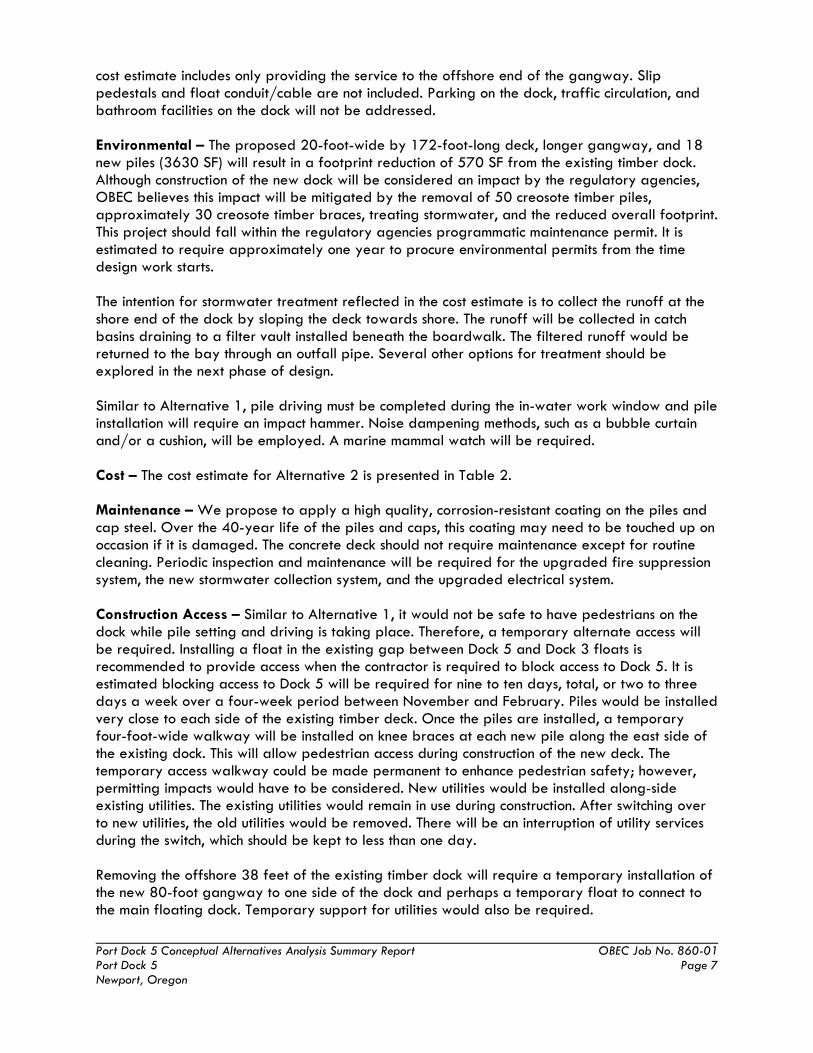
cost estimate includes only providing the service to the offshore end of the gangway. Slip pedestals and float conduit/cable are not included. Parking on the dock, traffic circulation, and bathroom facilities on the dock will not be addressed. Environmental – The proposed 20-foot-wide by 172-foot-long deck, longer gangway, and 18 new piles (3630 SF) will result in a footprint reduction of 570 SF from the existing timber dock. Although construction of the new dock will be considered an impact by the regulatory agencies, OBEC believes this impact will be mitigated by the removal of 50 creosote timber piles, approximately 30 creosote timber braces, treating stormwater, and the reduced overall footprint. This project should fall within the regulatory agencies programmatic maintenance permit. It is estimated to require approximately one year to procure environmental permits from the time design work starts. The intention for stormwater treatment reflected in the cost estimate is to collect the runoff at the shore end of the dock by sloping the deck towards shore. The runoff will be collected in catch basins draining to a filter vault installed beneath the boardwalk. The filtered runoff would be returned to the bay through an outfall pipe. Several other options for treatment should be explored in the next phase of design. Similar to Alternative 1, pile driving must be completed during the in-water work window and pile installation will require an impact hammer. Noise dampening methods, such as a bubble curtain and/or a cushion, will be employed. A marine mammal watch will be required. Cost – The cost estimate for Alternative 2 is presented in Table 2. Maintenance – We propose to apply a high quality, corrosion-resistant coating on the piles and cap steel. Over the 40-year life of the piles and caps, this coating may need to be touched up on occasion if it is damaged. The concrete deck should not require maintenance except for routine cleaning. Periodic inspection and maintenance will be required for the upgraded fire suppression system, the new stormwater collection system, and the upgraded electrical system. Construction Access – Similar to Alternative 1, it would not be safe to have pedestrians on the dock while pile setting and driving is taking place. Therefore, a temporary alternate access will be required. Installing a float in the existing gap between Dock 5 and Dock 3 floats is recommended to provide access when the contractor is required to block access to Dock 5. It is estimated blocking access to Dock 5 will be required for nine to ten days, total, or two to three days a week over a four-week period between November and February. Piles would be installed very close to each side of the existing timber deck. Once the piles are installed, a temporary four-foot-wide walkway will be installed on knee braces at each new pile along the east side of the existing dock. This will allow pedestrian access during construction of the new deck. The temporary access walkway could be made permanent to enhance pedestrian safety; however, permitting impacts would have to be considered. New utilities would be installed along-side existing utilities. The existing utilities would remain in use during construction. After switching over to new utilities, the old utilities would be removed. There will be an interruption of utility services during the switch, which should be kept to less than one day. Removing the offshore 38 feet of the existing timber dock will require a temporary installation of the new 80-foot gangway to one side of the dock and perhaps a temporary float to connect to the main floating dock. Temporary support for utilities would also be required.
Port Dock 5 Conceptual Alternatives Analysis Summary Report OBEC Job No. 860-01 Port Dock 5 Page 8 Newport, Oregon
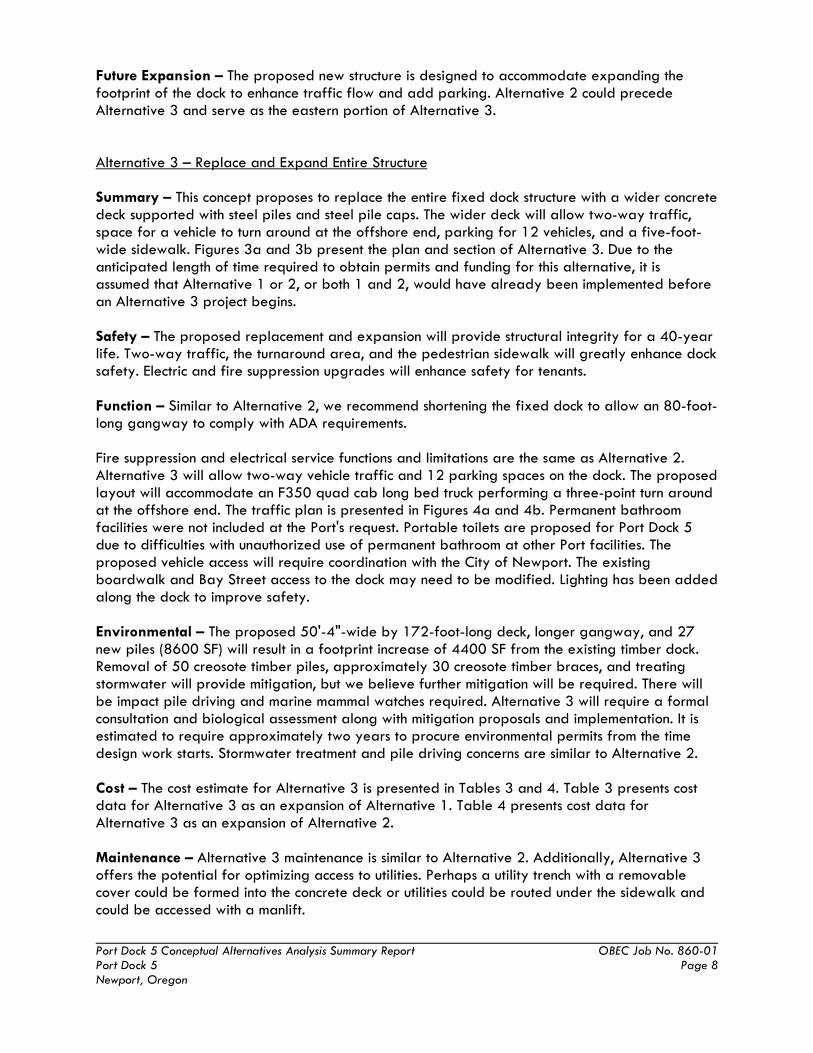
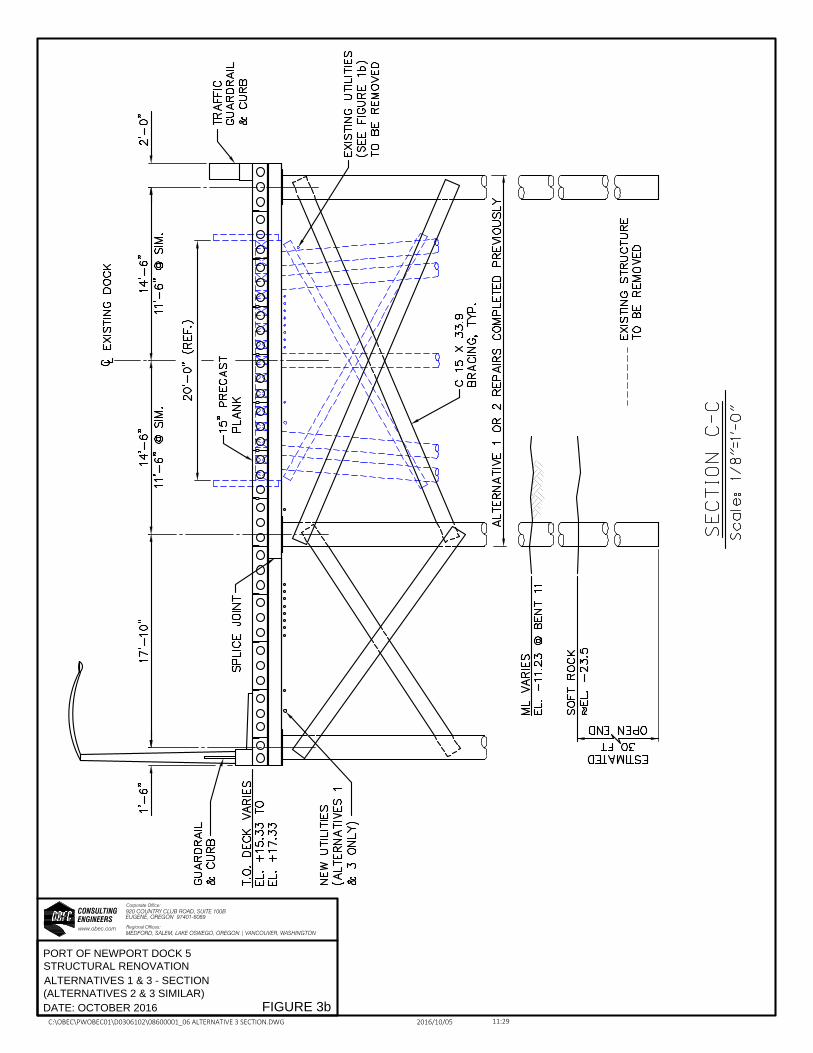
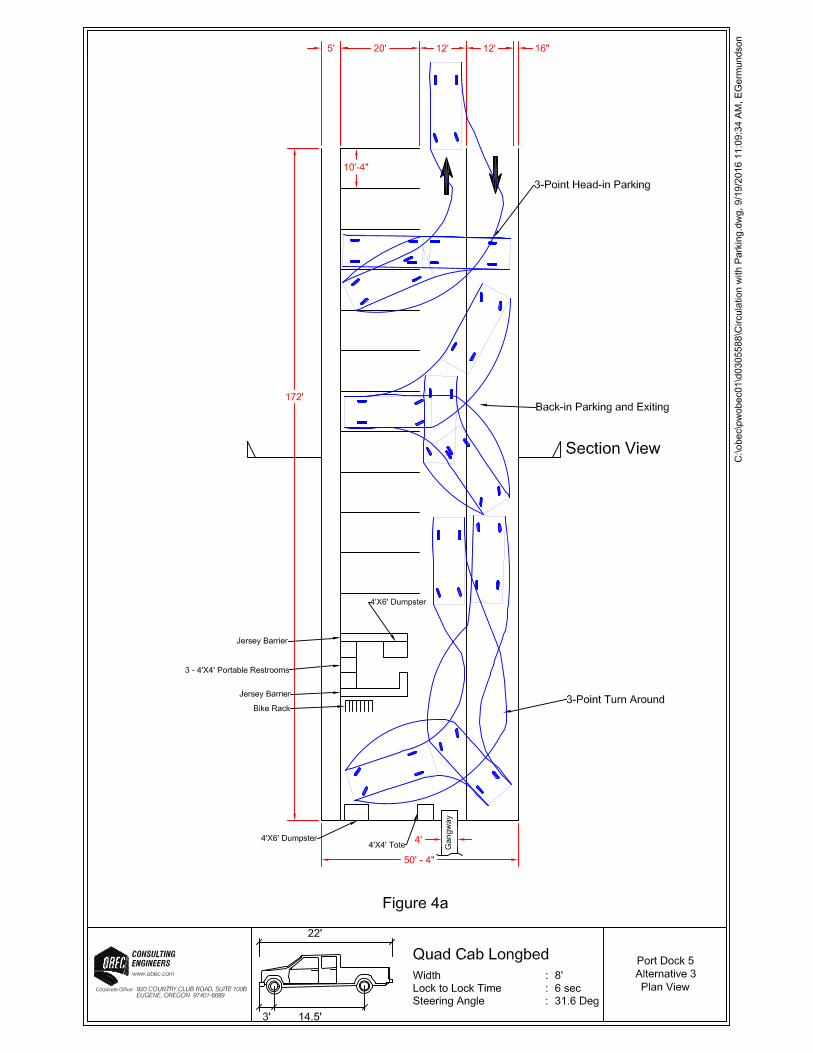
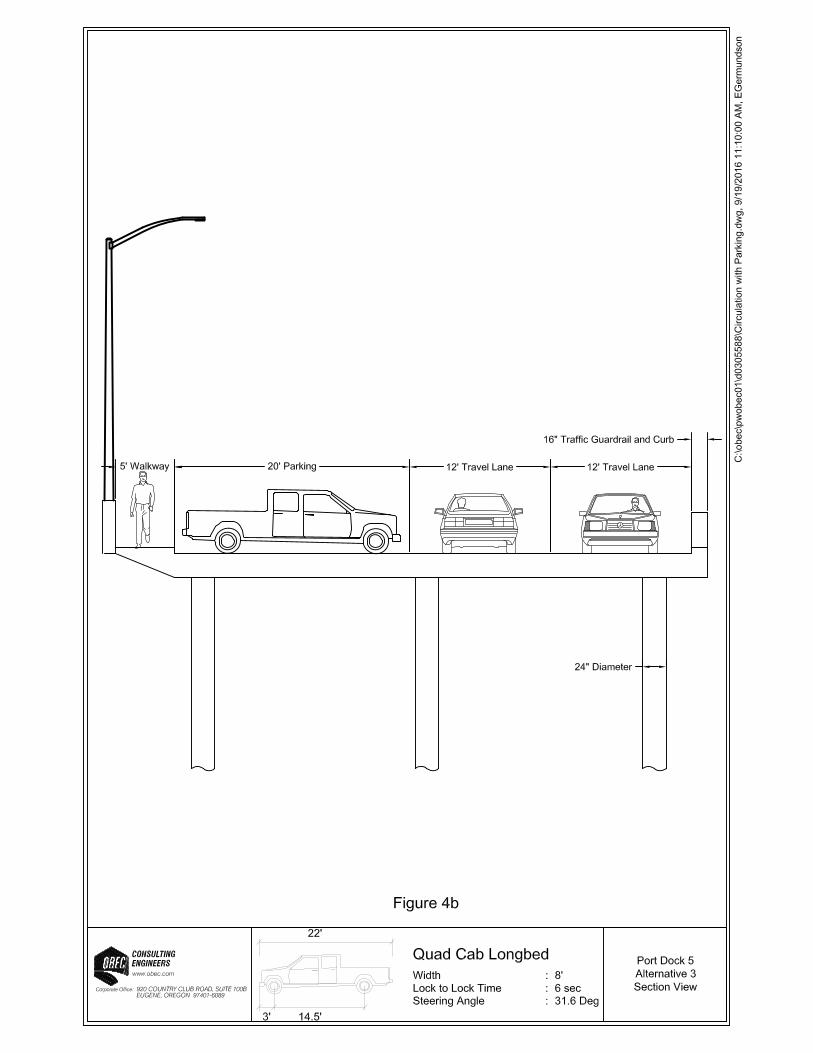
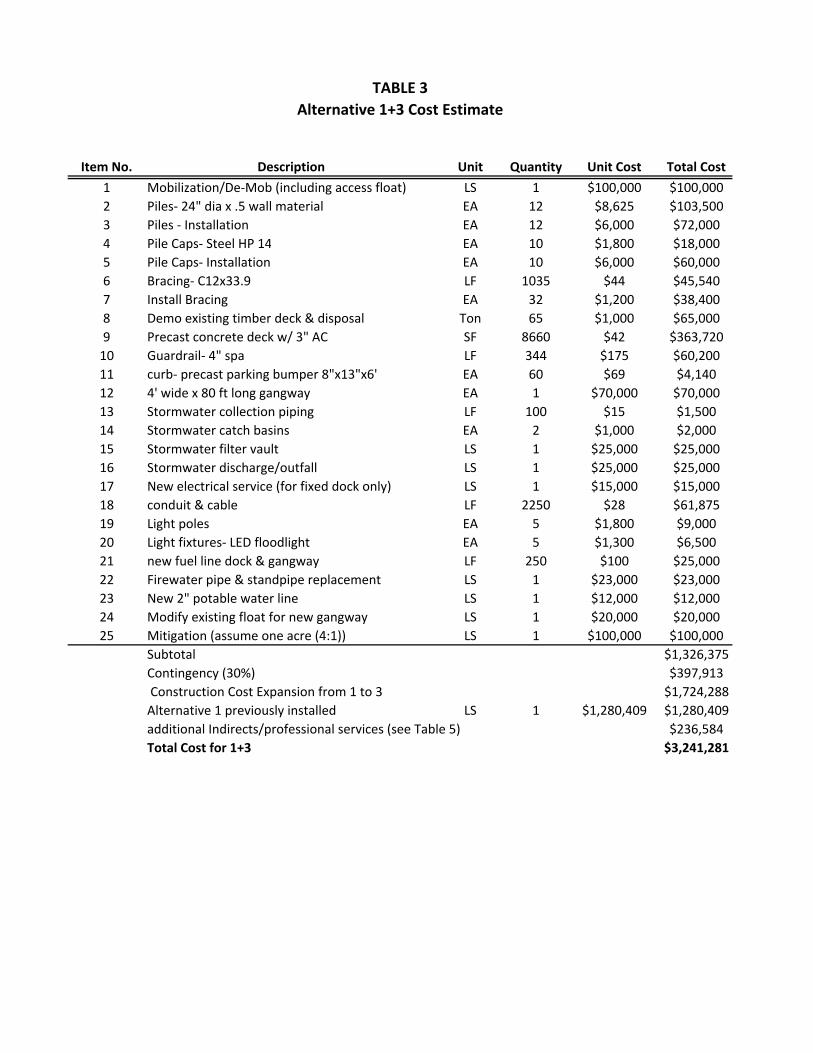
Future Expansion – The proposed new structure is designed to accommodate expanding the footprint of the dock to enhance traffic flow and add parking. Alternative 2 could precede Alternative 3 and serve as the eastern portion of Alternative 3. Alternative 3 – Replace and Expand Entire Structure Summary – This concept proposes to replace the entire fixed dock structure with a wider concrete deck supported with steel piles and steel pile caps. The wider deck will allow two-way traffic, space for a vehicle to turn around at the offshore end, parking for 12 vehicles, and a five-foot-wide sidewalk. Figures 3a and 3b present the plan and section of Alternative 3. Due to the anticipated length of time required to obtain permits and funding for this alternative, it is assumed that Alternative 1 or 2, or both 1 and 2, would have already been implemented before an Alternative 3 project begins. Safety – The proposed replacement and expansion will provide structural integrity for a 40-year life. Two-way traffic, the turnaround area, and the pedestrian sidewalk will greatly enhance dock safety. Electric and fire suppression upgrades will enhance safety for tenants. Function – Similar to Alternative 2, we recommend shortening the fixed dock to allow an 80-foot-long gangway to comply with ADA requirements. Fire suppression and electrical service functions and limitations are the same as Alternative 2. Alternative 3 will allow two-way vehicle traffic and 12 parking spaces on the dock. The proposed layout will accommodate an F350 quad cab long bed truck performing a three-point turn around at the offshore end. The traffic plan is presented in Figures 4a and 4b. Permanent bathroom facilities were not included at the Port's request. Portable toilets are proposed for Port Dock 5 due to difficulties with unauthorized use of permanent bathroom at other Port facilities. The proposed vehicle access will require coordination with the City of Newport. The existing boardwalk and Bay Street access to the dock may need to be modified. Lighting has been added along the dock to improve safety. Environmental – The proposed 50'-4"-wide by 172-foot-long deck, longer gangway, and 27 new piles (8600 SF) will result in a footprint increase of 4400 SF from the existing timber dock. Removal of 50 creosote timber piles, approximately 30 creosote timber braces, and treating stormwater will provide mitigation, but we believe further mitigation will be required. There will be impact pile driving and marine mammal watches required. Alternative 3 will require a formal consultation and biological assessment along with mitigation proposals and implementation. It is estimated to require approximately two years to procure environmental permits from the time design work starts. Stormwater treatment and pile driving concerns are similar to Alternative 2. Cost – The cost estimate for Alternative 3 is presented in Tables 3 and 4. Table 3 presents cost data for Alternative 3 as an expansion of Alternative 1. Table 4 presents cost data for Alternative 3 as an expansion of Alternative 2. Maintenance – Alternative 3 maintenance is similar to Alternative 2. Additionally, Alternative 3 offers the potential for optimizing access to utilities. Perhaps a utility trench with a removable cover could be formed into the concrete deck or utilities could be routed under the sidewalk and could be accessed with a manlift.

Port Dock 5 Conceptual Alternatives Analysis Summary Report OBEC Job No. 860-01 Port Dock 5 Page 9 Newport, Oregon
Construction Access – The footprint would expand to the west of the existing dock since the mudline is shallower to the west and less likely to be useful for vessels. The construction sequence envisioned for Alternative 3 starts with building the new western portion first along-side the existing dock (which has been repaired with Alternative 1or 2). The new piles required will be 15 to 20 feet from the existing dock, so the existing dock could remain in operation throughout construction of the western portion. For Alternative 1+3, once the western portion is complete, dock operations would transfer to the western portion, and the existing timber deck would be demolished and replaced. All utilities would be newly routed in the western portion and switched over from the existing dock with only a few hours of interrupted service. For Alternative 2+3, all utilities would already be replaced under the existing dock footprint, so no interruption of utilities will occur. Future Expansion – Alternative 3 will be the ultimate build-out. No expansion for this alternative is being considered. Evaluation of Alternatives The process of evaluating the above alternatives was done using a framework for rating how each alternative meets the goals of the Port Dock 5 stakeholders. Each goal was assigned a "weight" relative to the other goals based on the goal's importance to the stakeholders. Each alternative was assessed with a score from 1 to 5 for each goal. That score was then multiplied by the weight assigned to each goal. The sum of the weighted goal scores for each alternative were compared to determine which alternative rated the highest. The scoring is based on the following:
1. Unacceptable – likely not feasible 2. Undesirable – very difficult 3. Neutral 4. Favorable 5. Superior
The evaluation results are presented in Table 6. Stakeholders reviewed the draft issue of this report and shared some concerns with the assigned goal weights. We increased the weight for the seventh goal "Future Expansion" from 3 to 4 to address stakeholder concerns. Please see the note on Table 6. This change did not impact the overall evaluation results. As stated above, constructing Alternative 3 independent of Alternative 1 or 2 is not considered feasible. The following Alternatives were evaluated: Alternative 1 Alternative 2 Alternative 1 and 3 Alternative 2 and 3
Miscellaneous Items GRI performed a brief preliminary evaluation of site geotechnical conditions and pile
load capacities. The site is prone to liquefaction and lateral spread of the sloping mudline during a seismic event. Liquefaction could occur during seismic events that are lower in
Port Dock 5 Conceptual Alternatives Analysis Summary Report OBEC Job No. 860-01 Port Dock 5 Page 10 Newport, Oregon
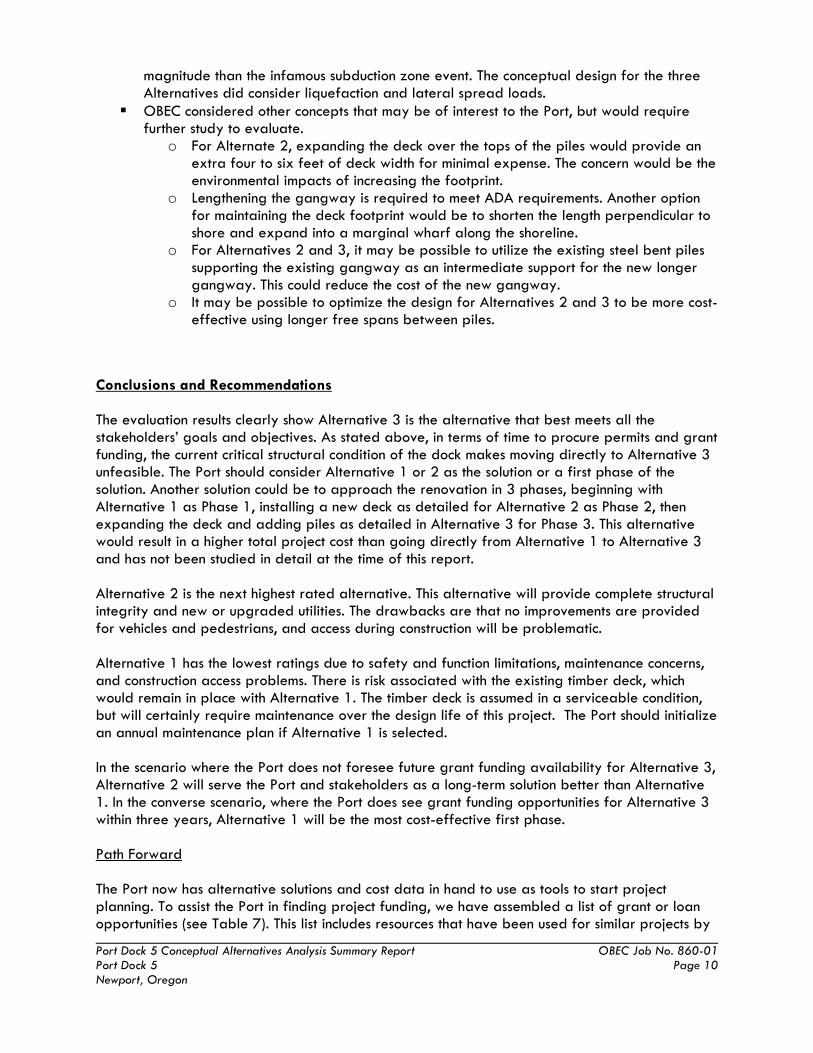
magnitude than the infamous subduction zone event. The conceptual design for the three Alternatives did consider liquefaction and lateral spread loads.
OBEC considered other concepts that may be of interest to the Port, but would require further study to evaluate.
o For Alternate 2, expanding the deck over the tops of the piles would provide an extra four to six feet of deck width for minimal expense. The concern would be the environmental impacts of increasing the footprint.
o Lengthening the gangway is required to meet ADA requirements. Another option for maintaining the deck footprint would be to shorten the length perpendicular to shore and expand into a marginal wharf along the shoreline.
o For Alternatives 2 and 3, it may be possible to utilize the existing steel bent piles supporting the existing gangway as an intermediate support for the new longer gangway. This could reduce the cost of the new gangway.
o It may be possible to optimize the design for Alternatives 2 and 3 to be more cost-effective using longer free spans between piles.
Conclusions and Recommendations The evaluation results clearly show Alternative 3 is the alternative that best meets all the stakeholders’ goals and objectives. As stated above, in terms of time to procure permits and grant funding, the current critical structural condition of the dock makes moving directly to Alternative 3 unfeasible. The Port should consider Alternative 1 or 2 as the solution or a first phase of the solution. Another solution could be to approach the renovation in 3 phases, beginning with Alternative 1 as Phase 1, installing a new deck as detailed for Alternative 2 as Phase 2, then expanding the deck and adding piles as detailed in Alternative 3 for Phase 3. This alternative would result in a higher total project cost than going directly from Alternative 1 to Alternative 3 and has not been studied in detail at the time of this report. Alternative 2 is the next highest rated alternative. This alternative will provide complete structural integrity and new or upgraded utilities. The drawbacks are that no improvements are provided for vehicles and pedestrians, and access during construction will be problematic. Alternative 1 has the lowest ratings due to safety and function limitations, maintenance concerns, and construction access problems. There is risk associated with the existing timber deck, which would remain in place with Alternative 1. The timber deck is assumed in a serviceable condition, but will certainly require maintenance over the design life of this project. The Port should initialize an annual maintenance plan if Alternative 1 is selected. In the scenario where the Port does not foresee future grant funding availability for Alternative 3, Alternative 2 will serve the Port and stakeholders as a long-term solution better than Alternative 1. In the converse scenario, where the Port does see grant funding opportunities for Alternative 3 within three years, Alternative 1 will be the most cost-effective first phase. Path Forward The Port now has alternative solutions and cost data in hand to use as tools to start project planning. To assist the Port in finding project funding, we have assembled a list of grant or loan opportunities (see Table 7). This list includes resources that have been used for similar projects by
Port Dock 5 Conceptual Alternatives Analysis Summary Report OBEC Job No. 860-01 Port Dock 5 Page 11 Newport, Oregon
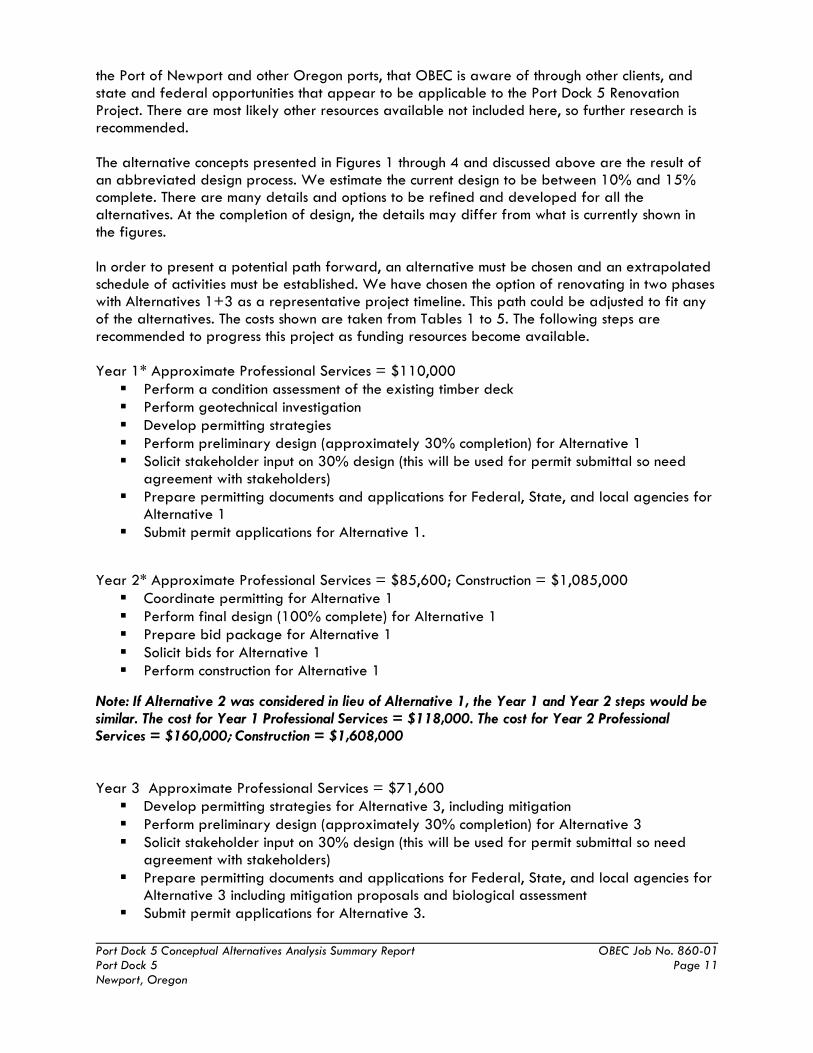
the Port of Newport and other Oregon ports, that OBEC is aware of through other clients, and state and federal opportunities that appear to be applicable to the Port Dock 5 Renovation Project. There are most likely other resources available not included here, so further research is recommended. The alternative concepts presented in Figures 1 through 4 and discussed above are the result of an abbreviated design process. We estimate the current design to be between 10% and 15% complete. There are many details and options to be refined and developed for all the alternatives. At the completion of design, the details may differ from what is currently shown in the figures. In order to present a potential path forward, an alternative must be chosen and an extrapolated schedule of activities must be established. We have chosen the option of renovating in two phases with Alternatives 1+3 as a representative project timeline. This path could be adjusted to fit any of the alternatives. The costs shown are taken from Tables 1 to 5. The following steps are recommended to progress this project as funding resources become available. Year 1* Approximate Professional Services = $110,000 Perform a condition assessment of the existing timber deck Perform geotechnical investigation Develop permitting strategies Perform preliminary design (approximately 30% completion) for Alternative 1 Solicit stakeholder input on 30% design (this will be used for permit submittal so need
agreement with stakeholders) Prepare permitting documents and applications for Federal, State, and local agencies for
Alternative 1 Submit permit applications for Alternative 1.
Year 2* Approximate Professional Services = $85,600; Construction = $1,085,000 Coordinate permitting for Alternative 1 Perform final design (100% complete) for Alternative 1 Prepare bid package for Alternative 1 Solicit bids for Alternative 1 Perform construction for Alternative 1
Note: If Alternative 2 was considered in lieu of Alternative 1, the Year 1 and Year 2 steps would be similar. The cost for Year 1 Professional Services = $118,000. The cost for Year 2 Professional Services = $160,000; Construction = $1,608,000 Year 3 Approximate Professional Services = $71,600 Develop permitting strategies for Alternative 3, including mitigation Perform preliminary design (approximately 30% completion) for Alternative 3 Solicit stakeholder input on 30% design (this will be used for permit submittal so need
agreement with stakeholders) Prepare permitting documents and applications for Federal, State, and local agencies for
Alternative 3 including mitigation proposals and biological assessment Submit permit applications for Alternative 3.
Port Dock 5 Conceptual Alternatives Analysis Summary Report OBEC Job No. 860-01 Port Dock 5 Page 12 Newport, Oregon
Year 5 Approximate Professional Services = $165,100 Construction = $1,725,000 Coordinate permitting for Alternative 3 Perform final design (100% complete) for Alternative 3 Implement mitigation Prepare bid package for Alternative 3 Solicit bids for Alternative 3 Perform construction for Alternative 3
*Year 1 and Year 2 steps could potentially be completed within a 12 month period

FIGU
RES
www.obec.com
Corporate Office:920 COUNTRY CLUB ROAD, SUITE 100BEUGENE, OREGON 97401-6089
Regional Offices:MEDFORD, SALEM, LAKE OSWEGO, OREGON | VANCOUVER, WASHINGTON
PORT OF NEWPORT DOCK 5
STRUCTURAL RENOVATION
DATE: OCTOBER 2016
C:\OBEC\PWOBEC01\D0306102\08600001_01 ALTERNATIVE 1 PLAN.DWG 2016/10/05 11:23
ALTERNATIVE 1 - PLAN
FIGURE 1a
www.obec.com
Corporate Office:920 COUNTRY CLUB ROAD, SUITE 100BEUGENE, OREGON 97401-6089
Regional Offices:MEDFORD, SALEM, LAKE OSWEGO, OREGON | VANCOUVER, WASHINGTON
PORT OF NEWPORT DOCK 5
STRUCTURAL RENOVATION
DATE: OCTOBER 2016
C:\OBEC\PWOBEC01\D0306102\08600001_02 ALTERNATIVE 1 SECTION.DWG 2016/10/05 11:27
ALTERNATIVE 1 - SECTION
FIGURE 1b
www.obec.com
Corporate Office:920 COUNTRY CLUB ROAD, SUITE 100BEUGENE, OREGON 97401-6089
Regional Offices:MEDFORD, SALEM, LAKE OSWEGO, OREGON | VANCOUVER, WASHINGTON
PORT OF NEWPORT DOCK 5
STRUCTURAL RENOVATION
DATE: OCTOBER 2016
C:\OBEC\PWOBEC01\D0306102\08600001_03 ALTERNATIVE 2 PLAN.DWG 2016/10/05 11:25
ALTERNATIVE 2 - PLAN
FIGURE 2a

www.obec.com
Corporate Office:920 COUNTRY CLUB ROAD, SUITE 100BEUGENE, OREGON 97401-6089
Regional Offices:MEDFORD, SALEM, LAKE OSWEGO, OREGON | VANCOUVER, WASHINGTON
PORT OF NEWPORT DOCK 5
STRUCTURAL RENOVATION
DATE: OCTOBER 2016
C:\OBEC\PWOBEC01\D0306102\08600001_04 ALTERNATIVE 2 SECTION.DWG 2016/10/05 11:28
ALTERNATIVE 2 - SECTION
FIGURE 2b

www.obec.com
Corporate Office:920 COUNTRY CLUB ROAD, SUITE 100BEUGENE, OREGON 97401-6089
Regional Offices:MEDFORD, SALEM, LAKE OSWEGO, OREGON | VANCOUVER, WASHINGTON
PORT OF NEWPORT DOCK 5
STRUCTURAL RENOVATION
DATE: OCTOBER 2016
C:\OBEC\PWOBEC01\D0306102\08600001_05 ALTERNATIVE 3 PLAN.DWG 2016/10/05 11:26
ALTERNATIVES 1 & 3 - PLAN
(ALTERNATIVES 2 & 3 PLAN SIMILAR)
FIGURE 3a
www.obec.com
Corporate Office:920 COUNTRY CLUB ROAD, SUITE 100BEUGENE, OREGON 97401-6089
Regional Offices:MEDFORD, SALEM, LAKE OSWEGO, OREGON | VANCOUVER, WASHINGTON
PORT OF NEWPORT DOCK 5
STRUCTURAL RENOVATION
DATE: OCTOBER 2016
C:\OBEC\PWOBEC01\D0306102\08600001_06 ALTERNATIVE 3 SECTION.DWG 2016/10/05 11:29
FIGURE 3b
ALTERNATIVES 1 & 3 - SECTION
(ALTERNATIVES 2 & 3 SIMILAR)

TABL
ES

Item No. Description Unit Quantity Unit Cost Total Cost
1 Mobilization/De‐Mob (including access float) LS 1 $100,000 $100,000
2 Piles‐ 24" dia x .5 wall material EA 20 $8,625 $172,500
3 Piles ‐ Installation EA 20 $6,000 $120,000
4 Pile Caps‐ Steel HP 14 EA 20 $3,400 $68,000
5 Pile Caps‐ Installation EA 20 $12,000 $240,000
6 Bracing‐ C15x33.9 LF 1035 $44 $45,540
7 Install Bracing EA 32 $1,200 $38,400
8 Demo existing timber piles, brcg, & disposal Ton 50 $1,000 $50,000
Subtotal $834,440
Contingency (30%) $250,332
Indirects/professional services (see Table 5) $195,637
Total Cost $1,280,409
TABLE 1
Alternative 1 Cost Estimate

Item No. Description Unit Quantity Unit Cost Total Cost
1 Mobilization/De‐Mob (including access float) LS 1 $100,000 $100,000
2 Piles‐ 24" dia x .5 wall material EA 18 $8,625 $155,250
3 Piles ‐ Installation EA 18 $6,000 $108,000
4 Pile Caps‐ Steel HP 14 EA 9 $2,400 $21,600
5 Pile Caps‐ Installation EA 9 $6,000 $54,000
6 Bracing‐ C12x33.9 LF 960 $44 $42,240
7 Install Bracing EA 30 $1,200 $36,000
8 Demo existing timber deck, piles, brcg, & disposal Ton 115 $1,000 $115,000
9 Precast concrete deck w/ 3" AC SF 3440 $42 $144,480
10 Guardrail‐ 4" spa LF 344 $175 $60,200
11 curb‐ precast parking bumper 8"x13"x6' EA 60 $69 $4,140
12 4' wide x 80 ft long gangway EA 1 $70,000 $70,000
13 Stormwater collection piping LF 100 $15 $1,500
14 Stormwater catch basins EA 2 $1,000 $2,000
15 Stormwater filter vault LS 1 $25,000 $25,000
16 Stormwater discharge/outfall LS 1 $25,000 $25,000
17 New electrical service (for fixed dock only) LS 1 $15,000 $15,000
18 conduit & cable LF 2250 $28 $61,875
19 Light poles EA 5 $1,800 $9,000
20 Light fixtures‐ LED floodlight EA 5 $1,300 $6,500
21 new fuel line dock & gangway LF 250 $100 $25,000
22 Firewater pipe & standpipe replacement LS 1 $23,000 $23,000
23 Temporary walkway + knee brace supports LF 200 $300 $60,000
24 New 2" potable water line LS 1 $12,000 $12,000
25 Temp access/utility support for demo 9‐11 LS 1 $40,000 $40,000
25 Modify existing float for new gangway LS 1 $20,000 $20,000
Subtotal $1,236,785
Contingency (30%) $371,036
Indirects/professional services (see Table 5) $278,292
Total Cost $1,886,113
TABLE 2
Alternative 2 Cost Estimate
Item No. Description Unit Quantity Unit Cost Total Cost
1 Mobilization/De‐Mob (including access float) LS 1 $100,000 $100,000
2 Piles‐ 24" dia x .5 wall material EA 12 $8,625 $103,500
3 Piles ‐ Installation EA 12 $6,000 $72,000
4 Pile Caps‐ Steel HP 14 EA 10 $1,800 $18,000
5 Pile Caps‐ Installation EA 10 $6,000 $60,000
6 Bracing‐ C12x33.9 LF 1035 $44 $45,540
7 Install Bracing EA 32 $1,200 $38,400
8 Demo existing timber deck & disposal Ton 65 $1,000 $65,000
9 Precast concrete deck w/ 3" AC SF 8660 $42 $363,720
10 Guardrail‐ 4" spa LF 344 $175 $60,200
11 curb‐ precast parking bumper 8"x13"x6' EA 60 $69 $4,140
12 4' wide x 80 ft long gangway EA 1 $70,000 $70,000
13 Stormwater collection piping LF 100 $15 $1,500
14 Stormwater catch basins EA 2 $1,000 $2,000
15 Stormwater filter vault LS 1 $25,000 $25,000
16 Stormwater discharge/outfall LS 1 $25,000 $25,000
17 New electrical service (for fixed dock only) LS 1 $15,000 $15,000
18 conduit & cable LF 2250 $28 $61,875
19 Light poles EA 5 $1,800 $9,000
20 Light fixtures‐ LED floodlight EA 5 $1,300 $6,500
21 new fuel line dock & gangway LF 250 $100 $25,000
22 Firewater pipe & standpipe replacement LS 1 $23,000 $23,000
23 New 2" potable water line LS 1 $12,000 $12,000
24 Modify existing float for new gangway LS 1 $20,000 $20,000
25 Mitigation (assume one acre (4:1)) LS 1 $100,000 $100,000
Subtotal $1,326,375
Contingency (30%) $397,913
Construction Cost Expansion from 1 to 3 $1,724,288
Alternative 1 previously installed LS 1 $1,280,409 $1,280,409
additional Indirects/professional services (see Table 5) $236,584
Total Cost for 1+3 $3,241,281
TABLE 3
Alternative 1+3 Cost Estimate

Item No. Description Unit Quantity Unit Cost Total Cost
1 Mobilization/De‐Mob (including access float) LS 1 $100,000 $100,000
2 Piles‐ 24" dia x .5 wall material EA 12 $8,625 $103,500
3 Piles ‐ Installation EA 12 $6,000 $72,000
4 Pile Caps‐ Steel HP 14 EA 10 $1,800 $18,000
5 Pile Caps‐ Installation EA 10 $6,000 $60,000
6 Bracing‐ C12x33.9 LF 1035 $44 $45,540
7 Install Bracing EA 32 $1,200 $38,400
8 Precast concrete deck w/ 3" AC SF 5220 $42 $219,240
9 Guardrail‐ 4" SPA LF 172 $175 $30,100
10 curb‐ precast parking bumper 8"x13"x6' EA 60 $69 $4,140
11 Stormwater collection piping LF 50 $15 $750
12 Stormwater catch basins EA 1 $1,000 $1,000
13 Light poles EA 5 $1,800 $9,000
14 Light fixtures‐ LED floodlight EA 5 $1,300 $6,500
15 Mitigation (assumes one acre (4:1)) LS 1 $100,000 $100,000
Subtotal $808,170
Contingency (30%) $242,451
Total Cost Expansion $1,050,621
Alternative 2 cost previously installed LS 1 $1,886,113 $1,886,113
additional Indirects/professional services $219,164
Total Cost $3,155,898
TABLE 4
Alternative 2+3 Cost Estimate
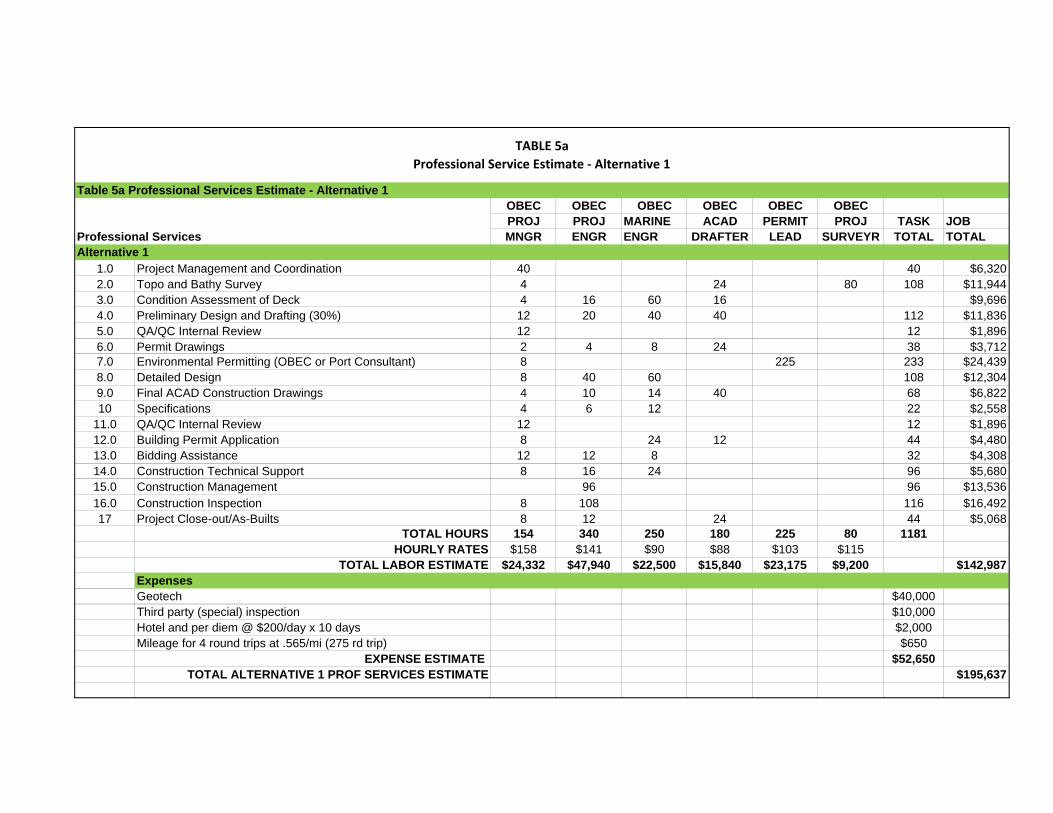
Table 5a Professional Services Estimate - Alternative 1 OBEC OBEC OBEC OBEC OBEC OBECPROJ PROJ MARINE ACAD PERMIT PROJ TASK JOBMNGR ENGR ENGR DRAFTER LEAD SURVEYR TOTAL TOTAL
Alternative 11.0 Project Management and Coordination 40 40 $6,3202.0 Topo and Bathy Survey 4 24 80 108 $11,9443.0 Condition Assessment of Deck 4 16 60 16 $9,6964.0 Preliminary Design and Drafting (30%) 12 20 40 40 112 $11,8365.0 QA/QC Internal Review 12 12 $1,8966.0 Permit Drawings 2 4 8 24 38 $3,7127.0 Environmental Permitting (OBEC or Port Consultant) 8 225 233 $24,4398.0 Detailed Design 8 40 60 108 $12,3049.0 Final ACAD Construction Drawings 4 10 14 40 68 $6,82210 Specifications 4 6 12 22 $2,558
11.0 QA/QC Internal Review 12 12 $1,89612.0 Building Permit Application 8 24 12 44 $4,48013.0 Bidding Assistance 12 12 8 32 $4,30814.0 Construction Technical Support 8 16 24 96 $5,68015.0 Construction Management 96 96 $13,53616.0 Construction Inspection 8 108 116 $16,49217 Project Close-out/As-Builts 8 12 24 44 $5,068
TOTAL HOURS 154 340 250 180 225 80 1181 HOURLY RATES $158 $141 $90 $88 $103 $115
TOTAL LABOR ESTIMATE $24,332 $47,940 $22,500 $15,840 $23,175 $9,200 $142,987Expenses
Geotech $40,000Third party (special) inspection $10,000Hotel and per diem @ $200/day x 10 days $2,000Mileage for 4 round trips at .565/mi (275 rd trip) $650
EXPENSE ESTIMATE $52,650TOTAL ALTERNATIVE 1 PROF SERVICES ESTIMATE $195,637
Professional Services
TABLE 5a
Professional Service Estimate ‐ Alternative 1

Table 5b Professional Services Estimate - Alternative 21.0 Project Management and Coordination 60 60 $9,4802.0 Topo and Bathy Survey 4 24 80 108 $11,9443.0 Preliminary Design and Drafting (30%) 16 60 80 80 236 $25,2284.0 QA/QC Internal Review 12 12 $1,8965.0 Permit Drawings 2 4 12 30 48 $4,6006.0 Environmental Permitting 8 300 308 $32,1647.0 Detailed Design 20 80 100 200 $23,4408.0 Final ACAD Construction Drawings 4 40 60 100 204 $20,4729.0 Specifications 4 6 12 22 $2,55810 QA/QC Internal Review 12 12 $1,896
11.0 Building Permit Application 8 24 12 44 $4,48012.0 Bidding Assistance 12 12 8 32 $4,30813.0 Construction Technical Support 40 80 98 70 288 $32,58014.0 Construction Management 96 96 $13,53615.0 Construction Inspection 8 108 40 156 $20,09216.0 Project Close-out/As-Builts 8 12 24 44 $5,068
TOTAL HOURS 218 498 434 340 300 80 1870ExpensesGeotech $40,000Third party (special) inspection $20,000Hotel and per diem @ $200/day x 15 days $3,000Mileage for 10 round trips at .565/mi (275 rd trip) $1,550
EXPENSE ESTIMATE $64,550TOTAL ALTERNATIVE 2 PROF SERVICES ESTIMATE $278,292
TABLE 5b
Professional Service Estimate ‐ Alternative 2

Table 5c Professional Services Estimate - Alternative 1+31.0 Project Management and Coordination 40 40 $6,3202.0 Preliminary Design and Drafting (30%) 16 40 60 80 196 $20,6083.0 QA/QC Internal Review 12 12 $1,8964.0 Permit Drawings 2 4 8 24 38 $3,7125.0 Environmental Permitting 16 500 516 $54,0286.0 Detailed Design 16 80 80 176 $21,0087.0 Final ACAD Construction Drawings 8 60 80 120 268 $27,4848.0 Specifications 4 6 12 22 $2,5589.0 QA/QC Internal Review 12 12 $1,89610 Building Permit Application 8 24 12 44 $4,480
11.0 Bidding Assistance 12 12 8 32 $4,30812.0 Construction Technical Support 40 80 98 70 288 $32,58013.0 Construction Management 96 96 $13,53614.0 Construction Inspection 8 68 40 116 $14,45215.0 Project Close-out/As-Builts 8 12 24 44 $5,068
TOTAL HOURS 202 458 410 330 500 1,900ExpensesThird party (special) inspection $20,000Hotel and per diem @ $200/day x 10 days $2,000Mileage for 4 round trips at .565/mi (275 rd trip) $650
EXPENSE ESTIMATE $22,650ALTERNATIVE 1 TOTAL SERVICES $195,637
TOTAL ALTERNATIVE 1+3 PROF SERVICES ESTIMATE $432,221Additional above Alt 1 services $236,584
TABLE 5c
Professional Service Estimate ‐ Alternative 1+3
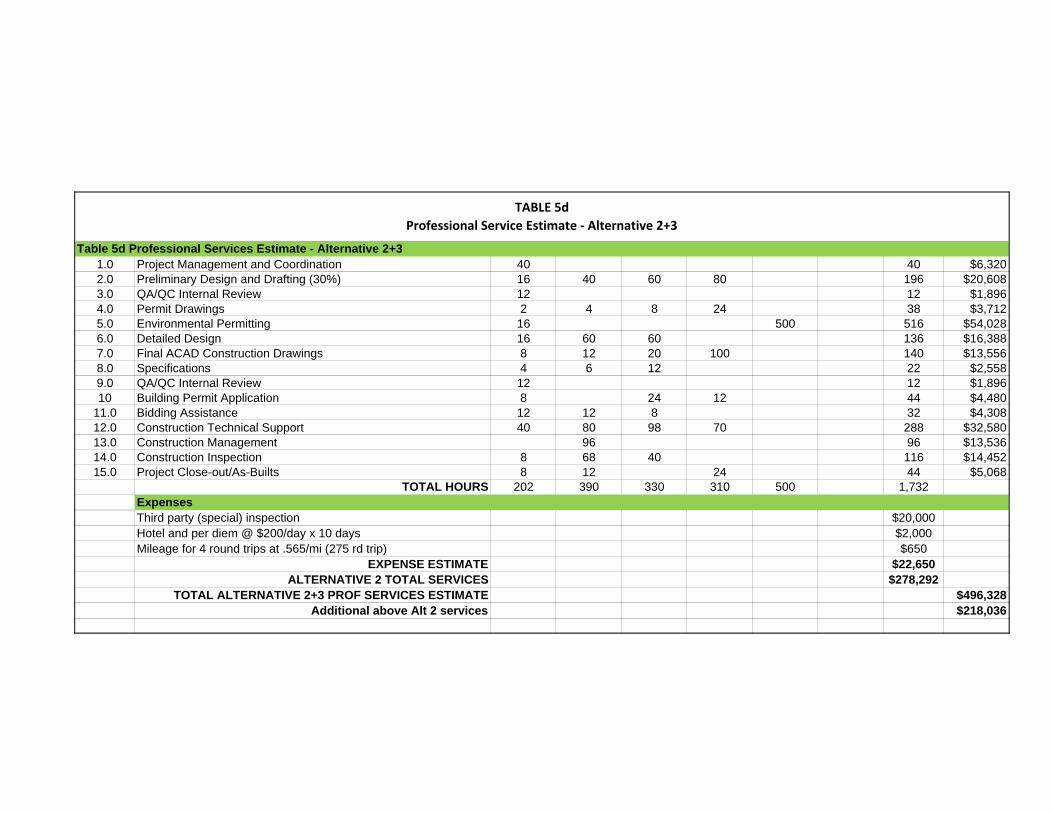
Table 5d Professional Services Estimate - Alternative 2+31.0 Project Management and Coordination 40 40 $6,3202.0 Preliminary Design and Drafting (30%) 16 40 60 80 196 $20,6083.0 QA/QC Internal Review 12 12 $1,8964.0 Permit Drawings 2 4 8 24 38 $3,7125.0 Environmental Permitting 16 500 516 $54,0286.0 Detailed Design 16 60 60 136 $16,3887.0 Final ACAD Construction Drawings 8 12 20 100 140 $13,5568.0 Specifications 4 6 12 22 $2,5589.0 QA/QC Internal Review 12 12 $1,89610 Building Permit Application 8 24 12 44 $4,480
11.0 Bidding Assistance 12 12 8 32 $4,30812.0 Construction Technical Support 40 80 98 70 288 $32,58013.0 Construction Management 96 96 $13,53614.0 Construction Inspection 8 68 40 116 $14,45215.0 Project Close-out/As-Builts 8 12 24 44 $5,068
TOTAL HOURS 202 390 330 310 500 1,732ExpensesThird party (special) inspection $20,000Hotel and per diem @ $200/day x 10 days $2,000Mileage for 4 round trips at .565/mi (275 rd trip) $650
EXPENSE ESTIMATE $22,650ALTERNATIVE 2 TOTAL SERVICES $278,292
TOTAL ALTERNATIVE 2+3 PROF SERVICES ESTIMATE $496,328Additional above Alt 2 services $218,036
TABLE 5d
Professional Service Estimate ‐ Alternative 2+3
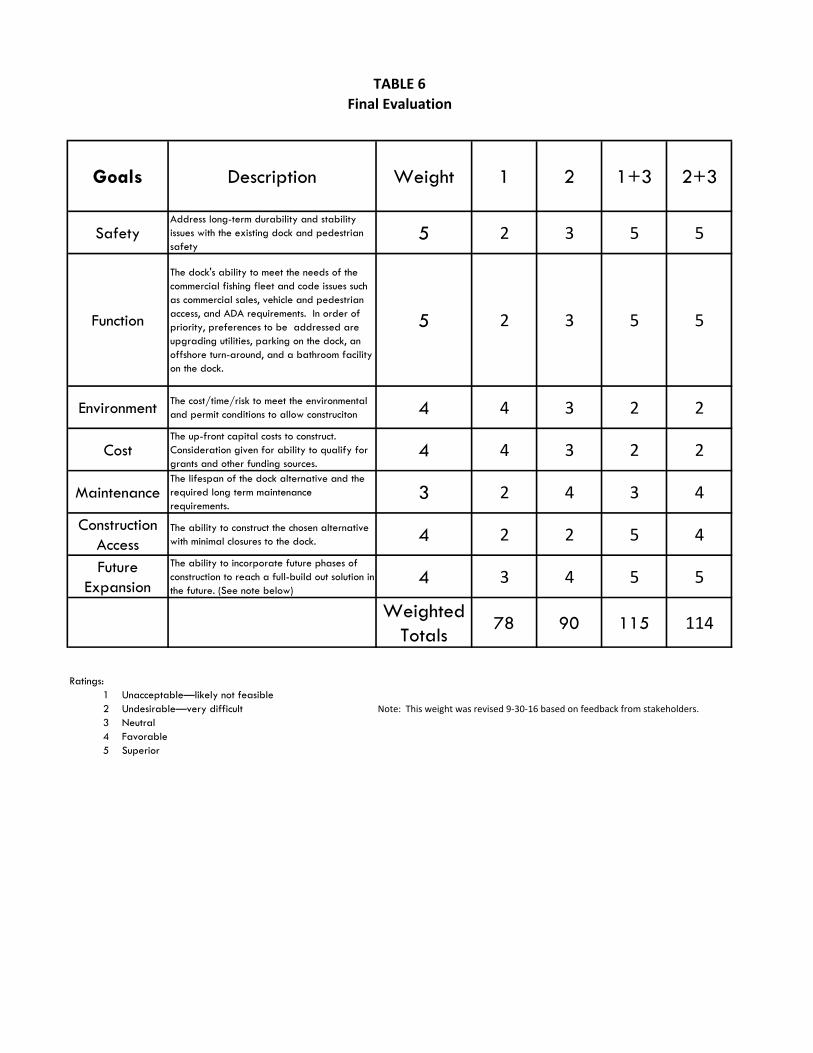
Goals Description Weight 1 2 1+3 2+3
SafetyAddress long-term durability and stability issues with the existing dock and pedestrian safety
5 2 3 5 5
Function
The dock's ability to meet the needs of the commercial fishing fleet and code issues such as commercial sales, vehicle and pedestrian access, and ADA requirements. In order of priority, preferences to be addressed are upgrading utilities, parking on the dock, an offshore turn-around, and a bathroom facility on the dock.
5 2 3 5 5
Environment The cost/time/risk to meet the environmental and permit conditions to allow construciton 4 4 3 2 2
CostThe up-front capital costs to construct. Consideration given for ability to qualify for grants and other funding sources.
4 4 3 2 2
MaintenanceThe lifespan of the dock alternative and the required long term maintenance requirements.
3 2 4 3 4
Construction Access
The ability to construct the chosen alternative with minimal closures to the dock. 4 2 2 5 4
Future Expansion
The ability to incorporate future phases of construction to reach a full-build out solution in the future. (See note below)
4 3 4 5 5
Weighted Totals
78 90 115 114
Ratings:1 Unacceptable—likely not feasible
2 Undesirable—very difficult Note: This weight was revised 9‐30‐16 based on feedback from stakeholders.
3 Neutral4 Favorable5 Superior
TABLE 6
Final Evaluation

TABLE 7 Funding Resources
FUNDING SOURCE
PROGRAM NAME
WEB ADDRESS NOTES
Oregon Economic & Community
Development (OECD)
Infrastructure Finance Division-
Load Fund
http://www.oregon4biz.com/How-We-Can-Help/Finance-Programs/
OECD Port Programs Port Revolving
http://www.orinfrastructure.org/Infrastructure-Programs/PRLF/
OECD Port Planning & Marketing
Fund
http://www.orinfrastructure.org/Infrastructure-Programs/PPM/
Oregon Department of Fish and Wildlife
Restoration and
Enhancement
http://www.dfw.state.or.us/fish/RE/
Ford Family Foundation
Rural Capital Projects
www.tfff.org
USDOT/ MARAD
Marine Transportation
System Funding
https://www.marad.dot.gov/ports/strongports/port-planning-and-investment-toolkit/funding-
strategy-module/
Multitude of possibilities
ODOT Connect Oregon
http://www.oregon.gov/ODOT/TD/TP/Pages/connector.aspx
USDOT Tiger Discretionary
Grants
https://www.marad.dot.gov/ports/office-of-port-infrastructure-development-and-congestion-
mitigation/tiger-grants/
Port received $2M in 2015

APPE
NDI
X 1

600 S. E. BAY BOULEVARD NEWPORT, OREGON 97365 (541) 265-7758 FAX (541) 265-4235
Memo
To: Don Mann
From: Pete Dale
Copy: U P D A T E D - Final - Revisions
Date: May 11, 2011l
Re: Port Dock - 5
Port Dock – 5 Inspection Survey
Port Dock-5 is a timber pile driven structure with timber decking approximately 260’ in length extending south and provides accesses the commercial fishing vessel moorage. The present age of the in-water pile structure is unknown but discussion with staff indicates that the existing Creosote support piling are in the excess of fifty years of service. Various design alterations indicate that the dock header, support stringers and timber decking has been refurbished in the last fifty years. The existing timber piles are approximately twelve to fourteen inches in diameter and support the dock structure. From the pier head on Bay Boulevard to the gangway connection, there are thirteen pile bents. Each bent is comprised of five (5) piles per bent consisting of three vertical support piles with two (2) exterior drawn or battered piles per bent. The supported timber pile caps appear to be incised treated lumber that is not Creosote treated lumber and indicates the modern replacement of the original construction. Additionally the timber deck supporting stringers are incised treated lumber, which also indicate modern replacement Service utilities are suspended beneath Port Dock-5 to provide electrical power, potable water, fire main and marine diesel to the established fuel facility. The electrical and water systems are in fair condition with no apparent critical replacements needs at this present time. These systems are definitely ageing and approaching the end of their useful life. The marine diesel piping is protective rapped, single-wall steel pipe that transverses the dock inside of a three-sided wooded pipe chase. This pipe chase run’s the entire length of the dock directly under the timber dock deck. It is very difficult to adequately survey this fuel piping, however, it is recommended that it be replaced with a modern double wall fuel system in the near future. Additionally, connected to this fuel piping system beneath the dock, there are two (2) control-stop valves that are totally inaccessible and would provide no assistance in controlling a system failure. These valves should be updated and relocated to a convenient area where immediate access is available.

600 S. E. BAY BOULEVARD NEWPORT, OREGON 97365 (541) 265-7758 FAX (541) 265-4235
The Port Dock-5 gangway connection has been identified as a priority for critical need replacement of the existing support piling and the structural support header. An in-the-water survey has been conducted to assess the over all condition of entire structure and to identify additional concerns for the structural integrity of the entire dock. The overall condition of Port Dock-5 can be assessed as fair with substantial deterioration. At the present time certain identifiable portions are extensively decayed and very near to the end of their useful life. Recent low tides have allowed the inspection of the shallow water piles and their associated structural members. The thirteen support bents contain approximately 65 Creosote piles of which 34 piles are structurally compromised by various conditions of deterioration. These conditions include center core rot, open penetration rot, water logged and punky wood, large splits and open cracks with other conditions associated with serious deterioration. These conditions contribute to an overall compromise of 52% of the piling with a significant amount of piling in structural failure. The pile cap headers and timber deck stringers appear to be in good condition with the exception of the gangway connection headed that is in need of replacement. The existing timber decking appears to be in fair condition. Virtually all of the cross bracing has deteriorated to the extent of failure or renders little or no cross support which contributes to the structural instability of the dock. Physical movement of the dock can be experienced from motor vehicle movement across the dock. Considering the age and environmental exposure, it is speculated that a considerable amount of support piling has deteriorated and is contributing to the instability of the dock. The replacement of the cross bracing is recommended if solid piling can be utilized for structural anchor points. My opinion is that a major replacement effort will be necessary within five years to avoid an eminent structural failure. Other recommendations include the removal of excess bearing weight by removing unused buildings and restricting motor vehicle traffic out onto the dock. A definite future plan for replacement is necessary.

APPE
NDI
X 2
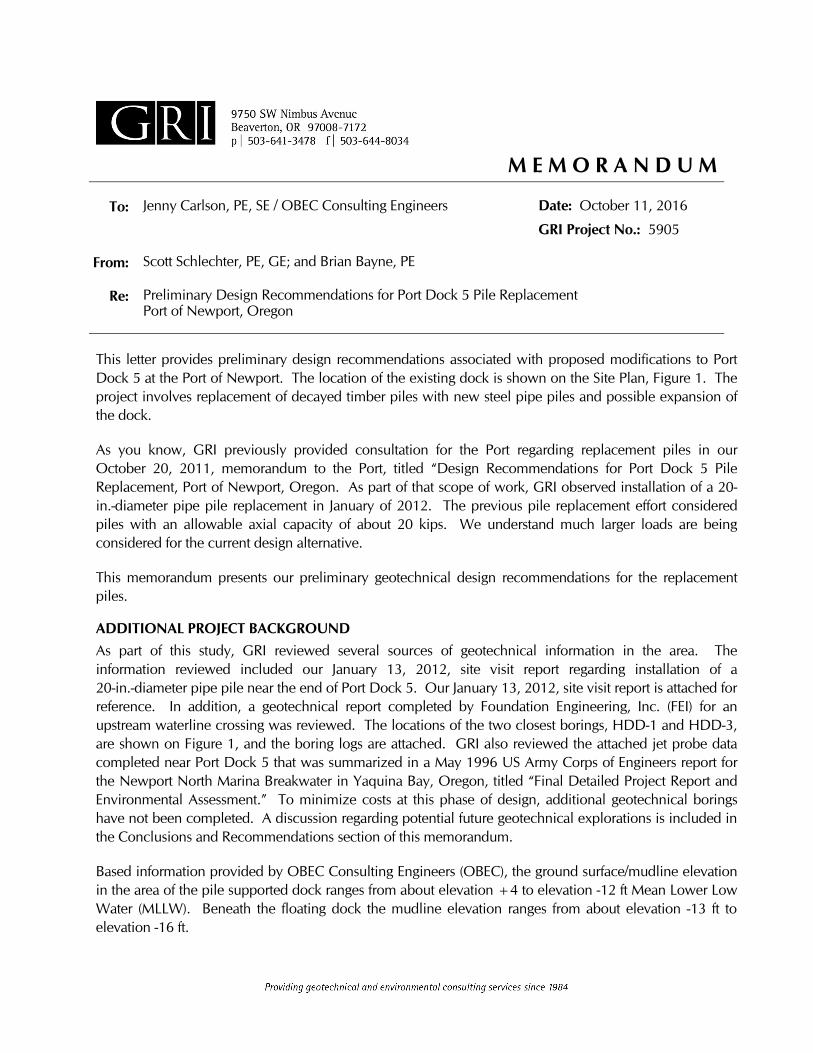
M E M O R A N D U M
To: Jenny Carlson, PE, SE / OBEC Consulting Engineers Date: October 11, 2016
GRI Project No.: 5905 From: Scott Schlechter, PE, GE; and Brian Bayne, PE
Re: Preliminary Design Recommendations for Port Dock 5 Pile Replacement Port of Newport, Oregon
This letter provides preliminary design recommendations associated with proposed modifications to Port Dock 5 at the Port of Newport. The location of the existing dock is shown on the Site Plan, Figure 1. The project involves replacement of decayed timber piles with new steel pipe piles and possible expansion of the dock.
As you know, GRI previously provided consultation for the Port regarding replacement piles in our October 20, 2011, memorandum to the Port, titled “Design Recommendations for Port Dock 5 Pile Replacement, Port of Newport, Oregon. As part of that scope of work, GRI observed installation of a 20-in.-diameter pipe pile replacement in January of 2012. The previous pile replacement effort considered piles with an allowable axial capacity of about 20 kips. We understand much larger loads are being considered for the current design alternative.
This memorandum presents our preliminary geotechnical design recommendations for the replacement piles.
ADDITIONAL PROJECT BACKGROUND
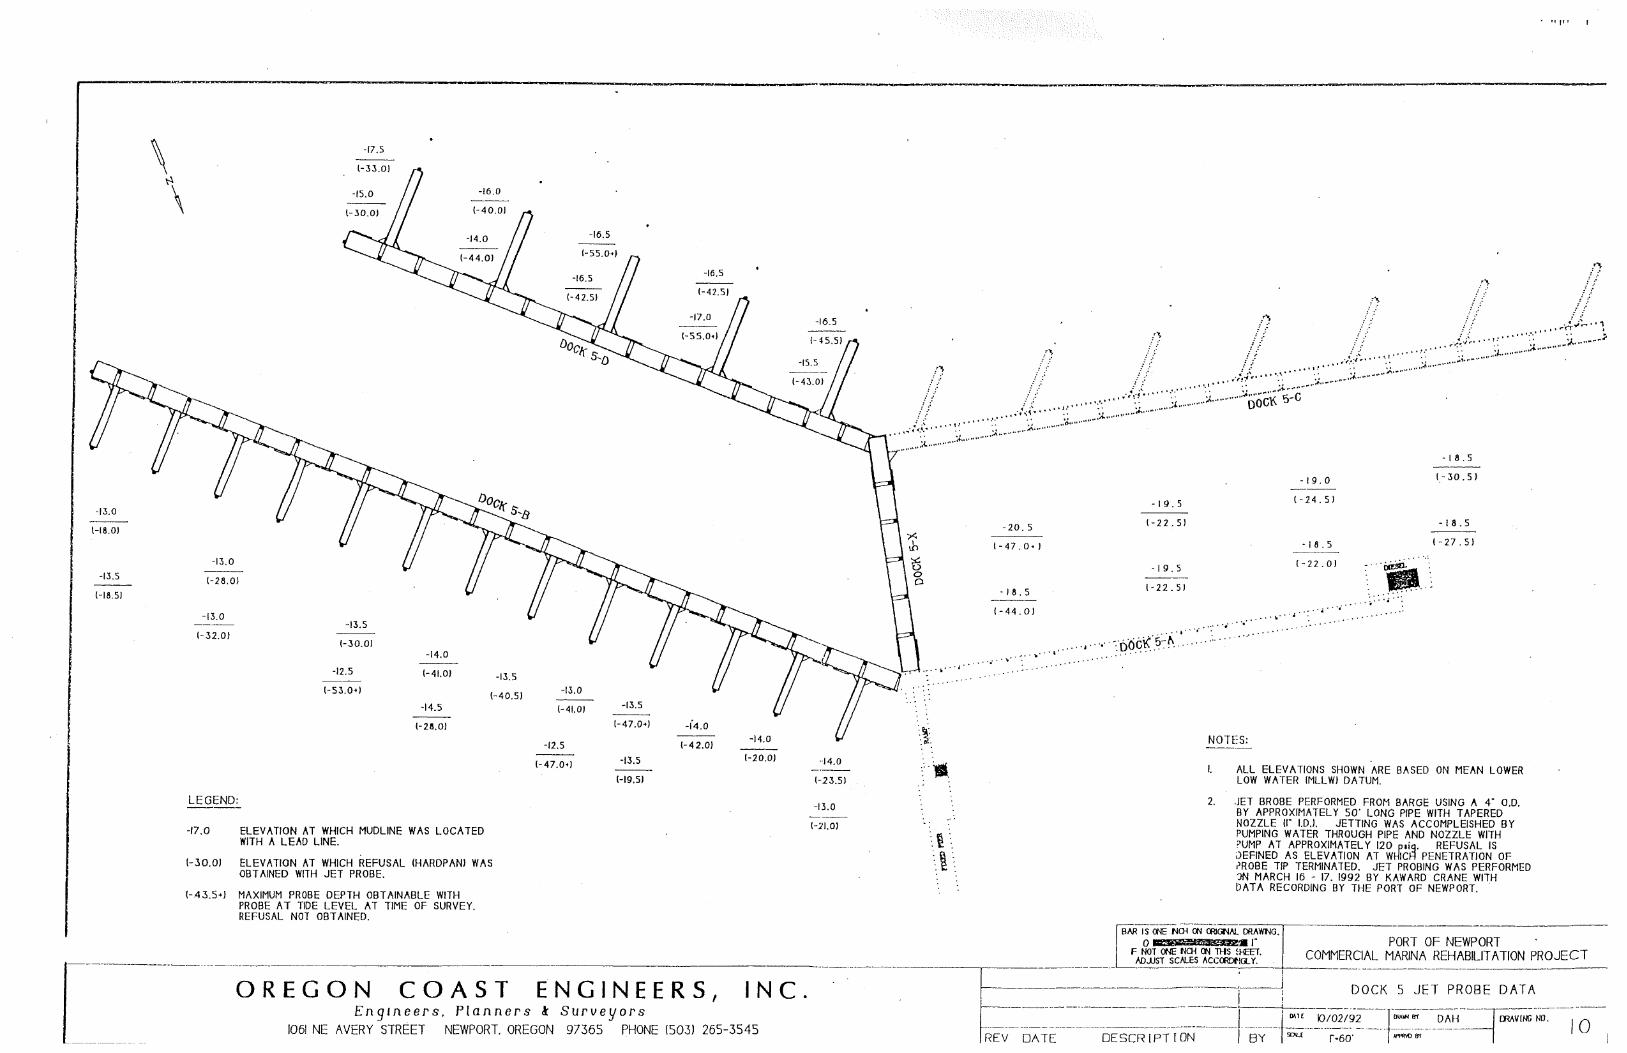
As part of this study, GRI reviewed several sources of geotechnical information in the area. The information reviewed included our January 13, 2012, site visit report regarding installation of a 20-in.-diameter pipe pile near the end of Port Dock 5. Our January 13, 2012, site visit report is attached for reference. In addition, a geotechnical report completed by Foundation Engineering, Inc. (FEI) for an upstream waterline crossing was reviewed. The locations of the two closest borings, HDD-1 and HDD-3, are shown on Figure 1, and the boring logs are attached. GRI also reviewed the attached jet probe data completed near Port Dock 5 that was summarized in a May 1996 US Army Corps of Engineers report for the Newport North Marina Breakwater in Yaquina Bay, Oregon, titled “Final Detailed Project Report and Environmental Assessment.” To minimize costs at this phase of design, additional geotechnical borings have not been completed. A discussion regarding potential future geotechnical explorations is included in the Conclusions and Recommendations section of this memorandum.
Based information provided by OBEC Consulting Engineers (OBEC), the ground surface/mudline elevation in the area of the pile supported dock ranges from about elevation +4 to elevation -12 ft Mean Lower Low Water (MLLW). Beneath the floating dock the mudline elevation ranges from about elevation -13 ft to elevation -16 ft.

2
Geology
Relatively shallow interbedded alluvial deposits of sand and silt typically mantle the north side of the bay. Miocene-age siltstone and sandstone of the Nye Formation underlie the alluvial deposits (Snavely, et. al 1972). Upland areas north of the proposed pile replacement are commonly mantled with loose to medium dense sand, gravel, and silt fill. Borings in the area indicate the uppermost surface of the siltstone or sandstone is typically highly weathered and in places has weathered completely to a residual silt soil. Based on our experience in the area, the depth, degree of weathering, and relative consistency or hardness of the underlying siltstone all tend to be highly variable.
CONCLUSIONS AND RECOMMENDATIONS General
We understand the decayed timber piles will likely be replaced with18-in.-diameter, or larger, steel pipe piles. The recommendations in this report have been provided for 18-in.-diameter piles and the design parameters should be updated during final design if larger pile diameters are utilized. We anticipate the piles will be driven through shallow, potentially liquefiable, alluvial soils into the underlying residual soil or siltstone layer. The assumed depth and variable weathering and hardness of this unit will be a significant design and construction consideration. Preliminary pile design recommendations are included in the sections below.
Seismic Design Considerations
Code-Based Response Spectrum. Because of the potential public use of the facility, we understand the dock improvements will be designed in accordance with the 2012 International Building Code (IBC) and 2014 Oregon Structural Specialty Code, which incorporates recommendations from the ASCE 7-10, Minimum Design Loads for Building and Other Structures. The 2012 IBC and ASCE 7-10 seismic hazard levels are based on a Risk-Targeted Maximum Considered Earthquake (MCER). The ground motion associated with the probabilistic MCER represents a targeted risk level of 1% in 50 years probability of collapse in the direction of maximum horizontal response. In general, these risk-targeted ground motions are developed by applying adjustment factors of directivity and risk coefficients to the 2% probability of exceedance in 50 years, or 2,475-year return period hazard level, ground motion developed from the 2008 U.S. Geological Survey (USGS) probabilistic seismic hazard maps. The risk-targeted probabilistic values are also subject to a deterministic limit. The maximum horizontal direction spectral response accelerations were obtained from the USGS Seismic Design Maps (SDM) for the coordinates of 44.6316° N latitude and 124.0481° W longitude. The SS and S1 parameters identified for the site are 1.71 and 0.76 g, respectively. These bedrock spectral ordinates are adjusted for Site Class with the 0.2- and 1.0-second period site coefficients, Fa and Fv, based on subsurface conditions or with a site-specific response analysis. The design-level response spectrum is calculated as two-thirds of the Site Class-adjusted MCER-level spectrum.
Our analysis has identified a potential risk of liquefaction at the site. In accordance with ASCE 7-10, sites with subsurface conditions identified as vulnerable to failure or collapse, such as liquefied soils, are classified as Site Class F. For Site Class F sites, ASCE 7-10 Section 20.3 requires completion of a site-specific ground motion analysis unless the structures have a fundamental period of vibration less than or equal to 0.5 second. The response spectrum for sites with structures having a fundamental period less than 0.5 second can be derived using the non-liquefied subsurface profile. Based on discussions with OBEC, the project’s structural engineer, the fundamental period of vibration for the dock will be about 0.5 second. Therefore, in accordance with the results of subsurface investigations in the area, Site Class D is

3
appropriate for seismic design of the structure. In this regard, the code-based Fa and Fv coefficients for Site Class D can be used to estimate the ground surface risk-targeted maximum considered earthquake (MCER) spectrum. The spectra are based on a damping ratio of 5%. The MCER- and design-level response spectra parameters are tabulated below.
2014 OSSC SEISMIC DESIGN RECOMMENDATIONS
Seismic Parameter
Recommended Value
Site Class D
MCER 0.2-Second Period Spectral Response Acceleration, SMS 1.71 g
MCER 1-Second Period Spectral Response Acceleration, SM1
1.15 g
Design-Level 0.2-Second Period Spectral Response Acceleration, SDS
1.14 g
Design-Level 1-Second Period Spectral Response Acceleration, SD1 0.76 g
Liquefaction. Liquefaction is a process by which saturated granular materials, such as sand, and non-plastic and low-plasticity silts, temporarily lose strength during and immediately after a seismic event. Liquefaction occurs as seismic shear stresses propagate through saturated soil and distort the soil structure causing loosely packed groups of particles to contract or collapse. If drainage is impeded and cannot occur quickly, the collapsing soil structure increases the pore water pressure between the soil grains, resulting in a temporary reduction or loss of soil strength and significant post-earthquake ground surface settlement. In waterfront areas, liquefaction can also cause large lateral spreading deformation of the existing banks. The risk of liquefaction-induced lateral spreading at the site is discussed in the Lateral Spreading section of this memorandum.
The risk of liquefaction is typically evaluated using a simplified procedure that compares the earthquake-induced cyclic shear stresses within the soil profile to the ability of the soils to resist these stresses. The cyclic stresses induced within the soil profile are typically estimated on the basis of earthquake magnitude (Mw) and peak ground acceleration (PGA). The ability of the soils to resist cyclic stresses is commonly based on their shear strength as characterized by Standard Penetration Test (SPT) N-values or cone penetration test (CPT) probe tip resistances. The cyclic resistance of fine-grained soils, such as silt and clay, requires consideration of other factors, such as undrained shear strength, soil plasticity, overconsolidation ratio, and site-specific cyclic testing, when appropriate.
The potential for liquefaction at the site was evaluated using the procedure recommended by Boulanger and Idriss (2014), which utilizes the peak ground acceleration (PGA) to predict cyclic shear stresses induced within the soil. In accordance with ASCE 7-10 Section 11.8.3, the PGA used in liquefaction hazard evaluation is to be consistent with the Maximum Considered Earthquake Geometric Mean (MCEG) PGA. The mapped MCEG PGA is provided on Figure 22-7 of ASCE 7-10. The mapped MCEG on Figure 22-7 is based on the 2008 USGS SDM and reflects a seismic hazard of 2% probability of exceedance in 50 years. The mapped bedrock MCEG PGA and Site Class D, code-based adjusted peak ground acceleration for the site are both 0.83 g.

4
Based on the 2008 USGS interactive deaggregations, Cascade Subduction Zone ground motions provide the most significant contribution to the probabilistic seismic hazard at the site. For liquefaction studies, a magnitude M9.0 earthquake with peak ground acceleration PGAM of 0.83 g and a water table at mean sea level was assumed.
For our liquefaction studies we assumed the siltstone is overlain by 10 ft of sand with an average SPT N-value of 10 blows/ft. Our analysis indicates the loose to medium dense sand located below the groundwater table to the top of the siltstone are susceptible to liquefaction during ground motions associated with the PGAM defined by ASCE 7-10. Our analysis indicates the potential for up to 3 in. of liquefaction-induced settlement near the end of the dock.
Lateral Spreading. Lateral spreading involves the horizontal displacement of large volumes of soil as a result of seismically induced liquefaction and inertial loading. Lateral spreading can develop on shallow sloping ground or near a moderately to steeply sloping free face, such as a river channel. Differential internal movements within the spreading mass usually create surface features, such as ground cracks or fissures, scarps, and grabens in overlying unsaturated or non-liquefied soils. Lateral displacement may range from a few inches to many feet depending on soil conditions, the steepness of the slope, and the magnitude, duration, and source-to-site distance of the earthquake. Associated differential vertical movements, or ground surface subsidence, may range up to about half of the total horizontal movement.
The methods presented by Youd, et al. (2002) were utilized to evaluate the risk of lateral spreading at the site. In the Youd, et al. methodology, earthquake magnitude and distance, slope geometry, and the thickness and material characteristics of the liquefiable layers are required input parameters. The lateral spreading estimates were completed using the same earthquake sources, magnitudes, and PGA’s considered for the liquefaction analyses. The results of our analysis indicate lateral spreading deformations occurring at the top of the slope will be significant (greater than several feet) during a design-level earthquake. To further refine lateral spreading estimates, additional geotechnical explorations should be considered.
Design Alternatives for Lateral Displacement Forces. Earthquake-induced damage to waterfront structures at sites with liquefiable soils is well documented. Stresses induced on piles are typically generated from the inertial mass of the structure and lateral soil loading from both the lateral spreading liquefied soils and the non-liquefied crust of soil generally present above the groundwater table. Case histories have shown that the forces or displacements induced by the non-liquefied soil crust are generally significantly larger than the forces generated from the liquefied soils with reduced strengths. Design for the lateral spreading soils is typically completed by application of estimated soil displacements and/or forces to the structure. A purely force based approach is applied if the structure is essentially rigid and cannot accommodate the estimated lateral movement. The displacement approach is commonly applied if the structure is sufficiently flexible and can accommodate the estimated deformation without structurally failing. The displacement approach is a somewhat iterative analysis and typically involves analyzing the structure as it deforms with increasing applied lateral loads up to the maximum estimated lateral soil displacements or maximum lateral load.
As an alternative to designing the structure to accommodate large forces and/or displacements due to lateral spreading, the potentially liquefiable soils could be improved with ground improvement methods. However, based on discussions with the design team, ground improvement is not being considered due to
5
relatively high costs and permitting constraints. We understand the dock will be designed with a force based approach to meet life-safety requirements. Additional discussion of seismically induced lateral earth pressures under lateral spreading loads is provided in the Seismic Lateral Earth Pressures section of the report.
Tsunami and Other Seismic Hazards. Tsunami hazard maps provided by the State of Oregon Department of Geology and Mineral Industries (DOGAMI) indicate the site is located within the potential tsunami inundation zone (DOGAMI, 2012). Based on the results of this study and our experience with similar sites, in our opinion, there is a high risk of tsunami inundation at the site following a Cascadia Subduction Zone earthquake. The DOGAMI 2012 mapping effort also estimates subsidence along the Oregon Coast as a result of varying Cascadia Subduction Zone earthquake scenarios and some subsidence should be anticipated during a Cascadia event. The site is located within about 1/2 km from the inferred location of the Yaquina Bay fault which is not well defined but is considered potentially active in the current USGS seismic hazard mapping estimate.
Seismic Lateral Earth Pressures
As previously discussed, liquefaction-induced deformations toward the bay will result in large soil forces acting on the structure. Figure 2 provides lateral pressure criteria that may be used to analyze the piles for lateral spreading loads during a seismic event. We have estimated the earth pressure from the non-liquefied fill (above water level) may be computed using an equivalent fluid having a unit weight of 350 pcf. The passive pressure will act over two pile diameters for pile sections above the water level, assumed at Mean Sea Level for design. An equivalent fluid weight of 35 pcf will act over one pile diameter for pile sections below Mean Sea Level to elevation -14 ft (MLLW). This pressure is based on 30 percent of the total overburden pressure as outlined in Japanese Road Association methodology (Yokoyama, et al., 1997).
Pile Design Considerations
Axial Capacity. The previous pile replacements completed in 2012 assumed maximum allowable capacities of about 20 kips. Based on correspondence with OBEC, we understand the axial loading for the new piles is currently unknown but may require much larger design loads. Based on our experience in the area, we estimate that open- or closed-end, 18-in.-diameter piles driven into the underlying siltstone with an adequately sized hammer can develop allowable compressive capacities on the order of 120 tons. Piles should have a minimum center-to-center spacing of at least three pile diameters. The actual pile penetration required to achieve this capacity is difficult to predict due to the significant variations in the weathering and hardness of the siltstone and the lack of explorations at the proposed pile location area. However, based on our experience in the area, we anticipate 18-in.-diameter open-end pipe piles will obtain the 120 ton allowable capacity with embedment of about 30 ft into the underlying siltstone. We have estimated closed-end pipe piles will likely obtain the capacity with embedment of about 20 to 25 ft into the underlying siltstone. The allowable capacity and anticipated embedments assume a factor of safety of at least 2 based on soil support considerations. We do not anticipate strength loss will occur in the siltstone during a design-level earthquake, therefore, a one-third increase above the allowable capacity can be used to evaluate seismic loads. Somewhat larger capacities or smaller embedment depths may be achievable if 24-in.-diameter piles are utilized.
The allowable pile capacities and anticipated embedment provided above are based on pile load testing completed for a nearby site. Due to the known variability in weathering and hardness of siltstone in the

6
area, we recommend considering an indicator pile program to better evaluate the pile capacities and range of embedment lengths. The indicator pile program could involve installing piles at separate ends of the dock to better evaluate changes in subsurface conditions. Practical refusal criteria should be developed based on the proposed impact hammer and driving observations during initial installation. As an alternative, it may be prudent to consider geotechnical explorations to further evaluate the subsurface conditions.
We understand the piles may be subjected to uplift loading during a seismic event. We recommend using an allowable pile adhesion of 500 psf in the siltstone for resistance to uplift loading. The allowable adhesion is based on a factor of safety of 1.5.
The piles can be installed with an impact hammer or combination of vibratory hammer and impact hammer capable of driving the pile to the desired penetration without damaging the pile. We anticipate a suitably sized vibratory hammer can be used to install the open-end pipe piles to a minimal embedment into the siltstone before encountering practical refusal. We recommend installing the 18-in.-diameter pipe piles with an air or diesel hammer developing a minimum rated energy of 90,000 ft-lbs and capable of driving the piles to the desired capacity without damaging the piles. To avoid damage to the pile during installation, driving stresses should not exceed 0.9 Fy for steel piles. Due to potential hard driving conditions, the open ended pipe piles should be fitted with a driving or cutting shoe that mounts flush with the outside of the pile (inside cutting shoe).
A description of the proposed pile driving equipment and accessories to be used for the production piles should be provided to the geotechnical engineer for review prior to mobilizing the equipment to the site. We also recommend that a continuous record of the driving resistance (blows/ft or blows/in.) for each pile driven be maintained at the time of installation for the full depth of pile penetration. We recommend the geotechnical engineer observe or review all pile installation.
Lateral Capacity. Lateral structural loads can be resisted by the piles in bending. The lateral load behavior of the piles can be analyzed using the computer program LPILE by Ensoft, Inc. We recommend using the input parameters summarized in the following table to model the soils at the site. A range of weak rock properties has been presented to evaluate the variability of the underlying siltstone. As indicated in the table, we have assumed no lateral soil resistance in the zone of lateral spreading during a seismic event due to the large estimated soil movements. In addition, the lateral spreading loads provided in Figure 2 need to be considered for the seismic lateral pile design.
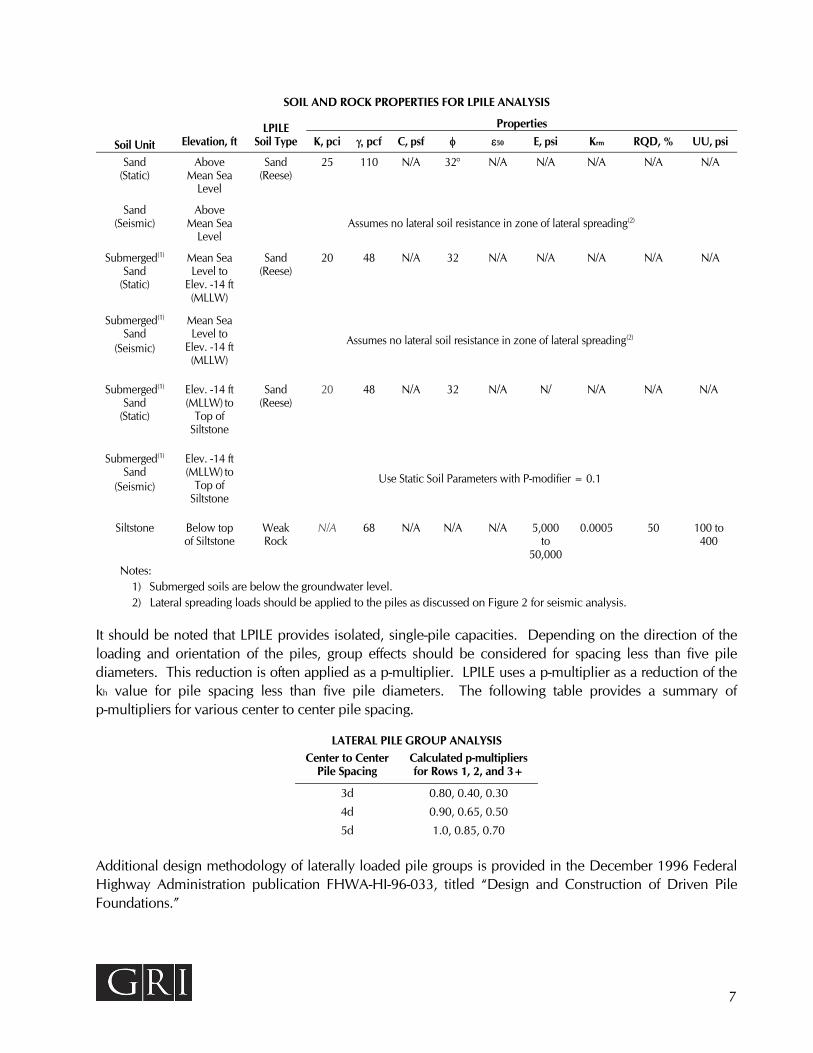
7
SOIL AND ROCK PROPERTIES FOR LPILE ANALYSIS
LPILE Soil Type
Properties
Soil Unit Elevation, ft K, pci pcf C, psf 50 E, psi Krm RQD, % UU, psi
Sand (Static)
Above Mean Sea
Level
Sand (Reese)
25 110 N/A 32 N/A N/A N/A N/A N/A
Sand (Seismic)
Above Mean Sea
Level Assumes no lateral soil resistance in zone of lateral spreading(2)
Submerged(1) Sand
(Static)
Mean Sea Level to
Elev. -14 ft (MLLW)
Sand (Reese)
20 48 N/A 32 N/A N/A N/A N/A N/A
Submerged(1) Sand
(Seismic)
Mean Sea Level to
Elev. -14 ft (MLLW)
Assumes no lateral soil resistance in zone of lateral spreading(2)
Submerged(1)
Sand (Static)
Elev. -14 ft (MLLW) to
Top of Siltstone
Sand (Reese)
20 48 N/A 32 N/A N/ N/A N/A N/A
Submerged(1)
Sand (Seismic)
Elev. -14 ft (MLLW) to
Top of Siltstone
Use Static Soil Parameters with P-modifier = 0.1
Siltstone Below top
of Siltstone Weak Rock
N/A 68 N/A N/A N/A 5,000 to
50,000
0.0005 50 100 to 400
Notes: 1) Submerged soils are below the groundwater level. 2) Lateral spreading loads should be applied to the piles as discussed on Figure 2 for seismic analysis.
It should be noted that LPILE provides isolated, single-pile capacities. Depending on the direction of the loading and orientation of the piles, group effects should be considered for spacing less than five pile diameters. This reduction is often applied as a p-multiplier. LPILE uses a p-multiplier as a reduction of the kh value for pile spacing less than five pile diameters. The following table provides a summary of p-multipliers for various center to center pile spacing.
LATERAL PILE GROUP ANALYSIS Center to Center Pile Spacing
Calculated p-multipliers for Rows 1, 2, and 3+
3d 0.80, 0.40, 0.30
4d 0.90, 0.65, 0.50
5d 1.0, 0.85, 0.70
Additional design methodology of laterally loaded pile groups is provided in the December 1996 Federal Highway Administration publication FHWA-HI-96-033, titled “Design and Construction of Driven Pile Foundations.”
8
Renews 06/2017
LIMITATIONS
This memorandum has been prepared to aid the design team in the preliminary design of the replacement piles for this project. The scope is limited to the specific project and location described herein, and our description of the project represents our understanding of the significant aspects of the project relevant to the replacement piles. As project plans develop, we should be given the opportunity to review the changes and to modify or reaffirm the conclusions and recommendations of this memorandum in writing.
The conclusions and recommendations submitted in this memorandum are based on the subsurface information developed primarily by others for nearby projects. With respect to the work performed by others, we did not participate in the implementation of the work and did not independently verify the accuracy or completeness of the information provided. We make no representations or warranty regarding instruments of service completed by others.
We appreciate the opportunity to work with you on this project. Please contact the undersigned if you have any questions.
Submitted for GRI, Scott M. Schlechter, PE, GE, D.PE Brian Bayne, PE Principal Senior Engineer
References: Boulanger, R.W., and Idriss, I.M. 2014, CPT and SPT based liquefaction triggering procedures, Report No. UCD/CGM-14/01,
Center for Geotechnical Modeling, Department of Civil and Environmental Engineering, University of California, Davis, CA, pp. 134.
DOGAMI Tsunami Inundation Map, 2012, TIM-Linc-00, Newport North, Oregon Department of Geology and Mineral Industries.
Idriss, I.M., and Boulanger, R.W., 2008, Soil liquefaction during earthquakes: Earthquake Engineering Research Institute (EERI), MNO-12 p. 226.
U.S. Geological Survey, 2015, Probabilistic hazard lookup by latitude, longitude, accessed 09/29/16, from USGS website: https://geohazards.usgs.gov/deaggint/2008/
Snavely, P.D., MacLeod, N.S., and Wagner, H.C., 1972, Preliminary bedrock geologic map of the Yaquina and Toledo quadrangles, Oregon. U.S. Geological Survey OF-72-352, scale 1:48,000.
Yokoyama, K., Tamura, K., and Matsuo, O., 1997, Design Methods of Bridge Foundations against Soil Liquefaction and Liquefaction-induced Ground Flow: Proc. 2nd Italy-Japan Workshop on Seismic Design and Retrofit of Bridges, Rome, Italy, pp. 109-131.
Youd, T.L., Hansen, C.M., and Bartlett, S.F., December 2002, Revised multilinear regression equations for prediction of lateral spread displacement:: ASCE Journal of Geotechnical and Geoenvironmental Engineering, Vo. 128, No. 12.
5905 REPLACEMENT PILE DESIGN MEMO
This document has been submitted electronically.
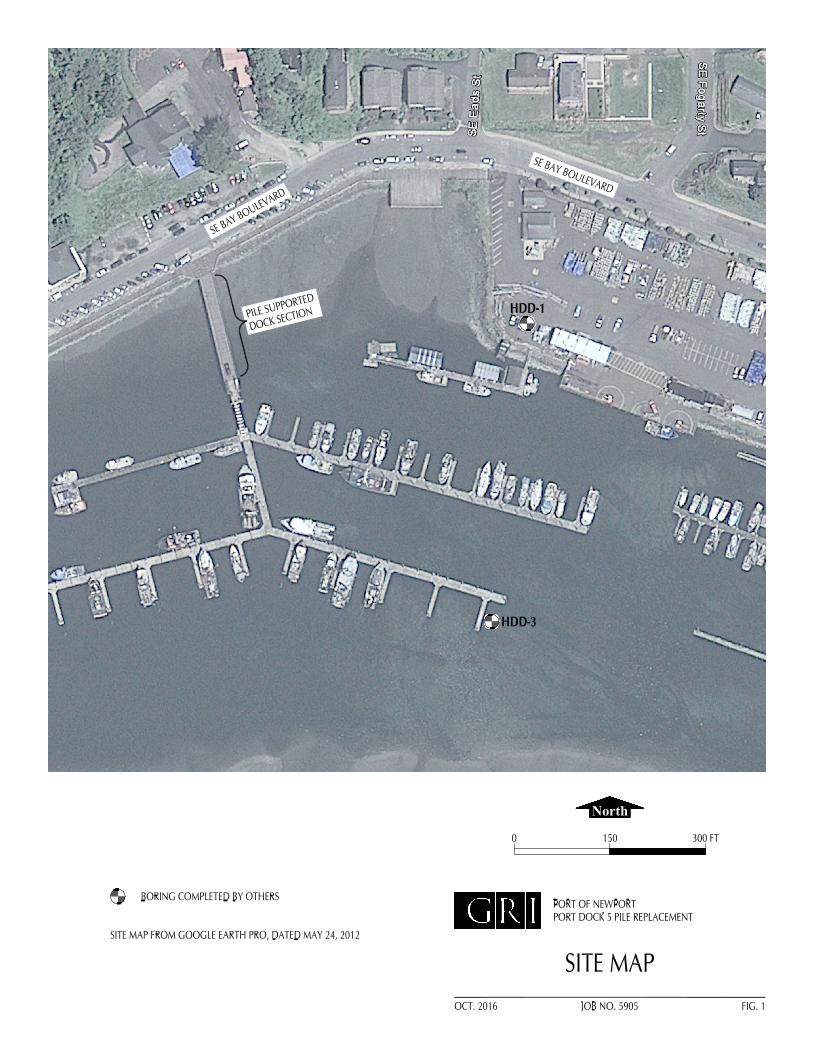
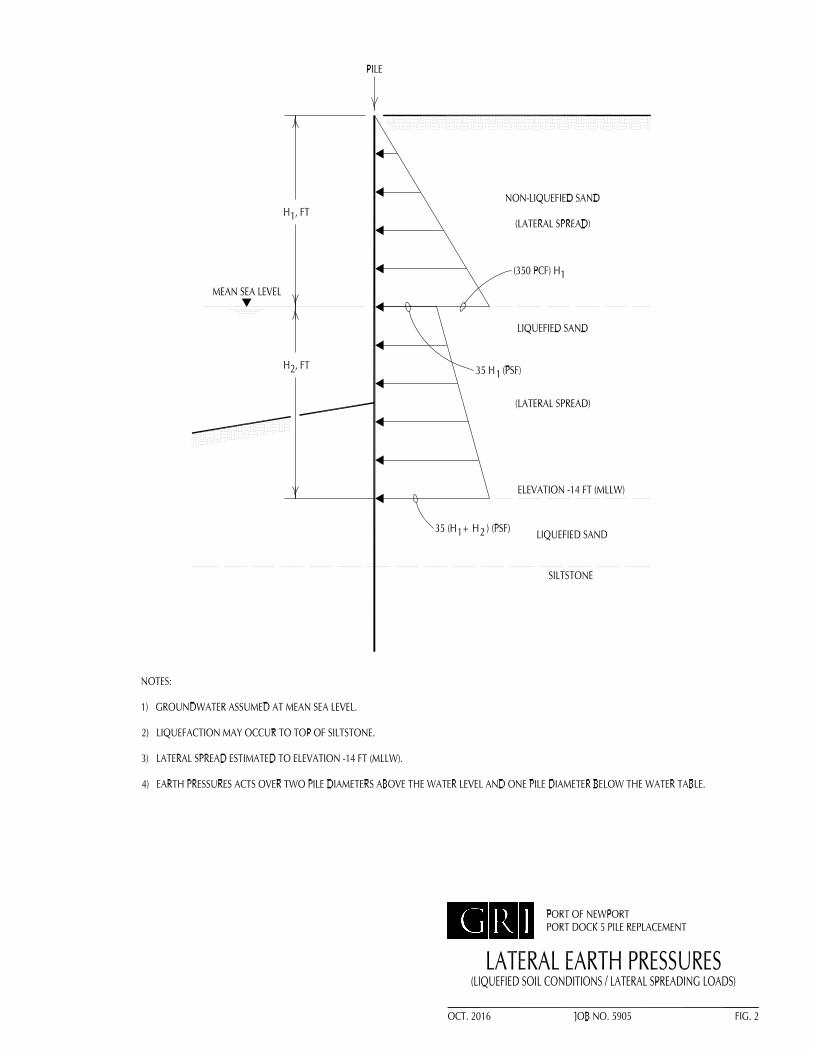

January 13, 2012 Site Visit Report
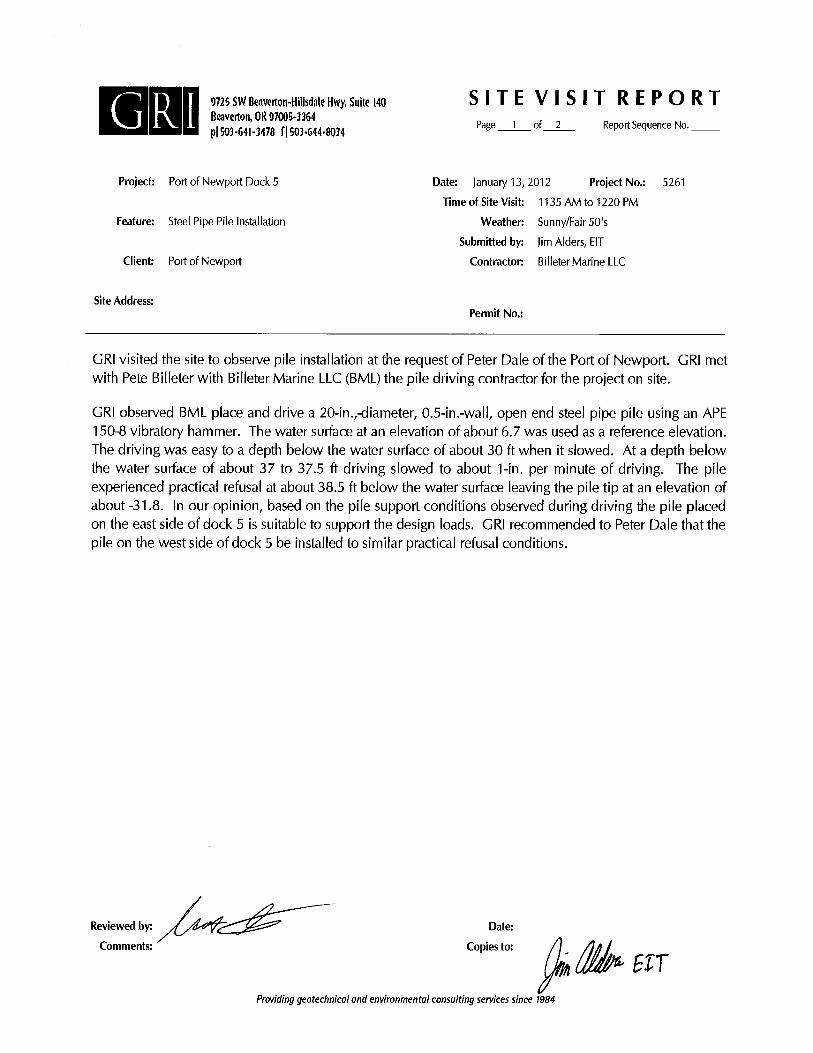
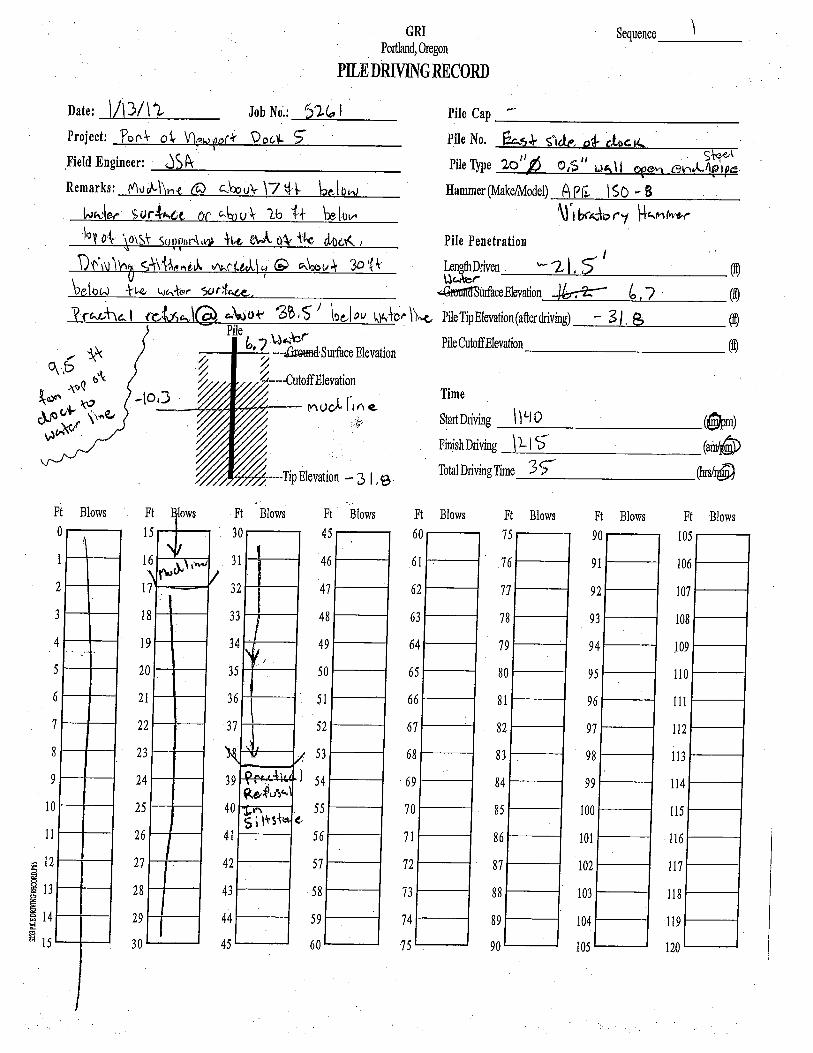

Previous Explorations
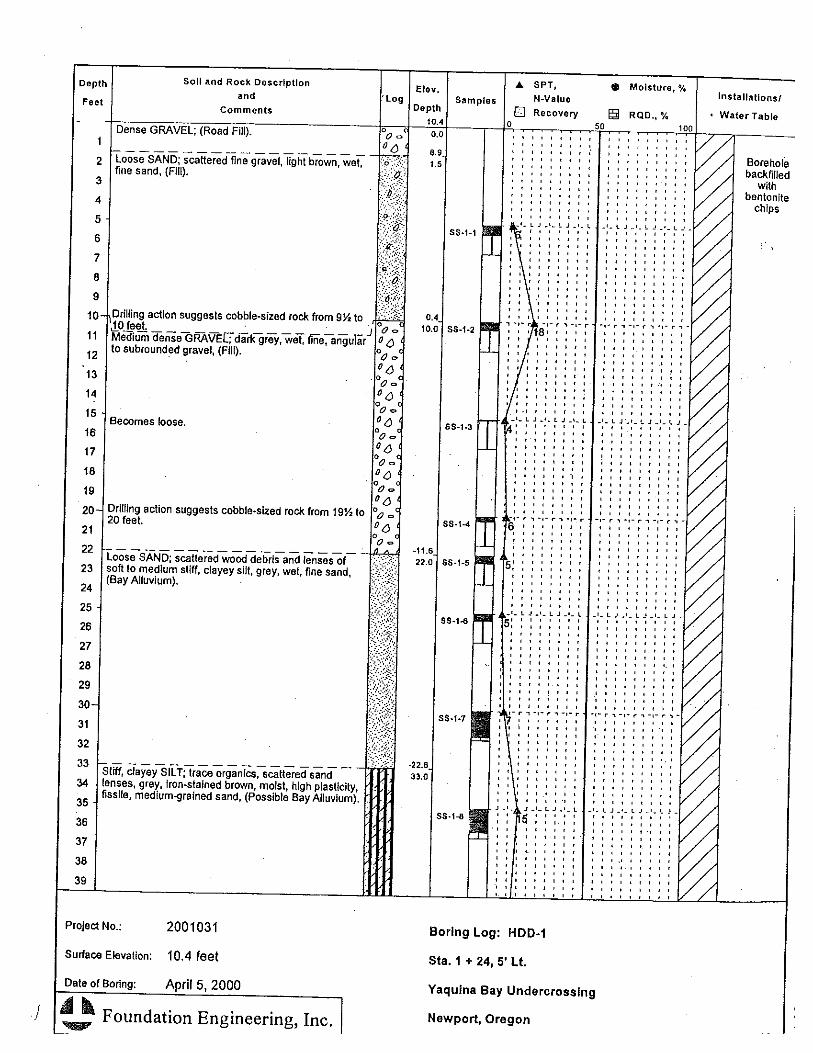
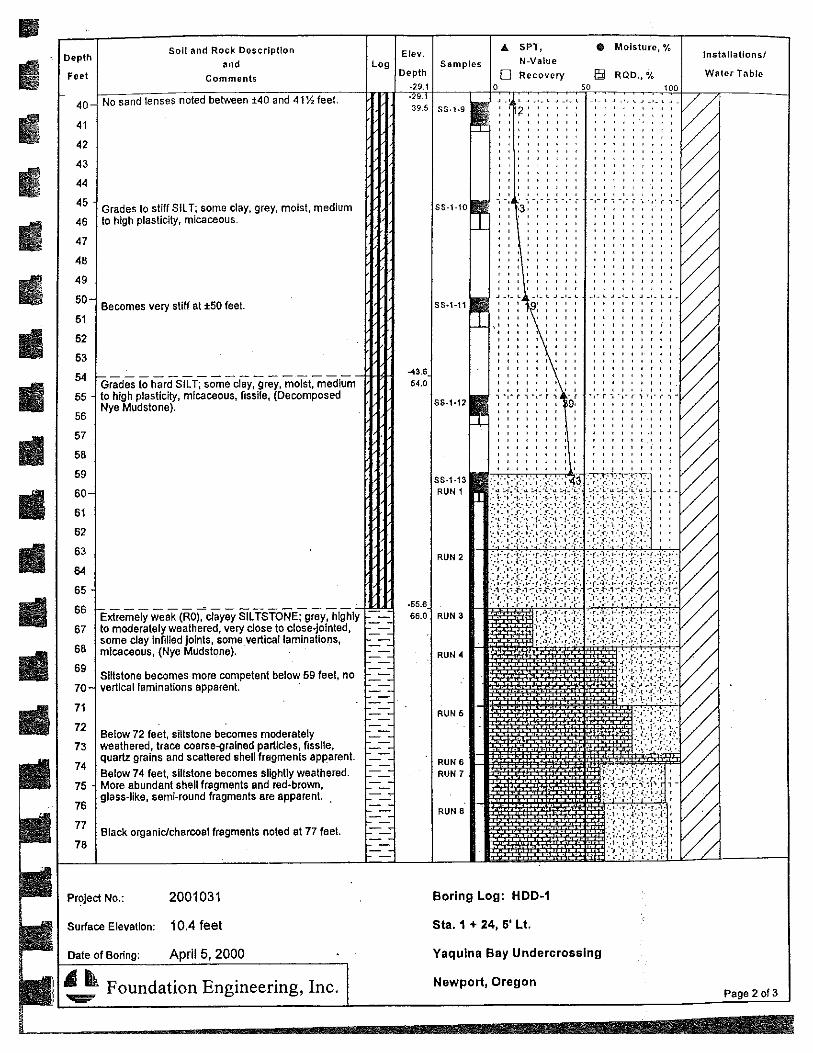

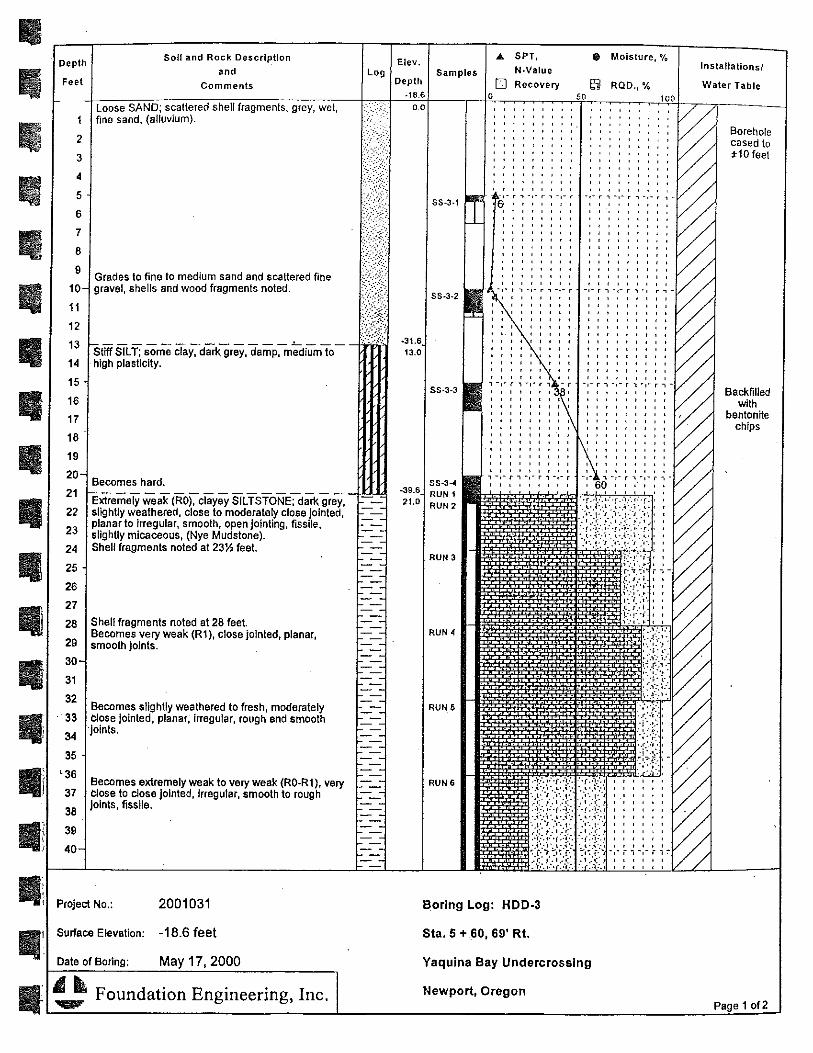
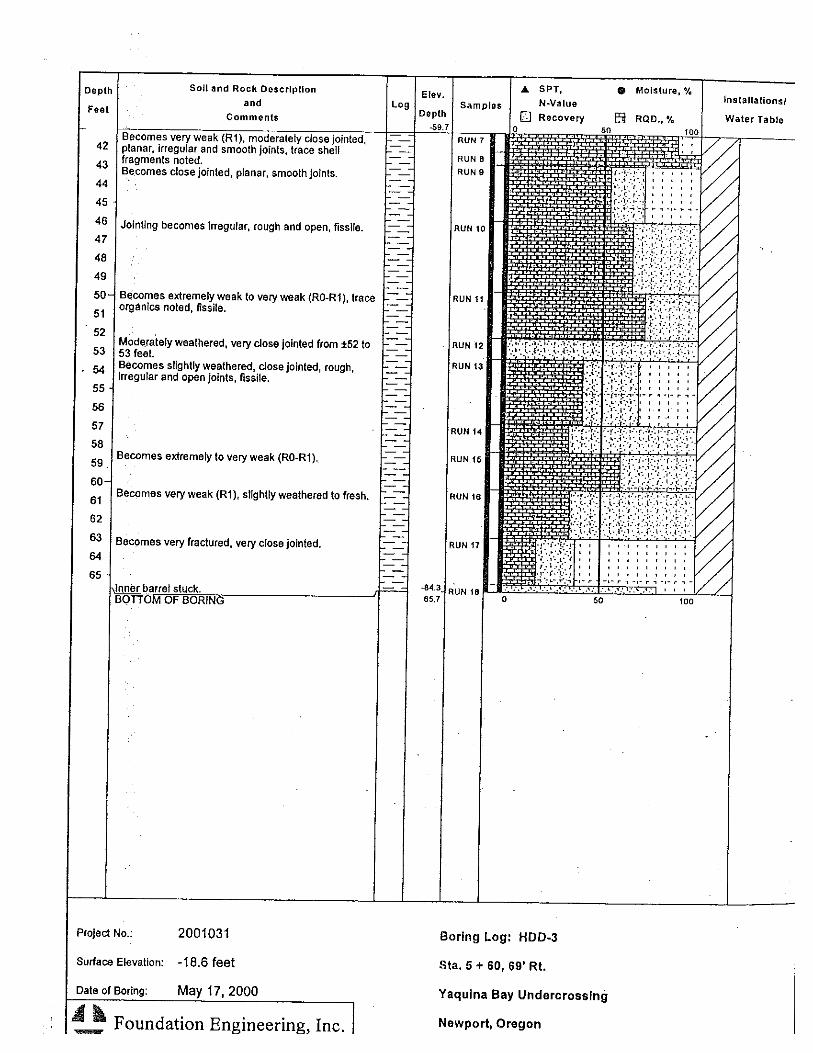


Dock 5 Jet Probe Data