port houston updateacechouston.org/wp-content/uploads/2012/02/port-of... · source: lee nichols,...
TRANSCRIPT

Port Houston UpdateRich Byrnes | Chief Infrastructure Officer | Port Houston
February 12, 2019

PORT HOUSTON | 1
Discussion Topics
• Port Houston 2018 Highlights• Focus: Houston Ship Channel• Development Plans

PORT HOUSTON | 2
Breakfast!

PORT HOUSTON | 3
Lots of Work Behind the Scenes

PORT HOUSTON | 4
Economic Activity

PORT HOUSTON | 5
Port Houston…Behind the Scenes

PORT HOUSTON | 6
1899

PORT HOUSTON | 7
2019

PORT HOUSTON | 8
Port Houston’s Success:Growth supported by Innovation
Container TEU's x 100,000’s
Texas Population, Millions1920 1940 1960 1980 2000 2018
Total POH Cargo x 10 Millions
5
10
15
20
25
0
-45
-40
-35
-30
-25
Ship Channel Depth, feet (right axis)
PORT HOUSTON | 9
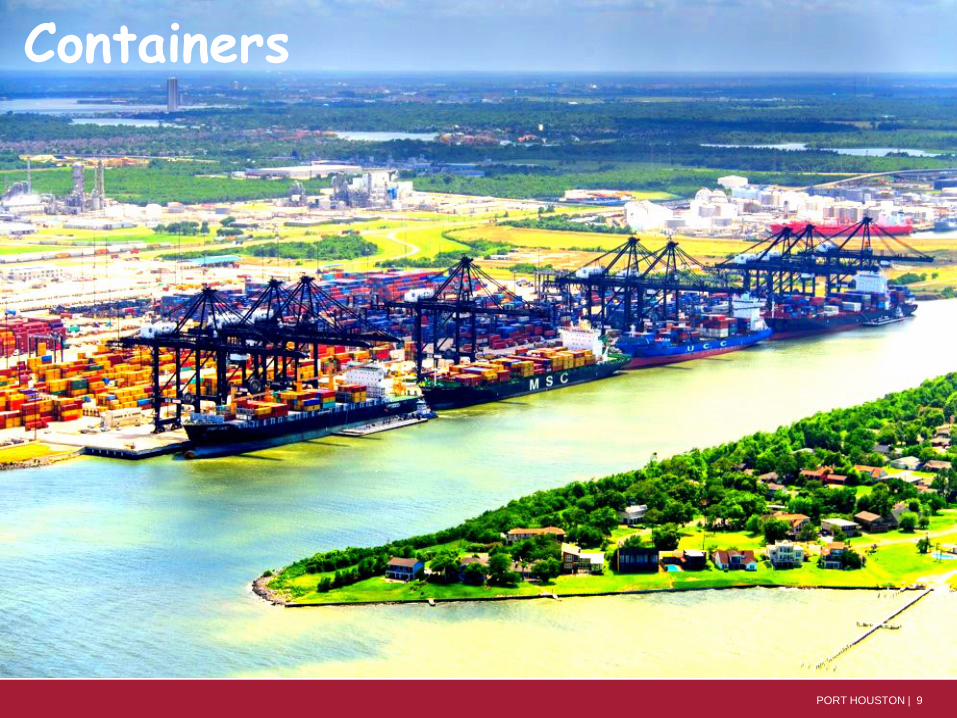
Containers

PORT HOUSTON | 10
Container Growth
0
500,000
1,000,000
1,500,000
2,000,000
2,500,000
3,000,000
2005 2006 2007 2008 2009 2010 2011 2012 2013 2014 2015 2016 2017
IMPORTSEXPORTSTOTAL
Note: Totals include empty containersSource: PHA Accounting, PHA Market Development
2018
2023
1.9 2.12.2
2.42.7
3.3

PORT HOUSTON | 11
Steel

PORT HOUSTON | 12
4.7
6.7
4.8
2.2
3.74.4
$98 $93
$48$43 $50
$65
2013 2014 2015 2016 2017 2018
Steel MM Tons WTI Annual Average $/BBL
Steel up 21%

PORT HOUSTON | 13
2018 Built: Container Yard 6 South @ Bayport

PORT HOUSTON | 14
2018 Built: Container Yard 1 and East End at Barbours Cut

PORT HOUSTON | 15
Rehabilitating Old City Docks

PORT HOUSTON | 16
99 Sections H & I
BCT Blvd to 146 connectors
Peninsula Road Expansion
RR Double-track at Broadway
I-69 / 99S bypass
SH 330 Connectivity
SH 225 Expansion& Connectors
Bayport Port Road and RR Spur
Other road and rail improvements
Crosby-Lynchburg Improvements
Container Barges
BW-8 Bridge Expansion
Inland distribution (not shown)xShipChannel
BCT
BPT
Example Current & Potential Area Projects
Priority: Freight Mobility

PORT HOUSTON | 17
Project Start:Peninsula Road improvementWorking with TxDOT and Harris County
PORT HOUSTON | 17

PORT HOUSTON | 18
Project Start: Broadway Double Track
PORT HOUSTON | 18

PORT HOUSTON | 19
Future is Bright, Supported by Fundamentals

PORT HOUSTON | 20
Population Driving Imports
Map Source: Urban Institute Mapping America’s Futures

PORT HOUSTON | 21
New Petrochemical Project Announcements – USGC 2012
Manufacturing Driving Exports
Source: Lee Nichols, Hydrocarbon Processing Magazine, Energy Construction Form 3/16

PORT HOUSTON | 22
Source: Lee Nichols, Hydrocarbon Processing Magazine, Energy Construction Form 3/16
New Project Announcements – Through Q1-2016
Manufacturing Driving Exports

PORT HOUSTON | 23
Energy Sea Change
US Crude Oil Exports Since 1920

PORT HOUSTON | 24PORT HOUSTON | 24

PORT HOUSTON | 25
TOPIC: RESIN PERFORMANCEPORT HOUSTON DOMINATES US POLYETHYLENE EXPORT
The top six ports control 98% ofwaterborne exports
Port Houston handles 7 out of 10 containers of US waterborne PE export
72.1%
11.0%
8.8%
3.8%
1.8%
2.5%
0
Houston
LA/Long Beach
New Orleans
Charleston
Freeport TX
All Other US Ports
Graph: US Waterborne PE Exports by PortUnits: Metric Tons; Time: 12 months to Oct 2018 (latest available data) Source: Customs Data from Census Bureau
US MarketShare %
160,000 teus 240,000 teus 320,000 teus2,000,000 3,000,000 4,000,000
80,000 teus1,000,000
PORT HOUSTON | 25

PORT HOUSTON | 26
0
2014
2015
2016
2017
2018
2019
All US Houston Other Ports
Graph: US Waterborne Export of Polyethylene (PE) ResinMonthly Metric Tons through Oct 2018 (latest availabledata) Source: Customs Data from CensusBureau
TOPIC: RESIN PERFORMANCEPOLYETHYLENE EXPORT GROWTH
US PE export has exploded in 2018, as predicted.
Port Houston PE tonnage has increased twice as much as all other US ports combined in 12 months to Oct 2018
All US Ports Total (+40.4%)
Port Houston (+37.8%)
Other US Ports (+47.7%)
Future PE Export Growth
Percentage change reflects 12 months to Oct 2018 vs. 12 months to Oct 2017
200,0006,000 teus
400,00032,000 teus
600,00048,000 teus
800,00064,000 teus
PORT HOUSTON | 26

PORT HOUSTON | 27
Total
Europe
East Asia
Latin America
SouthAsia
Australia
North America
Africa
Middle East
Graph: Growth in US PE Exports by TradelaneBased on Metric Tons in 12 months to Oct 2018 minus 12 months to Oct 2017 Source: Customs Data from Census Bureau
TOPIC: RESIN PERFORMANCEPOLYETHYLENE EXPORT TRADELANE GROWTH
Europe has been absorbing significant amounts of incremental PE exports. This was not anticipated by market experts.
East Asia has been underperforming expectation. This may be due to tariffs in China.
32,000 teus400,000
64,000 teus800,000
96,000 teus1,200,000
32,000 teus-400,000 0
PORT HOUSTON | 27

PORT HOUSTON | 28PORT HOUSTON | 28

PORT HOUSTON | 29PORT HOUSTON | 29

PORT HOUSTON | 30
TOPIC: EQUIPMENT BALANCEPORT HOUSTON CONTAINER BALANCE
Today, loaded imports exceed loaded exports
0
20,000
40,000
60,000
80,000
100,000
120,000
2001
2002
2003
2004
2005
2006
2007
2008
2009
2010
2011
2012
2013
2014
2015
2016
2017
2018
2019
Graph: Port of Houston Container Volume by TypeSource: PHA Accounting Units: Monthly TEUs
Empty Imports
Loaded Exports
Loaded Imports
Empty Exports

PORT HOUSTON | 31
Priority: Houston Ship Channel
Houston—USA’s Busiest Channel
Houston: 22,000 ship moves200,000 barge moves LA+LB NY/NJ Houston
9,945
5,508
3,860
Deep Draft Ship CallsPORT HOUSTON | 31

PORT HOUSTON | 32
Sept 10, 2018

PORT HOUSTON | 33
USACE “Megastudy” Current Plan
+4 ft+5 ft
WIDERWIDER
WIDER
WIDER
Deeper:+4 ft

PORT HOUSTON | 34
700’
current
2-way channel
Federal Recommended Plan
No widening,1-way channel
(operationally unsound,unsafe)
530’
proposed
Revised Plan features include a flaw that does not satisfy needs of industry or pilots
Widening is necessary for safety and efficiency

PORT HOUSTON | 35
Industry Inputs:Cannot constrain national economic growth
Oil & Gas Plays in the “Shale Revolution”
Manufacturing, Population and Jobs supported by Oil & Gas Drilling and Production
USGC Petrochem Projects

PORT HOUSTON | 36
Update on Sediment Capture & Control
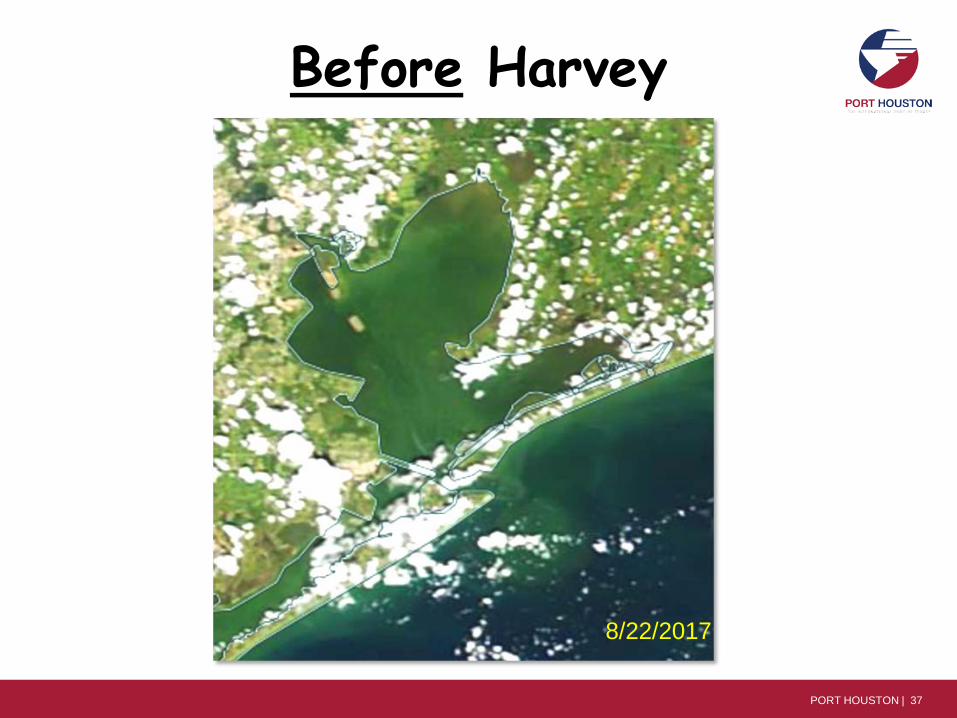
PORT HOUSTON | 37
Before Harvey
8/22/2017

PORT HOUSTON | 38
After Harvey
8/31/2017

PORT HOUSTON | 39
Cost of Draft Restrictions
1 foot Shoaling can cost shipping over $300 million per year 3 feet can cost Container ships $1 million in revenue for each ship call Extra costs translate into higher prices for goods

PORT HOUSTON | 40
1935 Flood-Turning Basin Terminal
“tons of mud and wreckage were dumped into the channel”
“serious navigation hazards”
“Shipping was tied up for days, and all of Texas suffered as a result ”

PORT HOUSTON | 41
Key Q: How to include Sediment Capture and Control in Flood Control Projects?

PORT HOUSTON | 42
30’ Authorized 36’ Authorized
+7’ sump
+2’ adv maintMitigation on the Channel Side

PORT HOUSTON | 43
Protect City of HoustonStorm Water Management
Prevent Silt in the Ship Channel
Flood Control “Options” for SCC: • Detention basins• Enlargement and rectification of channels• Construction of control works• Diversions and soft solutions• Source control management
Land side: Driving Toward Success
Mitigation on the Land Side

PORT HOUSTON | 44
SCC Working Group Established
• Initial members:– HCFCD– CoH Resilience Office– PHA– USACE (invited)
• Focus areas– Technology– Policy– Funding
HCFCD = Harris County Flood Control DistrictCoH = City of HoustonPHA = Port of Houston AuthorityUSACE = US Army Corps of Engineers

PORT HOUSTON | 45
Illustrative Work Program
A B C
DE F
G
H
Turning Basin Terminals
Public Grain Elevators 1 and 2
Woodhouse
Bulk Terminal
Jacintoport
Care Terminal
Barbours Cut Container Terminal
Bayport Container Terminal
ABCDEFGH
Container Truck GatesWharf RehabNew YardsEnergy SustainabilityUtilities ImprovementsSecurity SystemsCrane DemoDock DemoConcrete StructuresDrainage SystemsRail ExtensionsRoad ExpansionsCargo Handling

PORT HOUSTON | 46
All - Fender Replacements
BPT Truck Gate Lanes
BCT Intersection @ 146
WH Concrete Road
BCT CY 3 Reconstruction
BCT CY2 Mid-South Yard Reconstruction
TB Lower Level Road and Utilities Redesign
TB Transit Shed Re-Roof / Re-Skin
All - Rail Switch Replacements
TB Wharf Rehabilitations
BPT / BCT Move Cranes
TB Transit Shed Utilities and Facilities
TB Wharf 33 and Dredging
BPT East Empty Yard Utilities and Boundaries
BW-8 Yard, Land Access and Wharves
BPT Wharf 6 CPS & Power
BPT Wharf 4-5 Strengthening
BPT SS Building
BPT Wharf 7WH Wharves Rehab
Care Roof Replacement
Jacintoport Transit Shed Refurb
Design Program Highlights
BPT East End
BCT Maintenance Complex
BCT West YardsBCT Channel Widening

PORT HOUSTON | 47PORT HOUSTON | 47

PORT HOUSTON | 48
BCT CAPEX Phasing Plan
WHARF 3WHARF 4 WHARF 5/6
CY 1&2 N.
CY 2 S.
CY 3
CY 4 N&SCY 5 N&S
ENTRY GATE
ADM
M&RTBD
ENTRY GATE
PORT HOUSTON | 48

PORT HOUSTON | 49

PORT HOUSTON | 50
WHARF 1
WHARF 6WHARF 7
East Empty Yard
CY 2 S.
CY 1 N.
CY 1 S.
Bayport CAPEX Phasing Plan
West Empty Yard - Complete
CY6 S –Complete
CY 7
PORT HOUSTON | 50

PORT HOUSTON | 51
Turning Basin Rehabs

PORT HOUSTON | 52
Turning Basin Rehabs

PORT HOUSTON | 53
Evaluating New Tech
e
Con
cept
ual
Dep
loye
dEm
ergi
ng

PORT HOUSTON | 54
Intelligent Transportation Systems

PORT HOUSTON | 55
Priority: Awareness and Connection to Community

PORT HOUSTON | 56

PORT HOUSTON | 57
Houston, Buffalo Bayou and East End…

PORT HOUSTON | 58
Buffalo Bayou
Sediments Sump Park
Footbridge
Nature Center Footbridge
Water Taxi Dock, Bayou Viewing Decks South & NorthAnd Pumpstation
Innovation Center with Walking Path
Sam Houston Pavilion Access
TurningBasin
“Lighthouse” Observation Deck
Hidalgo Park
Yolanda Navarro Black Nature Center
What If… Turning Basin Innovation Complex

PORT HOUSTON | 59
Source: SWA Group

PORT HOUSTON | 60
Oct 20, 2018 Berm Planting & Dedication

PORT HOUSTON | 61
Within sight of the Terminals

PORT HOUSTON | 62
Communities, Port and Industry Working Together
PORT HOUSTON | 62

PORT HOUSTON | 63
THANK YOURich Byrnes
Chief Infrastructure OfficerPort Houston
Questions?713.670.2400
www.PortHouston.com
PORT HOUSTON | 63