port of green bay feasibility study introducing container
TRANSCRIPT

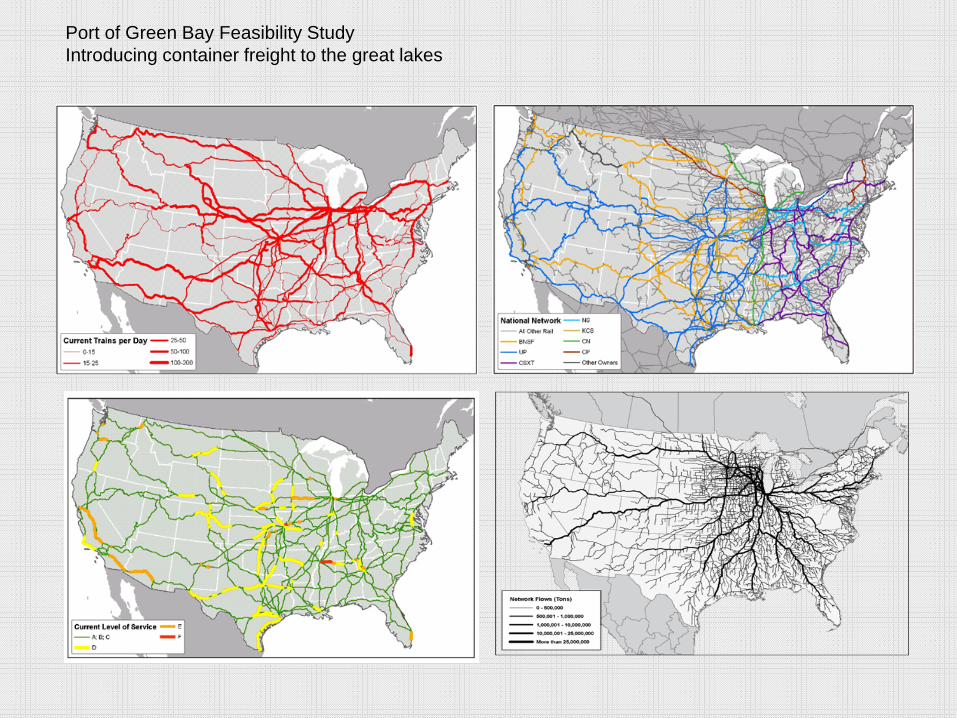
Port of Green Bay Feasibility StudyIntroducing container freight to the great lakes

Port of Green Bay Feasibility StudyIntroducing container freight to the great lakes
Research Team:
Ray Hutchison, Urban and Regional StudiesJohn Stoll, Public and Environmental AffairsDon McCartney, Business Adminsitration
Student Assistants:
Andrew FlickRyan Vandeyacht

Port of Green Bay Feasibility StudyIntroducing container freight to the great lakes
Background to the study
Port of Green Bay Public ForumSpring 2008
Proposal to GLMRIJune 2008
Announcement of AwardPublic relations firmUWGB ChancellorBrown County ExecutiveMayor of Green BayChamber of Commerce
NEW Regional Economic ForumNEW Mayors and ExecutivesState LegislatorsTop economic priority for region

Port of Green Bay Feasibility StudyIntroducing container freight to the great lakes

Port of Green Bay Feasibility StudyIntroducing container freight to the great lakes
Great Lakes Shipping

Port of Green Bay Feasibility StudyIntroducing container freight to the great lakes
Port of Green Bay profile is similar to Great Lakes shipping more generally:
Bulk commoditiesCoalStoneSalt
Little outgoing traffic Relatively stable but with significant downturn in last year
Port of Green Bay Feasibility StudyIntroducing container freight to the great lakes

Port of Green Bay Feasibility StudyIntroducing container freight to the great lakes

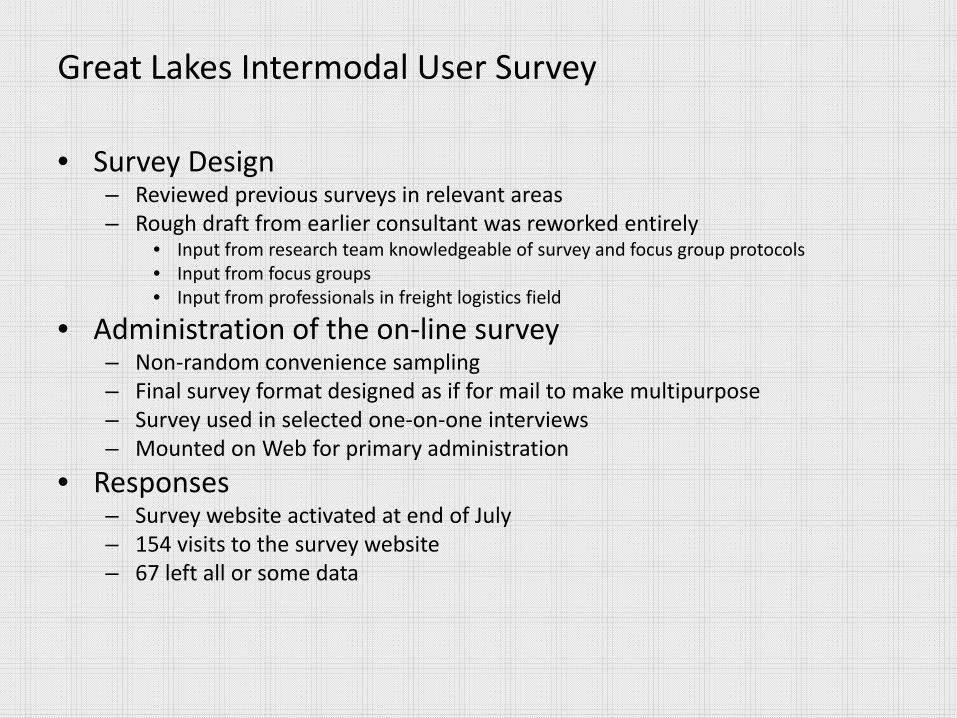
• Survey Design– Reviewed previous surveys in relevant areas– Rough draft from earlier consultant was reworked entirely
• Input from research team knowledgeable of survey and focus group protocols• Input from focus groups• Input from professionals in freight logistics field
• Administration of the on‐line survey– Non‐random convenience sampling– Final survey format designed as if for mail to make multipurpose– Survey used in selected one‐on‐one interviews– Mounted on Web for primary administration
• Responses– Survey website activated at end of July – 154 visits to the survey website– 67 left all or some data
Great Lakes Intermodal User Survey

• Overview of the user survey– Final survey is 18 pages in paper version– Web version is structured in pages– Each has confidentiality statement and Institutional Review Board approval from UW – Green Bay
– Final survey consists of five Sections• Your company and transport decision‐making• Incoming freight• Outgoing freight• Your company and its containerized freight potential• Interest in a Great Lakes “Marine Highway” alternative
Great Lakes Intermodal User Survey

2%
65%
8%
3%
13%
2%7%
Primary Business Activity of Respondents
Agriculture
Manufacturing
Paper or Logging
Retail
Transportation
Warehousing and Distribution
Great Lakes Intermodal User Survey

• Would this company be categorized best as a– Carrier – 11.7%– Shipper – 88.3%
• Filtering of respondents for both inbound and outbound freight– Do you make decision– Do you have direct knowledge and information about decision
• Filtering for inbound and outbound distances– Does your company ship by truck for 200 miles or more– Does your company ship by rail for 600 miles or more
Great Lakes Intermodal User Survey

14%
39%25%
22%
Loading/Unloading Operations Required for Incoming Freight
A drop lot operation
Require live load/unload
Require delivery "by" a certain date
Require delivery "on" a certain day
Great Lakes Intermodal User Survey

19%
40%16%
25%
Loading/Unloading Operations Required for Outgoing Freight
A drop lot operation
Require live load/unloadRequire delivery "by" a certain dateRequire delivery "on" a certain day
Great Lakes Intermodal User Survey

• After filtering for inbound and outbound distances– Does your company ship by truck for 200 miles or more– Does your company ship by rail for 600 miles or more
• How many inbound lanes move these distances– Mean – 18– Lowest – 2– Highest – 99– N=24
• How many outbound lanes move these distances– Mean – 31.2– Lowest – 1– Highest – 99– N=9
Great Lakes Intermodal User Survey

18%4%
17%61%
Incoming Passes Through a US or Canadian Port/Terminal
US Port or Terminal
Canadian Port or TerminalBoth US and Canadian Port/TerminalNeither
Great Lakes Intermodal User Survey

31%
0%23%
46%
Outgoing Passes Through a US or Canadian Port/Terminal
US Port or Terminal
Canadian Port or TerminalBoth US and Canadian Port/TerminalNeither
Great Lakes Intermodal User Survey

• How comfortable would your company be with a mix of 9‐month marine transport and 3‐months rail/truck service for its transportation needs?– Very uncomfortable – 17.6%– Somewhat Uncomfortable – 17.6%– Uncomfortable – 0.0%– Little Concern – 35.3%– No Concern – 29.4%– N=17
• Given that, do you think your company would be willing to utilize Great Lakes shipping for 9 months , if it meant that its shipping would need to switch during the winter?– Yes– 58.8%– No – 41.2%– N=17
Great Lakes Intermodal User Survey

• Additional online responses are being solicited to the survey through broader regional dissemination of web link– Twin Cities area Chamber of Commerce
– Wisconsin Manufacturers and Commerce > Minnesota group
• Addition discussion with industry contacts will be made for feedback on implications of online survey results.
• Full analysis of survey data will be integrated with work of other research team members, including focus group interviews
Where Next with Survey

Port of Green Bay Feasibility StudyIntroducing container freight to the great lakes
Preliminary Freight Flow Analysis

Freight Flow Analysis and Results from Piers DataState of Wisconsin
• Total tonnage of commodities originating from Wisconsin– 153,872,275
• Total Tonnage by Mode:Truck = 101,117,924
Water = 41,521,429
Rail = 11,222,994
Air = 9,928

Freight Flow Analysis and Results from Piers DataState of Wisconsin
• Total tonnage of commodities shipped to Wisconsin– 113,202,748
• Total Tonnage by Mode:Truck = 112,105,860
Water = 190,165
Rail = 905,946
Air = 777

Freight Flow Analysis and Results from Piers DataState of Wisconsin
Top Six Commodities Shipped from Wisconsin
• Food or Kindred Products: – 26,572,096 tons by truck
• Coal: – 25,633,688 tons by rail/truck/water
• Metallic Ore: – 14,741,268 tons by truck
• Farm Products– 13,660,692 tons by truck
• Lumber or Wood – 9,797,495 tons by rail/truck/water
• Petroleum or Coal Products– 9,603,747 tons by rail/truck

Freight Flow Analysis and Results from Piers DataState of Wisconsin
Top Six Commodities Shipped to Wisconsin
• Food or Kindred Products– 22,303,857 tons by truck
• Farm Products– 17,182,805 tons by truck
• Non-Metallic Minerals, Excluding Fuels– 13,725,435 tons by rail/truck/water
• Lumber or Wood– 9,797,495 tons by rail/truck/water
• Clay, Concrete, Glass, or Stone Products– 9,178,845 tons by rail/truck/water
• Petroleum or Coal Products– 8,561,603 tons by rail/truck/water

Freight Flow Analysis and Results from Piers DataState of Wisconsin
Port Shipments Receipts Total Top Commodity
Duluth MN – Superior 40,544,000 3,503,000 44,047,000 Coal
Port of Chicago, IL 7,956,000 16,524,000 24,480,000 Coal
Indiana Harbors, IN 1,275,000 13,682,000 14,957,000 Iron Ore
Detroit, MI 1,113,000 13,829,000 14,942,000 Iron Ore
Two Harbors, MN 13,597,000 55,000 13,652,000 Iron Ore
Toledo, OH 5,923,000 6,511,000 12,434,000 Iron Ore
Cleveland, OH 1,142,000 11,255,000 12,397,000 Iron Ore
Presque Isle, MI 6,446,000 2,346,000 8,792,000 Iron Ore
Gary, IN 388,000 7,610,000 7,998,000 Iron Ore
Broader Regional Data: Beyond Wisconsin
Freight Flow Analysis and Results from Piers DataState of Wisconsin
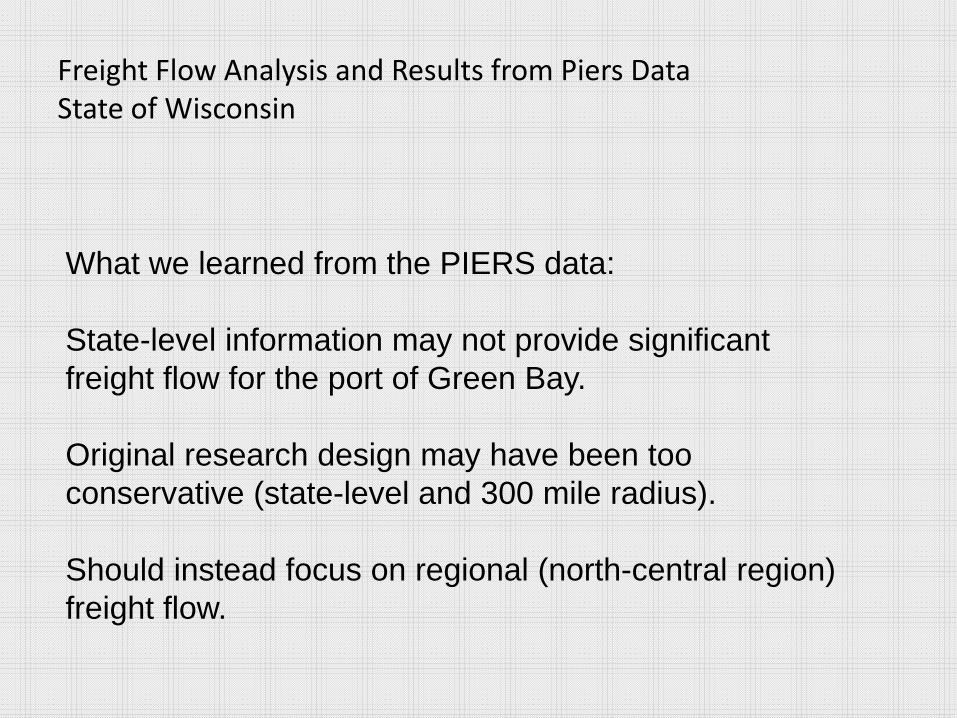
What we learned from the PIERS data:
State-level information may not provide significant freight flow for the port of Green Bay.
Original research design may have been too conservative (state-level and 300 mile radius).
Should instead focus on regional (north-central region) freight flow.

Port of Green Bay Feasibility StudyIntroducing container freight to the great lakes
• Focus Group Interviews– Focus groups used for pretest of on-line survey– Information from early focus group interviews revealed
• very different shipping needs– With international shipments, some have extensive experience– Many companies do not make use of maritime transportation
• Very different level of logistics knowledge– Some schedule shipments directly
» Precise information about supply chain– But most make use of freight brokers
» Little knowledge of supply chain
– Decision was made to moved to in-depth interviews with companies that have more extensive experience

Port of Green Bay Feasibility StudyIntroducing container freight to the great lakes
• Summary of information from focus group Interviews– Majority of respondents indicated a high interest in shipping via waterway from the Green Bay area Port.
– Major concern was what would be the actual cost of this alternative
– Majority of respondents indicated that the issue of seasonality would NOT be a factor for their needs.
– Some indicated preference for shipping out of the Green Bay area Port versus the ports they presently use.
– Some respondents stated a desire to support Wisconsin commerce even if at a somewhat higher cost.

• Potential savings by use of Port of Green Bay– Case Study One: Small Engine Manufacture
• Outbound shipments: completed equipment
• Inbound shipments: parts
• Current transport by truck to Port of Houston
– Green Bay > Port of Houston 1300 miles
• Capture in Port of Green Bay
– Case Study Two: Oversize cargo from Fox Valley• Transport by truck to Port of Houston
– Green Bay > Port of Houston 1300 miles
• Capture in Port of Green Bay
• Estimated savings of $750,000 per shipment
Port of Green Bay Feasibility StudyIntroducing container freight to the great lakes

Thinking outside the circle…
Are there commodities that originate beyond 300 miles that can be shipped through the Port of Green Bay?

• Case Study One: Glycerol (byproduct of biodiesel production)• Current transport by truck from production facility to Port of Houston
– Rochester > Port of Houston 1164 miles• Capture in Port of Green Bay
– Rochester > Port of Green Bay 268 miles• Reduction of approx. 900 miles (80 percent)
• Case Study Two: Oversize Cargo to / from Edmonton• Current transport by truck to Port of Houston / Baltimore
• Edmonton > Port of Houston 2300 miles• Edmonton > Port of Baltimore 2340 miles
• Capture in Port of Green Bay• Edmonton > Port of Green Bay 1500 miles• Reduction of approx. 800 miles (35 percent)

• Future and Continuing Activity (Expanded Year Two)– With GL‐GIFT: Mapping of case study information
– With GLMIDS: Mining data sources for port‐specific data
– Develop additional cases study information
– Implementation of port development
• Contact by Canadian National
• Site Location
• Business Case
– Continue to build community Support• Identified as number one regional priority
Port of Green Bay Feasibility StudyIntroducing container freight to the great lakes

Port of Green Bay Feasibility StudyIntroducing container freight to the great lakes
CANADIAN NATIONAL RAIL YARDS
FIRST LIFT BRIDGE----------

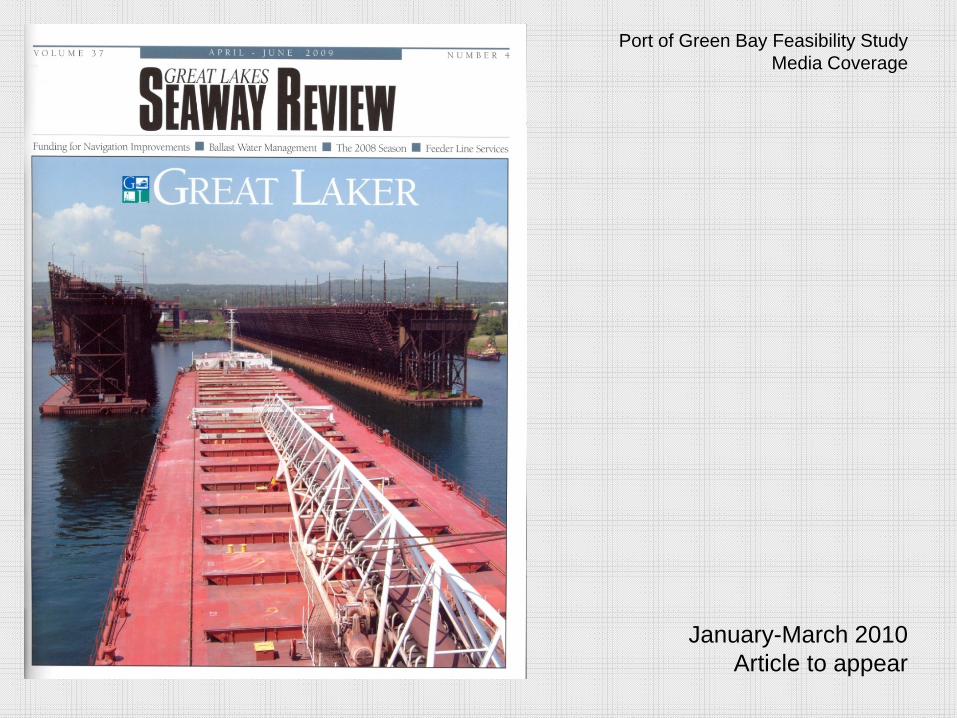
Port of Green Bay Feasibility StudyMedia Coverage
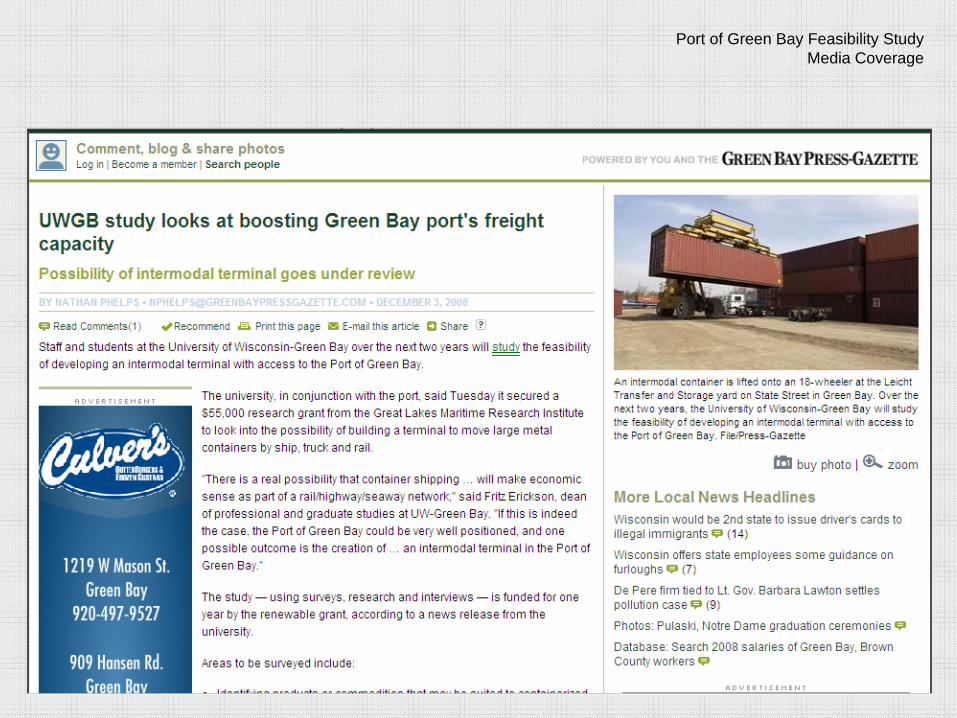
Port of Green Bay Feasibility StudyMedia Coverage

Port of Green Bay Feasibility StudyMedia Coverage


Port of Green Bay Feasibility StudyMedia Coverage


Port of Green Bay Feasibility StudyMedia Coverage

Port of Green Bay Feasibility StudyMedia Coverage

Port of Green Bay Feasibility StudyMedia Coverage
Port of Green Bay Feasibility StudyMedia Coverage
January-March 2010Article to appear