port of hastings development project
TRANSCRIPT
Port of Hastings Development Project
Settlement Testing and TSS-Turbidity Relationships for Dredged Material Management Purposes
Port of Hastings Development Authority
March 2015 Final Working Draft (Revision 0) 8A0300

In May 2016 the Special Minister of State asked Infrastructure Victoria to provide advice on the future capacity of Victoria’s commercial ports. Specifically, the Minister has asked for advice on when the need for a second container port is likely to arise and which variables may alter this timeline. The Minister has also asked for advice on where a second container port would ideally be located and under what conditions, including the suitability of, and barriers to investing in, sites at the Port of Hastings and the Bay West location.
In undertaking this task, Infrastructure Victoria reviewed work that was completed as part of the Port of Hastings development project before it was cancelled in 2014. This document forms part of the initial work undertaken for the proposed port development at Hastings. Infrastructure Victoria considers that much of the previous Hastings work, although preliminary in nature, is relevant and suitable for informing a strategic assessment. Therefore, Infrastructure Victoria has made the reports previously commissioned for the development project part of the evidence base on which Infrastructure Victoria will use in providing the Minister with advice.
The opinions, conclusions and any recommendations in this document are based on conditions encountered and information reviewed at the date of preparation of the document and for the purposes of the Port of Hastings Development Project.
Infrastructure Victoria and its consultants have used the information contained in these reports as an input but have not wholly relied on all the information presented in these reports.

This report has been prepared by Haskoning Australia Pty Ltd solely for its client in accordance with the terms of appointment, the methodology, qualifications, assumptions and constraints as set out in the report and may not be relied upon by any other party for any use whatsoever without prior written consent from Haskoning Australia Pty Ltd. © 2015 Haskoning Australia Pty Ltd
Document title Port of Hastings Development Project
Settlement Testing and TSS-Turbidity Relationships for Dredged Material Management Purposes
Document short title Settlement Testing
Status Final Working Draft (Revision 0)
Date March 2015
Project name Port of Hastings Dredged Material Management
Project number 8A0300
Client Port of Hastings Development Authority
Reference HAS-CEP0-HY-REP-0030 The contents of this document reflect Haskoning Australia’s current position on the subject matter of this document. It is provided for discussion or information purposes and is intended to be a guide only. The contents of this document should not be relied upon as representing Haskoning Australia’s final position on the subject matter, except where stated otherwise. Any views expressed by Haskoning Australia in this document may change as a consequence of Haskoning Australia finalising formal technical studies or specifications, or legislative, or procedure and regulatory developments. Any figures provided are indicative only, are subject to change and are dependent upon a number of factors.
Level 14 56 Berry Street
NORTH SYDNEY NSW 2060 T: +61 (0) 2 8854 5000 F: +61 (0) 2 9929 0960
www.royalhaskoningdhv.com ABN 66 153 656 252
HASKONING AUSTRALIA
MARITIME & WATERWAYS
Drafted by Patrick Lawless / Sam Balian
Checked by Greg Britton
Date/initials check 26/3/15
Approved by
Date/initials approval

Settlement Testing - i - HAS-CEP0-HY-REP-0030 Final Working Draft (Revision 0) © 2015 Haskoning Australia Pty Ltd March 2015
CONTENTS Page
1 INTRODUCTION 1 1.1 Background 1 1.2 Dredged Material Management 1 1.3 Objectives and Scope 1 1.3.1 Settlement Tests 1 1.3.2 TSS-Turbidity Tests 2
2 REMNANT MATERIAL AVAILABLE FOR TESTING 3 2.1 Material Quantities and Source Locations 3 2.2 Sample Preparation 6 2.2.1 Stiff-Hard Clays 6 2.2.2 Silty/Clayey Sands 7 2.2.3 Soft Silty Clays 8 2.2.4 ‘Representative’ Sand/Clay Material 9
3 TEST PROCEDURES 11 3.1 Settlement Tests 11 3.2 TSS-Turbidity Tests 13 3.2.1 Dilution Tests 13 3.2.2 Column Tests 14
4 SETTLEMENT TEST RESULTS 15 4.1 Bulking Factors 15 4.1.1 Definition 15 4.1.2 Typical Behaviours 15 4.1.3 Calculations for Bulking Factors from Settlement Tests 15 4.2 Stiff-Hard Clays 16 4.3 Silty/Clayey Sands 18 4.4 Soft Silty Clays 22 4.5 ‘Representative’ Sand/Clay Material 25
5 TSS-TURBIDITY TEST RESULTS 29 5.1 Stiff-Hard Clays 29 5.2 Silty/Clayey Sands 30 5.3 Soft Silty Clays 31 5.4 ‘Representative’ Sand/Clay Material 32 5.5 Summary of TSS-Turbidity Relationships 33
6 DISCUSSION 35 6.1 Settling Behaviour 35 6.2 TSS-Turbidity 37
7 REFERENCES 39 APPENDIX A Locations and Masses of Samples used for Testing APPENDIX B Laboratory Reports for Geotechnical Testing of Samples used for Testing

Settlement Testing - ii - HAS-CEP0-HY-REP-0030 Final Working Draft (Revision 0) © 2015 Haskoning Australia Pty Ltd March 2015
APPENDIX C Settlement Test Sheets – Stiff-Hard Clays APPENDIX D Settlement Test Sheets – Silty/Clayey Sands APPENDIX E Settlement Test Sheets – Soft Silty Clays APPENDIX F Settlement Test Sheets – ‘Representative’ Sand/Clay Material APPENDIX G Laboratory Certificates of Analysis for Water Samples APPENDIX H TSS-Turbidity Test Sheets – Stiff-Hard Clays APPENDIX I TSS-Turbidity Test Sheets – Silty/Clayey Sands APPENDIX J TSS-Turbidity Test Sheets – Soft Silty Clays APPENDIX K TSS-Turbidity Test Sheets – ‘Representative’ Sand/Clay Material
Settlement Testing - 1 - HAS-CEP0-HY-REP-0030 Final Working Draft (Revision 0) © 2015 Haskoning Australia Pty Ltd March 2015
1 INTRODUCTION
1.1 Background
In 2012 the Victorian Government established the Port of Hastings Development Authority (the Authority) to fast track the development of a second container port at Hastings. The Authority is progressing staged planning of the Port of Hastings Development Project (the Project) from 2014 to 2018, culminating in a rigorous business case and full environmental and social impact assessment. It is envisaged that the container port will begin operations in the mid 2020s with a capacity of 3 million twenty-foot equivalent (TEU) per year, increasing to 9 million TEU by 2060.
1.2 Dredged Material Management
Port development will require a significant quantity of capital dredging to be undertaken. The management of dredged material is a key component of the port development as it will be one of main drivers for capital expenditure. Management of dredged material will also be a key consideration in the environmental impact assessment for the project. A proportion of dredged material is proposed to be beneficially reused as fill within land reclamation. The management of this proportion of the dredged material falls within the scope of the Dredging and Reclamation Design work package. The remainder of the dredged material, considered either unsuitable for use as reclamation material or surplus to the volumetric requirements of reclamation, will be disposed of elsewhere. Management of this material falls within the scope of the Dredged Material Management (DMM) work package.
1.3 Objectives and Scope
1.3.1 Settlement Tests
Settlement tests provide information on the settling behaviour of the various types of sediments to be dredged. This information can be used in the design of disposal areas (underwater and onshore) and as input for the assessment of potential impacts relating to turbidity generated from dredging and disposal activities. Settlement tests were undertaken on sediment/water mixtures prepared from samples of material obtained as part of the marine geotechnical program and seawater that is representative of that which would be entrained from dredging within Western Port.
Settlement tests were undertaken for several material types that would be encountered during proposed dredging operations, including:
stiff-hard clays;
silty/clayey sands;
very soft silty clays (located close to shore); and,
combination of clay and sand material that is representative of the undifferentiated interbedded sediment in the dredge footprint.

Settlement Testing - 2 - HAS-CEP0-HY-REP-0030 Final Working Draft (Revision 0) © 2015 Haskoning Australia Pty Ltd March 2015
The test procedure and results for each settlement test are described herein.
1.3.2 TSS-Turbidity Tests
As part of the environmental management of major dredging projects, water quality limits relating to impacts on sensitive biological receptors are commonly specified in terms of Total Suspended Solids (TSS)1. In accordance with standard industry practice, compliance with these limits is typically assessed through real time turbidity2 monitoring, as suspended solid concentrations are not as easily and quickly measured in the field. A TSS-turbidity relationship is therefore used to convert water quality limits into turbidity values that can be readily measured in the field during the proposed works and thus used for compliance monitoring and triggers for management actions. The relationship between TSS and turbidity is highly site-specific, being dependant on the physical, optical and geochemical properties of the sediment being disturbed. As such, testing is required to establish relationships between these properties for the various material types that would be encountered during proposed dredging operations. These relationships should be supplemented with field data where possible. Sedimentation tests were therefore undertaken for each of the material types outlined above for the purposes of establishing TSS-turbidity relationships. These tests were undertaken based on recommendations outlined in the US Army Corps of Engineers guidelines “Improved Methods for Correlating Turbidity and Suspended Solids for Monitoring” (Thackston and Palmero, 2000). The test procedures and results are described herein, including TSS-turbidity relationships for each material type.
1 TSS is a measurement of mass per unit volume, usually specified in mg/L. 2 Turbidity is an optical property of water, measured in nephelometric turbidity units (NTU).

Settlement Testing - 3 - HAS-CEP0-HY-REP-0030 Final Working Draft (Revision 0) © 2015 Haskoning Australia Pty Ltd March 2015
2 REMNANT MATERIAL AVAILABLE FOR TESTING
2.1 Material Quantities and Source Locations
A marine geotechnical investigation was commissioned by the Authority to develop a geotechnical model of the areas of Western Port that are within the potential dredging and reclamation area footprints. This involved drilling of up to 110 boreholes using jack-up barges and sampling of material down each borehole for performance of physical tests for geotechnical characterisation and pilot level investigation of geochemical properties. These investigations are described in WorleyParsons (2014). Following completion of these tests, the remnant sample material was placed into long-term storage in a shipping container located on the Patrick’s site at Stony Point. Material for settlement and TSS-turbidity testing was derived from these remnant samples. The sediment used for settlement and TSS-turbidity testing should be representative of the material that is proposed to be dredged. At the present time, there are two dredge footprints that are being considered for the project, as indicated in Figure 1. It is evident that a common swing basin area is occupied by both footprints. Borehole locations in the proposed dredge areas are also indicated on Figure 1.
Figure 1: Borehole locations and proposed dredge footprints

Settlement Testing - 4 - HAS-CEP0-HY-REP-0030 Final Working Draft (Revision 0) © 2015 Haskoning Australia Pty Ltd March 2015
Material for the settlement and TSS-turbidity testing described herein was derived exclusively from remnant samples that were collected inside the common area of the proposed dredge footprints. In addition, only those samples obtained from above a depth of -20 m CD were considered, as lower lying sediments are not likely to be dredged. It should also be noted that all remnant sample material that was collected from within the proposed north-south dredge footprint (and above -20 m CD) was retained for possible future settlement and TSS-turbidity testing. Each of the remnant samples obtained for testing were sorted into distinct material types, based on material descriptions provided in the borehole logs (WorleyParsons, 2014). The following material types were identified:
stiff-hard clays (Plate 1);
silty/clayey sands (Plate 2); and,
very soft silty clays (located close to shore) (Plate 3).
It is noted that classification of the above material types was based on particle size distribution and plasticity, in accordance with Appendix A of AS 1726-1993 (WorleyParsons, 2014). Classification tests were also carried out on all samples tested as part of this investigation. Laboratory reports for these tests are provided in Appendix B, and the results are summarised in Section 6.1. It should be noted that the material used to represent the undifferentiated interbedded sediments in Western Port was a combination of the stiff-hard clay and silty/clayey sand material (refer Section 2.2.4).
Plate 1: Remnant samples available for testing – stiff-hard clays

Settlement Testing - 5 - HAS-CEP0-HY-REP-0030 Final Working Draft (Revision 0) © 2015 Haskoning Australia Pty Ltd March 2015
Plate 2: Remnant samples available for testing – silty/clayey sands
Plate 3: Remnant samples available for testing – soft silty clays
Settlement Testing - 6 - HAS-CEP0-HY-REP-0030 Final Working Draft (Revision 0) © 2015 Haskoning Australia Pty Ltd March 2015
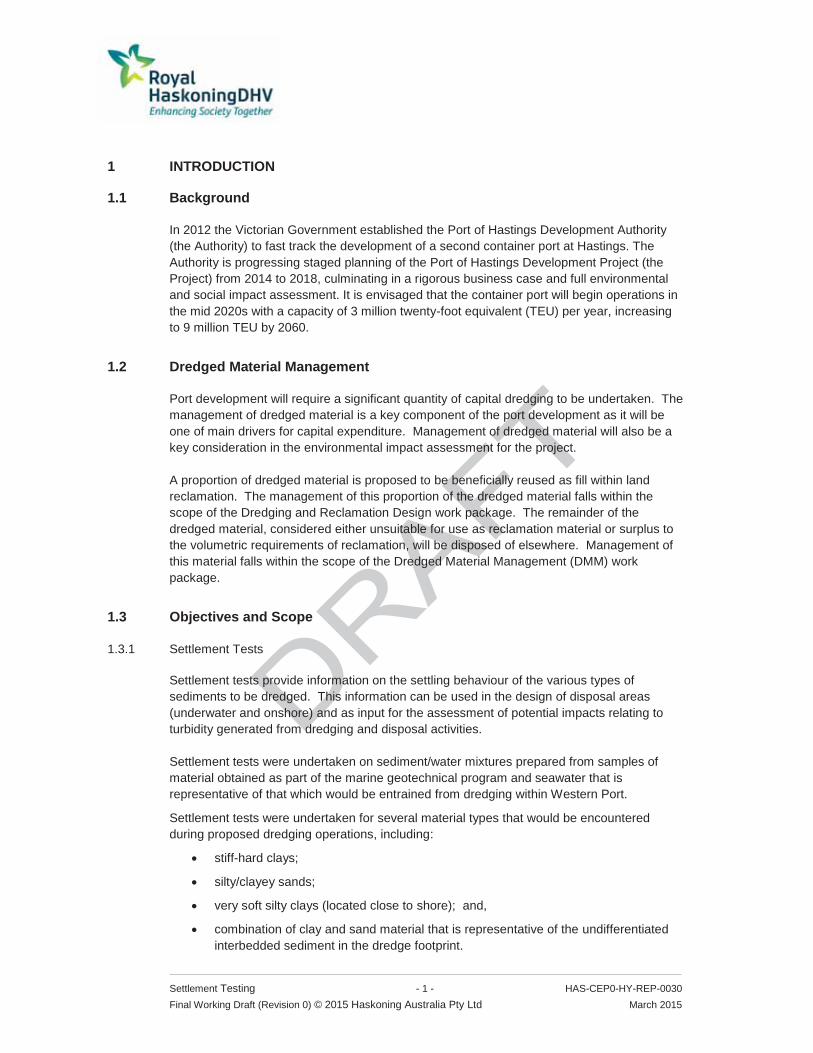
The locations and masses of each sample obtained for testing are listed in Appendix A. The total available masses obtained for each material type are summarised in Table 1.
Table 1: Total sample masses for each material type
Material Type Sample Mass (kg) stiff-hard clay 18.9 silty/clayey sand 8.1 soft silty clay (inshore) 11.1
2.2 Sample Preparation
The remnant samples obtained for testing were combined and homogenised for each material type prior to testing, as described in the following sections.
2.2.1 Stiff-Hard Clays
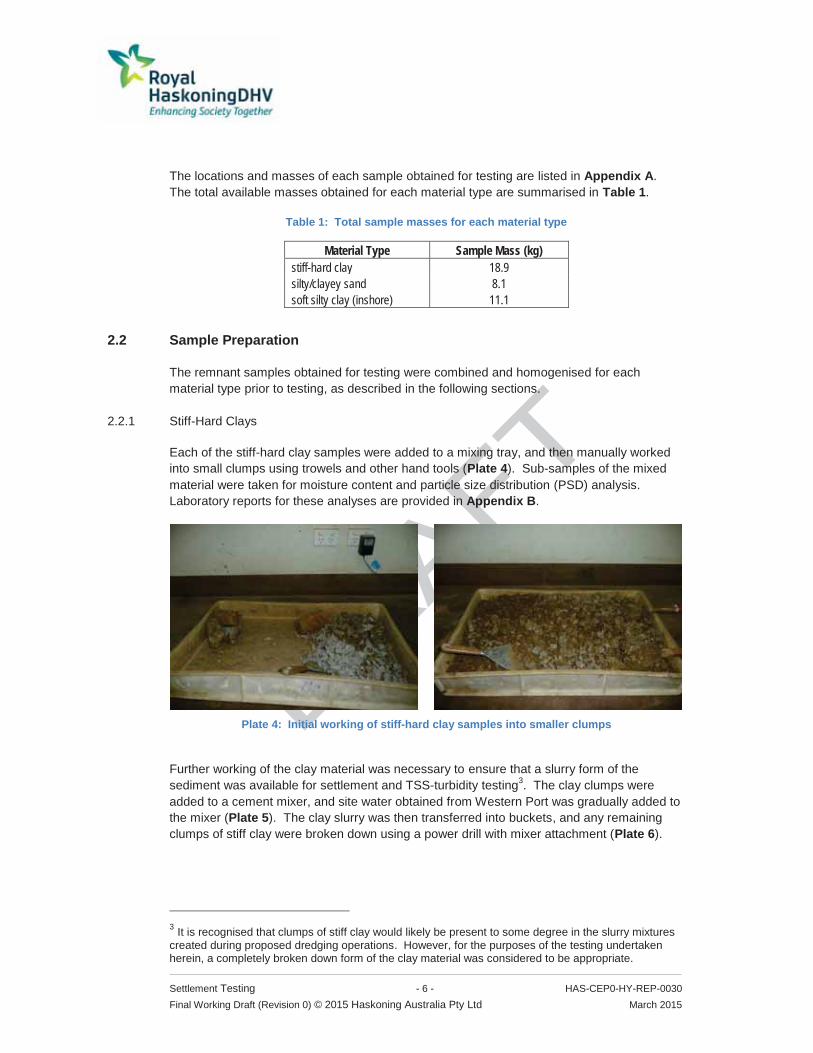
Each of the stiff-hard clay samples were added to a mixing tray, and then manually worked into small clumps using trowels and other hand tools (Plate 4). Sub-samples of the mixed material were taken for moisture content and particle size distribution (PSD) analysis. Laboratory reports for these analyses are provided in Appendix B.
Plate 4: Initial working of stiff-hard clay samples into smaller clumps
Further working of the clay material was necessary to ensure that a slurry form of the sediment was available for settlement and TSS-turbidity testing3. The clay clumps were added to a cement mixer, and site water obtained from Western Port was gradually added to the mixer (Plate 5). The clay slurry was then transferred into buckets, and any remaining clumps of stiff clay were broken down using a power drill with mixer attachment (Plate 6).
3 It is recognised that clumps of stiff clay would likely be present to some degree in the slurry mixtures created during proposed dredging operations. However, for the purposes of the testing undertaken herein, a completely broken down form of the clay material was considered to be appropriate.

Settlement Testing - 7 - HAS-CEP0-HY-REP-0030 Final Working Draft (Revision 0) © 2015 Haskoning Australia Pty Ltd March 2015
Plate 5: Subsequent mixing of clay clumps and site water to create slurry
Plate 6: Final breakdown of clay clumps to create slurry
2.2.2 Silty/Clayey Sands
Each of the silty/clayey sand samples were combined, and then manually mixed using trowels and other hand tools (Plate 7). Unlike the clay material, no further breakdown of the silty/clayey sands was required prior to settlement and TSS-turbidity testing. Sub-samples of the mixed material were taken for moisture content and PSD analysis. Laboratory reports for these analyses are provided in Appendix B.

Settlement Testing - 8 - HAS-CEP0-HY-REP-0030 Final Working Draft (Revision 0) © 2015 Haskoning Australia Pty Ltd March 2015
Plate 7: Mixing of silty/clayey sand samples
2.2.3 Soft Silty Clays
Each of the inshore soft silty clay samples were combined on a mixing tray, and then manually mixed using trowels and other hand tools. Sub-samples of the mixed material were taken for moisture content and PSD analysis. Laboratory reports for these analyses are provided in Appendix B. Due to the stiffness of some of the samples as a result of drying, further working of the material was necessary to ensure that a slurry form of the sediment was available for settlement and TSS-turbidity testing. The sediment was transferred into buckets along with site water obtained from Western Port, and the clay clumps were broken down using a power drill with mixer attachment (Plate 8).
Plate 8: Mixing of soft silty clay samples
Settlement Testing - 9 - HAS-CEP0-HY-REP-0030 Final Working Draft (Revision 0) © 2015 Haskoning Australia Pty Ltd March 2015
2.2.4 ‘Representative’ Sand/Clay Material
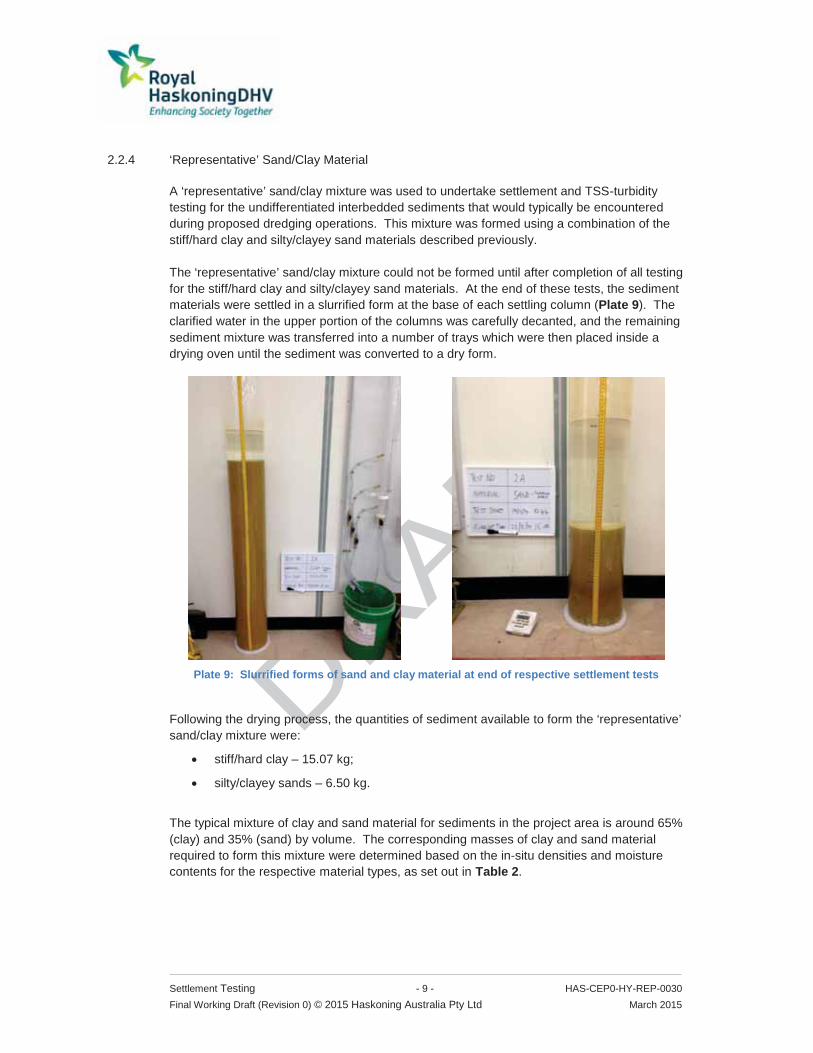
A ‘representative’ sand/clay mixture was used to undertake settlement and TSS-turbidity testing for the undifferentiated interbedded sediments that would typically be encountered during proposed dredging operations. This mixture was formed using a combination of the stiff/hard clay and silty/clayey sand materials described previously. The ‘representative’ sand/clay mixture could not be formed until after completion of all testing for the stiff/hard clay and silty/clayey sand materials. At the end of these tests, the sediment materials were settled in a slurrified form at the base of each settling column (Plate 9). The clarified water in the upper portion of the columns was carefully decanted, and the remaining sediment mixture was transferred into a number of trays which were then placed inside a drying oven until the sediment was converted to a dry form.
Plate 9: Slurrified forms of sand and clay material at end of respective settlement tests
Following the drying process, the quantities of sediment available to form the ‘representative’ sand/clay mixture were:
stiff/hard clay – 15.07 kg;
silty/clayey sands – 6.50 kg.
The typical mixture of clay and sand material for sediments in the project area is around 65% (clay) and 35% (sand) by volume. The corresponding masses of clay and sand material required to form this mixture were determined based on the in-situ densities and moisture contents for the respective material types, as set out in Table 2.

Settlement Testing - 10 - HAS-CEP0-HY-REP-0030 Final Working Draft (Revision 0) © 2015 Haskoning Australia Pty Ltd March 2015
Table 2: Mixture of sand and clay material required for testing of the undifferentiated interbedded sediments
Parameter Clay Sand Comment Density (in-situ) (t/m3) 2.04 2.07 based on data in factual report Moisture Content (in-situ) 22.5% 19.9% based on data in factual report Proportion (by volume) 65% 35% required mix for testing Volume (in-situ) m3 0.65 0.35 for 1m3 of material Wet Mass (in-situ) t 1.32 0.73 for 1m3 of material Dry Mass (in-situ) t 1.08 0.61 for 1m3 of material Proportion (by dry mass) 64% 36% Available Mass (g) 15,070 6,500 Mix for test (g) 11,595 6,500 Total soil mass for test (g) 18,095
The required masses of clay (11.6 kg) and sand (6.5 kg) were combined to form the ‘representative’ sand/clay mixture that was used to undertake settlement and TSS-turbidity testing for the undifferentiated interbedded sediments. Sub-samples of the mixed material were taken for PSD analysis. The laboratory report for this test is provided in Appendix B.
Settlement Testing - 11 - HAS-CEP0-HY-REP-0030 Final Working Draft (Revision 0) © 2015 Haskoning Australia Pty Ltd March 2015
3 TEST PROCEDURES
3.1 Settlement Tests
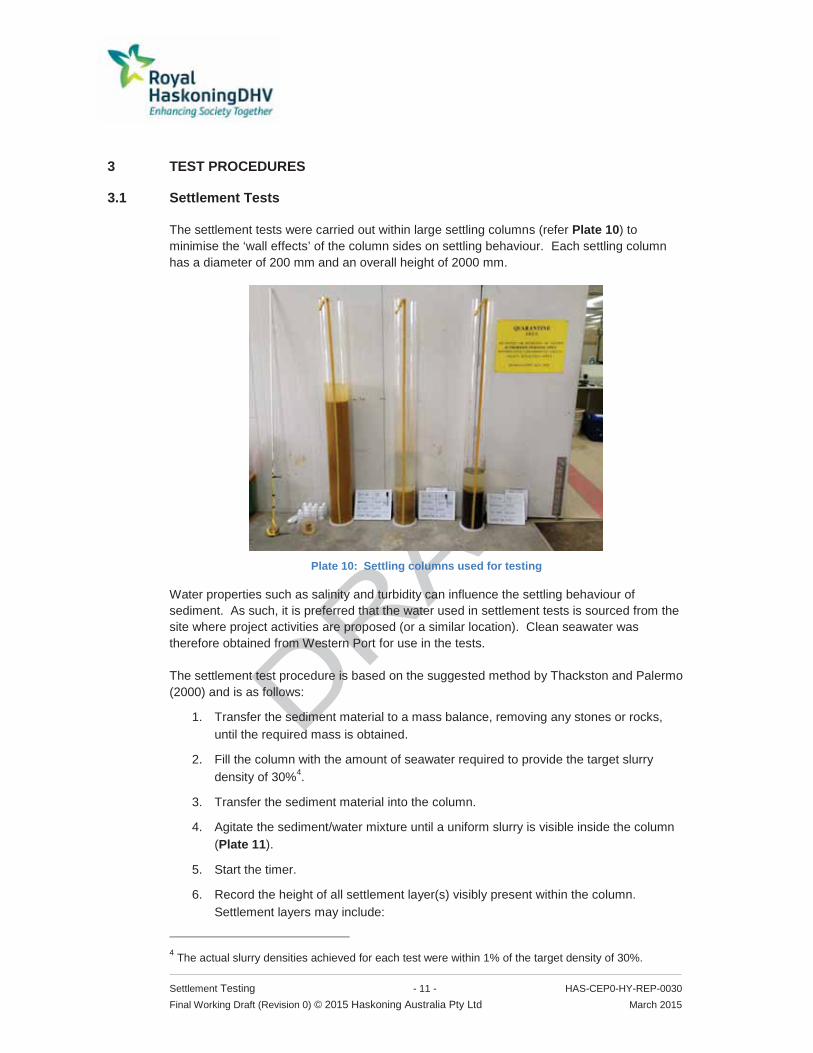
The settlement tests were carried out within large settling columns (refer Plate 10) to minimise the ‘wall effects’ of the column sides on settling behaviour. Each settling column has a diameter of 200 mm and an overall height of 2000 mm.
Plate 10: Settling columns used for testing
Water properties such as salinity and turbidity can influence the settling behaviour of sediment. As such, it is preferred that the water used in settlement tests is sourced from the site where project activities are proposed (or a similar location). Clean seawater was therefore obtained from Western Port for use in the tests. The settlement test procedure is based on the suggested method by Thackston and Palermo (2000) and is as follows:
1. Transfer the sediment material to a mass balance, removing any stones or rocks, until the required mass is obtained.
2. Fill the column with the amount of seawater required to provide the target slurry density of 30%4.
3. Transfer the sediment material into the column.
4. Agitate the sediment/water mixture until a uniform slurry is visible inside the column (Plate 11).
5. Start the timer.
6. Record the height of all settlement layer(s) visibly present within the column. Settlement layers may include:
4 The actual slurry densities achieved for each test were within 1% of the target density of 30%.

Settlement Testing - 12 - HAS-CEP0-HY-REP-0030 Final Working Draft (Revision 0) © 2015 Haskoning Australia Pty Ltd March 2015
a. settled sediment at the bottom of the column;
b. interface between supernatant in upper portion of column and the adjacent mixed layer;
c. any other distinct settlement boundaries.
7. Record the turbidity in the upper portion of the settling column (if feasible)5. The turbidity sensor was gently lowered into the settling column to minimise potential for re-agitation of the sediment/seawater mixture.
8. Take a photo of the settling column at each measurement time.
9. Repeat Steps 6 to 8 at desired time intervals. It is not necessary to maintain a precise or uniform interval, but a larger number of measurements were taken at first (say every few minutes) with an increasing interval (to say every few hours) as the tests progressed.
10. Continue test until settlement rates reduce to near zero.
Plate 11: Agitation of seawater/sediment mix to create uniform slurry
(left: clay material; right: estuarine mud material)
5 Turbidity measurements were undertaken using a Wetlab ECO-NTU sensor. The measurement range of the sensor used was 0-250 NTU, which is considered to be reasonable for the purposes of the settlement testing described herein. However, it should be noted that turbidity measurements could not be undertaken during the early stages of testing due to the typically high turbidity of the slurry mix (i.e., exceeding 250 NTU).
In addition, it should be noted that the Wetlab ECO-NTU sensor generally takes turbidity measurements within a 5 cm field of view. Each settlement test was typically characterised by an upper clarifying layer of supernatant overlying a denser mixed layer, and the turbidity of this mixed layer was very high (i.e., beyond the sensor’s measurement range of 250 NTU). As such, the turbidity of the supernatant could generally not be measured until the thickness of this layer was at least 5 cm.

Settlement Testing - 13 - HAS-CEP0-HY-REP-0030 Final Working Draft (Revision 0) © 2015 Haskoning Australia Pty Ltd March 2015
3.2 TSS-Turbidity Tests
The TSS-turbidity tests for each material type were undertaken following completion of the corresponding settlement test, i.e. for each material type, the same settling columns and material quantities were utilised in both the settlement and TSS-turbidity tests. Thackston and Palmero (2000) recommended specific procedures to develop TSS-turbidity relationships for three distinct areas related to field monitoring:
1. Monitoring re-suspension of solids in the immediate vicinity of sediment disturbance, e.g. adjacent to dredge cutter heads. This test procedure is commonly referred to as the ‘Dilution Test’.
2. Monitoring suspended solids in the effluent discharge from sedimentation ponds. This test procedure is commonly referred to as the ‘Column Test’.
3. Monitoring suspended solids during open water dredged material placement. The ‘Column Test’ procedure is also recommended for this type of monitoring.
TSS-turbidity tests for the material types investigated involved both ‘Dilution Tests’ and ‘Column Tests’, as set out below.
3.2.1 Dilution Tests
Dilution tests were carried out for each material type. The testing methodology involved the following steps:
1. Fill a small (4 to 5 L) measuring cylinder with clean site water obtained from Western Port.
2. Re-agitate the sediment/water mixture inside the settling column until a uniform slurry is visible inside the column.
3. Transfer a small volume of the slurry into the measuring cylinder and mix until a uniform turbidity is evident.
4. Record the turbidity inside the measuring cylinder.
5. Collect a water sample for TSS analysis.
6. Replace the sample volume with clean site water to re-fill the measuring cylinder.
7. Repeat Steps 3 to 6, each time adding slightly more of the slurry mixture such that a progressively concentrated sediment/water mixture is realised inside the measuring cylinder. The objective is to collect a sufficient number of water samples that are characterised by a wide range of TSS and turbidity values such that a strong correlation between TSS and turbidity is developed.
It is noted that the ‘Dilution Test’ described in Thackston and Palmero (2000) involves collecting sub-samples in progressively diluted mixtures of sediment and site water, whereas the method described above involves sampling of progressively concentrated mixtures. However, this difference would not be expected to affect the overall results from the testing.

Settlement Testing - 14 - HAS-CEP0-HY-REP-0030 Final Working Draft (Revision 0) © 2015 Haskoning Australia Pty Ltd March 2015
3.2.2 Column Tests
Column tests were undertaken for each material type (with the exception of the ‘representative’ sand/clay material). The testing procedure involved following steps:
1. Re-agitate the sediment/water mixture inside the settling column until a uniform slurry is visible inside the column.
2. As soon as the slurry has started to settle, take a water sample from just below the water surface (top of column) for TSS analysis. Measure turbidity at the sampling depth (if feasible)6.
3. Repeat Steps 2 and 3 at desired time intervals for the turbidity and TSS determination. It is not necessary to maintain a precise or uniform interval for sampling, but a larger number of samples should be taken at first with an increasing interval as the test progresses. Samples should be taken until the TSS and turbidity have obviously dropped to low levels.
Water samples were analysed for TSS and turbidity by Eurofins (NATA accreditation number 1261) in accordance with the analysis methodologies described by APHA 2540D (TSS) and APHA 2130 (turbidity).
6 As noted in Section 3.1, the Wetlab ECO-NTU sensor has a measurement range of 0-250 NTU, and generally takes turbidity measurements within a 5 cm field of view. As such, turbidity measurements below 250 NTU could not be undertaken until the thickness of the supernatant layer was at least 5 cm.

Settlement Testing - 15 - HAS-CEP0-HY-REP-0030 Final Working Draft (Revision 0) © 2015 Haskoning Australia Pty Ltd March 2015
4 SETTLEMENT TEST RESULTS
4.1 Bulking Factors
4.1.1 Definition
The hydraulic dredging process (for both trailing suction hopper dredgers and cutter suction dredgers) disturbs and mixes large volumes of water into the soil being dredged. This results in the dredged material occupying a larger volume post dredging than the soil originally occupied in situ. This process is referred to as bulking, and is often characterised for a material by a parameter termed the bulking factor. The bulking factor is defined as the ratio of the initial volume of material to the final volume of material after being dredged. For example, if 10,000 m3 of material was dredged, placed in a containment area, allowed to settle out of suspension and occupied a total volume of 20,000 m3 this material would have a bulking factor of 2. This can be represented by the following equation: Equation 1 – Bulking Factor in terms of Volume
where:
Using simple phase diagrams it can be shown that the bulking factor can also be calculated as the ratio of the dry density of the in situ soil divided by the dry density of the material in the containment area. This can be represented by the following equation: Equation 2 – Bulking Factor in terms of Dry Density
where:
4.1.2 Typical Behaviours
For hydraulic dredging, depending on the soils being dredged, the ratio of soil volume to the volume of water added during dredging is typically between 1:7 and 1:10. Therefore, the initial bulking factor prior to settlement of the soil from suspension in the added water can be quite high. The rate at which the soil settles out of suspension and hence the rate the bulking factor reduces is related mainly to the particle size of the soil. Coarse grained soils will fall out of suspension relatively quickly, while fine grained soils may take a long time to settle out of suspension.
4.1.3 Calculations for Bulking Factors from Settlement Tests
As discussed in Section 2, the samples available for testing were initially received in a disturbed state and were then further disturbed during the sample preparation process prior to testing. As a result, the sample density in the laboratory prior to settlement testing was unrepresentative of the in situ density. Hence a direct comparison of the initial sample

Settlement Testing - 16 - HAS-CEP0-HY-REP-0030 Final Working Draft (Revision 0) © 2015 Haskoning Australia Pty Ltd March 2015
volume to the volume in the settlement tube (as presented in Equation 1) is not an accurate representation of the bulking factor. The approach adopted herein was to compare the calculated dry density of the material in the settlement column to the average in situ dry density of the samples which comprised the material being tested. The in situ dry density was based on results from the laboratory analysis undertaken during the project marine geotechnical investigations (WorleyParsons, 2014). Note: where dry density of the sample was not directly reported it has been calculated based on moisture content, and assuming the following: samples would have been fully saturated in situ; all moisture was retained during sampling, a water density of 1.025 t/m3, and a particle density of 2.6 t/m3 or actual density if tested.
4.2 Stiff-Hard Clays
The settlement test for the stiff-hard clay material commenced on 19/11/14 and concluded on 26/11/14 (duration of seven days). A time series plot of the heights of each settlement layer is provided in Figure 2. Several photographs of the settling column taken during the test are provided in Plate 12. Test sheets completed during the stiff-hard clay test are provided in Appendix C. Overall, it is evident that the clay material settled very slowly during the test. A thin layer of sand/silt (around 15 mm) was deposited immediately following the commencement of testing, and this layer thickness did not increase thereafter. The upper portion of the settling column comprised a slowly increasing layer of supernatant water overlying a well-defined mixed layer.
Figure 2: Settlement plot – stiff-hard clays
Settlement Testing - 17 - HAS-CEP0-HY-REP-0030 Final Working Draft (Revision 0) © 2015 Haskoning Australia Pty Ltd March 2015
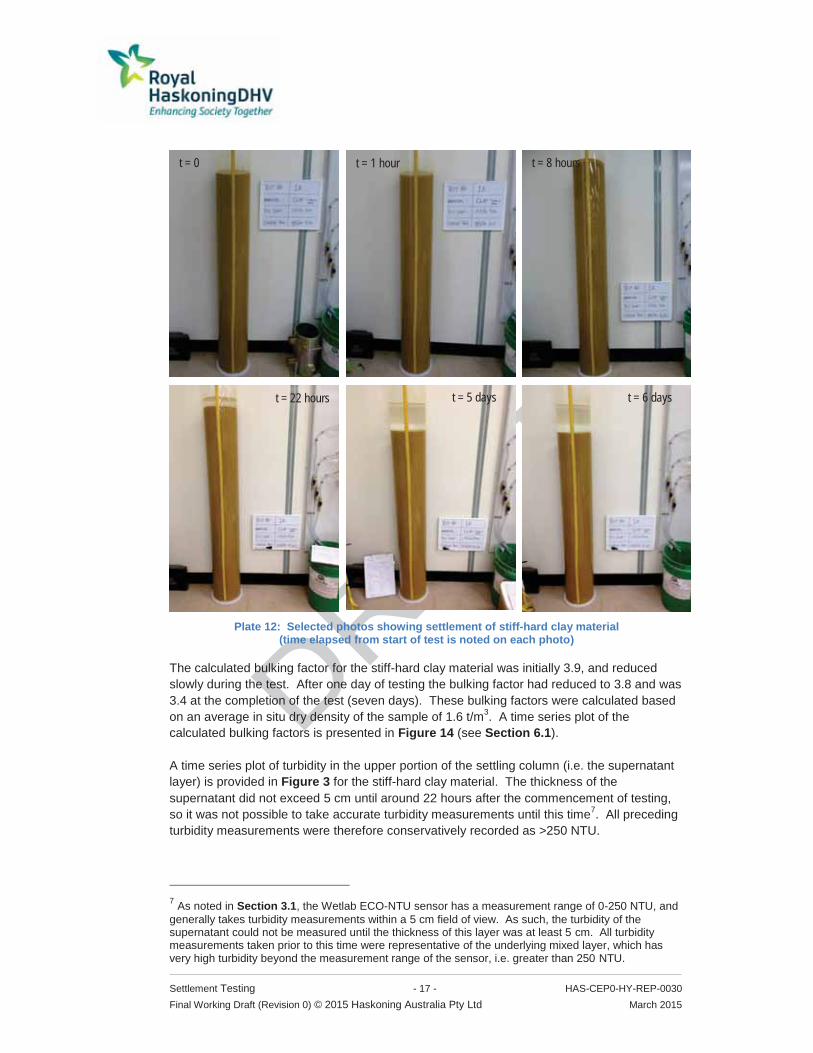
Plate 12: Selected photos showing settlement of stiff-hard clay material (time elapsed from start of test is noted on each photo)
The calculated bulking factor for the stiff-hard clay material was initially 3.9, and reduced slowly during the test. After one day of testing the bulking factor had reduced to 3.8 and was 3.4 at the completion of the test (seven days). These bulking factors were calculated based on an average in situ dry density of the sample of 1.6 t/m3. A time series plot of the calculated bulking factors is presented in Figure 14 (see Section 6.1). A time series plot of turbidity in the upper portion of the settling column (i.e. the supernatant layer) is provided in Figure 3 for the stiff-hard clay material. The thickness of the supernatant did not exceed 5 cm until around 22 hours after the commencement of testing, so it was not possible to take accurate turbidity measurements until this time7. All preceding turbidity measurements were therefore conservatively recorded as >250 NTU.
7 As noted in Section 3.1, the Wetlab ECO-NTU sensor has a measurement range of 0-250 NTU, and generally takes turbidity measurements within a 5 cm field of view. As such, the turbidity of the supernatant could not be measured until the thickness of this layer was at least 5 cm. All turbidity measurements taken prior to this time were representative of the underlying mixed layer, which has very high turbidity beyond the measurement range of the sensor, i.e. greater than 250 NTU.
t = 0 t = 1 hour t = 8 hours
t = 22 hours t = 5 days t = 6 days
Settlement Testing - 18 - HAS-CEP0-HY-REP-0030 Final Working Draft (Revision 0) © 2015 Haskoning Australia Pty Ltd March 2015
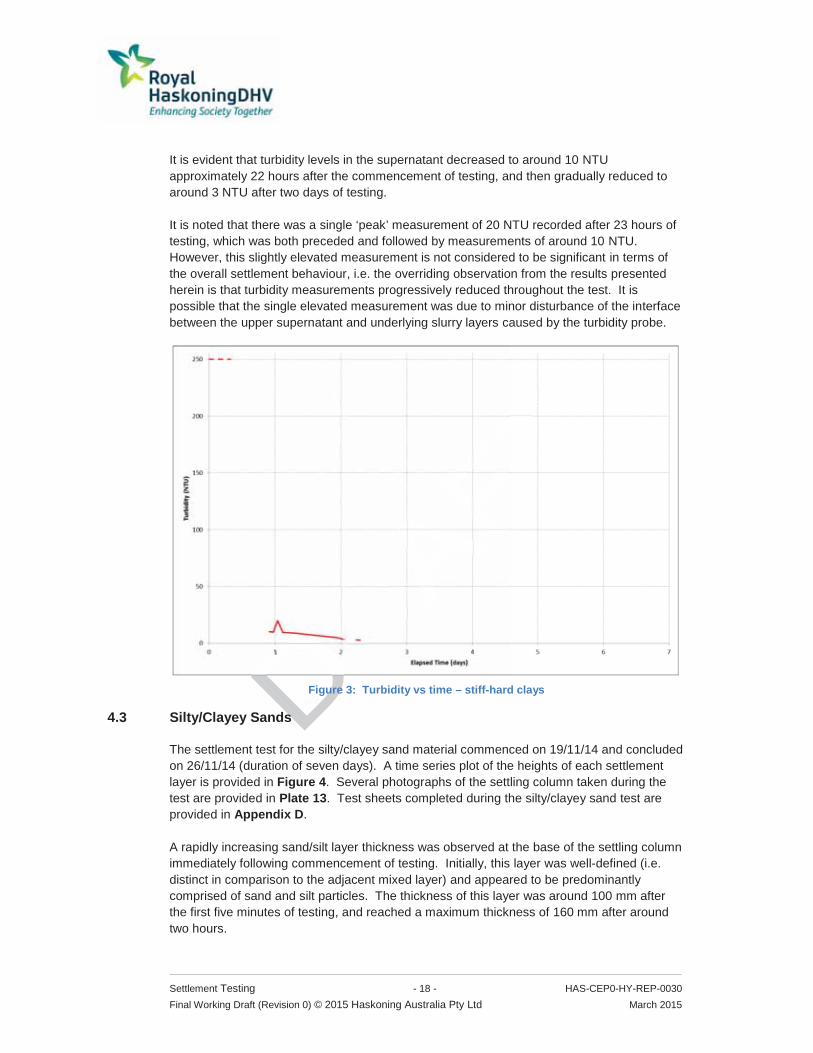
It is evident that turbidity levels in the supernatant decreased to around 10 NTU approximately 22 hours after the commencement of testing, and then gradually reduced to around 3 NTU after two days of testing. It is noted that there was a single ‘peak’ measurement of 20 NTU recorded after 23 hours of testing, which was both preceded and followed by measurements of around 10 NTU. However, this slightly elevated measurement is not considered to be significant in terms of the overall settlement behaviour, i.e. the overriding observation from the results presented herein is that turbidity measurements progressively reduced throughout the test. It is possible that the single elevated measurement was due to minor disturbance of the interface between the upper supernatant and underlying slurry layers caused by the turbidity probe.
Figure 3: Turbidity vs time – stiff-hard clays
4.3 Silty/Clayey Sands
The settlement test for the silty/clayey sand material commenced on 19/11/14 and concluded on 26/11/14 (duration of seven days). A time series plot of the heights of each settlement layer is provided in Figure 4. Several photographs of the settling column taken during the test are provided in Plate 13. Test sheets completed during the silty/clayey sand test are provided in Appendix D. A rapidly increasing sand/silt layer thickness was observed at the base of the settling column immediately following commencement of testing. Initially, this layer was well-defined (i.e. distinct in comparison to the adjacent mixed layer) and appeared to be predominantly comprised of sand and silt particles. The thickness of this layer was around 100 mm after the first five minutes of testing, and reached a maximum thickness of 160 mm after around two hours.

Settlement Testing - 19 - HAS-CEP0-HY-REP-0030 Final Working Draft (Revision 0) © 2015 Haskoning Australia Pty Ltd March 2015
This sand/silt layer was subsequently overlaid with finer sediment (silt and clay) which was less distinct from the adjacent mixed layer. The combined thickness of the sand/silt/clay layer was 200 mm after around three hours, and 280 mm after around seven hours. The sand/silt/clay layer reached a maximum thickness of 290 mm approximately 24 hours after the commencement of testing, and did not increase during the remainder of the test. A photograph showing the sand/silt layer taken around two days after the commencement of testing is provided in Plate 14. The well-defined sand layer is evident in the lower section of the settling column, which is overlaid by the less well-defined silt/clay material and adjacent mixed zone.
Figure 4: Settlement plot – silty/clayey sands

Settlement Testing - 20 - HAS-CEP0-HY-REP-0030 Final Working Draft (Revision 0) © 2015 Haskoning Australia Pty Ltd March 2015
Plate 13: Selected photos showing settlement of silty/clayey sand material (time elapsed from start of test is noted on each photo)
t = 1 hour t = 4 hours
t = 22 hours t = 2 days t = 6 days
t = 4 minutes

Settlement Testing - 21 - HAS-CEP0-HY-REP-0030 Final Working Draft (Revision 0) © 2015 Haskoning Australia Pty Ltd March 2015
Plate 14: Settlement layers evident in silty/clayey sand material
(approximately two days after commencement of test)
The calculated bulking factor for the silty/clayey sand material was initially 4.2, which then reduced to 2.6 after one day of testing, and was 2.0 at the completion of the test (seven days). These bulking factors were calculated based on an average in situ dry density of the sample of 1.6 t/m3. A time series plot of the calculated bulking factors is presented in Figure 14 (see Section 6.1). A time series plot of turbidity in the upper portion of the settling column (i.e. the supernatant layer) is provided in Figure 5 for the silty/clayey sand material. The thickness of the supernatant did not exceed 5 cm until around 2.5 hours after the commencement of testing, so it was not possible to take accurate turbidity measurements until this time8. All preceding turbidity measurements were therefore conservatively recorded as >250 NTU. It is evident that turbidity levels in the supernatant decreased to around 50 NTU approximately 5 hours after the commencement of testing, while turbidity levels of around 30 NTU were recorded after approximately 7 hours. Turbidity levels subsequently decreased to around 10 NTU approximately 24 hours after the commencement of testing, and then gradually reduced to below 5 NTU after around five days of testing.
8 As noted in Section 3.1, the Wetlab ECO-NTU sensor has a measurement range of 0-250 NTU, and generally takes turbidity measurements within a 5 cm field of view. As such, the turbidity of the supernatant could not be measured until the thickness of this layer was at least 5 cm. All turbidity measurements taken prior to this time were representative of the underlying mixed layer, which has very high turbidity beyond the measurement range of the sensor, i.e. greater than 250 NTU.
Well-defined sand/silt layer
Silt/clay deposition
Upper mixed zone
Supernatant

Settlement Testing - 22 - HAS-CEP0-HY-REP-0030 Final Working Draft (Revision 0) © 2015 Haskoning Australia Pty Ltd March 2015
Figure 5: Turbidity vs time – silty/clayey sands
4.4 Soft Silty Clays
The settlement test for the soft silty clay (inshore) material commenced on 15/12/14 and concluded on 22/12/14 (duration of seven days). A time series plot of the heights of each settlement layer is provided in Figure 6. Several photographs of the settling column taken during the test are provided in Plate 15. Test sheets completed during the soft silty clay test are provided in Appendix E. A 25 mm layer of sand/silt was deposited immediately following the commencement of testing, which increased to a thickness of around 165 mm after around one hour, with negligible change observed thereafter. The upper portion of the settling column comprised a slowly increasing layer of supernatant water overlying a well-defined mixed layer.

Settlement Testing - 23 - HAS-CEP0-HY-REP-0030 Final Working Draft (Revision 0) © 2015 Haskoning Australia Pty Ltd March 2015
Figure 6: Settlement plot – soft silty clays (inshore)

Settlement Testing - 24 - HAS-CEP0-HY-REP-0030 Final Working Draft (Revision 0) © 2015 Haskoning Australia Pty Ltd March 2015
Plate 15: Selected photos showing settlement of soft silty clay material (time elapsed from start of test is noted on each photo)
The calculated bulking factor for the soft silty clay material was initially 3.4, which then reduced to 2.2 after one day of testing, and was 1.9 at the completion of the test (seven days). These bulking factors were calculated based on an average in situ dry density of the sample of 1.3 t/m3. A time series plot of the calculated bulking factors is presented in Figure 14 (see Section 6.1). A time series plot of turbidity in the upper portion of the settling column (i.e. the supernatant layer) is provided in Figure 7 for the soft silty clay material. It is evident that turbidity levels in the supernatant decreased to around 60 NTU approximately 19 hours after the commencement of testing, while turbidity levels of around 18 NTU were recorded after approximately 23 hours.
t = 3 days t = 7 days
t = 0 t = 2 hours t = 6 hours
t = 24 hours

Settlement Testing - 25 - HAS-CEP0-HY-REP-0030 Final Working Draft (Revision 0) © 2015 Haskoning Australia Pty Ltd March 2015
Turbidity levels subsequently increased to around 43 NTU over the following two hours (i.e. until approximately 25 hours after the commencement of testing), and then gradually reduced throughout the remainder of the test. Turbidity levels decreased to around 15 NTU approximately two days after the commencement of testing, and then gradually reduced to below 4 NTU after around four days of testing. The brief increase in turbidity values observed after 23 hours of testing is not considered to be significant in terms of the overall settlement behaviour, i.e. the overriding observation from the results presented herein is that turbidity measurements progressively reduced throughout the test. It is possible that the elevated measurements were related to minor disturbance of the interface between the upper supernatant and underlying slurry layers caused by the turbidity probe.
Figure 7: Turbidity vs time – soft silty clay
4.5 ‘Representative’ Sand/Clay Material
The settlement test for the sand/clay material that is representative of the undifferentiated interbedded sediments of Western Port commenced on 8/12/14 and concluded on 16/12/14 (duration of eight days). A time series plot of the heights of each settlement layer is provided in Figure 8. Several photographs of the settling column taken during the test are provided in Plate 16. Test sheets completed during the ‘representative’ sand/clay test are provided in Appendix F. A 25 mm layer of sand/silt was deposited immediately following the commencement of testing, which increased to a thickness of around 285 mm after around three hours, with negligible change observed thereafter. The upper portion of the settling column comprised a slowly increasing layer of supernatant water overlying a well-defined mixed layer.

Settlement Testing - 26 - HAS-CEP0-HY-REP-0030 Final Working Draft (Revision 0) © 2015 Haskoning Australia Pty Ltd March 2015
Figure 8: Settlement plot – ‘representative’ sand/clay material

Settlement Testing - 27 - HAS-CEP0-HY-REP-0030 Final Working Draft (Revision 0) © 2015 Haskoning Australia Pty Ltd March 2015
Plate 16: Selected photos showing settlement of ‘representative’ sand/clay material (time elapsed from start of test is noted on each photo)
The calculated bulking factor for the ‘representative’ sand/clay material was initially 4.4, which then reduced to 3.2 after one day of testing, and was 2.1 at the completion of the test (eight days). These bulking factors were calculated based on an average in situ dry density of the sample of 1.7 t/m3. A time series plot of the calculated bulking factors is presented in Figure 14 (see Section 6.1). A time series plot of turbidity in the upper portion of the settling column (i.e. the supernatant layer) is provided in Figure 9 for the ‘representative’ sand/clay material. The thickness of the supernatant did not exceed 5 cm until around one hour after the commencement of testing, so it was not possible to take accurate turbidity measurements until this time9. All preceding turbidity measurements were therefore conservatively recorded as >250 NTU.
9 As noted in Section 3.1, the Wetlab ECO-NTU sensor has a measurement range of 0-250 NTU, and generally takes turbidity measurements within a 5 cm field of view. As such, the turbidity of the supernatant could not be measured until the thickness of this layer was at least 5 cm. All turbidity measurements taken prior to this time were representative of the underlying mixed layer, which has very high turbidity beyond the measurement range of the sensor, i.e. greater than 250 NTU.
t = 1 hour t = 3 hours t = 0
t = 22 hours t = 2 days t = 4 days

Settlement Testing - 28 - HAS-CEP0-HY-REP-0030 Final Working Draft (Revision 0) © 2015 Haskoning Australia Pty Ltd March 2015
It is evident that turbidity levels in the supernatant decreased to around 100 NTU approximately one hour after the commencement of testing, while turbidity levels of around 30 NTU were recorded after approximately two hours. Turbidity levels subsequently decreased to a NTU approximately 24 hours after the commencement of testing, and then gradually reduced to below 5 NTU after around three days of testing.
Figure 9: Turbidity vs time – ‘representative’ sand/clay material

Settlement Testing - 29 - HAS-CEP0-HY-REP-0030 Final Working Draft (Revision 0) © 2015 Haskoning Australia Pty Ltd March 2015
5 TSS-TURBIDITY TEST RESULTS
5.1 Stiff-Hard Clays
TSS-turbidity testing for stiff-hard clays comprised both a Column Test and Dilution Test, which were undertaken on 26/11/14 and 2/12/14 (respectively). Certificates of Analysis provided by Eurofins for the TSS and turbidity analyses undertaken for samples collected during both tests are provided in Appendix G. Test sheets completed during the TSS-turbidity tests for the stiff-hard clay material are provided in Appendix H, which includes turbidity measurements undertaken during testing for each sample. It is noted that 15 of the 18 samples collected during the Column Test were characterised by very high TSS concentrations ranging between 5,000 mg/L and 240,000 mg/L (Sample IDs CB1 to CB15, see Appendix G). It should be noted that the water quality limit for proposed dredging works would likely be specified in terms of a much lower TSS concentration, e.g. 50 mg/L. Therefore, the TSS-turbidity relationship should focus on a range of TSS values with a generally similar magnitude, say zero to several hundred mg/L. Including significantly higher TSS values may skew the TSS-turbidity relationship which could result in the establishment of an inaccurate turbidity limit for compliance monitoring. As such, results for Sample IDs CB1 to CB15 have not been included in the TSS-turbidity relationship for stiff-hard clays. A plot of TSS versus turbidity for all other data collected during testing (i.e. both the Column Test and Dilution Test results) is provided in Figure 10. This dataset is plotted with a linear line of best fit which has an R2 value of 0.7810. It should be noted that the turbidity data presented in this plot (and the plots for all other material types, refer Sections 5.2 to 5.4) are from the following sources for each test type:
for samples collected during the Dilution Tests, the plotted turbidity data are the measurements taken during testing, rather than the laboratory results11;
for samples collected during the Column Tests, the plotted turbidity data are the laboratory results, rather than the measurements taken during testing12.
10 The R2 value, also known as the coefficient of determination, is a measure of how close the plotted data are to the fitted regression line, i.e. the line of best fit. An R2 value of 1 indicates that the regression line perfectly fits the data. 11 Turbidity measurements taken during the Dilution Tests were carried out in a water volume of 4 to 5 L, while the laboratory measurements were undertaken in a smaller sample volume of 200 mL. Turbidity monitoring equipment can be sensitive to light penetration and reflections inside the sampling vessel, so it is generally preferred to take turbidity measurements in larger sample volumes. In any case, it is noted that the turbidity measurements taken during testing were quite similar to the laboratory measurements, and the use of either dataset does not result in significantly different TSS-turbidity relationships. 12 As noted in Section 3.1, the Wetlab ECO-NTU sensor has a measurement range of 0-250 NTU, and generally takes turbidity measurements within a 5 cm field of view. The majority of samples collected during the Column Tests were characterised by turbidity levels beyond the measurement range of the sensor; this was not an issue for the laboratory measurements. Further, many of the remaining samples (i.e., the low TSS samples) were collected from the upper supernatant in the settling column when the thickness of this layer was less than 5 cm, so the turbidity measurements may have been influenced by the underlying mixed layer.

Settlement Testing - 30 - HAS-CEP0-HY-REP-0030 Final Working Draft (Revision 0) © 2015 Haskoning Australia Pty Ltd March 2015
Figure 10: TSS-turbidity plot – stiff-hard clays
5.2 Silty/Clayey Sands
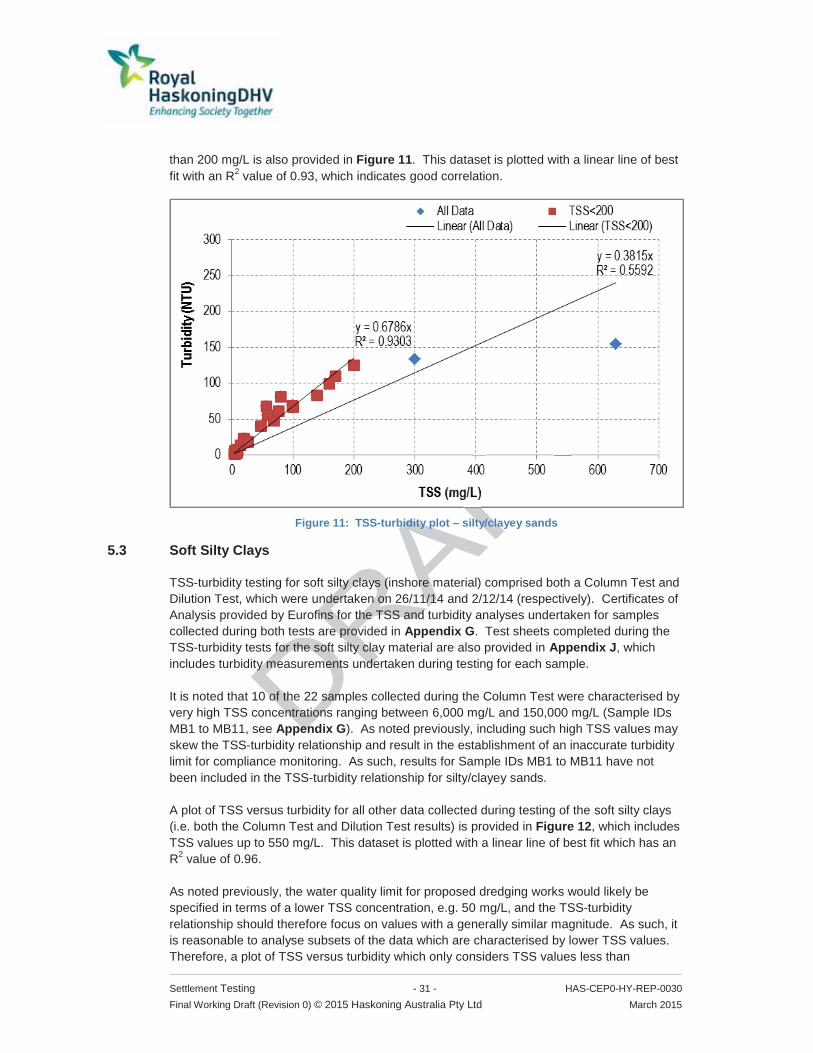
TSS-turbidity testing for silty/clayey sands comprised both a Column Test and Dilution Test, which were undertaken on 26/11/14 and 2/12/14 (respectively). Certificates of Analysis provided by Eurofins for the TSS and turbidity analyses undertaken for samples collected during both tests are provided in Appendix G. Test sheets completed during the TSS-turbidity tests for the silty/clayey sand material are also provided in Appendix I, which includes turbidity measurements undertaken during testing for each sample. It is noted that 11 of the 26 samples collected during the Column Test were characterised by very high TSS concentrations ranging between 5,000 mg/L and 240,000 mg/L (Sample IDs SB1 to SB11, see Appendix G). As noted previously, including such high TSS values may skew the TSS-turbidity relationship and result in the establishment of an inaccurate turbidity limit for compliance monitoring. As such, results for Sample IDs SB1 to SB11 have not been included in the TSS-turbidity relationship for silty/clayey sands. A plot of TSS versus turbidity for all other data collected during testing of the silty/clayey sands (i.e. both the Column Test and Dilution Test results) is provided in Figure 11. This dataset is plotted with a linear line of best fit. However, it can be seen that the TSS-turbidity relationship for this dataset is skewed by the two highest TSS results (300 mg/L and 630 mg/L), which has resulted in relatively low R2 value of 0.56. It is possible that these samples included relatively coarse particles which settled quickly and therefore did not contribute to the turbidity measurement. As such, it is reasonable to analyse subsets of the data which are characterised by lower TSS values. Therefore, a plot of TSS versus turbidity which only considers TSS values less
Settlement Testing - 31 - HAS-CEP0-HY-REP-0030 Final Working Draft (Revision 0) © 2015 Haskoning Australia Pty Ltd March 2015
than 200 mg/L is also provided in Figure 11. This dataset is plotted with a linear line of best fit with an R2 value of 0.93, which indicates good correlation.
Figure 11: TSS-turbidity plot – silty/clayey sands
5.3 Soft Silty Clays
TSS-turbidity testing for soft silty clays (inshore material) comprised both a Column Test and Dilution Test, which were undertaken on 26/11/14 and 2/12/14 (respectively). Certificates of Analysis provided by Eurofins for the TSS and turbidity analyses undertaken for samples collected during both tests are provided in Appendix G. Test sheets completed during the TSS-turbidity tests for the soft silty clay material are also provided in Appendix J, which includes turbidity measurements undertaken during testing for each sample. It is noted that 10 of the 22 samples collected during the Column Test were characterised by very high TSS concentrations ranging between 6,000 mg/L and 150,000 mg/L (Sample IDs MB1 to MB11, see Appendix G). As noted previously, including such high TSS values may skew the TSS-turbidity relationship and result in the establishment of an inaccurate turbidity limit for compliance monitoring. As such, results for Sample IDs MB1 to MB11 have not been included in the TSS-turbidity relationship for silty/clayey sands. A plot of TSS versus turbidity for all other data collected during testing of the soft silty clays (i.e. both the Column Test and Dilution Test results) is provided in Figure 12, which includes TSS values up to 550 mg/L. This dataset is plotted with a linear line of best fit which has an R2 value of 0.96. As noted previously, the water quality limit for proposed dredging works would likely be specified in terms of a lower TSS concentration, e.g. 50 mg/L, and the TSS-turbidity relationship should therefore focus on values with a generally similar magnitude. As such, it is reasonable to analyse subsets of the data which are characterised by lower TSS values. Therefore, a plot of TSS versus turbidity which only considers TSS values less than

Settlement Testing - 32 - HAS-CEP0-HY-REP-0030 Final Working Draft (Revision 0) © 2015 Haskoning Australia Pty Ltd March 2015
300 mg/L is also provided in Figure 12. This dataset is plotted with a linear line of best fit which has an R2 value of 0.97.
Figure 12: TSS-turbidity plot – soft silty clays
5.4 ‘Representative’ Sand/Clay Material
TSS-turbidity testing for the sand/clay material that is representative of the undifferentiated interbedded sediments of Western Port comprised a Dilution Test only, which was undertaken on 16/12/14. A Column Test was not undertaken for this material. The Certificate of Analysis provided by Eurofins for the TSS and turbidity analyses undertaken for samples collected during testing is provided in Appendix G. Test sheets completed during the TSS-turbidity tests for the sand/clay material are also provided in Appendix K, which includes turbidity measurements undertaken during testing for each sample. A plot of TSS versus turbidity for all data collected during testing of the representative sand/clay material (i.e. both the Column Test and Dilution Test results) is provided in Figure 13, which includes TSS values up to 450 mg/L. This dataset is plotted with a linear line of best fit which has an R2 value of 0.97. As discussed previously, it is reasonable to analyse subsets of the data which are characterised by lower TSS values. Therefore, a plot of TSS versus turbidity which only considers TSS values less than 300 mg/L is also provided in Figure 13. This dataset is plotted with a linear line of best fit which has an R2 value of 0.99.

Settlement Testing - 33 - HAS-CEP0-HY-REP-0030 Final Working Draft (Revision 0) © 2015 Haskoning Australia Pty Ltd March 2015
Figure 13: TSS-turbidity plot – ‘representative’ sand/clay material
5.5 Summary of TSS-Turbidity Relationships
A summary of the TSS-turbidity relationships determined for each material type and dataset considered is given in Table 3, including the turbidity value equivalent to 50 mg/L of suspended solids for each case considered.
Table 3: Summary of TSS-turbidity relationships for each material type
Material Type Data Used Number of values
R2 value
Turbidity (NTU) equivalent to 50 mg/L
Stiff-hard clay All (TSS<160) 14 0.78 48
Silty/clayey sand All (TSS<630) 27 0.56 19 TSS<300 25 0.93 34
Soft silty clay (inshore) All (TSS<550) 24 0.96 17 TSS<300 18 0.97 20
‘Representative’ sand/clay (undifferentiated interbedded sediments)
All (TSS<450) 13 0.97 31 TSS<300 11 0.99 35
The turbidity value equivalent to 50 mg/L suspended solids was 48 NTU for the stiff-hard clay material, which was the highest for each material type and dataset. This is likely related to the relatively high proportion of fines present in this material. For the silty/clayey sand, the turbidity value equivalent to 50 mg/L suspended solids ranged from 19 NTU (all data considered) to 34 NTU (TSS values less than 300 mg/L only). The R2 values for these two datasets were 0.56 and 0.93 (respectively), which indicates that a much better correlation between TSS and turbidity exists for the smaller dataset.

Settlement Testing - 34 - HAS-CEP0-HY-REP-0030 Final Working Draft (Revision 0) © 2015 Haskoning Australia Pty Ltd March 2015
For the soft silty clay (inshore), the turbidity value equivalent to 50 mg/L suspended solids ranged from 17 NTU (all data considered) to 20 NTU (TSS values less than 300 mg/L only). The R2 values for these two datasets were 0.96 and 0.97 (respectively), which indicates strong correlations between TSS and turbidity for both datasets. For the ‘representative’ sand/clay material, the turbidity value equivalent to 50 mg/L suspended solids ranged from 31 NTU (all data considered) to 35 NTU (TSS values less than 300 mg/L only). The R2 values for these two datasets were 0.97 and 0.99 (respectively), which indicates strong correlations between TSS and turbidity for both datasets. It can be seen that the turbidity values equivalent to 50 mg/L suspended solids increase when a reduced dataset (based on TSS values) is considered. This may be related to the higher proportion of coarser sediment particles that are generally present in samples with higher TSS values.

Settlement Testing - 35 - HAS-CEP0-HY-REP-0030 Final Working Draft (Revision 0) © 2015 Haskoning Australia Pty Ltd March 2015
6 DISCUSSION
6.1 Settling Behaviour
A time series plot of the calculated bulking factors for each settlement test is presented in Figure 14. The stiff-hard clay material was characterised by the highest bulking factor at the end of testing (3.4), while similar bulking factors of around 2.0 were calculated at the end of testing for all other material types. This indicates that the clay material to be dredged would experience the highest degree of bulking, as expected. The findings presented herein should be considered further as part of the Dredging and Reclamation Design work package.
Figure 14: Calculated bulking factors for each settlement test
As discussed in Section 4.1, the bulking factor is the ratio of in situ volume of soil to the volume after dredging, and can therefore be expressed as a function of the in situ density of the soil and the density of the soil after being dredged. Time series plots of the calculated dry density for each settlement test are presented in Figure 15. These results indicate that the stiff-hard clay material is characterised by relatively low dry densities during settlement in comparison to the other material types. Again, these findings should be considered further as part of the Dredging and Reclamation Design work package.

Settlement Testing - 36 - HAS-CEP0-HY-REP-0030 Final Working Draft (Revision 0) © 2015 Haskoning Australia Pty Ltd March 2015
Figure 15: Calculated dry densities for each settlement test
Under controlled environmental conditions, two materials of the same composition should form a final product of the same density after dredging, regardless of the starting density. That is, two materials of the same composition but different densities when completely disturbed, which are then allowed to settle out hydraulically, should form a material of the same final density. Following this logic, the calculated dry densities for the tested materials reported herein should be relevant to other materials within the dredge area with similar compositions. As such, classification tests were carried out on all samples tested, for reference against classification tests carried out during the geotechnical investigations. Laboratory reports for these classification tests are provided in Appendix B, and are summarised in Table 4.
Table 4: Summary of soil properties determined for materials used in settlement tests
Material Type
Assumed in situ dry
density (t/m3)
*Clay (%)
*Silt (%)
Total Fines (%)
Sand (%) Gravel (%)
Plasticity Index (%)
Liquid Limit (%)
Stiff-hard clay 1.6 32 30 62 38 0 30 47
Silty/clayey sand
1.6 9 21 30 68 2 4 21
Soft silty clay (inshore)
1.3 22 25 47 47 6 15 33
‘Representative’ sand/clay
1.6 15 23 38 62 0 19 33
*Clay sized particles have been taken as being less than 0.002 mm and Silt sized particles between 0.002 mm and 0.075 mm.

Settlement Testing - 37 - HAS-CEP0-HY-REP-0030 Final Working Draft (Revision 0) © 2015 Haskoning Australia Pty Ltd March 2015
It is noted that the in situ densities of the materials proposed to be dredged are quite variable, which would affect the degree of bulking observed during material placement activities. Therefore, the in situ densities of the materials to be dredged should be carefully considered when carrying out bulking calculations. This should be considered further as part of the Dredging and Reclamation Design work package.
6.2 TSS-Turbidity
The strong correlations between turbidity and suspended solids found in the testing means that turbidity can be confidently used as a surrogate for suspended solids in real time monitoring during dredging operations. Samples with high TSS values (i.e. several hundred mg/L or greater) are often characterised by a relatively high proportion of coarser sediment particles which do not necessarily contribute to higher turbidity measurements (in comparison to lower TSS samples). As such, higher TSS values can skew the TSS-turbidity relationship. Further, given that the turbidity limit for proposed dredging works would likely be specified in terms of a TSS concentration in the order of (say) 50 mg/L, the TSS-turbidity relationships used for the purposes of developing turbidity limits for compliance monitoring should focus on a range of TSS values that is consistent with this limit. Considering much higher TSS values may result in the establishment of an inaccurate turbidity limit for compliance monitoring. The TSS-turbidity relationships presented herein which consider TSS values less than 300 mg/L are therefore considered most relevant for the purposes of informing the development of turbidity limits for compliance monitoring. For each material type tested, the turbidity values equivalent to 50 mg/L suspended solids for these relationships are as follows:
stiff-hard clays – 48 NTU;
silty/clayey sands – 34 NTU;
very soft silty clays (located close to shore) – 20 NTU; and,
‘representative’ sand/clay material – 35 NTU.
It is evident that the TSS-turbidity relationships are reasonably variable for the different sediment types that would be dredged. This should be considered further as part of any establishment of turbidity limits for project activities. It should also be noted that the TSS-turbidity relationships presented herein are based entirely on laboratory data. These results are generally considered to be suitable for establishing preliminary turbidity limits for compliance monitoring. Collection of field TSS-turbidity data prior to dredging (see below) and regular TSS sampling (and corresponding turbidity measurements) during dredging and material placement activities would be recommended so that the relationship between turbidity and suspended solids could be continually validated and improved.
Settlement Testing - 38 - HAS-CEP0-HY-REP-0030 Final Working Draft (Revision 0) © 2015 Haskoning Australia Pty Ltd March 2015
It is important to develop an understanding of the TSS-turbidity relationship(s) for the waters of Western Port under existing conditions, i.e. in the absence of dredging works. This is because three of the four material types tested in the laboratory may not be representative of surface sediments in the Western Port13. Background turbidity should also be considered further as part of any establishment of turbidity limits for project activities. It is noted that TSS sampling was undertaken in Western Port between March 2014 and October 2014 as part of several water quality profiling surveys undertaken for the project. This data was analysed as part of this investigation, however no clear relationship between TSS and turbidity was evident. As such, it is recommended that ongoing TSS sampling (and corresponding turbidity measurements) be undertaken in Western Port as part of baseline data collection activities. It is envisaged that this sampling would be undertaken mainly during elevated turbidity events so that the TSS-turbidity relationship under existing conditions can be established. Ideally, this would involve sampling in response to a wide range of forcing conditions which influence turbidity levels in Western Port, such as rainfall events, spring tides, strong winds and large vessel movements. Opportunistic data collection could also be undertaken as part of other marine based data collection activities.
13 Elevated turbidity events in Western Port under existing conditions are related to the suspension of surface sediments. Of the four material types tested, only the very soft silty clays (located close to shore) were predominantly comprised of surface sediments (refer Appendix A).

Settlement Testing - 39 - HAS-CEP0-HY-REP-0030 Final Working Draft (Revision 0) © 2015 Haskoning Australia Pty Ltd March 2015
7 REFERENCES
Thackston, E.L. and Palmero M.R, (2000), “Improved methods for the correlation of turbidity and suspended solids for monitoring”, DOER Technical Notes Collection (ENDC TN-DOER-E8), U.S. Army Research and Development Centre, Vicksburg, MS. WorleyParsons (2014), Port of Hastings Container Expansion Project – Contract PoHDA 2013-001: Factual Report on Marine Geotechnical Investigation, October 2014

Settlement Testing HAS-CEP0-HY-REP-0030 Final Working Draft (Revision 0) © 2015 Haskoning Australia Pty Ltd March 2015
APPENDIX A Locations and Masses of Samples used for
Testing

Settlement Testing HAS-CEP0-HY-REP-0030 Final Working Draft (Revision 0) © 2015 Haskoning Australia Pty Ltd March 2015
Table A1: Locations and Masses of Samples used for Testing
Borehole Sample
Start Depth
Sample Finish Depth
Material Type Surface RL Sample
Start RL Sample
Finish RL Sample Mass
ref. no. m m m CD m CD m CD g
D18
0 0.45 -12.51 -12.5 -13.0 1256 1 1.4 -12.51 -13.5 -13.9 776
2.5 2.9 -12.51 -15.0 -15.4 1563 4 4.4 -12.51 -16.5 -16.9 530
4.5 4.95 -12.51 -17.0 -17.5 181 6 6.4 -12.51 -18.5 -18.9 1045
7.16 7.61 -12.51 -19.7 -20.1 681
R19 1 1.45 -5.83 -6.8 -7.3 2126
4.5 4.95 -5.83 -10.3 -10.8 132 13.5 13.95 -5.83 -19.3 -19.8 131
R21
0.5 0.8 -7.97 -8.5 -8.8 248 1.2 1.5 -7.97 -9.2 -9.5 133 3 3.3 -7.97 -11.0 -11.3 122
3.3 3.75 -7.97 -11.3 -11.7 988 4.5 4.95 -7.97 -12.5 -12.9 831 5 5.45 -7.97 -13.0 -13.4 152
6.45 6.9 -7.97 -14.4 -14.9 324 8.5 8.95 -7.97 -16.5 -16.9 653 10 10.45 -7.97 -18.0 -18.4 752 11 11.1 -7.97 -19.0 -19.1 252
11.5 11.95 -7.97 -19.5 -19.9 1942
S11
1 1.5 -8.02 -9.0 -9.5 1293 4.5 4.95 -8.02 -12.5 -13.0 415 6 6.45 -8.02 -14.0 -14.5 195 8 8.45 -8.02 -16.0 -16.5 841
S12
0 0.1 -1.8 -1.8 -1.9 522 2 2.4 -1.8 -3.8 -4.2 38
2.5 2.9 -1.8 -4.3 -4.7 115 1.5 1.9 -1.8 -3.3 -3.7 83 3.5 3.9 -1.8 -5.3 -5.7 168 4.5 5 -1.8 -6.3 -6.8 1576 7.5 8 -1.8 -9.3 -9.8 1203 9 9.5 -1.8 -10.8 -11.3 990
10.5 11 -1.8 -12.3 -12.8 1735 12 12.5 -1.8 -13.8 -14.3 1589
13.8 13.9 -1.8 -15.6 -15.7 171 15 15.45 -1.8 -16.8 -17.3 224

Settlement Testing HAS-CEP0-HY-REP-0030 Final Working Draft (Revision 0) © 2015 Haskoning Australia Pty Ltd March 2015
Borehole Sample
Start Depth
Sample Finish Depth
Material Type Surface RL Sample
Start RL Sample
Finish RL Sample Mass
ref. no. m m m CD m CD m CD g 16.5 16.95 -1.8 -18.3 -18.8 842
S13 4.5 4.95 -8.72 -13.2 -13.7 100 3 3.45 -8.72 -11.7 -12.2 688
S14r 0.5 0.7 -10.7 -11.2 -11.4 1378 R1 0.5 0.95 0.55 0.1 -0.4 820 R5 0 0.1 -2.55 -2.6 -2.7 159
R15
0 0.4 -0.92 -0.9 -1.3 1570 1 1.4 -0.92 -1.9 -2.3 37
0.5 0.9 -0.92 -1.4 -1.8 235 1 1.4 -0.92 -1.9 -2.3 168
R18 0 0.45 0.7 0.7 0.3 625
0.5 0.9 0.7 0.2 -0.2 623 3 3.4 0.7 -2.3 -2.7 1428
R23 1.5 2.5 0.92 -0.6 -1.6 660 1 1.5 0.92 -0.1 -0.6 901
S17r
2 2.45 -2.03 -4.0 -4.5 133 1 1.45 -2.03 -3.0 -3.5 423
1.5 1.95 -2.03 -3.5 -4.0 810 4.1 4.5 -2.03 -6.1 -6.5 1045 5.6 6 -2.03 -7.6 -8.0 232 3 3.45 -2.03 -5.0 -5.5 480
S15 0 0.4 1.2 1.2 0.8 225
Legend silty/clayey sand (common dredge area) stiff/hard clays (common dredge area) soft nearshore muds

Settlement Testing HAS-CEP0-HY-REP-0030 Final Working Draft (Revision 0) © 2015 Haskoning Australia Pty Ltd March 2015
APPENDIX B Laboratory Reports for Geotechnical Testing of
Samples used for Testing

QU
ALI
TY O
F M
ATE
RIA
LS R
EP
OR
TC
usto
mer
:R
oyal
Has
koni
ng D
VH
Rep
ort N
umbe
r:30
7697
- 3C
usto
mer
Add
ress
:S
uite
5, L
evel
5, 1
00 W
alke
r Stre
et, N
orth
Syd
ney,
NS
W, 2
060
Rep
ort D
ate:
01/1
2/14
Pro
ject
:P
ort o
f Has
tings
Req
uest
No:
-Lo
catio
n:C
omm
on A
rea
Sie
ve A
naly
sis
Test
Met
hod:
AS
128
9.3.
6.1
Cus
tom
er O
rder
No.
:P
age:
1of
3
Sam
ple
No.
:14
0928
0ID
No.
: -
Lot N
o.:
- D
ate
Sam
pled
:20
/11/
2014
Tim
e S
ampl
ed:
pmD
ate
Test
ed:
22/1
1/20
14
Mat
eria
l Sou
rce:
Insi
tuM
ater
ial T
ype:
Mix
ed C
lay
To B
e U
sed
As
-
Com
mon
Are
a
Laye
r Dep
th (m
m)
- Te
st D
epth
(mm
) -
Sam
plin
g M
etho
d -
Moi
stur
e C
onte
nt (%
) AS
1289
2.1
.125
.4Li
quid
Lim
it (%
) AS
1289
.3.1
.2 -
Plas
tic L
imit
(%) A
S 12
89.3
.2.1
-Pl
astic
ity In
dex
AS 1
289.
3.3.
1 -
Line
ar S
hrin
kage
(%) A
S 12
89.3
.4.1
- C
rack
ing,
Cur
ling,
Cru
mbl
ing
(1,2
,3)
300m
m15
0mm
75.0
0mm
53.0
0mm
37.5
0mm
26.5
0mm
19.0
0mm
13.2
mm
9.50
mm
6.70
mm
4.75
mm
2.36
mm
1.18
mm
0.60
0mm
0.42
5mm
0.30
0mm
0.15
0mm
0.07
5mm
P.I.
x %
Pas
sing
0.4
25m
m -
100
100
100
9997
9187
8376
70L.
S. x
% P
assi
ng 0
.425
mm
-
Rat
io o
f % P
assi
ng (0
.075
/0.4
25)
0.81
USC
Gra
ding
Spe
cific
atio
n:
Rem
arks
:
APPR
OVE
D S
IGNA
TOR
YFo
rm N
o: C
G.3
29.0
02
J La
mon
tIs
sue
Dat
e: 1
9/02
/201
3
NATA
Acc
redi
tatio
n No
. 127
19
-
Soil
Cla
ssifi
catio
n in
acc
orda
nce
with
Uni
fied
Soil
Cla
ssifi
catio
n La
bora
tory
Iden
tific
atio
n Pr
oced
ure
AS17
26 T
able
A1
(199
3) -
Appe
ndix
A, S
ectio
n A
Sam
ple
Loca
tion
:
-Te
stin
g pe
rfor
med
and
repo
rted
at o
ur K
eysb
orou
gh L
abor
ator
y
0102030405060708090100 0.
010.
11
1010
0
Percentage Passing
Siev
e Si
ze (m
m)
SIEV
E A
NA
LYSI
S G
RA
PH
Head
Offi
ce32
Fiv
eway
s Bou
leva
rdKE
YSBO
ROU
GH
VIC
317
3
Ph:+
61 3
879
6 79
00Fa
x:+6
1 3
8796
794
4
Accr
edite
d fo
r com
plia
nce
with
ISO
/IEC
170
25.T
he re
sults
of t
ests
, cal
ibra
tions
an
d/or
mea
sure
men
ts in
clud
ed in
this
docu
men
t are
trac
eabl
eto
Au
stra
lian/
natio
nal s
tand
ards
.

QU
ALI
TY O
F M
ATE
RIA
LS R
EP
OR
TC
usto
mer
:R
oyal
Has
koni
ng D
VH
Rep
ort N
umbe
r:30
7697
- 3C
usto
mer
Add
ress
:S
uite
5, L
evel
5, 1
00 W
alke
r Stre
et, N
orth
Syd
ney,
NS
W, 2
060
Rep
ort D
ate:
01/1
2/14
Pro
ject
:P
ort o
f Has
tings
Req
uest
No:
-Lo
catio
n:C
omm
on A
rea
Sie
ve A
naly
sis
Test
Met
hod:
AS
128
9.3.
6.1
Cus
tom
er O
rder
No.
:P
age:
2of
3
Sam
ple
No.
:14
0928
1ID
No.
: -
Lot N
o.:
- D
ate
Sam
pled
:20
/11/
2014
Tim
e S
ampl
ed:
pmD
ate
Test
ed:
22/1
1/20
14
Mat
eria
l Sou
rce:
Insi
tuM
ater
ial T
ype:
San
dTo
Be
Use
d A
s -
Com
mon
Are
a
Laye
r Dep
th (m
m)
- Te
st D
epth
(mm
) -
Sam
plin
g M
etho
d -
Moi
stur
e C
onte
nt (%
) AS
1289
2.1
.115
.2Li
quid
Lim
it (%
) AS
1289
.3.1
.2 -
Plas
tic L
imit
(%) A
S 12
89.3
.2.1
-Pl
astic
ity In
dex
AS 1
289.
3.3.
1 -
Line
ar S
hrin
kage
(%) A
S 12
89.3
.4.1
- C
rack
ing,
Cur
ling,
Cru
mbl
ing
(1,2
,3)
300m
m15
0mm
75.0
0mm
53.0
0mm
37.5
0mm
26.5
0mm
19.0
0mm
13.2
mm
9.50
mm
6.70
mm
4.75
mm
2.36
mm
1.18
mm
0.60
0mm
0.42
5mm
0.30
0mm
0.15
0mm
0.07
5mm
P.I.
x %
Pas
sing
0.4
25m
m -
100
100
9892
8476
6145
L.S
. x %
Pas
sing
0.4
25m
m -
Rat
io o
f % P
assi
ng (0
.075
/0.4
25)
0.54
USC
Gra
ding
Spe
cific
atio
n:
Rem
arks
:
APPR
OVE
D S
IGNA
TOR
YFo
rm N
o: C
G.3
29.0
02
J La
mon
tIs
sue
Dat
e: 1
9/02
/201
3
NATA
Acc
redi
tatio
n No
. 127
19
- Te
stin
g pe
rfor
med
and
repo
rted
at o
ur K
eysb
orou
gh L
abor
ator
y
Sam
ple
Loca
tion
:
-
Soil
Cla
ssifi
catio
n in
acc
orda
nce
with
Uni
fied
Soil
Cla
ssifi
catio
n La
bora
tory
Iden
tific
atio
n Pr
oced
ure
AS17
26 T
able
A1
(199
3) -
Appe
ndix
A, S
ectio
n A
0102030405060708090100 0.
010.
11
1010
0
Percentage Passing
Siev
e Si
ze (m
m)
SIEV
E A
NA
LYSI
S G
RA
PH
Head
Offi
ce32
Fiv
eway
s Bou
leva
rdKE
YSBO
ROU
GH
VIC
317
3
Ph:+
61 3
879
6 79
00Fa
x:+6
1 3
8796
794
4
Accr
edite
d fo
r com
plia
nce
with
ISO
/IEC
170
25.T
he re
sults
of t
ests
, cal
ibra
tions
an
d/or
mea
sure
men
ts in
clud
ed in
this
docu
men
t are
trac
eabl
eto
Au
stra
lian/
natio
nal s
tand
ards
.

QU
ALI
TY O
F M
ATE
RIA
LS R
EP
OR
TC
usto
mer
:R
oyal
Has
koni
ng D
VH
Rep
ort N
umbe
r:30
7697
- 3C
usto
mer
Add
ress
:S
uite
5, L
evel
5, 1
00 W
alke
r Stre
et, N
orth
Syd
ney,
NS
W, 2
060
Rep
ort D
ate:
01/1
2/14
Pro
ject
:P
ort o
f Has
tings
Req
uest
No:
-Lo
catio
n:C
omm
on A
rea
Sie
ve A
naly
sis
Test
Met
hod:
AS
128
9.3.
6.1
Cus
tom
er O
rder
No.
:P
age:
3of
3
Sam
ple
No.
:14
0928
2ID
No.
: -
Lot N
o.:
- D
ate
Sam
pled
:20
/11/
2014
Tim
e S
ampl
ed:
pmD
ate
Test
ed:
22/1
1/20
14
Mat
eria
l Sou
rce:
Insi
tuM
ater
ial T
ype:
Mud
To B
e U
sed
As
-
Com
mon
Are
a
Laye
r Dep
th (m
m)
- Te
st D
epth
(mm
) -
Sam
plin
g M
etho
d -
Moi
stur
e C
onte
nt (%
) AS
1289
2.1
.146
.0Li
quid
Lim
it (%
) AS
1289
.3.1
.2 -
Plas
tic L
imit
(%) A
S 12
89.3
.2.1
-Pl
astic
ity In
dex
AS 1
289.
3.3.
1 -
Line
ar S
hrin
kage
(%) A
S 12
89.3
.4.1
- C
rack
ing,
Cur
ling,
Cru
mbl
ing
(1,2
,3)
300m
m15
0mm
75.0
0mm
53.0
0mm
37.5
0mm
26.5
0mm
19.0
0mm
13.2
mm
9.50
mm
6.70
mm
4.75
mm
2.36
mm
1.18
mm
0.60
0mm
0.42
5mm
0.30
0mm
0.15
0mm
0.07
5mm
P.I.
x %
Pas
sing
0.4
25m
m -
100
9999
9997
9592
9087
8476
64L.
S. x
% P
assi
ng 0
.425
mm
-
Rat
io o
f % P
assi
ng (0
.075
/0.4
25)
0.73
USC
Gra
ding
Spe
cific
atio
n:
Rem
arks
:
APPR
OVE
D S
IGNA
TOR
YFo
rm N
o: C
G.3
29.0
02
J La
mon
tIs
sue
Dat
e: 1
9/02
/201
3
NATA
Acc
redi
tatio
n No
. 127
19
- Te
stin
g pe
rfor
med
and
repo
rted
at o
ur K
eysb
orou
gh L
abor
ator
y
Sam
ple
Loca
tion
:
-
Soil
Cla
ssifi
catio
n in
acc
orda
nce
with
Uni
fied
Soil
Cla
ssifi
catio
n La
bora
tory
Iden
tific
atio
n Pr
oced
ure
AS17
26 T
able
A1
(199
3) -
Appe
ndix
A, S
ectio
n A
0102030405060708090100 0.
010.
11
1010
0
Percentage Passing
Siev
e Si
ze (m
m)
SIEV
E A
NA
LYSI
S G
RA
PH
Head
Offi
ce32
Fiv
eway
s Bou
leva
rdKE
YSBO
ROU
GH
VIC
317
3
Ph:+
61 3
879
6 79
00Fa
x:+6
1 3
8796
794
4
Accr
edite
d fo
r com
plia
nce
with
ISO
/IEC
170
25.T
he re
sults
of t
ests
, cal
ibra
tions
an
d/or
mea
sure
men
ts in
clud
ed in
this
docu
men
t are
trac
eabl
eto
Au
stra
lian/
natio
nal s
tand
ards
.

QU
ALI
TY O
F M
ATE
RIA
LS R
EPO
RT
Cus
tom
er:
Roy
al H
asko
ning
DV
Hw
ith H
YDR
OM
ETER
Rep
ort N
umbe
r:30
7697
-3C
usto
mer
Add
ress
:S
uite
5, L
evel
5, 1
00 W
alke
r Stre
et, N
orth
Syd
ney,
NS
W 2
060
Rep
ort D
ate:
10/0
2/20
15P
roje
ct:
Por
t of H
astin
gsR
eque
st N
o:-
Loca
tion:
Com
mon
Are
aS
ieve
Ana
lysi
s Te
st M
etho
d:A
S 1
289.
3.6.
1C
usto
mer
Ord
er N
o.:
AS
1289
3.6
.3P
age:
1of
2
Sam
ple
No.
:14
0994
5ID
No.
:1
Lot N
o:-
Dat
e S
ampl
ed:
20/1
1/20
14Ti
me
Sam
pled
:pm
Dat
e Te
sted
:17
/12/
2014
Mat
eria
l Sou
rce:
Insi
tuM
ater
ial T
ype:
San
dTo
Be
Use
d A
s- -
Com
mon
Are
a
- - - -S
ampl
ing
Met
hod
-
Moi
stur
e C
onte
nt (%
) AS
1289
2.1
.10.
0Li
quid
Lim
it (%
) AS
1289
.3.1
.221
Plas
tic L
imit
(%) A
S 12
89.3
.2.1
17Pl
astic
ity In
dex
AS 1
289.
3.3.
14
Line
ar S
hrin
kage
(%) A
S 12
89.3
.4.1
0.0
Cra
ckin
g, C
urlin
g, C
rum
blin
g (1
,2,3
)30
0mm
150m
m75
.00m
m53
.00m
m37
.50m
m26
.50m
m19
.00m
m13
.2m
m9.
50m
m6.
70m
m4.
75m
m2.
36m
m1.
18m
m0.
600m
m0.
425m
m0.
300m
m0.
150m
m0.
075m
m
P.I.
x %
Pas
sing
0.4
25m
m31
110
098
9586
7868
5330
L.S
. x %
Pas
sing
0.4
25m
m0
Rat
io o
f % P
assi
ng (0
.075
/0.4
25)
0.38
US
CG
radi
ng S
peci
ficat
ion:
Rem
arks
:D
ispe
rsio
n M
etho
d: m
echa
nica
l H
ydro
met
er: g
ram
s pe
r litr
eSa
mpl
e te
sted
on
fully
drie
d ou
t mat
eria
l
APPR
OVE
D S
IGN
ATO
RY
Form
No:
CG
.349
.001
J La
mon
tIs
sue
Dat
e:19
/02/
2013
NAT
A Ac
cred
itatio
n N
o. 1
2719
-
Test
ing
perf
orm
ed a
nd re
port
ed a
t our
Key
sbor
ough
Lab
orat
ory
Sam
ple
Loca
tion
SM
-SC
Soi
l Cla
ssifi
catio
n in
acc
orda
nce
with
Uni
fied
Soi
l Cla
ssifi
catio
n La
bora
tory
Iden
tific
atio
n P
roce
dure
AS
1726
Tab
le A
1 (1
993)
- A
ppen
dix
A, S
ectio
n A
30
2120
1714
1212
109
90.
0
10.0
20.0
30.0
40.0
50.0
60.0
70.0
80.0
90.0
100.
0 0.00
10.
010
0.10
01.
000
10.0
0010
0.00
0
Percentage Passing
Siev
e Si
ze (m
m)
SIEV
E A
NA
LYSI
S G
RA
PH
Head
Offi
ce32
Fiv
eway
s Bou
leva
rdKE
YSBO
ROU
GH
VIC
317
3
Ph:+
61 3
879
6 79
00Fa
x:+6
1 3
8796
794
4
Accr
edite
d fo
r com
plia
nce
with
ISO
/IEC
170
25.T
he re
sults
of t
ests
, cal
ibra
tions
an
d/or
mea
sure
men
ts in
clud
ed in
this
docu
men
t are
trac
eabl
eto
Au
stra
lian/
natio
nal s
tand
ards
.
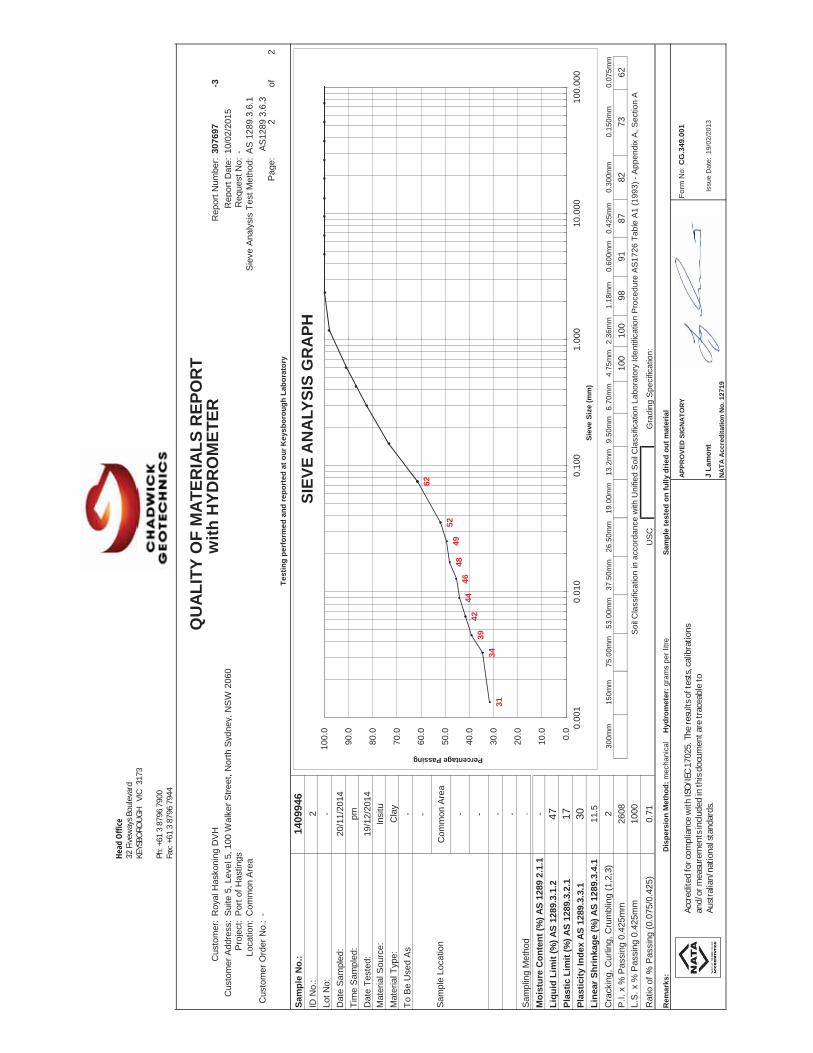
QU
ALI
TY O
F M
ATE
RIA
LS R
EPO
RT
Cus
tom
er:
Roy
al H
asko
ning
DV
Hw
ith H
YDR
OM
ETER
Rep
ort N
umbe
r:30
7697
-3C
usto
mer
Add
ress
:S
uite
5, L
evel
5, 1
00 W
alke
r Stre
et, N
orth
Syd
ney,
NS
W 2
060
Rep
ort D
ate:
10/0
2/20
15P
roje
ct:
Por
t of H
astin
gsR
eque
st N
o:-
Loca
tion:
Com
mon
Are
aS
ieve
Ana
lysi
s Te
st M
etho
d:A
S 1
289.
3.6.
1C
usto
mer
Ord
er N
o.:
AS
1289
3.6
.3P
age:
2of
2
Sam
ple
No.
:14
0994
6ID
No.
:2
Lot N
o:-
Dat
e S
ampl
ed:
20/1
1/20
14Ti
me
Sam
pled
:pm
Dat
e Te
sted
:19
/12/
2014
Mat
eria
l Sou
rce:
Insi
tuM
ater
ial T
ype:
Cla
yTo
Be
Use
d A
s- -
Com
mon
Are
a
- - - -S
ampl
ing
Met
hod
-
Moi
stur
e C
onte
nt (%
) AS
1289
2.1
.1-
Liqu
id L
imit
(%) A
S 12
89.3
.1.2
47Pl
astic
Lim
it (%
) AS
1289
.3.2
.117
Plas
ticity
Inde
x AS
128
9.3.
3.1
30Li
near
Shr
inka
ge (%
) AS
1289
.3.4
.111
.5C
rack
ing,
Cur
ling,
Cru
mbl
ing
(1,2
,3)
230
0mm
150m
m75
.00m
m53
.00m
m37
.50m
m26
.50m
m19
.00m
m13
.2m
m9.
50m
m6.
70m
m4.
75m
m2.
36m
m1.
18m
m0.
600m
m0.
425m
m0.
300m
m0.
150m
m0.
075m
m
P.I.
x %
Pas
sing
0.4
25m
m26
0810
010
098
9187
8273
62L.
S. x
% P
assi
ng 0
.425
mm
1000
Rat
io o
f % P
assi
ng (0
.075
/0.4
25)
0.71
US
CG
radi
ng S
peci
ficat
ion:
Rem
arks
:D
ispe
rsio
n M
etho
d: m
echa
nica
l H
ydro
met
er: g
ram
s pe
r litr
eSa
mpl
e te
sted
on
fully
drie
d ou
t mat
eria
l
APPR
OVE
D S
IGN
ATO
RY
Form
No:
CG
.349
.001
J La
mon
tIs
sue
Dat
e:19
/02/
2013
NAT
A Ac
cred
itatio
n N
o. 1
2719
-
Test
ing
perf
orm
ed a
nd re
port
ed a
t our
Key
sbor
ough
Lab
orat
ory
Sam
ple
Loca
tion
CI
Soi
l Cla
ssifi
catio
n in
acc
orda
nce
with
Uni
fied
Soi
l Cla
ssifi
catio
n La
bora
tory
Iden
tific
atio
n P
roce
dure
AS
1726
Tab
le A
1 (1
993)
- A
ppen
dix
A, S
ectio
n A
62
5249
4846
4442
3934
31
0.0
10.0
20.0
30.0
40.0
50.0
60.0
70.0
80.0
90.0
100.
0 0.00
10.
010
0.10
01.
000
10.0
0010
0.00
0
Percentage Passing
Siev
e Si
ze (m
m)
SIEV
E A
NA
LYSI
S G
RA
PH
Head
Offi
ce32
Fiv
eway
s Bou
leva
rdKE
YSBO
ROU
GH
VIC
317
3
Ph:+
61 3
879
6 79
00Fa
x:+6
1 3
8796
794
4
Accr
edite
d fo
r com
plia
nce
with
ISO
/IEC
170
25.T
he re
sults
of t
ests
, cal
ibra
tions
an
d/or
mea
sure
men
ts in
clud
ed in
this
docu
men
t are
trac
eabl
eto
Au
stra
lian/
natio
nal s
tand
ards
.

QU
ALIT
Y O
F M
ATER
IALS
REP
OR
TC
usto
mer
:R
oyal
Has
koni
ng D
VH
with
HYD
RO
MET
ERR
epor
t Num
ber:
3076
974
Cus
tom
er A
ddre
ss:
Sui
te 5
, Lev
el 5
, 100
Wal
ker S
treet
, Nor
th S
ydne
y, N
SW
206
0R
epor
t Dat
e:12
/01/
2015
Pro
ject
:P
ort o
f Has
tings
Req
uest
No:
0Lo
catio
n:C
omm
on A
rea
Sie
ve A
naly
sis
Test
Met
hod:
AS
128
9.3.
6.1
Cus
tom
er O
rder
No.
: A
S12
89 3
.6.3
Pag
e:1
of1
Sam
ple
No.
:14
1010
7ID
No.
:1
Lot N
o: -
Dat
e S
ampl
ed:
22/1
2/20
14Ti
me
Sam
pled
:A
MD
ate
Test
ed:
8/01
/201
5M
ater
ial S
ourc
e:C
lient
Sou
rced
Mat
eria
l Typ
e:M
ud -
Silt
y C
lay
To B
e U
sed
As
-
Com
mon
Are
a
0
0.00
0
0
0.00
00
Sam
plin
g M
etho
d-
Moi
stur
e C
onte
nt (%
) AS
1289
2.1
.1-
Liqu
id L
imit
(%) A
S 12
89.3
.1.2
33Pl
astic
Lim
it (%
) AS
1289
.3.2
.118
Plas
ticity
Inde
x AS
128
9.3.
3.1
15Li
near
Shr
inka
ge (%
) AS
1289
.3.4
.15.
5C
rack
ing,
Cur
ling,
Cru
mbl
ing
(1,2
,3)
130
0mm
150m
m75
.00m
m53
.00m
m37
.50m
m26
.50m
m19
.00m
m13
.2m
m9.
50m
m6.
70m
m4.
75m
m2.
36m
m1.
18m
m0.
600m
m0.
425m
m0.
300m
m0.
150m
m0.
075m
m
P.I.
x %
Pas
sing
0.4
25m
m12
2510
099
9998
9694
8985
8277
6647
L.S
. x %
Pas
sing
0.4
25m
m44
9
Rat
io o
f % P
assi
ng (0
.075
/0.4
25)
0.57
USC
Gra
ding
Spe
cific
atio
n:
Rem
arks
:D
ispe
rsio
n M
etho
d: m
echa
nica
l H
ydro
met
er: g
ram
s pe
r litr
eSa
mpl
e te
sted
on
fully
drie
d ou
t mat
eria
l
APPR
OVE
D S
IGNA
TOR
YFo
rm N
o: C
G.3
49.0
01
A C
atto
nIs
sue
Dat
e:19
/02/
2013
NATA
Acc
redi
tatio
n No
. 127
19
Ple
ase
see
the
orig
inal
PS
D fo
r la
rger
par
ticle
dis
tribu
tion
SC
Soil
Cla
ssifi
catio
n in
acc
orda
nce
with
Uni
fied
Soil
Cla
ssifi
catio
n La
bora
tory
Iden
tific
atio
n Pr
oced
ure
AS17
26 T
able
A1
(199
3) -
Appe
ndix
A, S
ectio
n A
Sam
ple
Loca
tion
-
Test
ing
perf
orm
ed a
nd re
port
ed a
t our
Key
sbor
ough
Lab
orat
ory
47
34
33
31
29
27
26
25
24
21
0.0
10.0
20.0
30.0
40.0
50.0
60.0
70.0
80.0
90.0
100.
0 0.00
10.
010
0.10
01.
000
10.0
0010
0.00
0
Percentage Passing
Siev
e Si
ze (m
m)
SIEV
E A
NA
LYSI
S G
RA
PH
Head
Offi
ce
32 F
ivew
ays B
oule
vard
KE
YSBO
ROU
GH
VIC
317
3 Ph
: +61
3 8
796
7900
Fa
x: +
61 3
879
6 79
44
Accr
edite
d fo
r com
plia
nce
with
ISO
/IEC
170
25. T
he re
sults
of t
ests
, cal
ibra
tions
an
d/or
mea
sure
men
ts in
clud
ed in
this
docu
men
t are
trac
eabl
e to
Au
stra
lian/
natio
nal s
tand
ards
.

QU
ALIT
Y O
F M
ATER
IALS
REP
OR
TC
usto
mer
:R
oyal
Has
koni
ng D
VH
with
HYD
RO
MET
ERR
epor
t Num
ber:
3076
97- 5
Cus
tom
er A
ddre
ss:
Sui
te 5
, Lev
el 5
, 100
Wal
ker S
treet
, Nor
th S
ydne
y, N
SW
206
0R
epor
t Dat
e:10
/02/
2015
Pro
ject
:P
ort o
f Has
tings
Req
uest
No:
-Lo
catio
n:C
omm
on A
rea
Sie
ve A
naly
sis
Test
Met
hod:
AS
128
9.3.
6.1
Cus
tom
er O
rder
No.
: A
S12
89 3
.6.3
Pag
e:1
of1
Sam
ple
No.
:15
0027
7ID
No.
:-
Lot N
o:-
Dat
e S
ampl
ed:
-Ti
me
Sam
pled
:-
Dat
e Te
sted
:10
/02/
2015
Mat
eria
l Sou
rce:
Com
mon
Are
aM
ater
ial T
ype:
Cla
y / S
and
To B
e U
sed
As
-
Com
mon
Are
a
0
0.00
0
0
0.00
00
Sam
plin
g M
etho
d-
Moi
stur
e C
onte
nt (%
) AS
1289
2.1
.1-
Liqu
id L
imit
(%) A
S 12
89.3
.1.2
33Pl
astic
Lim
it (%
) AS
1289
.3.2
.114
Plas
ticity
Inde
x AS
128
9.3.
3.1
19Li
near
Shr
inka
ge (%
) AS
1289
.3.4
.17.
0C
rack
ing,
Cur
ling,
Cru
mbl
ing
(1,2
,3)
130
0mm
150m
m75
.00m
m53
.00m
m37
.50m
m26
.50m
m19
.00m
m13
.2m
m9.
50m
m6.
70m
m4.
75m
m2.
36m
m1.
18m
m0.
600m
m0.
425m
m0.
300m
m0.
150m
m0.
075m
m
P.I.
x %
Pas
sing
0.4
25m
m17
5410
010
010
097
9283
6538
L.S
. x %
Pas
sing
0.4
25m
m64
6
Rat
io o
f % P
assi
ng (0
.075
/0.4
25)
0.41
USC
Gra
ding
Spe
cific
atio
n:
Rem
arks
:D
ispe
rsio
n M
etho
d: m
echa
nica
l H
ydro
met
er: g
ram
s pe
r litr
eSa
mpl
e te
sted
on
fully
drie
d ou
t mat
eria
l
APPR
OVE
D S
IGNA
TOR
YFo
rm N
o: C
G.3
49.0
01
A C
atto
nIs
sue
Dat
e:19
/02/
2013
NATA
Acc
redi
tatio
n No
. 127
19
Ple
ase
see
the
orig
inal
PS
D fo
r la
rger
par
ticle
dis
tribu
tion
SC
Soil
Cla
ssifi
catio
n in
acc
orda
nce
with
Uni
fied
Soil
Cla
ssifi
catio
n La
bora
tory
Iden
tific
atio
n Pr
oced
ure
AS17
26 T
able
A1
(199
3) -
Appe
ndix
A, S
ectio
n A
Sam
ple
Loca
tion
-
Test
ing
perf
orm
ed a
nd re
port
ed a
t our
Key
sbor
ough
Lab
orat
ory
38
31
28
25
24
22
20
18
17
14
0.0
10.0
20.0
30.0
40.0
50.0
60.0
70.0
80.0
90.0
100.
0 0.00
10.
010
0.10
01.
000
10.0
0010
0.00
0
Percentage Passing
Siev
e Si
ze (m
m)
SIEV
E A
NA
LYSI
S G
RA
PH
Head
Offi
ce
32 F
ivew
ays B
oule
vard
KE
YSBO
ROU
GH
VIC
317
3 Ph
: +61
3 8
796
7900
Fax:
+61
3 8
796
7944
Accr
edite
d fo
r com
plia
nce
with
ISO
/IEC
170
25. T
he re
sults
of t
ests
, cal
ibra
tions
an
d/or
mea
sure
men
ts in
clud
ed in
this
docu
men
t are
trac
eabl
e to
Au
stra
lian/
natio
nal s
tand
ards
.

Settlement Testing HAS-CEP0-HY-REP-0030 Final Working Draft (Revision 0) © 2015 Haskoning Australia Pty Ltd March 2015
APPENDIX C Settlement Test Sheets – Stiff-Hard Clays


Settlement Testing HAS-CEP0-HY-REP-0030 Final Working Draft (Revision 0) © 2015 Haskoning Australia Pty Ltd March 2015
APPENDIX D Settlement Test Sheets – Silty/Clayey Sands

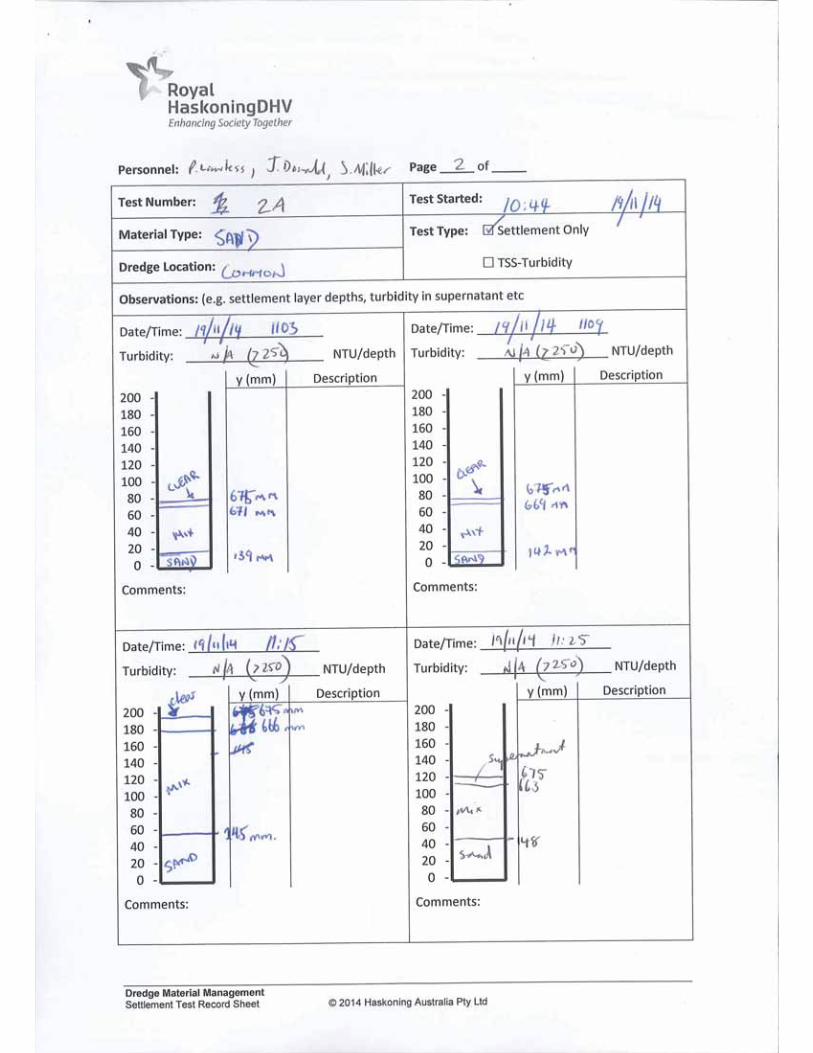


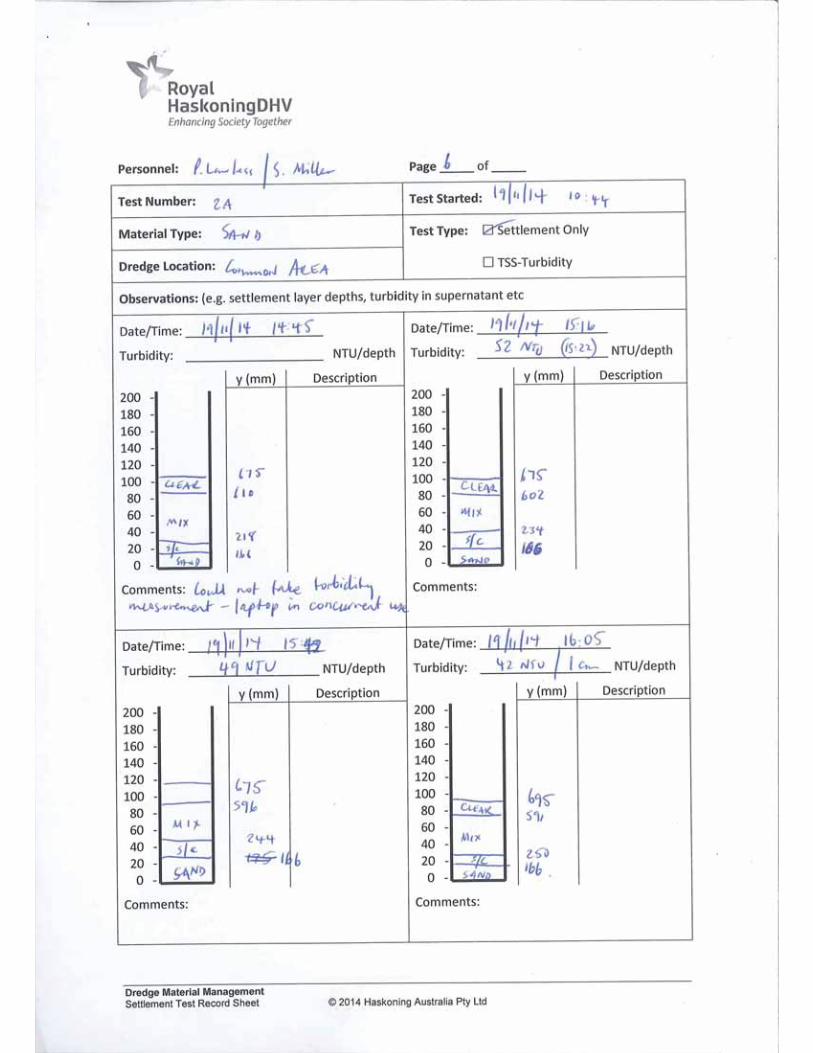
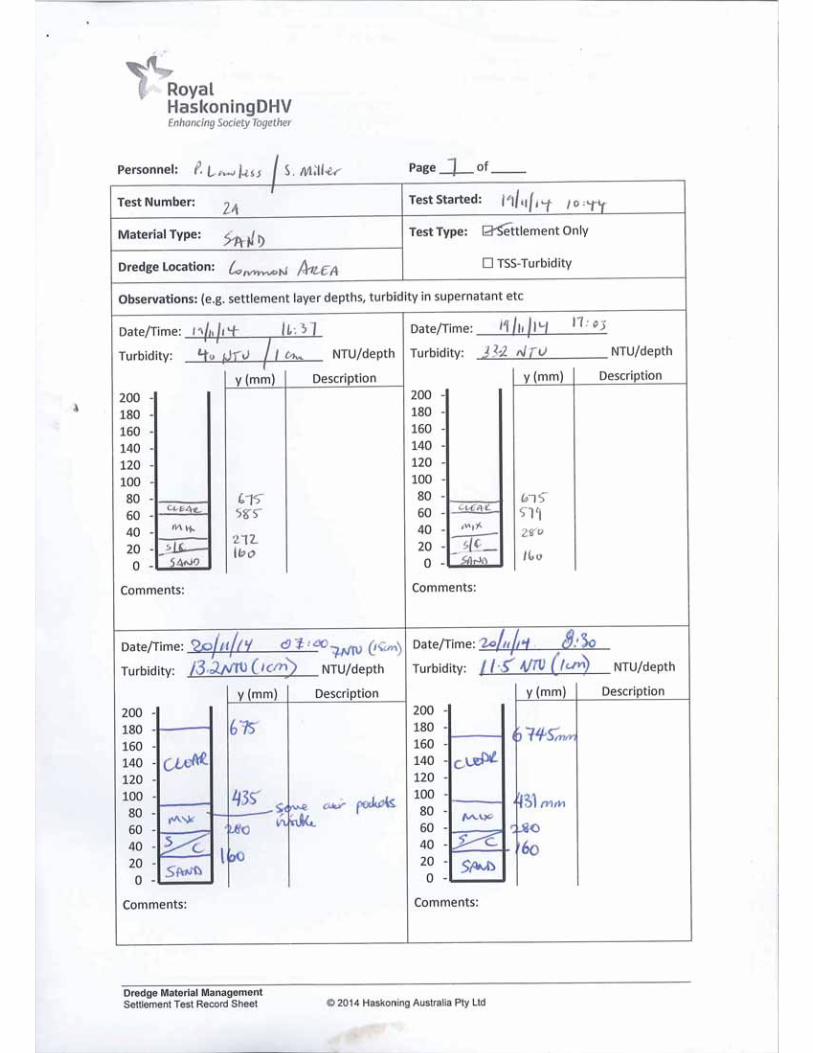


Settlement Testing HAS-CEP0-HY-REP-0030 Final Working Draft (Revision 0) © 2015 Haskoning Australia Pty Ltd March 2015
APPENDIX E Settlement Test Sheets – Soft Silty Clays
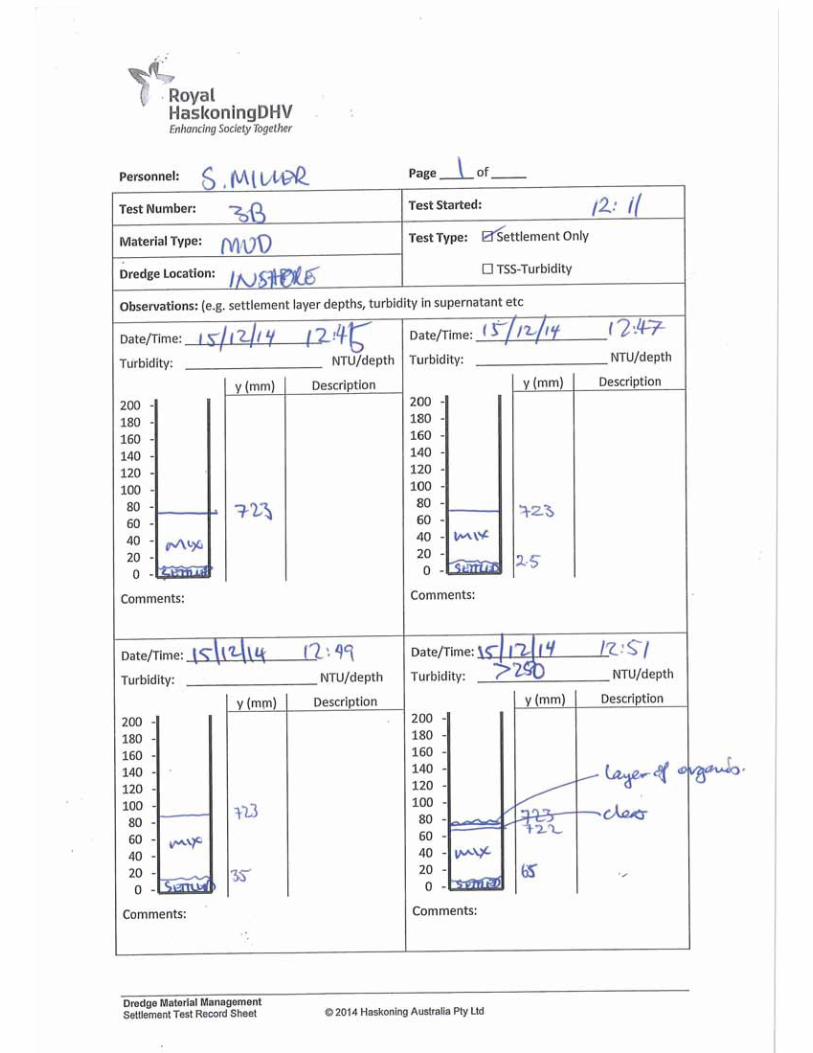


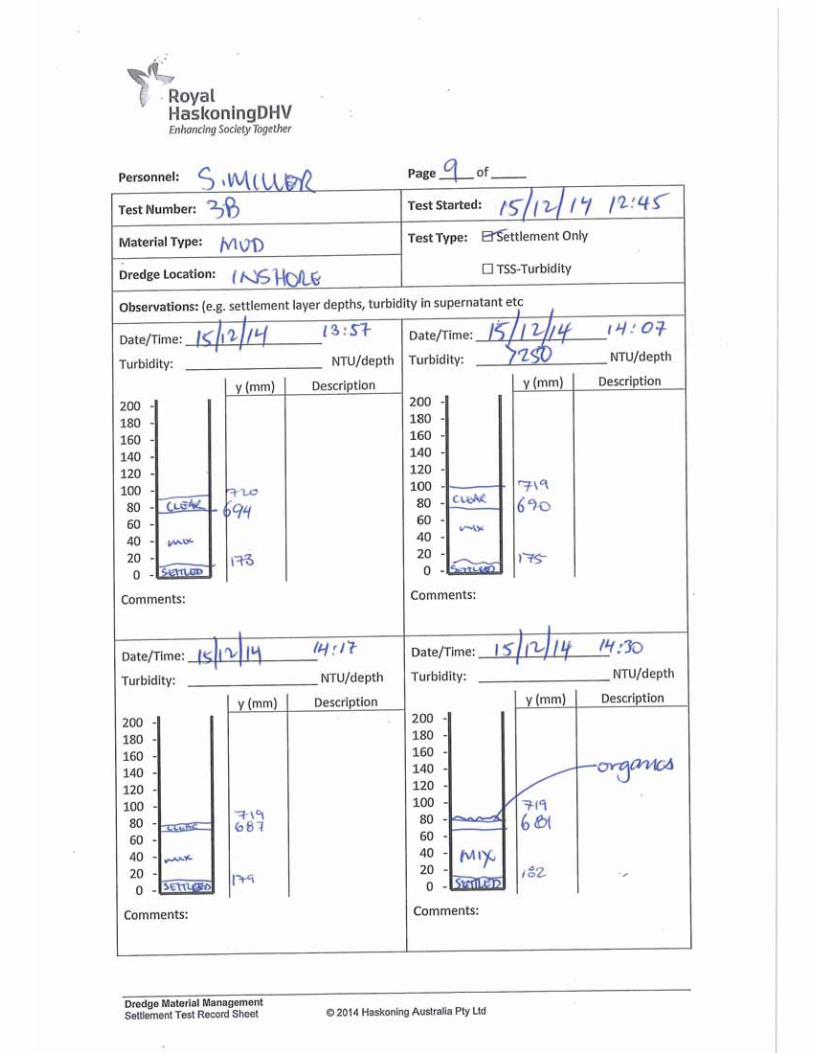


Settlement Testing HAS-CEP0-HY-REP-0030 Final Working Draft (Revision 0) © 2015 Haskoning Australia Pty Ltd March 2015
APPENDIX F Settlement Test Sheets – ‘Representative’
Sand/Clay Material

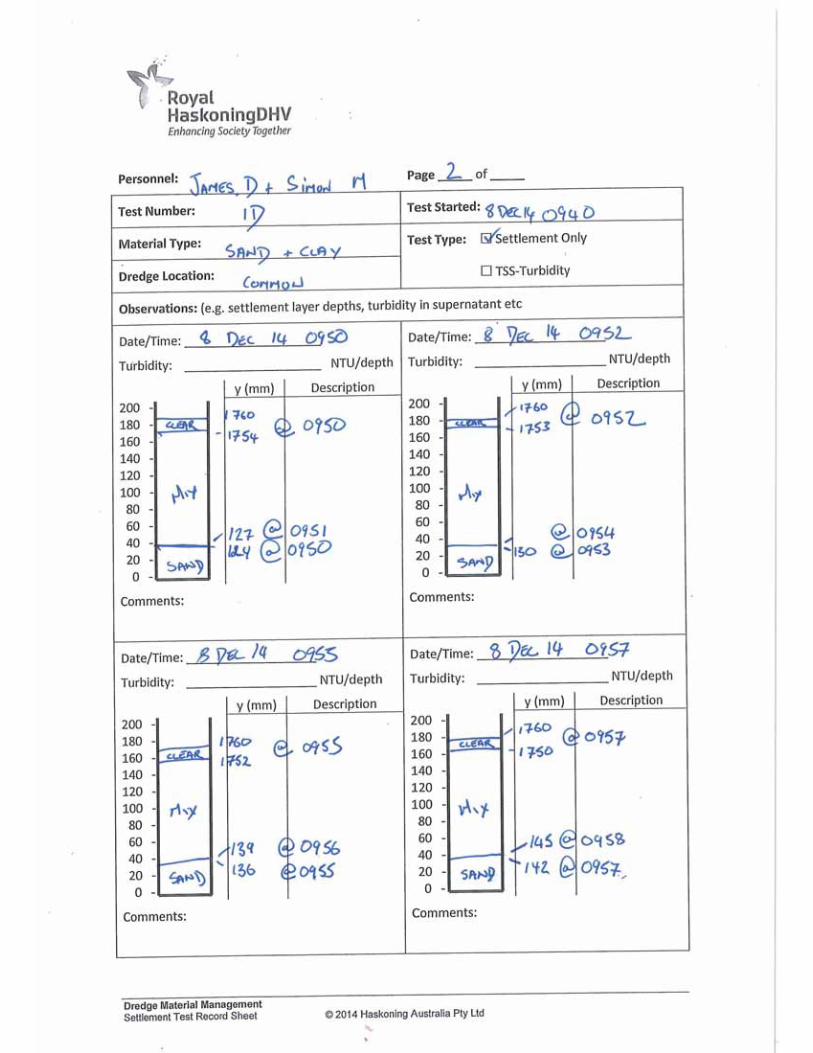


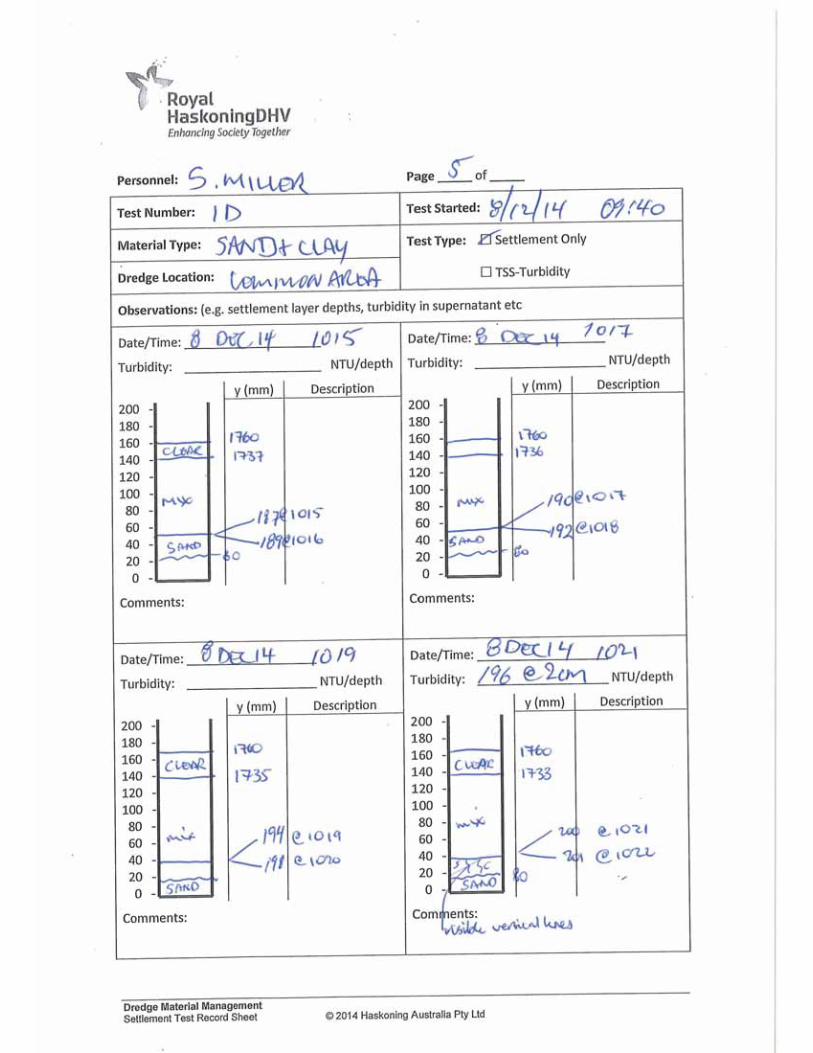


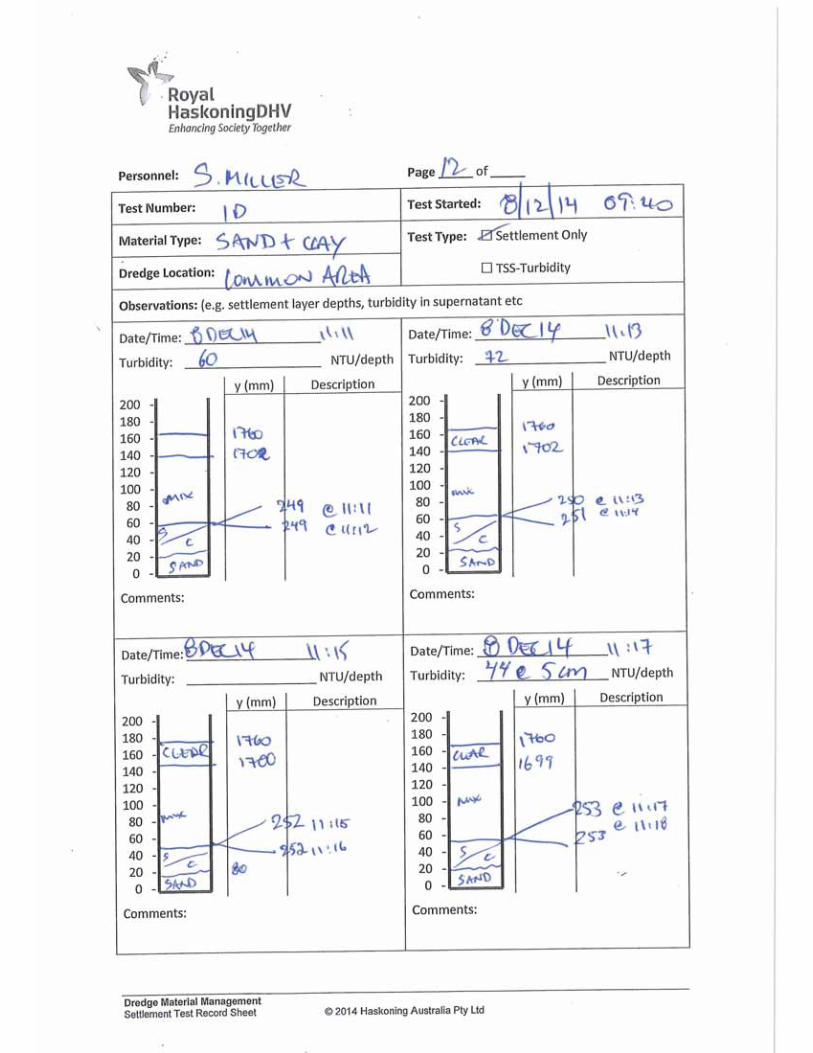


Settlement Testing HAS-CEP0-HY-REP-0030 Final Working Draft (Revision 0) © 2015 Haskoning Australia Pty Ltd March 2015
APPENDIX G Laboratory Certificates of Analysis for Water
Samples

Certificate of Analysis
Chadwick Geotechnics Pty Ltd32 Fiveways BoulevardKeysboroughVIC 3173
Attention: Simon Miller
Report 440757-WProject name PORT OF HASTINGSProject ID 307697Received Date Dec 02, 2014
Client Sample ID CB1 CB2 CB3 CB4Sample Matrix Water Water Water Water
Eurofins | mgt Sample No. M14-De01390 M14-De01391 M14-De01392 M14-De01393
Date Sampled Nov 26, 2014 Nov 26, 2014 Nov 26, 2014 Nov 26, 2014
Test/Reference LOR Unit
Suspended Solids 1 mg/L 240000 240000 240000 200000Turbidity 1 NTU 210000 200000 200000 170000
Client Sample ID CB5 CB6 CB7 CB8Sample Matrix Water Water Water Water
Eurofins | mgt Sample No. M14-De01394 M14-De01395 M14-De01396 M14-De01397
Date Sampled Nov 26, 2014 Nov 26, 2014 Nov 26, 2014 Nov 26, 2014
Test/Reference LOR Unit
Suspended Solids 1 mg/L 230000 180000 200000 190000Turbidity 1 NTU 180000 180000 170000 180000
Client Sample ID CB9 CB10 CB11 CB12Sample Matrix Water Water Water Water
Eurofins | mgt Sample No. M14-De01398 M14-De01399 M14-De01400 M14-De01401
Date Sampled Nov 27, 2014 Nov 27, 2014 Nov 27, 2014 Nov 27, 2014
Test/Reference LOR Unit
Suspended Solids 1 mg/L 12000 6600 80000 44000Turbidity 1 NTU 8200 4800 53000 74000
Client Sample ID CB13 CB14 CB15 CB16Sample Matrix Water Water Water Water
Eurofins | mgt Sample No. M14-De01402 M14-De01403 M14-De01404 M14-De01405
Date Sampled Nov 27, 2014 Nov 28, 2014 Nov 28, 2014 Dec 01, 2014
Test/Reference LOR Unit
Suspended Solids 1 mg/L 140000 5000 13000 21Turbidity 1 NTU 120000 4000 11000 20
Date Reported: Dec 04, 2014
Eurofins | mgt 2-5 Kingston Town Close, Oakleigh, Victoria, Australia, 3166
ABN : 50 005 085 521 Telephone: +61 3 8564 5000 Facsimile: +61 3 8564 5090
Page 1 of 12
Report Number: 440757-W
NATA AccreditedAccreditation Number 1261Site Number 1254
Accredited for compliance with ISO/IEC 17025.The results of the tests, calibrations and/ormeasurements included in this document are traceableto Australian/national standards.

Client Sample ID CB17 CB18 SB1 SB2Sample Matrix Water Water Water Water
Eurofins | mgt Sample No. M14-De01406 M14-De01407 M14-De01408 M14-De01409
Date Sampled Dec 01, 2014 Dec 01, 2014 Nov 26, 2014 Nov 26, 2014
Test/Reference LOR Unit
Suspended Solids 1 mg/L 79 20 120000 110000Turbidity 1 NTU 98 26 62000 60000
Client Sample ID SB3 SB4 SB5 SB6Sample Matrix Water Water Water Water
Eurofins | mgt Sample No. M14-De01410 M14-De01411 M14-De01412 M14-De01413
Date Sampled Nov 26, 2014 Nov 26, 2014 Nov 26, 2014 Nov 26, 2014
Test/Reference LOR Unit
Suspended Solids 1 mg/L 91000 86000 65000 70000Turbidity 1 NTU 59000 59000 50000 49000
Client Sample ID SB7 SB8 SB9 SB10Sample Matrix Water Water Water Water
Eurofins | mgt Sample No. M14-De01414 M14-De01415 M14-De01416 M14-De01417
Date Sampled Nov 26, 2014 Nov 26, 2014 Nov 26, 2014 Nov 26, 2014
Test/Reference LOR Unit
Suspended Solids 1 mg/L 30000 25000 17000 16000Turbidity 1 NTU 23000 21000 64000 13000
Client Sample ID SB11 SB12 SB13 SB14Sample Matrix Water Water Water Water
Eurofins | mgt Sample No. M14-De01418 M14-De01419 M14-De01420 M14-De01421
Date Sampled Nov 26, 2014 Nov 26, 2014 Nov 26, 2014 Nov 26, 2014
Test/Reference LOR Unit
Suspended Solids 1 mg/L 2200 80 100 77Turbidity 1 NTU 1600 81 67 61
Client Sample ID SB15 SB16 SB17 SB18Sample Matrix Water Water Water Water
Eurofins | mgt Sample No. M14-De01422 M14-De01423 M14-De01424 M14-De01425
Date Sampled Nov 26, 2014 Nov 27, 2014 Nov 27, 2014 Nov 27, 2014
Test/Reference LOR Unit
Suspended Solids 1 mg/L 57 14 59 7.3Turbidity 1 NTU 68 13 55 6.9
Date Reported: Dec 04, 2014
Eurofins | mgt 2-5 Kingston Town Close, Oakleigh, Victoria, Australia, 3166
ABN : 50 005 085 521 Telephone: +61 3 8564 5000 Facsimile: +61 3 8564 5090
Page 2 of 12
Report Number: 440757-W

Client Sample ID SB19 SB20 SB21 SB22Sample Matrix Water Water Water Water
Eurofins | mgt Sample No. M14-De01426 M14-De01427 M14-De01428 M14-De01429
Date Sampled Nov 27, 2014 Nov 27, 2014 Nov 28, 2014 Nov 28, 2014
Test/Reference LOR Unit
Suspended Solids 1 mg/L 21 20 10 10Turbidity 1 NTU 21 23 7.8 6.3
Client Sample ID SB23 SB24 SB25 SB26Sample Matrix Water Water Water Water
Eurofins | mgt Sample No. M14-De01430 M14-De01431 M14-De01432 M14-De01433
Date Sampled Nov 28, 2014 Nov 28, 2014 Dec 01, 2014 Dec 01, 2014
Test/Reference LOR Unit
Suspended Solids 1 mg/L 5.2 5.2 5.3 4.2Turbidity 1 NTU 4.6 5.6 < 1 1.5
Client Sample ID SB27Sample Matrix Water
Eurofins | mgt Sample No. M14-De01434
Date Sampled Dec 01, 2014
Test/Reference LOR Unit
Suspended Solids 1 mg/L 8.0Turbidity 1 NTU 2.5
Date Reported: Dec 04, 2014
Eurofins | mgt 2-5 Kingston Town Close, Oakleigh, Victoria, Australia, 3166
ABN : 50 005 085 521 Telephone: +61 3 8564 5000 Facsimile: +61 3 8564 5090
Page 3 of 12
Report Number: 440757-W

Sample HistoryWhere samples are submitted/analysed over several days, the last date of extraction and analysis is reported.A recent review of our LIMS has resulted in the correction or clarification of some method identifications. Due to this, some of the method reference information on reports has changed. However,no substantive change has been made to our laboratory methods, and as such there is no change in the validity of current or previous results (regarding both quality and NATA accreditation).
If the date and time of sampling are not provided, the Laboratory will not be responsible for compromised results should testing be performed outside the recommended holding time.
Description Testing Site Extracted Holding TimeSuspended Solids Melbourne Dec 02, 2014 7 Day
- Method: APHA 2540D Total Suspended Solids
Turbidity Melbourne Dec 03, 2014 2 Day- Method: APHA 2130 Turbidity
Date Reported: Dec 04, 2014
Eurofins | mgt 2-5 Kingston Town Close, Oakleigh, Victoria, Australia, 3166
ABN : 50 005 085 521 Telephone: +61 3 8564 5000 Facsimile: +61 3 8564 5090
Page 4 of 12
Report Number: 440757-W

.C
ompa
ny N
ame:
Cha
dwic
k G
eote
chni
cs P
ty L
tdO
rder
No.
:R
ecei
ved:
Dec
2, 2
014
9:11
AM
Add
ress
:32
Fiv
eway
s B
oule
vard
Rep
ort #
:44
0757
Due
:D
ec 4
, 201
4K
eysb
orou
ghPh
one:
03 8
796
7900
Prio
rity:
2 D
ayV
IC 3
173
Fax:
03 8
796
7944
Con
tact
Nam
e:S
imon
Mill
er
Proj
ect N
ame:
PO
RT
OF
HA
STI
NG
SPr
ojec
t ID
:30
7697
Euro
fins
| mgt
Clie
nt M
anag
er: M
ary
Mak
ario
s
Sam
ple
Det
ail
HOLD
Suspended Solids
Turbidity
Labo
rato
ry w
here
ana
lysi
s is
con
duct
edM
elbo
urne
Lab
orat
ory
- NA
TA S
ite #
125
4 &
142
71X
XX
Sydn
ey L
abor
ator
y - N
ATA
Site
# 1
8217
Bris
bane
Lab
orat
ory
- NA
TA S
ite #
207
94Ex
tern
al L
abor
ator
ySa
mpl
e ID
Sam
ple
Dat
eSa
mpl
ing
Tim
eM
atrix
LAB
ID
CB
1N
ov 2
6, 2
014
1:0
5PM
Wat
erM
14-D
e013
90X
XC
B2
Nov
26,
201
4 1
:20P
MW
ater
M14
-De0
1391
XX
CB
3N
ov 2
6, 2
014
1:5
0PM
Wat
erM
14-D
e013
92X
XC
B4
Nov
26,
201
4 2
:20P
MW
ater
M14
-De0
1393
XX
CB
5N
ov 2
6, 2
014
2:5
0PM
Wat
erM
14-D
e013
94X
XC
B6
Nov
26,
201
4 3
:20P
MW
ater
M14
-De0
1395
XX
CB
7N
ov 2
6, 2
014
4:2
0PM
Wat
erM
14-D
e013
96X
XC
B8
Nov
26,
201
4 5
:00P
MW
ater
M14
-De0
1397
XX
CB
9N
ov 2
7, 2
014
7:0
0AM
Wat
erM
14-D
e013
98X
X
AB
N –
50
005
085
521
e.m
ail :
Env
iroS
ales
@eu
rofin
s.co
m.a
u
w
eb :
ww
w.e
urof
ins.
com
.au
Mel
bour
neM
elbo
urne
Mel
bour
neM
elbo
urne
3-5
Kin
gsto
n To
wn
Clo
seO
akle
igh
VIC
316
6P
hone
: +6
1 3
8564
500
0N
ATA
# 1
261
Site
# 1
254
& 1
4271
Syd
ney
Syd
ney
Syd
ney
Syd
ney
Uni
t F3,
Bui
ldin
g F
16 M
ars
Roa
dLa
ne C
ove
Wes
t NS
W 2
066
Pho
ne :
+61
2 99
00 8
400
NA
TA #
126
1 S
ite #
182
17
Bris
bane
Bris
bane
Bris
bane
Bris
bane
1/21
Sm
allw
ood
Pla
ceM
urar
rie Q
LD 4
172
Pho
ne :
+61
7 39
02 4
600
NA
TA #
126
1 S
ite #
207
94
Dat
e R
epor
ted:
Dec
04,
201
4
Eur
ofin
s | m
gt 2
-5 K
ings
ton
Tow
n C
lose
, Oak
leig
h, V
icto
ria, A
ustra
lia, 3
166
ABN
: 50
005
085
521
Tel
epho
ne: +
61 3
856
4 50
00 F
acsi
mile
: +61
3 8
564
5090
Pag
e 5
of 1
2
Rep
ort N
umbe
r: 44
0757
-W

Com
pany
Nam
e:C
hadw
ick
Geo
tech
nics
Pty
Ltd
Ord
er N
o.:
Rec
eive
d:D
ec 2
, 201
4 9:
11 A
MA
ddre
ss:
32 F
ivew
ays
Bou
leva
rdR
epor
t #:
4407
57D
ue:
Dec
4, 2
014
Key
sbor
ough
Phon
e:03
879
6 79
00Pr
iorit
y:2
Day
VIC
317
3Fa
x:03
879
6 79
44C
onta
ct N
ame:
Sim
on M
iller
Proj
ect N
ame:
PO
RT
OF
HA
STI
NG
SPr
ojec
t ID
:30
7697
Euro
fins
| mgt
Clie
nt M
anag
er: M
ary
Mak
ario
s
Sam
ple
Det
ail
HOLD
Suspended Solids
Turbidity
Labo
rato
ry w
here
ana
lysi
s is
con
duct
edM
elbo
urne
Lab
orat
ory
- NA
TA S
ite #
125
4 &
142
71X
XX
Sydn
ey L
abor
ator
y - N
ATA
Site
# 1
8217
Bris
bane
Lab
orat
ory
- NA
TA S
ite #
207
94Ex
tern
al L
abor
ator
yC
B10
Nov
27,
201
410
:00A
MW
ater
M14
-De0
1399
XX
CB
11N
ov 2
7, 2
014
1:0
0PM
Wat
erM
14-D
e014
00X
XC
B12
Nov
27,
201
4 2
:55P
MW
ater
M14
-De0
1401
XX
CB
13N
ov 2
7, 2
014
4:4
0PM
Wat
erM
14-D
e014
02X
XC
B14
Nov
28,
201
4 7
:30A
MW
ater
M14
-De0
1403
XX
CB
15N
ov 2
8, 2
014
1:4
0PM
Wat
erM
14-D
e014
04X
XC
B16
Dec
01,
201
4 7
:15A
MW
ater
M14
-De0
1405
XX
CB
17D
ec 0
1, 2
014
11:3
0AM
Wat
erM
14-D
e014
06X
XC
B18
Dec
01,
201
4 3
:00P
MW
ater
M14
-De0
1407
XX
SB
1N
ov 2
6, 2
014
9:2
4AM
Wat
erM
14-D
e014
08X
X
AB
N –
50
005
085
521
e.m
ail :
Env
iroS
ales
@eu
rofin
s.co
m.a
u
w
eb :
ww
w.e
urof
ins.
com
.au
Mel
bour
neM
elbo
urne
Mel
bour
neM
elbo
urne
3-5
Kin
gsto
n To
wn
Clo
seO
akle
igh
VIC
316
6P
hone
: +6
1 3
8564
500
0N
ATA
# 1
261
Site
# 1
254
& 1
4271
Syd
ney
Syd
ney
Syd
ney
Syd
ney
Uni
t F3,
Bui
ldin
g F
16 M
ars
Roa
dLa
ne C
ove
Wes
t NS
W 2
066
Pho
ne :
+61
2 99
00 8
400
NA
TA #
126
1 S
ite #
182
17
Bris
bane
Bris
bane
Bris
bane
Bris
bane
1/21
Sm
allw
ood
Pla
ceM
urar
rie Q
LD 4
172
Pho
ne :
+61
7 39
02 4
600
NA
TA #
126
1 S
ite #
207
94
Dat
e R
epor
ted:
Dec
04,
201
4
Eur
ofin
s | m
gt 2
-5 K
ings
ton
Tow
n C
lose
, Oak
leig
h, V
icto
ria, A
ustra
lia, 3
166
ABN
: 50
005
085
521
Tel
epho
ne: +
61 3
856
4 50
00 F
acsi
mile
: +61
3 8
564
5090
Pag
e 6
of 1
2
Rep
ort N
umbe
r: 44
0757
-W

Com
pany
Nam
e:C
hadw
ick
Geo
tech
nics
Pty
Ltd
Ord
er N
o.:
Rec
eive
d:D
ec 2
, 201
4 9:
11 A
MA
ddre
ss:
32 F
ivew
ays
Bou
leva
rdR
epor
t #:
4407
57D
ue:
Dec
4, 2
014
Key
sbor
ough
Phon
e:03
879
6 79
00Pr
iorit
y:2
Day
VIC
317
3Fa
x:03
879
6 79
44C
onta
ct N
ame:
Sim
on M
iller
Proj
ect N
ame:
PO
RT
OF
HA
STI
NG
SPr
ojec
t ID
:30
7697
Euro
fins
| mgt
Clie
nt M
anag
er: M
ary
Mak
ario
s
Sam
ple
Det
ail
HOLD
Suspended Solids
Turbidity
Labo
rato
ry w
here
ana
lysi
s is
con
duct
edM
elbo
urne
Lab
orat
ory
- NA
TA S
ite #
125
4 &
142
71X
XX
Sydn
ey L
abor
ator
y - N
ATA
Site
# 1
8217
Bris
bane
Lab
orat
ory
- NA
TA S
ite #
207
94Ex
tern
al L
abor
ator
yS
B2
Nov
26,
201
4 9
:24A
MW
ater
M14
-De0
1409
XX
SB
3N
ov 2
6, 2
014
9:4
0AM
Wat
erM
14-D
e014
10X
XS
B4
Nov
26,
201
4 9
:50A
MW
ater
M14
-De0
1411
XX
SB
5N
ov 2
6, 2
014
10:0
0AM
Wat
erM
14-D
e014
12X
XS
B6
Nov
26,
201
410
:10A
MW
ater
M14
-De0
1413
XX
SB
7N
ov 2
6, 2
014
10:4
0AM
Wat
erM
14-D
e014
14X
XS
B8
Nov
26,
201
411
:10A
MW
ater
M14
-De0
1415
XX
SB
9N
ov 2
6, 2
014
12:1
0PM
Wat
erM
14-D
e014
16X
XS
B10
Nov
26,
201
4 1
:10P
MW
ater
M14
-De0
1417
XX
SB
11N
ov 2
6, 2
014
2:1
0PM
Wat
erM
14-D
e014
18X
X
AB
N –
50
005
085
521
e.m
ail :
Env
iroS
ales
@eu
rofin
s.co
m.a
u
w
eb :
ww
w.e
urof
ins.
com
.au
Mel
bour
neM
elbo
urne
Mel
bour
neM
elbo
urne
3-5
Kin
gsto
n To
wn
Clo
seO
akle
igh
VIC
316
6P
hone
: +6
1 3
8564
500
0N
ATA
# 1
261
Site
# 1
254
& 1
4271
Syd
ney
Syd
ney
Syd
ney
Syd
ney
Uni
t F3,
Bui
ldin
g F
16 M
ars
Roa
dLa
ne C
ove
Wes
t NS
W 2
066
Pho
ne :
+61
2 99
00 8
400
NA
TA #
126
1 S
ite #
182
17
Bris
bane
Bris
bane
Bris
bane
Bris
bane
1/21
Sm
allw
ood
Pla
ceM
urar
rie Q
LD 4
172
Pho
ne :
+61
7 39
02 4
600
NA
TA #
126
1 S
ite #
207
94
Dat
e R
epor
ted:
Dec
04,
201
4
Eur
ofin
s | m
gt 2
-5 K
ings
ton
Tow
n C
lose
, Oak
leig
h, V
icto
ria, A
ustra
lia, 3
166
ABN
: 50
005
085
521
Tel
epho
ne: +
61 3
856
4 50
00 F
acsi
mile
: +61
3 8
564
5090
Pag
e 7
of 1
2
Rep
ort N
umbe
r: 44
0757
-W

Com
pany
Nam
e:C
hadw
ick
Geo
tech
nics
Pty
Ltd
Ord
er N
o.:
Rec
eive
d:D
ec 2
, 201
4 9:
11 A
MA
ddre
ss:
32 F
ivew
ays
Bou
leva
rdR
epor
t #:
4407
57D
ue:
Dec
4, 2
014
Key
sbor
ough
Phon
e:03
879
6 79
00Pr
iorit
y:2
Day
VIC
317
3Fa
x:03
879
6 79
44C
onta
ct N
ame:
Sim
on M
iller
Proj
ect N
ame:
PO
RT
OF
HA
STI
NG
SPr
ojec
t ID
:30
7697
Euro
fins
| mgt
Clie
nt M
anag
er: M
ary
Mak
ario
s
Sam
ple
Det
ail
HOLD
Suspended Solids
Turbidity
Labo
rato
ry w
here
ana
lysi
s is
con
duct
edM
elbo
urne
Lab
orat
ory
- NA
TA S
ite #
125
4 &
142
71X
XX
Sydn
ey L
abor
ator
y - N
ATA
Site
# 1
8217
Bris
bane
Lab
orat
ory
- NA
TA S
ite #
207
94Ex
tern
al L
abor
ator
yS
B12
Nov
26,
201
4 3
:10P
MW
ater
M14
-De0
1419
XX
SB
13N
ov 2
6, 2
014
3:4
0PM
Wat
erM
14-D
e014
20X
XS
B14
Nov
26,
201
4 4
:10P
MW
ater
M14
-De0
1421
XX
SB
15N
ov 2
6, 2
014
5:0
0PM
Wat
erM
14-D
e014
22X
XS
B16
Nov
27,
201
4 7
:00A
MW
ater
M14
-De0
1423
XX
SB
17N
ov 2
7, 2
014
10:0
0AM
Wat
erM
14-D
e014
24X
XS
B18
Nov
27,
201
4 1
:00P
MW
ater
M14
-De0
1425
XX
SB
19N
ov 2
7, 2
014
3:0
0PM
Wat
erM
14-D
e014
26X
XS
B20
Nov
27,
201
4 4
:40P
MW
ater
M14
-De0
1427
XX
SB
21N
ov 2
8, 2
014
7:3
5AM
Wat
erM
14-D
e014
28X
X
AB
N –
50
005
085
521
e.m
ail :
Env
iroS
ales
@eu
rofin
s.co
m.a
u
w
eb :
ww
w.e
urof
ins.
com
.au
Mel
bour
neM
elbo
urne
Mel
bour
neM
elbo
urne
3-5
Kin
gsto
n To
wn
Clo
seO
akle
igh
VIC
316
6P
hone
: +6
1 3
8564
500
0N
ATA
# 1
261
Site
# 1
254
& 1
4271
Syd
ney
Syd
ney
Syd
ney
Syd
ney
Uni
t F3,
Bui
ldin
g F
16 M
ars
Roa
dLa
ne C
ove
Wes
t NS
W 2
066
Pho
ne :
+61
2 99
00 8
400
NA
TA #
126
1 S
ite #
182
17
Bris
bane
Bris
bane
Bris
bane
Bris
bane
1/21
Sm
allw
ood
Pla
ceM
urar
rie Q
LD 4
172
Pho
ne :
+61
7 39
02 4
600
NA
TA #
126
1 S
ite #
207
94
Dat
e R
epor
ted:
Dec
04,
201
4
Eur
ofin
s | m
gt 2
-5 K
ings
ton
Tow
n C
lose
, Oak
leig
h, V
icto
ria, A
ustra
lia, 3
166
ABN
: 50
005
085
521
Tel
epho
ne: +
61 3
856
4 50
00 F
acsi
mile
: +61
3 8
564
5090
Pag
e 8
of 1
2
Rep
ort N
umbe
r: 44
0757
-W

Com
pany
Nam
e:C
hadw
ick
Geo
tech
nics
Pty
Ltd
Ord
er N
o.:
Rec
eive
d:D
ec 2
, 201
4 9:
11 A
MA
ddre
ss:
32 F
ivew
ays
Bou
leva
rdR
epor
t #:
4407
57D
ue:
Dec
4, 2
014
Key
sbor
ough
Phon
e:03
879
6 79
00Pr
iorit
y:2
Day
VIC
317
3Fa
x:03
879
6 79
44C
onta
ct N
ame:
Sim
on M
iller
Proj
ect N
ame:
PO
RT
OF
HA
STI
NG
SPr
ojec
t ID
:30
7697
Euro
fins
| mgt
Clie
nt M
anag
er: M
ary
Mak
ario
s
Sam
ple
Det
ail
HOLD
Suspended Solids
Turbidity
Labo
rato
ry w
here
ana
lysi
s is
con
duct
edM
elbo
urne
Lab
orat
ory
- NA
TA S
ite #
125
4 &
142
71X
XX
Sydn
ey L
abor
ator
y - N
ATA
Site
# 1
8217
Bris
bane
Lab
orat
ory
- NA
TA S
ite #
207
94Ex
tern
al L
abor
ator
yS
B22
Nov
28,
201
4 9
:55A
MW
ater
M14
-De0
1429
XX
SB
23N
ov 2
8, 2
014
12:5
0PM
Wat
erM
14-D
e014
30X
XS
B24
Nov
28,
201
4 3
:35P
MW
ater
M14
-De0
1431
XX
SB
25D
ec 0
1, 2
014
7:1
0AM
Wat
erM
14-D
e014
32X
XS
B26
Dec
01,
201
411
:30A
MW
ater
M14
-De0
1433
XX
SB
27D
ec 0
1, 2
014
3:0
0PM
Wat
erM
14-D
e014
34X
XC
A1
Nov
26,
201
4W
ater
M14
-De0
1439
XS
A1
Nov
26,
201
4W
ater
M14
-De0
1440
X
AB
N –
50
005
085
521
e.m
ail :
Env
iroS
ales
@eu
rofin
s.co
m.a
u
w
eb :
ww
w.e
urof
ins.
com
.au
Mel
bour
neM
elbo
urne
Mel
bour
neM
elbo
urne
3-5
Kin
gsto
n To
wn
Clo
seO
akle
igh
VIC
316
6P
hone
: +6
1 3
8564
500
0N
ATA
# 1
261
Site
# 1
254
& 1
4271
Syd
ney
Syd
ney
Syd
ney
Syd
ney
Uni
t F3,
Bui
ldin
g F
16 M
ars
Roa
dLa
ne C
ove
Wes
t NS
W 2
066
Pho
ne :
+61
2 99
00 8
400
NA
TA #
126
1 S
ite #
182
17
Bris
bane
Bris
bane
Bris
bane
Bris
bane
1/21
Sm
allw
ood
Pla
ceM
urar
rie Q
LD 4
172
Pho
ne :
+61
7 39
02 4
600
NA
TA #
126
1 S
ite #
207
94
Dat
e R
epor
ted:
Dec
04,
201
4
Eur
ofin
s | m
gt 2
-5 K
ings
ton
Tow
n C
lose
, Oak
leig
h, V
icto
ria, A
ustra
lia, 3
166
ABN
: 50
005
085
521
Tel
epho
ne: +
61 3
856
4 50
00 F
acsi
mile
: +61
3 8
564
5090
Pag
e 9
of 1
2
Rep
ort N
umbe
r: 44
0757
-W
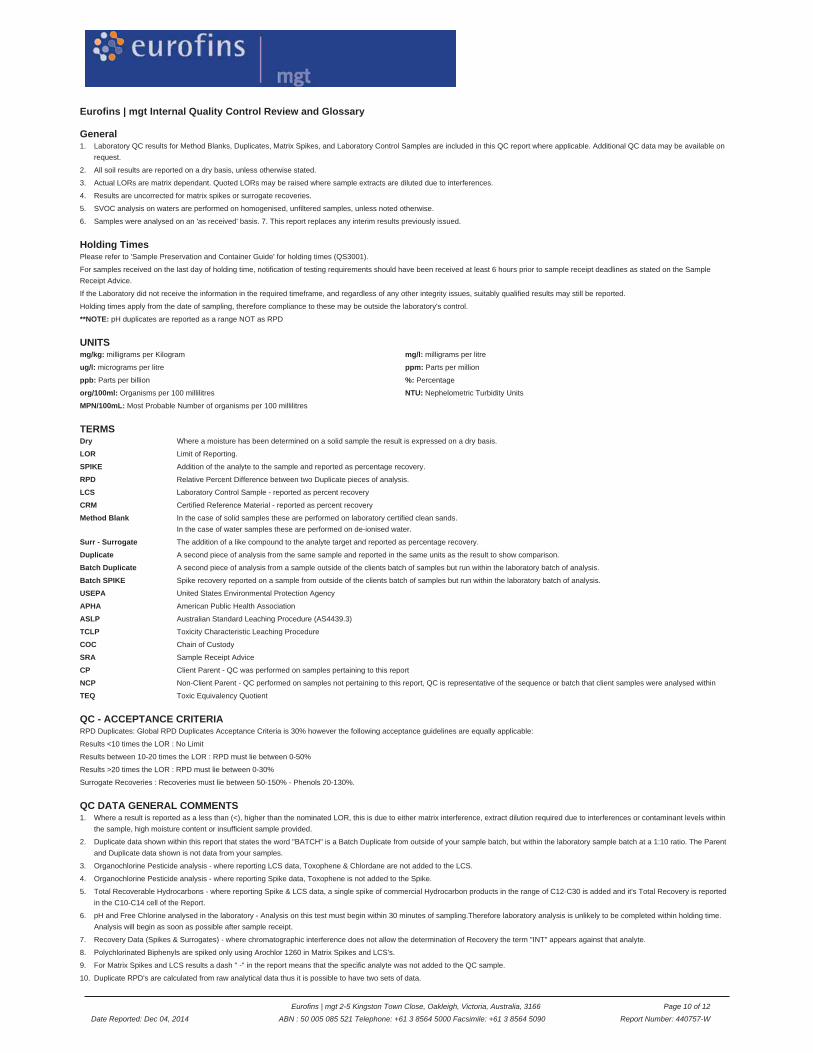
Eurofins | mgt Internal Quality Control Review and Glossary
General
Holding Times
UNITS
TERMS
QC - ACCEPTANCE CRITERIA
QC DATA GENERAL COMMENTS
1. Laboratory QC results for Method Blanks, Duplicates, Matrix Spikes, and Laboratory Control Samples are included in this QC report where applicable. Additional QC data may be available onrequest.
2. All soil results are reported on a dry basis, unless otherwise stated.
3. Actual LORs are matrix dependant. Quoted LORs may be raised where sample extracts are diluted due to interferences.
4. Results are uncorrected for matrix spikes or surrogate recoveries.
5. SVOC analysis on waters are performed on homogenised, unfiltered samples, unless noted otherwise.
6. Samples were analysed on an 'as received' basis. 7. This report replaces any interim results previously issued.
Please refer to 'Sample Preservation and Container Guide' for holding times (QS3001).
For samples received on the last day of holding time, notification of testing requirements should have been received at least 6 hours prior to sample receipt deadlines as stated on the SampleReceipt Advice.
If the Laboratory did not receive the information in the required timeframe, and regardless of any other integrity issues, suitably qualified results may still be reported.
Holding times apply from the date of sampling, therefore compliance to these may be outside the laboratory's control.
**NOTE: pH duplicates are reported as a range NOT as RPD
mg/kg: milligrams per Kilogram mg/l: milligrams per litre
ug/l: micrograms per litre ppm: Parts per million
ppb: Parts per billion %: Percentage
org/100ml: Organisms per 100 millilitres NTU: Nephelometric Turbidity Units
MPN/100mL: Most Probable Number of organisms per 100 millilitres
Dry Where a moisture has been determined on a solid sample the result is expressed on a dry basis.
LOR Limit of Reporting.
SPIKE Addition of the analyte to the sample and reported as percentage recovery.
RPD Relative Percent Difference between two Duplicate pieces of analysis.
LCS Laboratory Control Sample - reported as percent recovery
CRM Certified Reference Material - reported as percent recovery
Method Blank In the case of solid samples these are performed on laboratory certified clean sands.In the case of water samples these are performed on de-ionised water.
Surr - Surrogate The addition of a like compound to the analyte target and reported as percentage recovery.
Duplicate A second piece of analysis from the same sample and reported in the same units as the result to show comparison.
Batch Duplicate A second piece of analysis from a sample outside of the clients batch of samples but run within the laboratory batch of analysis.
Batch SPIKE Spike recovery reported on a sample from outside of the clients batch of samples but run within the laboratory batch of analysis.
USEPA United States Environmental Protection Agency
APHA American Public Health Association
ASLP Australian Standard Leaching Procedure (AS4439.3)
TCLP Toxicity Characteristic Leaching Procedure
COC Chain of Custody
SRA Sample Receipt Advice
CP Client Parent - QC was performed on samples pertaining to this report
NCP Non-Client Parent - QC performed on samples not pertaining to this report, QC is representative of the sequence or batch that client samples were analysed within
TEQ Toxic Equivalency Quotient
RPD Duplicates: Global RPD Duplicates Acceptance Criteria is 30% however the following acceptance guidelines are equally applicable:
Results <10 times the LOR : No Limit
Results between 10-20 times the LOR : RPD must lie between 0-50%
Results >20 times the LOR : RPD must lie between 0-30%
Surrogate Recoveries : Recoveries must lie between 50-150% - Phenols 20-130%.
1. Where a result is reported as a less than (<), higher than the nominated LOR, this is due to either matrix interference, extract dilution required due to interferences or contaminant levels withinthe sample, high moisture content or insufficient sample provided.
2. Duplicate data shown within this report that states the word "BATCH" is a Batch Duplicate from outside of your sample batch, but within the laboratory sample batch at a 1:10 ratio. The Parentand Duplicate data shown is not data from your samples.
3. Organochlorine Pesticide analysis - where reporting LCS data, Toxophene & Chlordane are not added to the LCS.
4. Organochlorine Pesticide analysis - where reporting Spike data, Toxophene is not added to the Spike.
5. Total Recoverable Hydrocarbons - where reporting Spike & LCS data, a single spike of commercial Hydrocarbon products in the range of C12-C30 is added and it's Total Recovery is reportedin the C10-C14 cell of the Report.
6. pH and Free Chlorine analysed in the laboratory - Analysis on this test must begin within 30 minutes of sampling.Therefore laboratory analysis is unlikely to be completed within holding time.Analysis will begin as soon as possible after sample receipt.
7. Recovery Data (Spikes & Surrogates) - where chromatographic interference does not allow the determination of Recovery the term "INT" appears against that analyte.
8. Polychlorinated Biphenyls are spiked only using Arochlor 1260 in Matrix Spikes and LCS's.
9. For Matrix Spikes and LCS results a dash " -" in the report means that the specific analyte was not added to the QC sample.
10. Duplicate RPD's are calculated from raw analytical data thus it is possible to have two sets of data.
Date Reported: Dec 04, 2014
Eurofins | mgt 2-5 Kingston Town Close, Oakleigh, Victoria, Australia, 3166
ABN : 50 005 085 521 Telephone: +61 3 8564 5000 Facsimile: +61 3 8564 5090
Page 10 of 12
Report Number: 440757-W

Quality Control Results
Test Units Result 1 AcceptanceLimits
PassLimits
QualifyingCode
Method BlankSuspended Solids mg/L < 1 1 Pass
LCS - % RecoverySuspended Solids % 91 70-130 Pass
Test Lab Sample ID QASource Units Result 1 Acceptance
LimitsPass
LimitsQualifying
CodeDuplicate
Result 1 Result 2 RPDTurbidity M14-De01390 CP NTU 210000 200000 <1 30% Pass
DuplicateResult 1 Result 2 RPD
Suspended Solids M14-De01398 CP mg/L 12000 12000 5.0 30% PassDuplicate
Result 1 Result 2 RPDTurbidity M14-De01409 CP NTU 60000 61000 2.0 30% Pass
DuplicateResult 1 Result 2 RPD
Suspended Solids M14-De01419 CP mg/L 80 84 4.0 30% PassDuplicate
Result 1 Result 2 RPDTurbidity M14-De01428 CP NTU 7.8 7.6 3.0 30% Pass
DuplicateResult 1 Result 2 RPD
Suspended Solids M14-De01429 CP mg/L 10 13 21 30% Pass
Date Reported: Dec 04, 2014
Eurofins | mgt 2-5 Kingston Town Close, Oakleigh, Victoria, Australia, 3166
ABN : 50 005 085 521 Telephone: +61 3 8564 5000 Facsimile: +61 3 8564 5090
Page 11 of 12
Report Number: 440757-W

Comments
Sample IntegrityCustody Seals Intact (if used) N/A
Attempt to Chill was evident Yes
Sample correctly preserved Yes
Appropriate sample containers have been used Yes
Sample containers for volatile analysis received with minimal headspace Yes
Samples received within HoldingTime Yes
Some samples have been subcontracted No
Authorised By
Mary Makarios Analytical Services Manager
Huong Le Senior Analyst-Inorganic (VIC)
Glenn JacksonNational Laboratory Manager
- Indicates Not Requested
* Indicates NATA accreditation does not cover the performance of this service
Uncertainty data is available on requestEurofins | mgt shall not be liable for loss, cost, damages or expenses incurred by the client, or any other person or company, resulting from the use of any information or interpretation given in this report. In no case shall Eurofins | mgt be liable for consequential damages including, but notlimited to, lost profits, damages for failure to meet deadlines and lost production arising from this report. This document shall not be reproduced except in full and relates only to the items tested. Unless indicated otherwise, the tests were performed on the samples as received.
Date Reported: Dec 04, 2014
Eurofins | mgt 2-5 Kingston Town Close, Oakleigh, Victoria, Australia, 3166
ABN : 50 005 085 521 Telephone: +61 3 8564 5000 Facsimile: +61 3 8564 5090
Page 12 of 12
Report Number: 440757-W

Certificate of Analysis
Chadwick Geotechnics Pty Ltd32 Fiveways BoulevardKeysboroughVIC 3173
Attention: Simon Miller
Report 440761-WProject name PORT OF HASTINGSProject ID 307697Received Date Dec 02, 2014
Client Sample ID MB1 MB2 MB3 MB4Sample Matrix Water Water Water Water
Eurofins | mgt Sample No. M14-De01442 M14-De01443 M14-De01444 M14-De01445
Date Sampled Nov 26, 2014 Nov 26, 2014 Nov 26, 2014 Nov 26, 2014
Test/Reference LOR Unit
Suspended Solids 1 mg/L 150000 140000 140000 100000Turbidity 1 NTU 66000 53000 56000 50000
Client Sample ID MB5 MB6 MB7 MB8Sample Matrix Water Water Water Water
Eurofins | mgt Sample No. M14-De01446 M14-De01447 M14-De01448 M14-De01449
Date Sampled Nov 26, 2014 Nov 26, 2014 Nov 26, 2014 Nov 26, 2014
Test/Reference LOR Unit
Suspended Solids 1 mg/L 17000 10000 6000 10000Turbidity 1 NTU 7700 2300 2000 4300
Client Sample ID MB9 MB11 MB12 MB13Sample Matrix Water Water Water Water
Eurofins | mgt Sample No. M14-De01450 M14-De01451 M14-De01452 M14-De01453
Date Sampled Nov 26, 2014 Nov 26, 2014 Nov 27, 2014 Nov 27, 2014
Test/Reference LOR Unit
Suspended Solids 1 mg/L 48000 50000 19 550Turbidity 1 NTU 13000 20000 13 200
Client Sample ID MB14 MB15 MB16 MB17Sample Matrix Water Water Water Water
Eurofins | mgt Sample No. M14-De01454 M14-De01455 M14-De01456 M14-De01457
Date Sampled Nov 27, 2014 Nov 27, 2014 Nov 27, 2014 Nov 28, 2014
Test/Reference LOR Unit
Suspended Solids 1 mg/L 39 380 290 43Turbidity 1 NTU 21 120 120 15
Date Reported: Dec 04, 2014
Eurofins | mgt 2-5 Kingston Town Close, Oakleigh, Victoria, Australia, 3166
ABN : 50 005 085 521 Telephone: +61 3 8564 5000 Facsimile: +61 3 8564 5090
Page 1 of 9
Report Number: 440761-W
NATA AccreditedAccreditation Number 1261Site Number 1254
Accredited for compliance with ISO/IEC 17025.The results of the tests, calibrations and/ormeasurements included in this document are traceableto Australian/national standards.

Client Sample ID MB19 MB20 MB21 MB22Sample Matrix Water Water Water Water
Eurofins | mgt Sample No. M14-De01458 M14-De01459 M14-De01460 M14-De01461
Date Sampled Nov 28, 2014 Nov 28, 2014 Nov 28, 2014 Dec 01, 2014
Test/Reference LOR Unit
Suspended Solids 1 mg/L 22 41 74 17Turbidity 1 NTU 17 14 29 2.3
Client Sample ID MB23 MB24Sample Matrix Water Water
Eurofins | mgt Sample No. M14-De01462 M14-De01463
Date Sampled Dec 01, 2014 Dec 01, 2014
Test/Reference LOR Unit
Suspended Solids 1 mg/L 17 21Turbidity 1 NTU 5.5 4.1
Date Reported: Dec 04, 2014
Eurofins | mgt 2-5 Kingston Town Close, Oakleigh, Victoria, Australia, 3166
ABN : 50 005 085 521 Telephone: +61 3 8564 5000 Facsimile: +61 3 8564 5090
Page 2 of 9
Report Number: 440761-W

Sample HistoryWhere samples are submitted/analysed over several days, the last date of extraction and analysis is reported.A recent review of our LIMS has resulted in the correction or clarification of some method identifications. Due to this, some of the method reference information on reports has changed. However,no substantive change has been made to our laboratory methods, and as such there is no change in the validity of current or previous results (regarding both quality and NATA accreditation).
If the date and time of sampling are not provided, the Laboratory will not be responsible for compromised results should testing be performed outside the recommended holding time.
Description Testing Site Extracted Holding TimeSuspended Solids Melbourne Dec 02, 2014 7 Day
- Method: APHA 2540D Total Suspended Solids
Turbidity Melbourne Dec 03, 2014 2 Day- Method: APHA 2130 Turbidity
Date Reported: Dec 04, 2014
Eurofins | mgt 2-5 Kingston Town Close, Oakleigh, Victoria, Australia, 3166
ABN : 50 005 085 521 Telephone: +61 3 8564 5000 Facsimile: +61 3 8564 5090
Page 3 of 9
Report Number: 440761-W

.C
ompa
ny N
ame:
Cha
dwic
k G
eote
chni
cs P
ty L
tdO
rder
No.
:R
ecei
ved:
Dec
2, 2
014
9:11
AM
Add
ress
:32
Fiv
eway
s B
oule
vard
Rep
ort #
:44
0761
Due
:D
ec 4
, 201
4K
eysb
orou
ghPh
one:
03 8
796
7900
Prio
rity:
2 D
ayV
IC 3
173
Fax:
03 8
796
7944
Con
tact
Nam
e:S
imon
Mill
er
Proj
ect N
ame:
PO
RT
OF
HA
STI
NG
SPr
ojec
t ID
:30
7697
Euro
fins
| mgt
Clie
nt M
anag
er: M
ary
Mak
ario
s
Sam
ple
Det
ail
HOLD
Suspended Solids
Turbidity
Labo
rato
ry w
here
ana
lysi
s is
con
duct
edM
elbo
urne
Lab
orat
ory
- NA
TA S
ite #
125
4 &
142
71X
XX
Sydn
ey L
abor
ator
y - N
ATA
Site
# 1
8217
Bris
bane
Lab
orat
ory
- NA
TA S
ite #
207
94Ex
tern
al L
abor
ator
ySa
mpl
e ID
Sam
ple
Dat
eSa
mpl
ing
Tim
eM
atrix
LAB
ID
MB
1N
ov 2
6, 2
014
10:2
0AM
Wat
erM
14-D
e014
42X
XM
B2
Nov
26,
201
410
:35A
MW
ater
M14
-De0
1443
XX
MB
3N
ov 2
6, 2
014
10:5
0AM
Wat
erM
14-D
e014
44X
XM
B4
Nov
26,
201
411
:20A
MW
ater
M14
-De0
1445
XX
MB
5N
ov 2
6, 2
014
11:2
0AM
Wat
erM
14-D
e014
46X
XM
B6
Nov
26,
201
4 1
:15P
MW
ater
M14
-De0
1447
XX
MB
7N
ov 2
6, 2
014
2:1
0PM
Wat
erM
14-D
e014
48X
XM
B8
Nov
26,
201
4 3
:15P
MW
ater
M14
-De0
1449
XX
MB
9N
ov 2
6, 2
014
4:1
5PM
Wat
erM
14-D
e014
50X
X
AB
N –
50
005
085
521
e.m
ail :
Env
iroS
ales
@eu
rofin
s.co
m.a
u
w
eb :
ww
w.e
urof
ins.
com
.au
Mel
bour
neM
elbo
urne
Mel
bour
neM
elbo
urne
3-5
Kin
gsto
n To
wn
Clo
seO
akle
igh
VIC
316
6P
hone
: +6
1 3
8564
500
0N
ATA
# 1
261
Site
# 1
254
& 1
4271
Syd
ney
Syd
ney
Syd
ney
Syd
ney
Uni
t F3,
Bui
ldin
g F
16 M
ars
Roa
dLa
ne C
ove
Wes
t NS
W 2
066
Pho
ne :
+61
2 99
00 8
400
NA
TA #
126
1 S
ite #
182
17
Bris
bane
Bris
bane
Bris
bane
Bris
bane
1/21
Sm
allw
ood
Pla
ceM
urar
rie Q
LD 4
172
Pho
ne :
+61
7 39
02 4
600
NA
TA #
126
1 S
ite #
207
94
Dat
e R
epor
ted:
Dec
04,
201
4
Eur
ofin
s | m
gt 2
-5 K
ings
ton
Tow
n C
lose
, Oak
leig
h, V
icto
ria, A
ustra
lia, 3
166
ABN
: 50
005
085
521
Tel
epho
ne: +
61 3
856
4 50
00 F
acsi
mile
: +61
3 8
564
5090
Pag
e 4
of 9
Rep
ort N
umbe
r: 44
0761
-W
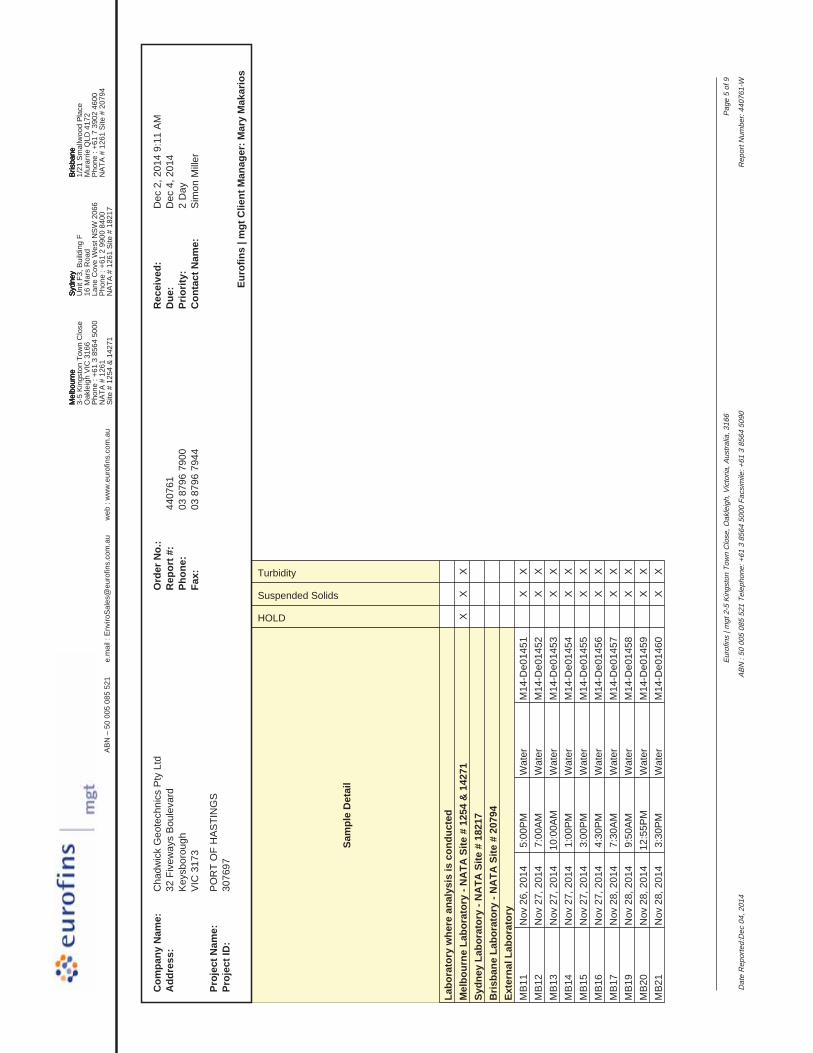
Com
pany
Nam
e:C
hadw
ick
Geo
tech
nics
Pty
Ltd
Ord
er N
o.:
Rec
eive
d:D
ec 2
, 201
4 9:
11 A
MA
ddre
ss:
32 F
ivew
ays
Bou
leva
rdR
epor
t #:
4407
61D
ue:
Dec
4, 2
014
Key
sbor
ough
Phon
e:03
879
6 79
00Pr
iorit
y:2
Day
VIC
317
3Fa
x:03
879
6 79
44C
onta
ct N
ame:
Sim
on M
iller
Proj
ect N
ame:
PO
RT
OF
HA
STI
NG
SPr
ojec
t ID
:30
7697
Euro
fins
| mgt
Clie
nt M
anag
er: M
ary
Mak
ario
s
Sam
ple
Det
ail
HOLD
Suspended Solids
Turbidity
Labo
rato
ry w
here
ana
lysi
s is
con
duct
edM
elbo
urne
Lab
orat
ory
- NA
TA S
ite #
125
4 &
142
71X
XX
Sydn
ey L
abor
ator
y - N
ATA
Site
# 1
8217
Bris
bane
Lab
orat
ory
- NA
TA S
ite #
207
94Ex
tern
al L
abor
ator
yM
B11
Nov
26,
201
4 5
:00P
MW
ater
M14
-De0
1451
XX
MB
12N
ov 2
7, 2
014
7:0
0AM
Wat
erM
14-D
e014
52X
XM
B13
Nov
27,
201
410
:00A
MW
ater
M14
-De0
1453
XX
MB
14N
ov 2
7, 2
014
1:0
0PM
Wat
erM
14-D
e014
54X
XM
B15
Nov
27,
201
4 3
:00P
MW
ater
M14
-De0
1455
XX
MB
16N
ov 2
7, 2
014
4:3
0PM
Wat
erM
14-D
e014
56X
XM
B17
Nov
28,
201
4 7
:30A
MW
ater
M14
-De0
1457
XX
MB
19N
ov 2
8, 2
014
9:5
0AM
Wat
erM
14-D
e014
58X
XM
B20
Nov
28,
201
412
:55P
MW
ater
M14
-De0
1459
XX
MB
21N
ov 2
8, 2
014
3:3
0PM
Wat
erM
14-D
e014
60X
X
AB
N –
50
005
085
521
e.m
ail :
Env
iroS
ales
@eu
rofin
s.co
m.a
u
w
eb :
ww
w.e
urof
ins.
com
.au
Mel
bour
neM
elbo
urne
Mel
bour
neM
elbo
urne
3-5
Kin
gsto
n To
wn
Clo
seO
akle
igh
VIC
316
6P
hone
: +6
1 3
8564
500
0N
ATA
# 1
261
Site
# 1
254
& 1
4271
Syd
ney
Syd
ney
Syd
ney
Syd
ney
Uni
t F3,
Bui
ldin
g F
16 M
ars
Roa
dLa
ne C
ove
Wes
t NS
W 2
066
Pho
ne :
+61
2 99
00 8
400
NA
TA #
126
1 S
ite #
182
17
Bris
bane
Bris
bane
Bris
bane
Bris
bane
1/21
Sm
allw
ood
Pla
ceM
urar
rie Q
LD 4
172
Pho
ne :
+61
7 39
02 4
600
NA
TA #
126
1 S
ite #
207
94
Dat
e R
epor
ted:
Dec
04,
201
4
Eur
ofin
s | m
gt 2
-5 K
ings
ton
Tow
n C
lose
, Oak
leig
h, V
icto
ria, A
ustra
lia, 3
166
ABN
: 50
005
085
521
Tel
epho
ne: +
61 3
856
4 50
00 F
acsi
mile
: +61
3 8
564
5090
Pag
e 5
of 9
Rep
ort N
umbe
r: 44
0761
-W
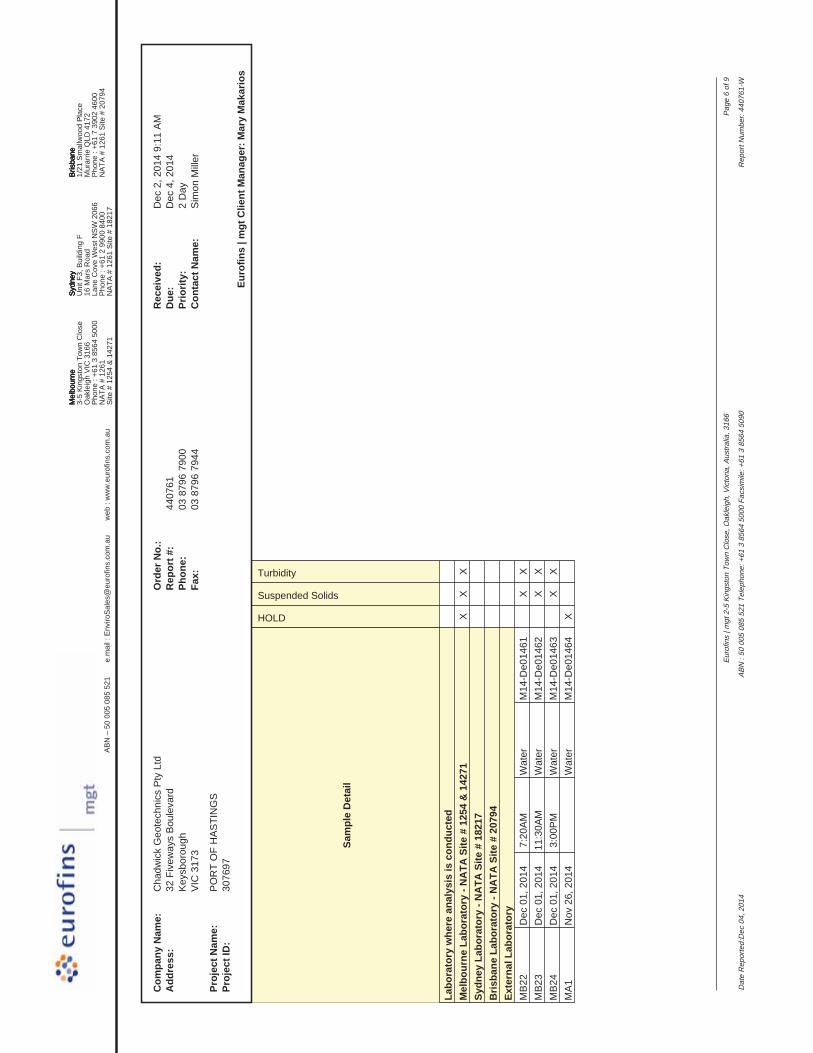
Com
pany
Nam
e:C
hadw
ick
Geo
tech
nics
Pty
Ltd
Ord
er N
o.:
Rec
eive
d:D
ec 2
, 201
4 9:
11 A
MA
ddre
ss:
32 F
ivew
ays
Bou
leva
rdR
epor
t #:
4407
61D
ue:
Dec
4, 2
014
Key
sbor
ough
Phon
e:03
879
6 79
00Pr
iorit
y:2
Day
VIC
317
3Fa
x:03
879
6 79
44C
onta
ct N
ame:
Sim
on M
iller
Proj
ect N
ame:
PO
RT
OF
HA
STI
NG
SPr
ojec
t ID
:30
7697
Euro
fins
| mgt
Clie
nt M
anag
er: M
ary
Mak
ario
s
Sam
ple
Det
ail
HOLD
Suspended Solids
Turbidity
Labo
rato
ry w
here
ana
lysi
s is
con
duct
edM
elbo
urne
Lab
orat
ory
- NA
TA S
ite #
125
4 &
142
71X
XX
Sydn
ey L
abor
ator
y - N
ATA
Site
# 1
8217
Bris
bane
Lab
orat
ory
- NA
TA S
ite #
207
94Ex
tern
al L
abor
ator
yM
B22
Dec
01,
201
4 7
:20A
MW
ater
M14
-De0
1461
XX
MB
23D
ec 0
1, 2
014
11:3
0AM
Wat
erM
14-D
e014
62X
XM
B24
Dec
01,
201
4 3
:00P
MW
ater
M14
-De0
1463
XX
MA
1N
ov 2
6, 2
014
Wat
erM
14-D
e014
64X
AB
N –
50
005
085
521
e.m
ail :
Env
iroS
ales
@eu
rofin
s.co
m.a
u
w
eb :
ww
w.e
urof
ins.
com
.au
Mel
bour
neM
elbo
urne
Mel
bour
neM
elbo
urne
3-5
Kin
gsto
n To
wn
Clo
seO
akle
igh
VIC
316
6P
hone
: +6
1 3
8564
500
0N
ATA
# 1
261
Site
# 1
254
& 1
4271
Syd
ney
Syd
ney
Syd
ney
Syd
ney
Uni
t F3,
Bui
ldin
g F
16 M
ars
Roa
dLa
ne C
ove
Wes
t NS
W 2
066
Pho
ne :
+61
2 99
00 8
400
NA
TA #
126
1 S
ite #
182
17
Bris
bane
Bris
bane
Bris
bane
Bris
bane
1/21
Sm
allw
ood
Pla
ceM
urar
rie Q
LD 4
172
Pho
ne :
+61
7 39
02 4
600
NA
TA #
126
1 S
ite #
207
94
Dat
e R
epor
ted:
Dec
04,
201
4
Eur
ofin
s | m
gt 2
-5 K
ings
ton
Tow
n C
lose
, Oak
leig
h, V
icto
ria, A
ustra
lia, 3
166
ABN
: 50
005
085
521
Tel
epho
ne: +
61 3
856
4 50
00 F
acsi
mile
: +61
3 8
564
5090
Pag
e 6
of 9
Rep
ort N
umbe
r: 44
0761
-W

Eurofins | mgt Internal Quality Control Review and Glossary
General
Holding Times
UNITS
TERMS
QC - ACCEPTANCE CRITERIA
QC DATA GENERAL COMMENTS
1. Laboratory QC results for Method Blanks, Duplicates, Matrix Spikes, and Laboratory Control Samples are included in this QC report where applicable. Additional QC data may be available onrequest.
2. All soil results are reported on a dry basis, unless otherwise stated.
3. Actual LORs are matrix dependant. Quoted LORs may be raised where sample extracts are diluted due to interferences.
4. Results are uncorrected for matrix spikes or surrogate recoveries.
5. SVOC analysis on waters are performed on homogenised, unfiltered samples, unless noted otherwise.
6. Samples were analysed on an 'as received' basis. 7. This report replaces any interim results previously issued.
Please refer to 'Sample Preservation and Container Guide' for holding times (QS3001).
For samples received on the last day of holding time, notification of testing requirements should have been received at least 6 hours prior to sample receipt deadlines as stated on the SampleReceipt Advice.
If the Laboratory did not receive the information in the required timeframe, and regardless of any other integrity issues, suitably qualified results may still be reported.
Holding times apply from the date of sampling, therefore compliance to these may be outside the laboratory's control.
**NOTE: pH duplicates are reported as a range NOT as RPD
mg/kg: milligrams per Kilogram mg/l: milligrams per litre
ug/l: micrograms per litre ppm: Parts per million
ppb: Parts per billion %: Percentage
org/100ml: Organisms per 100 millilitres NTU: Nephelometric Turbidity Units
MPN/100mL: Most Probable Number of organisms per 100 millilitres
Dry Where a moisture has been determined on a solid sample the result is expressed on a dry basis.
LOR Limit of Reporting.
SPIKE Addition of the analyte to the sample and reported as percentage recovery.
RPD Relative Percent Difference between two Duplicate pieces of analysis.
LCS Laboratory Control Sample - reported as percent recovery
CRM Certified Reference Material - reported as percent recovery
Method Blank In the case of solid samples these are performed on laboratory certified clean sands.In the case of water samples these are performed on de-ionised water.
Surr - Surrogate The addition of a like compound to the analyte target and reported as percentage recovery.
Duplicate A second piece of analysis from the same sample and reported in the same units as the result to show comparison.
Batch Duplicate A second piece of analysis from a sample outside of the clients batch of samples but run within the laboratory batch of analysis.
Batch SPIKE Spike recovery reported on a sample from outside of the clients batch of samples but run within the laboratory batch of analysis.
USEPA United States Environmental Protection Agency
APHA American Public Health Association
ASLP Australian Standard Leaching Procedure (AS4439.3)
TCLP Toxicity Characteristic Leaching Procedure
COC Chain of Custody
SRA Sample Receipt Advice
CP Client Parent - QC was performed on samples pertaining to this report
NCP Non-Client Parent - QC performed on samples not pertaining to this report, QC is representative of the sequence or batch that client samples were analysed within
TEQ Toxic Equivalency Quotient
RPD Duplicates: Global RPD Duplicates Acceptance Criteria is 30% however the following acceptance guidelines are equally applicable:
Results <10 times the LOR : No Limit
Results between 10-20 times the LOR : RPD must lie between 0-50%
Results >20 times the LOR : RPD must lie between 0-30%
Surrogate Recoveries : Recoveries must lie between 50-150% - Phenols 20-130%.
1. Where a result is reported as a less than (<), higher than the nominated LOR, this is due to either matrix interference, extract dilution required due to interferences or contaminant levels withinthe sample, high moisture content or insufficient sample provided.
2. Duplicate data shown within this report that states the word "BATCH" is a Batch Duplicate from outside of your sample batch, but within the laboratory sample batch at a 1:10 ratio. The Parentand Duplicate data shown is not data from your samples.
3. Organochlorine Pesticide analysis - where reporting LCS data, Toxophene & Chlordane are not added to the LCS.
4. Organochlorine Pesticide analysis - where reporting Spike data, Toxophene is not added to the Spike.
5. Total Recoverable Hydrocarbons - where reporting Spike & LCS data, a single spike of commercial Hydrocarbon products in the range of C12-C30 is added and it's Total Recovery is reportedin the C10-C14 cell of the Report.
6. pH and Free Chlorine analysed in the laboratory - Analysis on this test must begin within 30 minutes of sampling.Therefore laboratory analysis is unlikely to be completed within holding time.Analysis will begin as soon as possible after sample receipt.
7. Recovery Data (Spikes & Surrogates) - where chromatographic interference does not allow the determination of Recovery the term "INT" appears against that analyte.
8. Polychlorinated Biphenyls are spiked only using Arochlor 1260 in Matrix Spikes and LCS's.
9. For Matrix Spikes and LCS results a dash " -" in the report means that the specific analyte was not added to the QC sample.
10. Duplicate RPD's are calculated from raw analytical data thus it is possible to have two sets of data.
Date Reported: Dec 04, 2014
Eurofins | mgt 2-5 Kingston Town Close, Oakleigh, Victoria, Australia, 3166
ABN : 50 005 085 521 Telephone: +61 3 8564 5000 Facsimile: +61 3 8564 5090
Page 7 of 9
Report Number: 440761-W
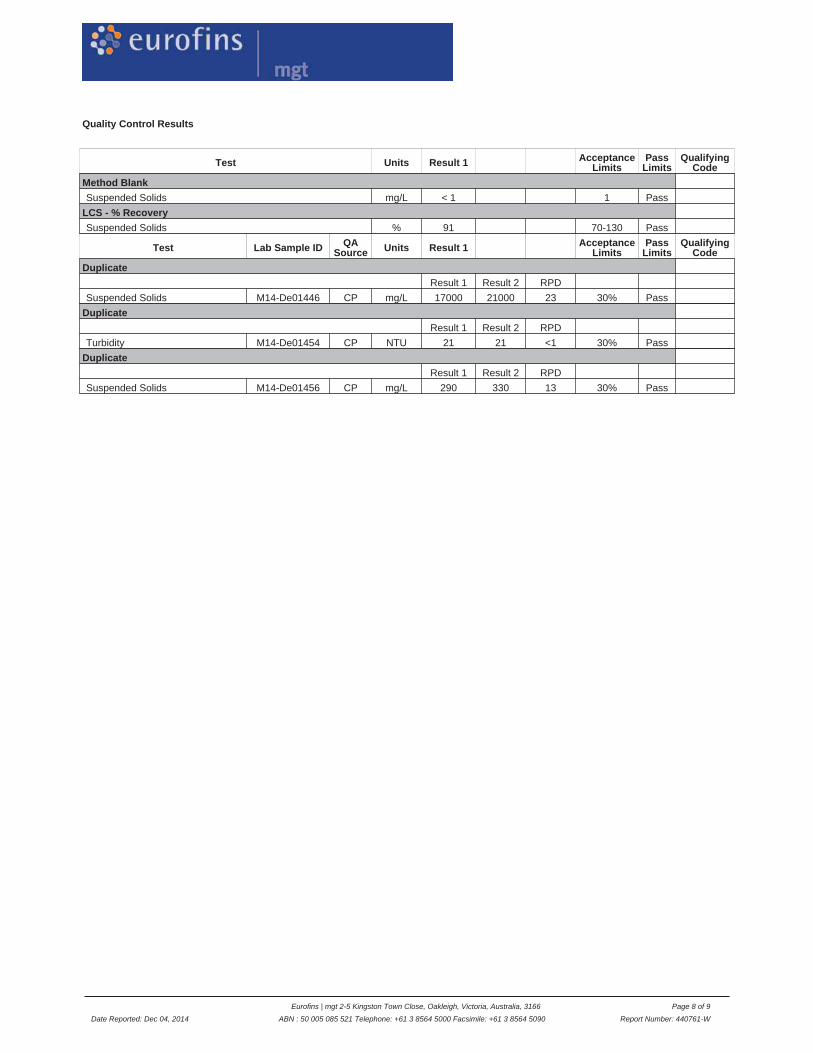
Quality Control Results
Test Units Result 1 AcceptanceLimits
PassLimits
QualifyingCode
Method BlankSuspended Solids mg/L < 1 1 Pass
LCS - % RecoverySuspended Solids % 91 70-130 Pass
Test Lab Sample ID QASource Units Result 1 Acceptance
LimitsPass
LimitsQualifying
CodeDuplicate
Result 1 Result 2 RPDSuspended Solids M14-De01446 CP mg/L 17000 21000 23 30% Pass
DuplicateResult 1 Result 2 RPD
Turbidity M14-De01454 CP NTU 21 21 <1 30% PassDuplicate
Result 1 Result 2 RPDSuspended Solids M14-De01456 CP mg/L 290 330 13 30% Pass
Date Reported: Dec 04, 2014
Eurofins | mgt 2-5 Kingston Town Close, Oakleigh, Victoria, Australia, 3166
ABN : 50 005 085 521 Telephone: +61 3 8564 5000 Facsimile: +61 3 8564 5090
Page 8 of 9
Report Number: 440761-W

Comments
Sample IntegrityCustody Seals Intact (if used) N/A
Attempt to Chill was evident Yes
Sample correctly preserved Yes
Appropriate sample containers have been used Yes
Sample containers for volatile analysis received with minimal headspace Yes
Samples received within HoldingTime Yes
Some samples have been subcontracted No
Authorised By
Mary Makarios Analytical Services Manager
Huong Le Senior Analyst-Inorganic (VIC)
Glenn JacksonNational Laboratory Manager
- Indicates Not Requested
* Indicates NATA accreditation does not cover the performance of this service
Uncertainty data is available on requestEurofins | mgt shall not be liable for loss, cost, damages or expenses incurred by the client, or any other person or company, resulting from the use of any information or interpretation given in this report. In no case shall Eurofins | mgt be liable for consequential damages including, but notlimited to, lost profits, damages for failure to meet deadlines and lost production arising from this report. This document shall not be reproduced except in full and relates only to the items tested. Unless indicated otherwise, the tests were performed on the samples as received.
Date Reported: Dec 04, 2014
Eurofins | mgt 2-5 Kingston Town Close, Oakleigh, Victoria, Australia, 3166
ABN : 50 005 085 521 Telephone: +61 3 8564 5000 Facsimile: +61 3 8564 5090
Page 9 of 9
Report Number: 440761-W

Certificate of Analysis
Chadwick Geotechnics Pty Ltd32 Fiveways BoulevardKeysboroughVIC 3173
Attention: Simon Miller
Report 441031-WProject name PORT OF HASTINGSProject ID 307697Received Date Dec 03, 2014
Client Sample ID MC1 MC2 MC3 MC4Sample Matrix Water Water Water Water
Eurofins | mgt Sample No. M14-De03627 M14-De03628 M14-De03629 M14-De03630
Date Sampled Dec 02, 2014 Dec 02, 2014 Dec 02, 2014 Dec 02, 2014
Test/Reference LOR Unit
Suspended Solids 1 mg/L 47 46 86 79Turbidity 1 NTU 18 34 48 54
Client Sample ID MC5 MC6 MC7 MC8Sample Matrix Water Water Water Water
Eurofins | mgt Sample No. M14-De03631 M14-De03632 M14-De03633 M14-De03634
Date Sampled Dec 02, 2014 Dec 02, 2014 Dec 02, 2014 Dec 02, 2014
Test/Reference LOR Unit
Suspended Solids 1 mg/L 150 220 240 320Turbidity 1 NTU 53 100 120 130
Client Sample ID MC9 MC10 MC11 CC1Sample Matrix Water Water Water Water
Eurofins | mgt Sample No. M14-De03635 M14-De03636 M14-De03637 M14-De03638
Date Sampled Dec 02, 2014 Dec 02, 2014 Dec 02, 2014 Dec 02, 2014
Test/Reference LOR Unit
Suspended Solids 1 mg/L 440 440 470 29Turbidity 1 NTU 160 200 210 21
Client Sample ID CC2 CC3 CC4 CC5Sample Matrix Water Water Water Water
Eurofins | mgt Sample No. M14-De03639 M14-De03640 M14-De03641 M14-De03642
Date Sampled Dec 02, 2014 Dec 02, 2014 Dec 02, 2014 Dec 02, 2014
Test/Reference LOR Unit
Suspended Solids 1 mg/L 36 49 59 78Turbidity 1 NTU 43 49 61 61
Date Reported: Dec 10, 2014
Eurofins | mgt 2-5 Kingston Town Close, Oakleigh, Victoria, Australia, 3166
ABN : 50 005 085 521 Telephone: +61 3 8564 5000 Facsimile: +61 3 8564 5090
Page 1 of 10
Report Number: 441031-W
NATA AccreditedAccreditation Number 1261Site Number 1254
Accredited for compliance with ISO/IEC 17025.The results of the tests, calibrations and/ormeasurements included in this document are traceableto Australian/national standards.

Client Sample ID CC6 CC7 CC8 CC9Sample Matrix Water Water Water Water
Eurofins | mgt Sample No. M14-De03643 M14-De03644 M14-De03645 M14-De03646
Date Sampled Dec 02, 2014 Dec 02, 2014 Dec 02, 2014 Dec 02, 2014
Test/Reference LOR Unit
Suspended Solids 1 mg/L 91 120 140 160Turbidity 1 NTU 89 110 120 140
Client Sample ID CC10 SC1 SC2 SC3Sample Matrix Water Water Water Water
Eurofins | mgt Sample No. M14-De03647 M14-De03648 M14-De03649 M14-De03650
Date Sampled Dec 02, 2014 Dec 02, 2014 Dec 02, 2014 Dec 02, 2014
Test/Reference LOR Unit
Suspended Solids 1 mg/L 89 5.6 27 48Turbidity 1 NTU 160 1.3 22 47
Client Sample ID SC4 SC5 SC6 SC7Sample Matrix Water Water Water Water
Eurofins | mgt Sample No. M14-De03651 M14-De03652 M14-De03653 M14-De03654
Date Sampled Dec 02, 2014 Dec 02, 2014 Dec 02, 2014 Dec 02, 2014
Test/Reference LOR Unit
Suspended Solids 1 mg/L 69 99 140 160Turbidity 1 NTU 48 77 96 110
Client Sample ID SC8 SC9 SC10 SC11Sample Matrix Water Water Water Water
Eurofins | mgt Sample No. M14-De03655 M14-De03656 M14-De03657 M14-De03658
Date Sampled Dec 02, 2014 Dec 02, 2014 Dec 02, 2014 Dec 02, 2014
Test/Reference LOR Unit
Suspended Solids 1 mg/L 200 300 170 630Turbidity 1 NTU 120 110 130 130
Date Reported: Dec 10, 2014
Eurofins | mgt 2-5 Kingston Town Close, Oakleigh, Victoria, Australia, 3166
ABN : 50 005 085 521 Telephone: +61 3 8564 5000 Facsimile: +61 3 8564 5090
Page 2 of 10
Report Number: 441031-W

Sample HistoryWhere samples are submitted/analysed over several days, the last date of extraction and analysis is reported.A recent review of our LIMS has resulted in the correction or clarification of some method identifications. Due to this, some of the method reference information on reports has changed. However,no substantive change has been made to our laboratory methods, and as such there is no change in the validity of current or previous results (regarding both quality and NATA accreditation).
If the date and time of sampling are not provided, the Laboratory will not be responsible for compromised results should testing be performed outside the recommended holding time.
Description Testing Site Extracted Holding TimeSuspended Solids Melbourne Dec 04, 2014 7 Day
- Method: APHA 2540D Total Suspended Solids
Turbidity Melbourne Dec 04, 2014 2 Day- Method: APHA 2130 Turbidity
Date Reported: Dec 10, 2014
Eurofins | mgt 2-5 Kingston Town Close, Oakleigh, Victoria, Australia, 3166
ABN : 50 005 085 521 Telephone: +61 3 8564 5000 Facsimile: +61 3 8564 5090
Page 3 of 10
Report Number: 441031-W

.C
ompa
ny N
ame:
Cha
dwic
k G
eote
chni
cs P
ty L
tdO
rder
No.
:R
ecei
ved:
Dec
3, 2
014
4:47
PM
Add
ress
:32
Fiv
eway
s B
oule
vard
Rep
ort #
:44
1031
Due
:D
ec 1
0, 2
014
Key
sbor
ough
Phon
e:03
879
6 79
00Pr
iorit
y:5
Day
VIC
317
3Fa
x:03
879
6 79
44C
onta
ct N
ame:
Sim
on M
iller
Proj
ect N
ame:
PO
RT
OF
HA
STI
NG
SPr
ojec
t ID
:30
7697
Euro
fins
| mgt
Clie
nt M
anag
er: M
ary
Mak
ario
s
Sam
ple
Det
ail
Suspended Solids
Turbidity
Labo
rato
ry w
here
ana
lysi
s is
con
duct
edM
elbo
urne
Lab
orat
ory
- NA
TA S
ite #
125
4 &
142
71X
XSy
dney
Lab
orat
ory
- NA
TA S
ite #
182
17B
risba
ne L
abor
ator
y - N
ATA
Site
# 2
0794
Exte
rnal
Lab
orat
ory
Sam
ple
IDSa
mpl
e D
ate
Sam
plin
gTi
me
Mat
rixLA
B ID
MC
1D
ec 0
2, 2
014
1:3
0PM
Wat
erM
14-D
e036
27X
XM
C2
Dec
02,
201
4 1
:34P
MW
ater
M14
-De0
3628
XX
MC
3D
ec 0
2, 2
014
1:3
6PM
Wat
erM
14-D
e036
29X
XM
C4
Dec
02,
201
4 1
:39P
MW
ater
M14
-De0
3630
XX
MC
5D
ec 0
2, 2
014
1:4
2PM
Wat
erM
14-D
e036
31X
XM
C6
Dec
02,
201
4 1
:46P
MW
ater
M14
-De0
3632
XX
MC
7D
ec 0
2, 2
014
1:5
0PM
Wat
erM
14-D
e036
33X
XM
C8
Dec
02,
201
4 1
:53P
MW
ater
M14
-De0
3634
XX
MC
9D
ec 0
2, 2
014
1:5
7PM
Wat
erM
14-D
e036
35X
X
AB
N –
50
005
085
521
e.m
ail :
Env
iroS
ales
@eu
rofin
s.co
m.a
u
w
eb :
ww
w.e
urof
ins.
com
.au
Mel
bour
neM
elbo
urne
Mel
bour
neM
elbo
urne
3-5
Kin
gsto
n To
wn
Clo
seO
akle
igh
VIC
316
6P
hone
: +6
1 3
8564
500
0N
ATA
# 1
261
Site
# 1
254
& 1
4271
Syd
ney
Syd
ney
Syd
ney
Syd
ney
Uni
t F3,
Bui
ldin
g F
16 M
ars
Roa
dLa
ne C
ove
Wes
t NS
W 2
066
Pho
ne :
+61
2 99
00 8
400
NA
TA #
126
1 S
ite #
182
17
Bris
bane
Bris
bane
Bris
bane
Bris
bane
1/21
Sm
allw
ood
Pla
ceM
urar
rie Q
LD 4
172
Pho
ne :
+61
7 39
02 4
600
NA
TA #
126
1 S
ite #
207
94
Dat
e R
epor
ted:
Dec
10,
201
4
Eur
ofin
s | m
gt 2
-5 K
ings
ton
Tow
n C
lose
, Oak
leig
h, V
icto
ria, A
ustra
lia, 3
166
ABN
: 50
005
085
521
Tel
epho
ne: +
61 3
856
4 50
00 F
acsi
mile
: +61
3 8
564
5090
Pag
e 4
of 1
0
Rep
ort N
umbe
r: 44
1031
-W

Com
pany
Nam
e:C
hadw
ick
Geo
tech
nics
Pty
Ltd
Ord
er N
o.:
Rec
eive
d:D
ec 3
, 201
4 4:
47 P
MA
ddre
ss:
32 F
ivew
ays
Bou
leva
rdR
epor
t #:
4410
31D
ue:
Dec
10,
201
4K
eysb
orou
ghPh
one:
03 8
796
7900
Prio
rity:
5 D
ayV
IC 3
173
Fax:
03 8
796
7944
Con
tact
Nam
e:S
imon
Mill
er
Proj
ect N
ame:
PO
RT
OF
HA
STI
NG
SPr
ojec
t ID
:30
7697
Euro
fins
| mgt
Clie
nt M
anag
er: M
ary
Mak
ario
s
Sam
ple
Det
ail
Suspended Solids
Turbidity
Labo
rato
ry w
here
ana
lysi
s is
con
duct
edM
elbo
urne
Lab
orat
ory
- NA
TA S
ite #
125
4 &
142
71X
XSy
dney
Lab
orat
ory
- NA
TA S
ite #
182
17B
risba
ne L
abor
ator
y - N
ATA
Site
# 2
0794
Exte
rnal
Lab
orat
ory
MC
10D
ec 0
2, 2
014
2:0
0PM
Wat
erM
14-D
e036
36X
XM
C11
Dec
02,
201
4 2
:02P
MW
ater
M14
-De0
3637
XX
CC
1D
ec 0
2, 2
014
11:1
1AM
Wat
erM
14-D
e036
38X
XC
C2
Dec
02,
201
411
:12A
MW
ater
M14
-De0
3639
XX
CC
3D
ec 0
2, 2
014
11:1
5AM
Wat
erM
14-D
e036
40X
XC
C4
Dec
02,
201
411
:16A
MW
ater
M14
-De0
3641
XX
CC
5D
ec 0
2, 2
014
11:1
8AM
Wat
erM
14-D
e036
42X
XC
C6
Dec
02,
201
411
:21A
MW
ater
M14
-De0
3643
XX
CC
7D
ec 0
2, 2
014
11:2
4AM
Wat
erM
14-D
e036
44X
XC
C8
Dec
02,
201
411
:26A
MW
ater
M14
-De0
3645
XX
AB
N –
50
005
085
521
e.m
ail :
Env
iroS
ales
@eu
rofin
s.co
m.a
u
w
eb :
ww
w.e
urof
ins.
com
.au
Mel
bour
neM
elbo
urne
Mel
bour
neM
elbo
urne
3-5
Kin
gsto
n To
wn
Clo
seO
akle
igh
VIC
316
6P
hone
: +6
1 3
8564
500
0N
ATA
# 1
261
Site
# 1
254
& 1
4271
Syd
ney
Syd
ney
Syd
ney
Syd
ney
Uni
t F3,
Bui
ldin
g F
16 M
ars
Roa
dLa
ne C
ove
Wes
t NS
W 2
066
Pho
ne :
+61
2 99
00 8
400
NA
TA #
126
1 S
ite #
182
17
Bris
bane
Bris
bane
Bris
bane
Bris
bane
1/21
Sm
allw
ood
Pla
ceM
urar
rie Q
LD 4
172
Pho
ne :
+61
7 39
02 4
600
NA
TA #
126
1 S
ite #
207
94
Dat
e R
epor
ted:
Dec
10,
201
4
Eur
ofin
s | m
gt 2
-5 K
ings
ton
Tow
n C
lose
, Oak
leig
h, V
icto
ria, A
ustra
lia, 3
166
ABN
: 50
005
085
521
Tel
epho
ne: +
61 3
856
4 50
00 F
acsi
mile
: +61
3 8
564
5090
Pag
e 5
of 1
0
Rep
ort N
umbe
r: 44
1031
-W

Com
pany
Nam
e:C
hadw
ick
Geo
tech
nics
Pty
Ltd
Ord
er N
o.:
Rec
eive
d:D
ec 3
, 201
4 4:
47 P
MA
ddre
ss:
32 F
ivew
ays
Bou
leva
rdR
epor
t #:
4410
31D
ue:
Dec
10,
201
4K
eysb
orou
ghPh
one:
03 8
796
7900
Prio
rity:
5 D
ayV
IC 3
173
Fax:
03 8
796
7944
Con
tact
Nam
e:S
imon
Mill
er
Proj
ect N
ame:
PO
RT
OF
HA
STI
NG
SPr
ojec
t ID
:30
7697
Euro
fins
| mgt
Clie
nt M
anag
er: M
ary
Mak
ario
s
Sam
ple
Det
ail
Suspended Solids
Turbidity
Labo
rato
ry w
here
ana
lysi
s is
con
duct
edM
elbo
urne
Lab
orat
ory
- NA
TA S
ite #
125
4 &
142
71X
XSy
dney
Lab
orat
ory
- NA
TA S
ite #
182
17B
risba
ne L
abor
ator
y - N
ATA
Site
# 2
0794
Exte
rnal
Lab
orat
ory
CC
9D
ec 0
2, 2
014
11:2
7AM
Wat
erM
14-D
e036
46X
XC
C10
Dec
02,
201
411
:29A
MW
ater
M14
-De0
3647
XX
SC
1D
ec 0
2, 2
014
9:5
0AM
Wat
erM
14-D
e036
48X
XS
C2
Dec
02,
201
410
:00A
MW
ater
M14
-De0
3649
XX
SC
3D
ec 0
2, 2
014
10:0
5AM
Wat
erM
14-D
e036
50X
XS
C4
Dec
02,
201
410
:10A
MW
ater
M14
-De0
3651
XX
SC
5D
ec 0
2, 2
014
10:1
5AM
Wat
erM
14-D
e036
52X
XS
C6
Dec
02,
201
410
:20A
MW
ater
M14
-De0
3653
XX
SC
7D
ec 0
2, 2
014
10:2
5AM
Wat
erM
14-D
e036
54X
XS
C8
Dec
02,
201
410
:30A
MW
ater
M14
-De0
3655
XX
AB
N –
50
005
085
521
e.m
ail :
Env
iroS
ales
@eu
rofin
s.co
m.a
u
w
eb :
ww
w.e
urof
ins.
com
.au
Mel
bour
neM
elbo
urne
Mel
bour
neM
elbo
urne
3-5
Kin
gsto
n To
wn
Clo
seO
akle
igh
VIC
316
6P
hone
: +6
1 3
8564
500
0N
ATA
# 1
261
Site
# 1
254
& 1
4271
Syd
ney
Syd
ney
Syd
ney
Syd
ney
Uni
t F3,
Bui
ldin
g F
16 M
ars
Roa
dLa
ne C
ove
Wes
t NS
W 2
066
Pho
ne :
+61
2 99
00 8
400
NA
TA #
126
1 S
ite #
182
17
Bris
bane
Bris
bane
Bris
bane
Bris
bane
1/21
Sm
allw
ood
Pla
ceM
urar
rie Q
LD 4
172
Pho
ne :
+61
7 39
02 4
600
NA
TA #
126
1 S
ite #
207
94
Dat
e R
epor
ted:
Dec
10,
201
4
Eur
ofin
s | m
gt 2
-5 K
ings
ton
Tow
n C
lose
, Oak
leig
h, V
icto
ria, A
ustra
lia, 3
166
ABN
: 50
005
085
521
Tel
epho
ne: +
61 3
856
4 50
00 F
acsi
mile
: +61
3 8
564
5090
Pag
e 6
of 1
0
Rep
ort N
umbe
r: 44
1031
-W

Com
pany
Nam
e:C
hadw
ick
Geo
tech
nics
Pty
Ltd
Ord
er N
o.:
Rec
eive
d:D
ec 3
, 201
4 4:
47 P
MA
ddre
ss:
32 F
ivew
ays
Bou
leva
rdR
epor
t #:
4410
31D
ue:
Dec
10,
201
4K
eysb
orou
ghPh
one:
03 8
796
7900
Prio
rity:
5 D
ayV
IC 3
173
Fax:
03 8
796
7944
Con
tact
Nam
e:S
imon
Mill
er
Proj
ect N
ame:
PO
RT
OF
HA
STI
NG
SPr
ojec
t ID
:30
7697
Euro
fins
| mgt
Clie
nt M
anag
er: M
ary
Mak
ario
s
Sam
ple
Det
ail
Suspended Solids
Turbidity
Labo
rato
ry w
here
ana
lysi
s is
con
duct
edM
elbo
urne
Lab
orat
ory
- NA
TA S
ite #
125
4 &
142
71X
XSy
dney
Lab
orat
ory
- NA
TA S
ite #
182
17B
risba
ne L
abor
ator
y - N
ATA
Site
# 2
0794
Exte
rnal
Lab
orat
ory
SC
9D
ec 0
2, 2
014
10:3
5AM
Wat
erM
14-D
e036
56X
XS
C10
Dec
02,
201
410
:37A
MW
ater
M14
-De0
3657
XX
SC
11D
ec 0
2, 2
014
10:4
0AM
Wat
erM
14-D
e036
58X
X
AB
N –
50
005
085
521
e.m
ail :
Env
iroS
ales
@eu
rofin
s.co
m.a
u
w
eb :
ww
w.e
urof
ins.
com
.au
Mel
bour
neM
elbo
urne
Mel
bour
neM
elbo
urne
3-5
Kin
gsto
n To
wn
Clo
seO
akle
igh
VIC
316
6P
hone
: +6
1 3
8564
500
0N
ATA
# 1
261
Site
# 1
254
& 1
4271
Syd
ney
Syd
ney
Syd
ney
Syd
ney
Uni
t F3,
Bui
ldin
g F
16 M
ars
Roa
dLa
ne C
ove
Wes
t NS
W 2
066
Pho
ne :
+61
2 99
00 8
400
NA
TA #
126
1 S
ite #
182
17
Bris
bane
Bris
bane
Bris
bane
Bris
bane
1/21
Sm
allw
ood
Pla
ceM
urar
rie Q
LD 4
172
Pho
ne :
+61
7 39
02 4
600
NA
TA #
126
1 S
ite #
207
94
Dat
e R
epor
ted:
Dec
10,
201
4
Eur
ofin
s | m
gt 2
-5 K
ings
ton
Tow
n C
lose
, Oak
leig
h, V
icto
ria, A
ustra
lia, 3
166
ABN
: 50
005
085
521
Tel
epho
ne: +
61 3
856
4 50
00 F
acsi
mile
: +61
3 8
564
5090
Pag
e 7
of 1
0
Rep
ort N
umbe
r: 44
1031
-W

Eurofins | mgt Internal Quality Control Review and Glossary
General
Holding Times
UNITS
TERMS
QC - ACCEPTANCE CRITERIA
QC DATA GENERAL COMMENTS
1. Laboratory QC results for Method Blanks, Duplicates, Matrix Spikes, and Laboratory Control Samples are included in this QC report where applicable. Additional QC data may be available onrequest.
2. All soil results are reported on a dry basis, unless otherwise stated.
3. Actual LORs are matrix dependant. Quoted LORs may be raised where sample extracts are diluted due to interferences.
4. Results are uncorrected for matrix spikes or surrogate recoveries.
5. SVOC analysis on waters are performed on homogenised, unfiltered samples, unless noted otherwise.
6. Samples were analysed on an 'as received' basis. 7. This report replaces any interim results previously issued.
Please refer to 'Sample Preservation and Container Guide' for holding times (QS3001).
For samples received on the last day of holding time, notification of testing requirements should have been received at least 6 hours prior to sample receipt deadlines as stated on the SampleReceipt Advice.
If the Laboratory did not receive the information in the required timeframe, and regardless of any other integrity issues, suitably qualified results may still be reported.
Holding times apply from the date of sampling, therefore compliance to these may be outside the laboratory's control.
**NOTE: pH duplicates are reported as a range NOT as RPD
mg/kg: milligrams per Kilogram mg/l: milligrams per litre
ug/l: micrograms per litre ppm: Parts per million
ppb: Parts per billion %: Percentage
org/100ml: Organisms per 100 millilitres NTU: Nephelometric Turbidity Units
MPN/100mL: Most Probable Number of organisms per 100 millilitres
Dry Where a moisture has been determined on a solid sample the result is expressed on a dry basis.
LOR Limit of Reporting.
SPIKE Addition of the analyte to the sample and reported as percentage recovery.
RPD Relative Percent Difference between two Duplicate pieces of analysis.
LCS Laboratory Control Sample - reported as percent recovery
CRM Certified Reference Material - reported as percent recovery
Method Blank In the case of solid samples these are performed on laboratory certified clean sands.In the case of water samples these are performed on de-ionised water.
Surr - Surrogate The addition of a like compound to the analyte target and reported as percentage recovery.
Duplicate A second piece of analysis from the same sample and reported in the same units as the result to show comparison.
Batch Duplicate A second piece of analysis from a sample outside of the clients batch of samples but run within the laboratory batch of analysis.
Batch SPIKE Spike recovery reported on a sample from outside of the clients batch of samples but run within the laboratory batch of analysis.
USEPA United States Environmental Protection Agency
APHA American Public Health Association
ASLP Australian Standard Leaching Procedure (AS4439.3)
TCLP Toxicity Characteristic Leaching Procedure
COC Chain of Custody
SRA Sample Receipt Advice
CP Client Parent - QC was performed on samples pertaining to this report
NCP Non-Client Parent - QC performed on samples not pertaining to this report, QC is representative of the sequence or batch that client samples were analysed within
TEQ Toxic Equivalency Quotient
RPD Duplicates: Global RPD Duplicates Acceptance Criteria is 30% however the following acceptance guidelines are equally applicable:
Results <10 times the LOR : No Limit
Results between 10-20 times the LOR : RPD must lie between 0-50%
Results >20 times the LOR : RPD must lie between 0-30%
Surrogate Recoveries : Recoveries must lie between 50-150% - Phenols 20-130%.
1. Where a result is reported as a less than (<), higher than the nominated LOR, this is due to either matrix interference, extract dilution required due to interferences or contaminant levels withinthe sample, high moisture content or insufficient sample provided.
2. Duplicate data shown within this report that states the word "BATCH" is a Batch Duplicate from outside of your sample batch, but within the laboratory sample batch at a 1:10 ratio. The Parentand Duplicate data shown is not data from your samples.
3. Organochlorine Pesticide analysis - where reporting LCS data, Toxophene & Chlordane are not added to the LCS.
4. Organochlorine Pesticide analysis - where reporting Spike data, Toxophene is not added to the Spike.
5. Total Recoverable Hydrocarbons - where reporting Spike & LCS data, a single spike of commercial Hydrocarbon products in the range of C12-C30 is added and it's Total Recovery is reportedin the C10-C14 cell of the Report.
6. pH and Free Chlorine analysed in the laboratory - Analysis on this test must begin within 30 minutes of sampling.Therefore laboratory analysis is unlikely to be completed within holding time.Analysis will begin as soon as possible after sample receipt.
7. Recovery Data (Spikes & Surrogates) - where chromatographic interference does not allow the determination of Recovery the term "INT" appears against that analyte.
8. Polychlorinated Biphenyls are spiked only using Arochlor 1260 in Matrix Spikes and LCS's.
9. For Matrix Spikes and LCS results a dash " -" in the report means that the specific analyte was not added to the QC sample.
10. Duplicate RPD's are calculated from raw analytical data thus it is possible to have two sets of data.
Date Reported: Dec 10, 2014
Eurofins | mgt 2-5 Kingston Town Close, Oakleigh, Victoria, Australia, 3166
ABN : 50 005 085 521 Telephone: +61 3 8564 5000 Facsimile: +61 3 8564 5090
Page 8 of 10
Report Number: 441031-W

Quality Control Results
Test Units Result 1 AcceptanceLimits
PassLimits
QualifyingCode
Method BlankSuspended Solids mg/L < 1 1 Pass
LCS - % RecoverySuspended Solids % 99 70-130 Pass
Test Lab Sample ID QASource Units Result 1 Acceptance
LimitsPass
LimitsQualifying
CodeDuplicate
Result 1 Result 2 RPDTurbidity M14-De03639 CP NTU 43 43 1.0 30% Pass
DuplicateResult 1 Result 2 RPD
Suspended Solids M14-De03642 CP mg/L 78 97 22 30% PassDuplicate
Result 1 Result 2 RPDSuspended Solids M14-De03652 CP mg/L 99 110 12 30% Pass
DuplicateResult 1 Result 2 RPD
Turbidity M14-De03658 CP NTU 130 130 <1 30% Pass
Date Reported: Dec 10, 2014
Eurofins | mgt 2-5 Kingston Town Close, Oakleigh, Victoria, Australia, 3166
ABN : 50 005 085 521 Telephone: +61 3 8564 5000 Facsimile: +61 3 8564 5090
Page 9 of 10
Report Number: 441031-W

Comments
Sample IntegrityCustody Seals Intact (if used) N/A
Attempt to Chill was evident Yes
Sample correctly preserved Yes
Appropriate sample containers have been used Yes
Sample containers for volatile analysis received with minimal headspace N/A
Samples received within HoldingTime Yes
Some samples have been subcontracted No
Authorised By
Mary Makarios Analytical Services Manager
Huong Le Senior Analyst-Inorganic (VIC)
Glenn JacksonNational Laboratory Manager
- Indicates Not Requested
* Indicates NATA accreditation does not cover the performance of this service
Uncertainty data is available on requestEurofins | mgt shall not be liable for loss, cost, damages or expenses incurred by the client, or any other person or company, resulting from the use of any information or interpretation given in this report. In no case shall Eurofins | mgt be liable for consequential damages including, but notlimited to, lost profits, damages for failure to meet deadlines and lost production arising from this report. This document shall not be reproduced except in full and relates only to the items tested. Unless indicated otherwise, the tests were performed on the samples as received.
Date Reported: Dec 10, 2014
Eurofins | mgt 2-5 Kingston Town Close, Oakleigh, Victoria, Australia, 3166
ABN : 50 005 085 521 Telephone: +61 3 8564 5000 Facsimile: +61 3 8564 5090
Page 10 of 10
Report Number: 441031-W

Certificate of Analysis
Chadwick Geotechnics Pty Ltd32 Fiveways BoulevardKeysboroughVIC 3173
Attention: Simon Miller
Report 442632-WProject nameProject ID 307697Received Date Dec 16, 2014
Client Sample ID SCC1 SCC2 SCC3 SCC4Sample Matrix Water Water Water Water
Eurofins | mgt Sample No. M14-De15526 M14-De15527 M14-De15528 M14-De15529
Date Sampled Dec 16, 2014 Dec 16, 2014 Dec 16, 2014 Dec 16, 2014
Test/Reference LOR Unit
Suspended Solids 1 mg/L 14 13 32 46Turbidity 1 NTU 9.1 12 21 35
Client Sample ID SCC5 SCC6 SCC7 SCC8Sample Matrix Water Water Water Water
Eurofins | mgt Sample No. M14-De15530 M14-De15531 M14-De15532 M14-De15533
Date Sampled Dec 16, 2014 Dec 16, 2014 Dec 16, 2014 Dec 16, 2014
Test/Reference LOR Unit
Suspended Solids 1 mg/L 54 91 110 140Turbidity 1 NTU 50 80 84 91
Client Sample ID SCC9 SCC10 SCC11 SCC12Sample Matrix Water Water Water Water
Eurofins | mgt Sample No. M14-De15534 M14-De15535 M14-De15536 M14-De15537
Date Sampled Dec 16, 2014 Dec 16, 2014 Dec 16, 2014 Dec 16, 2014
Test/Reference LOR Unit
Suspended Solids 1 mg/L 180 230 270 360Turbidity 1 NTU 130 160 190 190
Client Sample ID SCC12Sample Matrix Water
Eurofins | mgt Sample No. M14-De15538
Date Sampled Dec 16, 2014
Test/Reference LOR Unit
Suspended Solids 1 mg/L 450Turbidity 1 NTU 250
Date Reported: Dec 23, 2014
Eurofins | mgt 2-5 Kingston Town Close, Oakleigh, Victoria, Australia, 3166
ABN : 50 005 085 521 Telephone: +61 3 8564 5000 Facsimile: +61 3 8564 5090
Page 1 of 7
Report Number: 442632-W
NATA AccreditedAccreditation Number 1261Site Number 1254
Accredited for compliance with ISO/IEC 17025.The results of the tests, calibrations and/ormeasurements included in this document are traceableto Australian/national standards.

Sample HistoryWhere samples are submitted/analysed over several days, the last date of extraction and analysis is reported.A recent review of our LIMS has resulted in the correction or clarification of some method identifications. Due to this, some of the method reference information on reports has changed. However,no substantive change has been made to our laboratory methods, and as such there is no change in the validity of current or previous results (regarding both quality and NATA accreditation).
If the date and time of sampling are not provided, the Laboratory will not be responsible for compromised results should testing be performed outside the recommended holding time.
Description Testing Site Extracted Holding TimeSuspended Solids Melbourne Dec 17, 2014 7 Day
- Method: APHA 2540D Total Suspended Solids
Turbidity Melbourne Dec 17, 2014 2 Day- Method: APHA 2130 Turbidity
Date Reported: Dec 23, 2014
Eurofins | mgt 2-5 Kingston Town Close, Oakleigh, Victoria, Australia, 3166
ABN : 50 005 085 521 Telephone: +61 3 8564 5000 Facsimile: +61 3 8564 5090
Page 2 of 7
Report Number: 442632-W
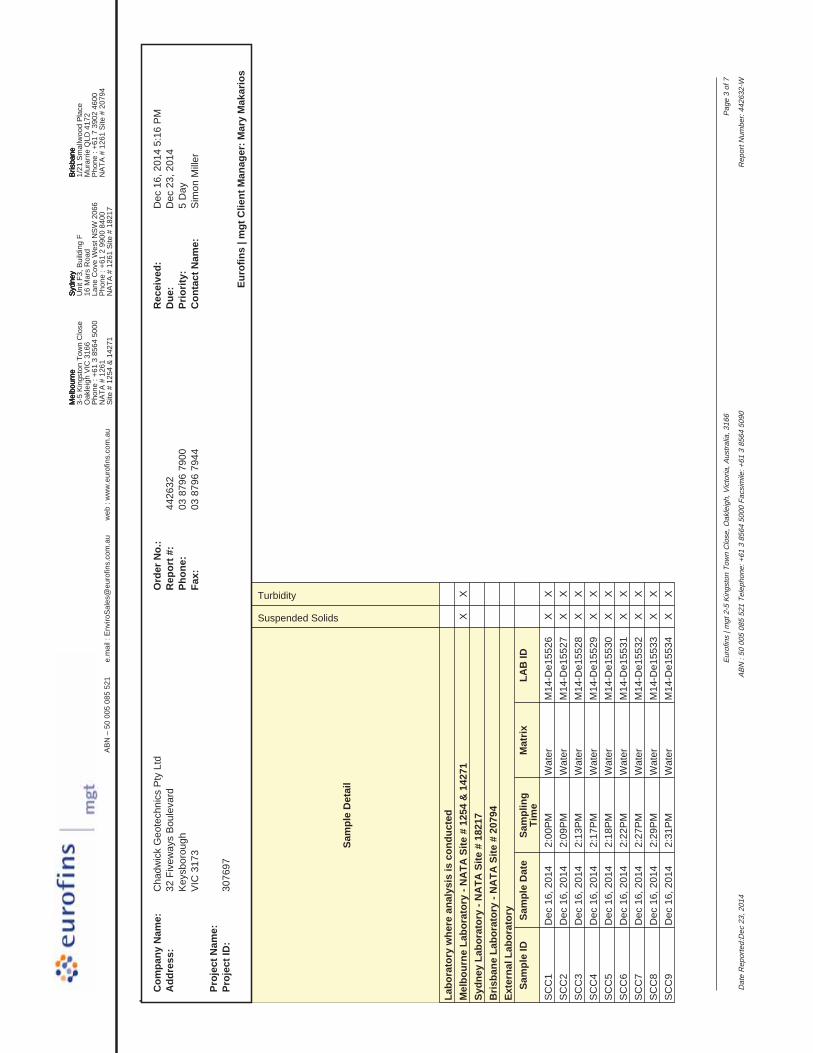
.C
ompa
ny N
ame:
Cha
dwic
k G
eote
chni
cs P
ty L
tdO
rder
No.
:R
ecei
ved:
Dec
16,
201
4 5:
16 P
MA
ddre
ss:
32 F
ivew
ays
Bou
leva
rdR
epor
t #:
4426
32D
ue:
Dec
23,
201
4K
eysb
orou
ghPh
one:
03 8
796
7900
Prio
rity:
5 D
ayV
IC 3
173
Fax:
03 8
796
7944
Con
tact
Nam
e:S
imon
Mill
er
Proj
ect N
ame:
Proj
ect I
D:
3076
97Eu
rofin
s | m
gt C
lient
Man
ager
: Mar
y M
akar
ios
Sam
ple
Det
ail
Suspended Solids
Turbidity
Labo
rato
ry w
here
ana
lysi
s is
con
duct
edM
elbo
urne
Lab
orat
ory
- NA
TA S
ite #
125
4 &
142
71X
XSy
dney
Lab
orat
ory
- NA
TA S
ite #
182
17B
risba
ne L
abor
ator
y - N
ATA
Site
# 2
0794
Exte
rnal
Lab
orat
ory
Sam
ple
IDSa
mpl
e D
ate
Sam
plin
gTi
me
Mat
rixLA
B ID
SC
C1
Dec
16,
201
4 2
:00P
MW
ater
M14
-De1
5526
XX
SC
C2
Dec
16,
201
4 2
:09P
MW
ater
M14
-De1
5527
XX
SC
C3
Dec
16,
201
4 2
:13P
MW
ater
M14
-De1
5528
XX
SC
C4
Dec
16,
201
4 2
:17P
MW
ater
M14
-De1
5529
XX
SC
C5
Dec
16,
201
4 2
:18P
MW
ater
M14
-De1
5530
XX
SC
C6
Dec
16,
201
4 2
:22P
MW
ater
M14
-De1
5531
XX
SC
C7
Dec
16,
201
4 2
:27P
MW
ater
M14
-De1
5532
XX
SC
C8
Dec
16,
201
4 2
:29P
MW
ater
M14
-De1
5533
XX
SC
C9
Dec
16,
201
4 2
:31P
MW
ater
M14
-De1
5534
XX
AB
N –
50
005
085
521
e.m
ail :
Env
iroS
ales
@eu
rofin
s.co
m.a
u
w
eb :
ww
w.e
urof
ins.
com
.au
Mel
bour
neM
elbo
urne
Mel
bour
neM
elbo
urne
3-5
Kin
gsto
n To
wn
Clo
seO
akle
igh
VIC
316
6P
hone
: +6
1 3
8564
500
0N
ATA
# 1
261
Site
# 1
254
& 1
4271
Syd
ney
Syd
ney
Syd
ney
Syd
ney
Uni
t F3,
Bui
ldin
g F
16 M
ars
Roa
dLa
ne C
ove
Wes
t NS
W 2
066
Pho
ne :
+61
2 99
00 8
400
NA
TA #
126
1 S
ite #
182
17
Bris
bane
Bris
bane
Bris
bane
Bris
bane
1/21
Sm
allw
ood
Pla
ceM
urar
rie Q
LD 4
172
Pho
ne :
+61
7 39
02 4
600
NA
TA #
126
1 S
ite #
207
94
Dat
e R
epor
ted:
Dec
23,
201
4
Eur
ofin
s | m
gt 2
-5 K
ings
ton
Tow
n C
lose
, Oak
leig
h, V
icto
ria, A
ustra
lia, 3
166
ABN
: 50
005
085
521
Tel
epho
ne: +
61 3
856
4 50
00 F
acsi
mile
: +61
3 8
564
5090
Pag
e 3
of 7
Rep
ort N
umbe
r: 44
2632
-W

Com
pany
Nam
e:C
hadw
ick
Geo
tech
nics
Pty
Ltd
Ord
er N
o.:
Rec
eive
d:D
ec 1
6, 2
014
5:16
PM
Add
ress
:32
Fiv
eway
s B
oule
vard
Rep
ort #
:44
2632
Due
:D
ec 2
3, 2
014
Key
sbor
ough
Phon
e:03
879
6 79
00Pr
iorit
y:5
Day
VIC
317
3Fa
x:03
879
6 79
44C
onta
ct N
ame:
Sim
on M
iller
Proj
ect N
ame:
Proj
ect I
D:
3076
97Eu
rofin
s | m
gt C
lient
Man
ager
: Mar
y M
akar
ios
Sam
ple
Det
ail
Suspended Solids
Turbidity
Labo
rato
ry w
here
ana
lysi
s is
con
duct
edM
elbo
urne
Lab
orat
ory
- NA
TA S
ite #
125
4 &
142
71X
XSy
dney
Lab
orat
ory
- NA
TA S
ite #
182
17B
risba
ne L
abor
ator
y - N
ATA
Site
# 2
0794
Exte
rnal
Lab
orat
ory
SC
C10
Dec
16,
201
4 2
:35P
MW
ater
M14
-De1
5535
XX
SC
C11
Dec
16,
201
4 2
:37P
MW
ater
M14
-De1
5536
XX
SC
C12
Dec
16,
201
4 2
:40P
MW
ater
M14
-De1
5537
XX
SC
C12
Dec
16,
201
4 2
:42P
MW
ater
M14
-De1
5538
XX
AB
N –
50
005
085
521
e.m
ail :
Env
iroS
ales
@eu
rofin
s.co
m.a
u
w
eb :
ww
w.e
urof
ins.
com
.au
Mel
bour
neM
elbo
urne
Mel
bour
neM
elbo
urne
3-5
Kin
gsto
n To
wn
Clo
seO
akle
igh
VIC
316
6P
hone
: +6
1 3
8564
500
0N
ATA
# 1
261
Site
# 1
254
& 1
4271
Syd
ney
Syd
ney
Syd
ney
Syd
ney
Uni
t F3,
Bui
ldin
g F
16 M
ars
Roa
dLa
ne C
ove
Wes
t NS
W 2
066
Pho
ne :
+61
2 99
00 8
400
NA
TA #
126
1 S
ite #
182
17
Bris
bane
Bris
bane
Bris
bane
Bris
bane
1/21
Sm
allw
ood
Pla
ceM
urar
rie Q
LD 4
172
Pho
ne :
+61
7 39
02 4
600
NA
TA #
126
1 S
ite #
207
94
Dat
e R
epor
ted:
Dec
23,
201
4
Eur
ofin
s | m
gt 2
-5 K
ings
ton
Tow
n C
lose
, Oak
leig
h, V
icto
ria, A
ustra
lia, 3
166
ABN
: 50
005
085
521
Tel
epho
ne: +
61 3
856
4 50
00 F
acsi
mile
: +61
3 8
564
5090
Pag
e 4
of 7
Rep
ort N
umbe
r: 44
2632
-W

Eurofins | mgt Internal Quality Control Review and Glossary
General
Holding Times
UNITS
TERMS
QC - ACCEPTANCE CRITERIA
QC DATA GENERAL COMMENTS
1. Laboratory QC results for Method Blanks, Duplicates, Matrix Spikes, and Laboratory Control Samples are included in this QC report where applicable. Additional QC data may be available onrequest.
2. All soil results are reported on a dry basis, unless otherwise stated.
3. Actual LORs are matrix dependant. Quoted LORs may be raised where sample extracts are diluted due to interferences.
4. Results are uncorrected for matrix spikes or surrogate recoveries.
5. SVOC analysis on waters are performed on homogenised, unfiltered samples, unless noted otherwise.
6. Samples were analysed on an 'as received' basis. 7. This report replaces any interim results previously issued.
Please refer to 'Sample Preservation and Container Guide' for holding times (QS3001).
For samples received on the last day of holding time, notification of testing requirements should have been received at least 6 hours prior to sample receipt deadlines as stated on the SampleReceipt Advice.
If the Laboratory did not receive the information in the required timeframe, and regardless of any other integrity issues, suitably qualified results may still be reported.
Holding times apply from the date of sampling, therefore compliance to these may be outside the laboratory's control.
**NOTE: pH duplicates are reported as a range NOT as RPD
mg/kg: milligrams per Kilogram mg/l: milligrams per litre
ug/l: micrograms per litre ppm: Parts per million
ppb: Parts per billion %: Percentage
org/100ml: Organisms per 100 millilitres NTU: Nephelometric Turbidity Units
MPN/100mL: Most Probable Number of organisms per 100 millilitres
Dry Where a moisture has been determined on a solid sample the result is expressed on a dry basis.
LOR Limit of Reporting.
SPIKE Addition of the analyte to the sample and reported as percentage recovery.
RPD Relative Percent Difference between two Duplicate pieces of analysis.
LCS Laboratory Control Sample - reported as percent recovery
CRM Certified Reference Material - reported as percent recovery
Method Blank In the case of solid samples these are performed on laboratory certified clean sands.In the case of water samples these are performed on de-ionised water.
Surr - Surrogate The addition of a like compound to the analyte target and reported as percentage recovery.
Duplicate A second piece of analysis from the same sample and reported in the same units as the result to show comparison.
Batch Duplicate A second piece of analysis from a sample outside of the clients batch of samples but run within the laboratory batch of analysis.
Batch SPIKE Spike recovery reported on a sample from outside of the clients batch of samples but run within the laboratory batch of analysis.
USEPA United States Environmental Protection Agency
APHA American Public Health Association
ASLP Australian Standard Leaching Procedure (AS4439.3)
TCLP Toxicity Characteristic Leaching Procedure
COC Chain of Custody
SRA Sample Receipt Advice
CP Client Parent - QC was performed on samples pertaining to this report
NCP Non-Client Parent - QC performed on samples not pertaining to this report, QC is representative of the sequence or batch that client samples were analysed within
TEQ Toxic Equivalency Quotient
RPD Duplicates: Global RPD Duplicates Acceptance Criteria is 30% however the following acceptance guidelines are equally applicable:
Results <10 times the LOR : No Limit
Results between 10-20 times the LOR : RPD must lie between 0-50%
Results >20 times the LOR : RPD must lie between 0-30%
Surrogate Recoveries : Recoveries must lie between 50-150% - Phenols 20-130%.
1. Where a result is reported as a less than (<), higher than the nominated LOR, this is due to either matrix interference, extract dilution required due to interferences or contaminant levels withinthe sample, high moisture content or insufficient sample provided.
2. Duplicate data shown within this report that states the word "BATCH" is a Batch Duplicate from outside of your sample batch, but within the laboratory sample batch at a 1:10 ratio. The Parentand Duplicate data shown is not data from your samples.
3. Organochlorine Pesticide analysis - where reporting LCS data, Toxophene & Chlordane are not added to the LCS.
4. Organochlorine Pesticide analysis - where reporting Spike data, Toxophene is not added to the Spike.
5. Total Recoverable Hydrocarbons - where reporting Spike & LCS data, a single spike of commercial Hydrocarbon products in the range of C12-C30 is added and it's Total Recovery is reportedin the C10-C14 cell of the Report.
6. pH and Free Chlorine analysed in the laboratory - Analysis on this test must begin within 30 minutes of sampling.Therefore laboratory analysis is unlikely to be completed within holding time.Analysis will begin as soon as possible after sample receipt.
7. Recovery Data (Spikes & Surrogates) - where chromatographic interference does not allow the determination of Recovery the term "INT" appears against that analyte.
8. Polychlorinated Biphenyls are spiked only using Arochlor 1260 in Matrix Spikes and LCS's.
9. For Matrix Spikes and LCS results a dash " -" in the report means that the specific analyte was not added to the QC sample.
10. Duplicate RPD's are calculated from raw analytical data thus it is possible to have two sets of data.
Date Reported: Dec 23, 2014
Eurofins | mgt 2-5 Kingston Town Close, Oakleigh, Victoria, Australia, 3166
ABN : 50 005 085 521 Telephone: +61 3 8564 5000 Facsimile: +61 3 8564 5090
Page 5 of 7
Report Number: 442632-W

Quality Control Results
Test Units Result 1 AcceptanceLimits
PassLimits
QualifyingCode
Method BlankSuspended Solids mg/L < 1 1 Pass
LCS - % RecoverySuspended Solids % 101 70-130 Pass
Test Lab Sample ID QASource Units Result 1 Acceptance
LimitsPass
LimitsQualifying
CodeDuplicate
Result 1 Result 2 RPDSuspended Solids M14-De14220 NCP mg/L 250 250 <1 30% PassTurbidity M14-De15526 CP NTU 9.1 9.1 <1 30% Pass
Date Reported: Dec 23, 2014
Eurofins | mgt 2-5 Kingston Town Close, Oakleigh, Victoria, Australia, 3166
ABN : 50 005 085 521 Telephone: +61 3 8564 5000 Facsimile: +61 3 8564 5090
Page 6 of 7
Report Number: 442632-W

Comments
Sample IntegrityCustody Seals Intact (if used) N/A
Attempt to Chill was evident Yes
Sample correctly preserved No
Appropriate sample containers have been used Yes
Sample containers for volatile analysis received with minimal headspace Yes
Samples received within HoldingTime Yes
Some samples have been subcontracted No
Authorised By
Mary Makarios Analytical Services Manager
Huong Le Senior Analyst-Inorganic (VIC)
Glenn JacksonNational Laboratory Manager
- Indicates Not Requested
* Indicates NATA accreditation does not cover the performance of this service
Uncertainty data is available on requestEurofins | mgt shall not be liable for loss, cost, damages or expenses incurred by the client, or any other person or company, resulting from the use of any information or interpretation given in this report. In no case shall Eurofins | mgt be liable for consequential damages including, but notlimited to, lost profits, damages for failure to meet deadlines and lost production arising from this report. This document shall not be reproduced except in full and relates only to the items tested. Unless indicated otherwise, the tests were performed on the samples as received.
Date Reported: Dec 23, 2014
Eurofins | mgt 2-5 Kingston Town Close, Oakleigh, Victoria, Australia, 3166
ABN : 50 005 085 521 Telephone: +61 3 8564 5000 Facsimile: +61 3 8564 5090
Page 7 of 7
Report Number: 442632-W

Settlement Testing HAS-CEP0-HY-REP-0030 Final Working Draft (Revision 0) © 2015 Haskoning Australia Pty Ltd March 2015
APPENDIX H TSS-Turbidity Test Sheets – Stiff-Hard Clays

Settlement Testing HAS-CEP0-HY-REP-0030 Final Working Draft (Revision 0) © 2015 Haskoning Australia Pty Ltd March 2015
Table H1: Turbidity measurements and sampling information – stiff-hard clays (Dilution Test)
Test Material Turbidity (NTU) TSS Sample Date / Time
Seawater 3.86 No Sample - See Sample SC-1 2 Dec 2014 /1110
Seawater + Clay Mixture 19.4 CC-1 2 Dec 2014 /1111 Seawater + Clay Mixture 35 CC-2 2 Dec 2014 /1112 Seawater + Clay Mixture 42.6 CC-3 2 Dec 2014 /1115 Seawater + Clay Mixture 51.7 CC-4 2 Dec 2014 /1116 Seawater + Clay Mixture 65.2 CC-5 2 Dec 2014 /1118 Seawater + Clay Mixture 86.2 CC-6 2 Dec 2014 /1121 Seawater + Clay Mixture 100.1 CC-7 2 Dec 2014 /1124 Seawater + Clay Mixture 118.6 CC-8 2 Dec 2014 /1126 Seawater + Clay Mixture 139 CC-9 2 Dec 2014 /1127 Seawater + Clay Mixture 157.2 CC-10 2 Dec 2014 /1130
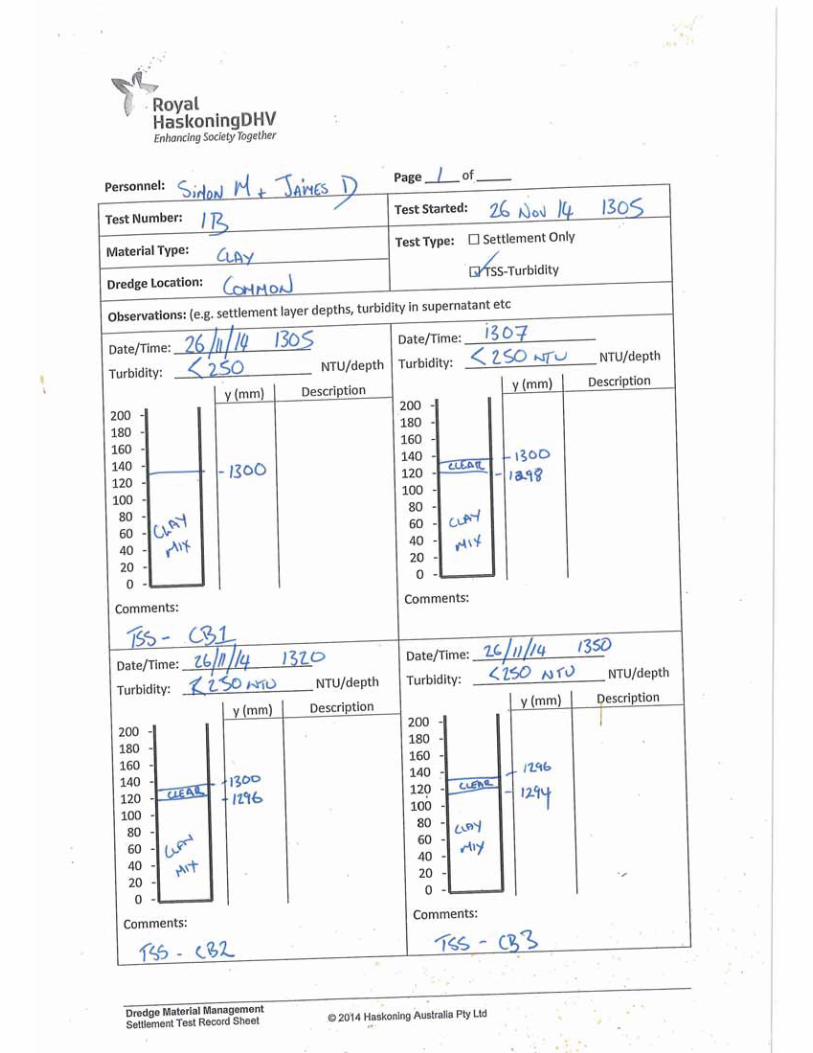

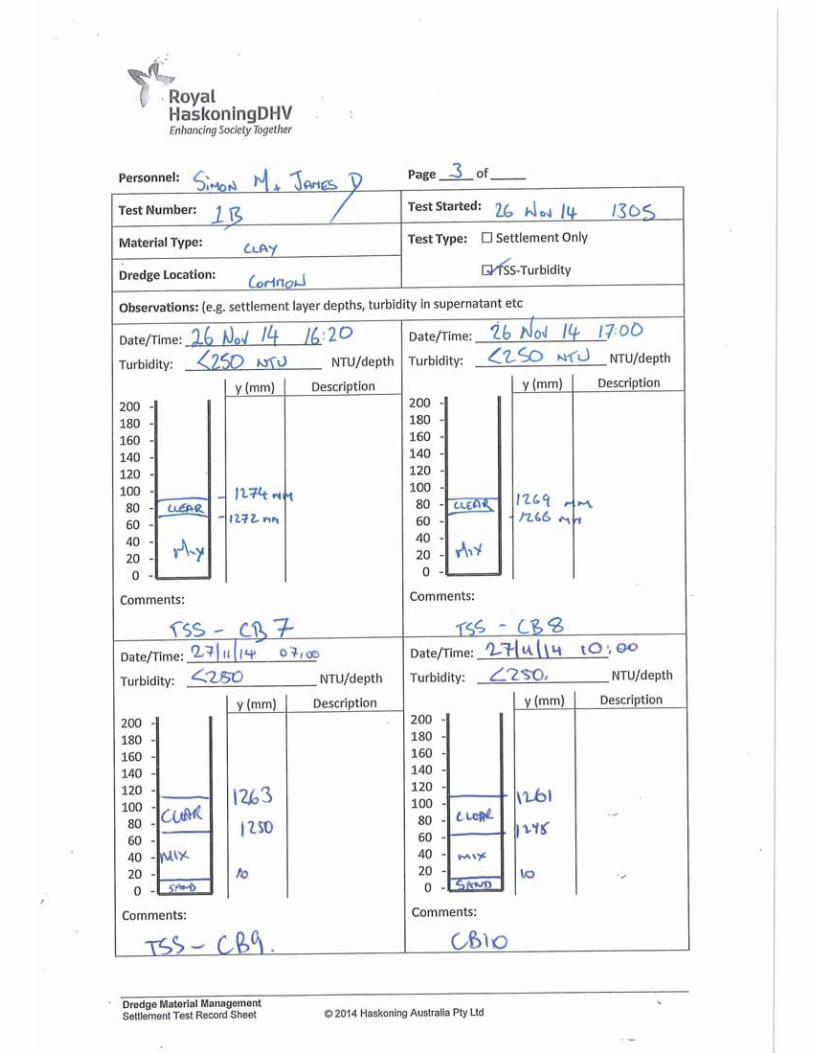


Settlement Testing HAS-CEP0-HY-REP-0030 Final Working Draft (Revision 0) © 2015 Haskoning Australia Pty Ltd March 2015
APPENDIX I TSS-Turbidity Test Sheets – Silty/Clayey Sands

Settlement Testing HAS-CEP0-HY-REP-0030 Final Working Draft (Revision 0) © 2015 Haskoning Australia Pty Ltd March 2015
Table I1: Turbidity measurements and sampling information – silty/clayey sands (Dilution Test)
Test Material Turbidity (NTU) TSS Sample ID Date / Time Seawater 3.6 SC-1 2 Dec 2014 /0950 Seawater + Sand Mixture 18.3 SC-2 2 Dec 2014 /1000 Seawater + Sand Mixture 39.7 SC-3 2 Dec 2014 /1005 Seawater + Sand Mixture 48.1 SC-4 2 Dec 2014 /1010 Seawater + Sand Mixture 68.6 SC-5 2 Dec 2014 /1015 Seawater + Sand Mixture 83.2 SC-6 2 Dec 2014 /1020 Seawater + Sand Mixture 99.4 SC-7 2 Dec 2014 /1025 Seawater + Sand Mixture 110 SC-8 2 Dec 2014 /1030 Seawater + Sand Mixture 124.8 SC-9 2 Dec 2014 /1035 Seawater + Sand Mixture 133.2 SC-10 2 Dec 2014 /1040 Seawater + Sand Mixture 154.9 SC-11 2 Dec 2014 /1045

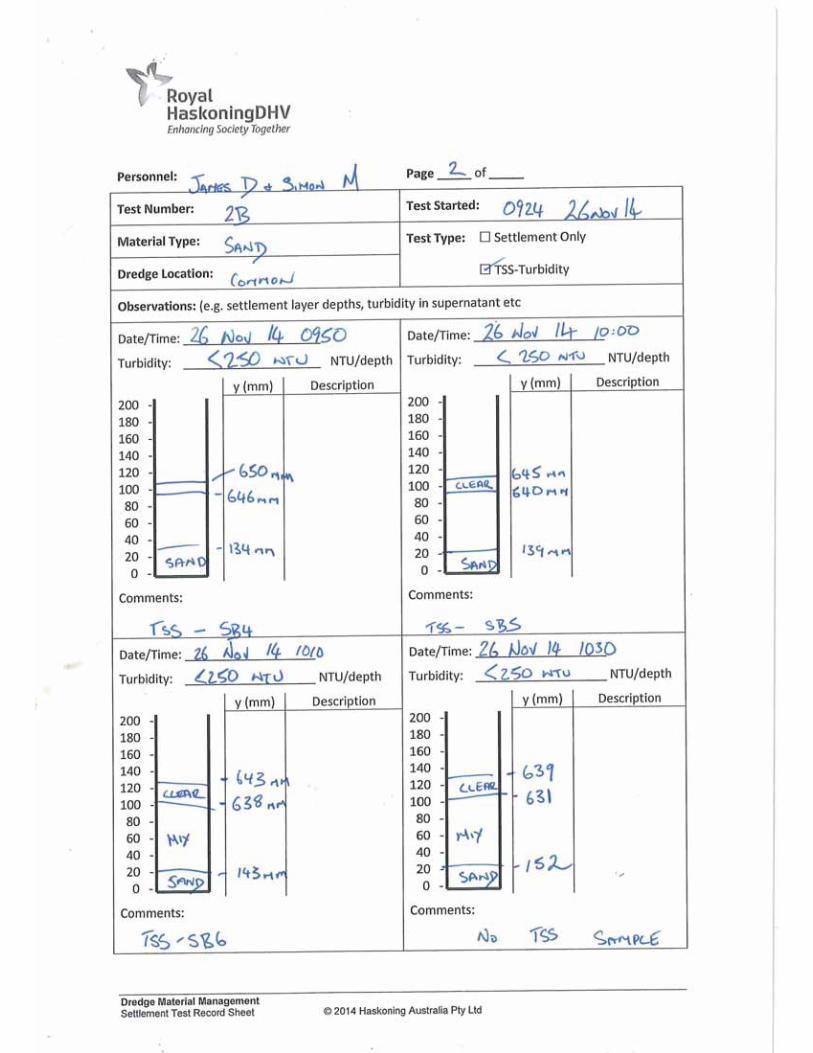


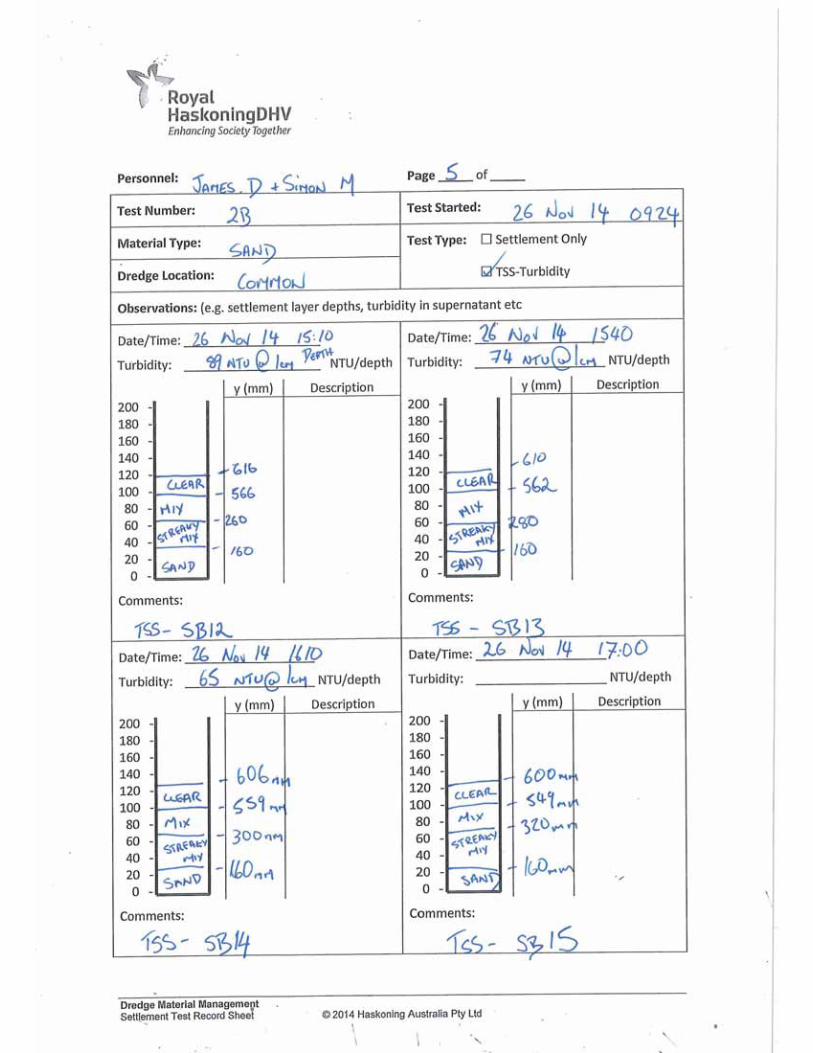

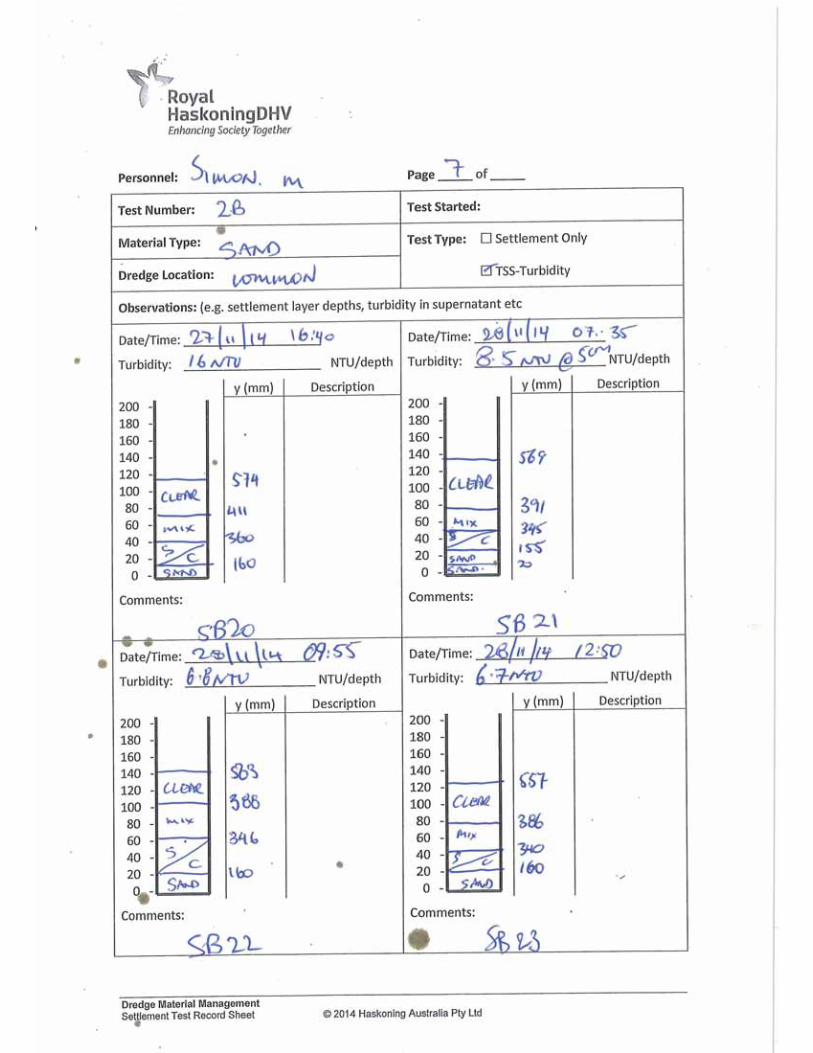


Settlement Testing HAS-CEP0-HY-REP-0030 Final Working Draft (Revision 0) © 2015 Haskoning Australia Pty Ltd March 2015
APPENDIX J TSS-Turbidity Test Sheets – Soft Silty Clays

Settlement Testing HAS-CEP0-HY-REP-0030 Final Working Draft (Revision 0) © 2015 Haskoning Australia Pty Ltd March 2015
Table J1: Turbidity measurements and sampling information – soft silty clays (Dilution Test)
Test Material Turbidity (NTU) TSS Sample Date / Time
Seawater 3.6 No Sample - See Sample SC-1 2 Dec 2014 /1320
Seawater + Mud Mixture 17.3 MC-1 2 Dec 2014 /1330 Seawater + Mud Mixture 25.2 MC-2 2 Dec 2014 /1334 Seawater + Mud Mixture 36.4 MC-3 2 Dec 2014 /1336 Seawater + Mud Mixture 44.5 MC-4 2 Dec 2014 /1339 Seawater + Mud Mixture 59.8 MC-5 2 Dec 2014 /1342 Seawater + Mud Mixture 80.4 MC-6 2 Dec 2014 /1346 Seawater + Mud Mixture 91 MC-7 2 Dec 2014 /1350 Seawater + Mud Mixture 102.6 MC-8 2 Dec 2014 /1353 Seawater + Mud Mixture 118.9 MC-9 2 Dec 2014 /1357 Seawater + Mud Mixture 140 MC-10 2 Dec 2014 /1400 Seawater + Mud Mixture 153.7 MC-11 2 Dec 2014 /1402
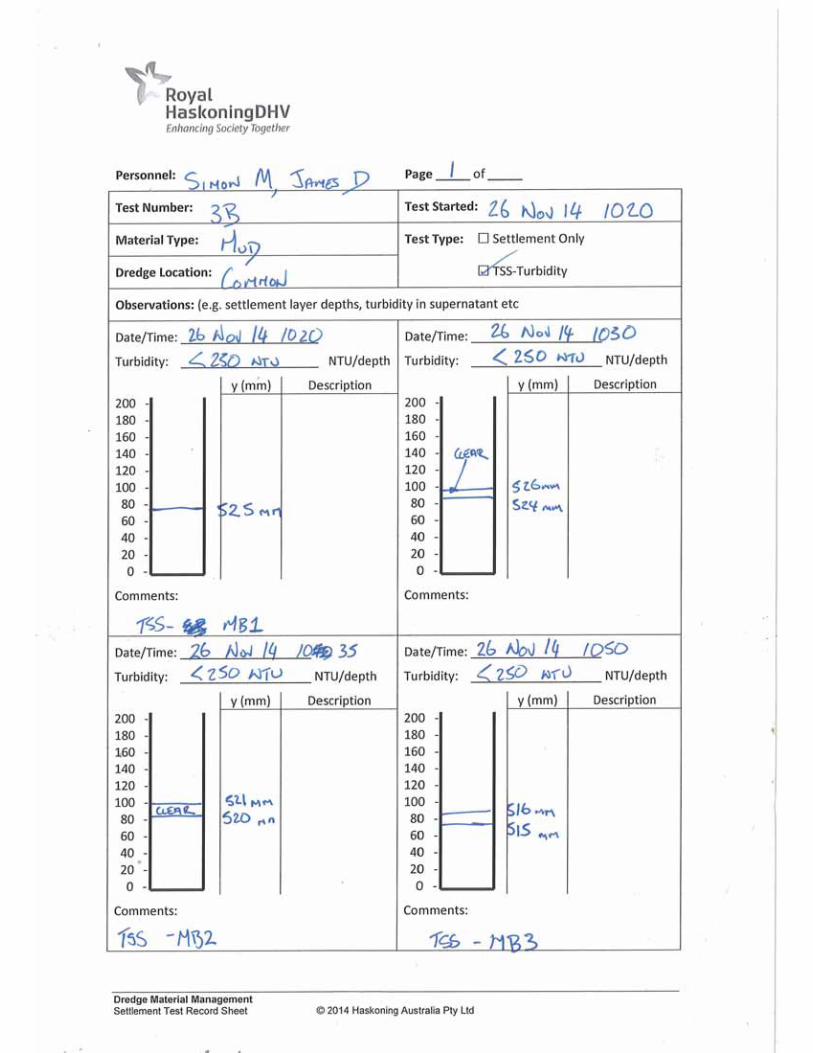


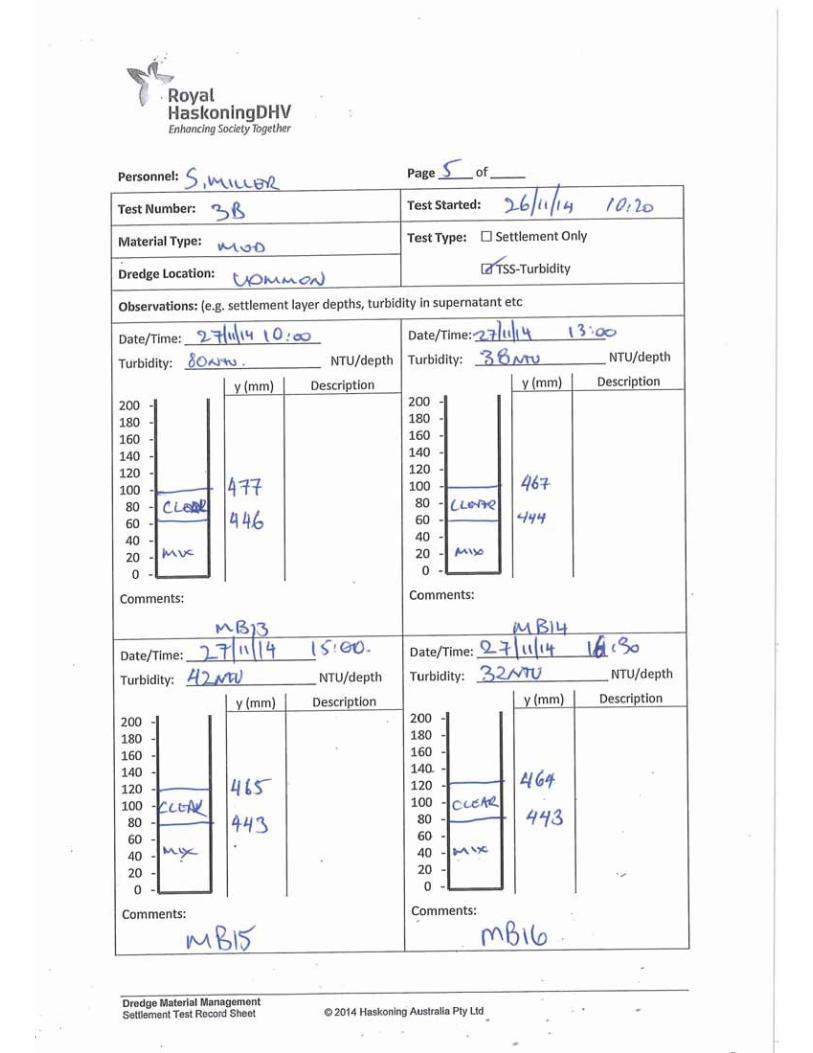


Settlement Testing HAS-CEP0-HY-REP-0030 Final Working Draft (Revision 0) © 2015 Haskoning Australia Pty Ltd March 2015
APPENDIX K TSS-Turbidity Test Sheets – ‘Representative’
Sand/Clay Material

Settlement Testing HAS-CEP0-HY-REP-0030 Final Working Draft (Revision 0) © 2015 Haskoning Australia Pty Ltd March 2015
Table K1: Turbidity measurements and sampling information – ‘representative’ sand/clay material (Dilution Test)
Test Material Turbidity (NTU) TSS Sample
Seawater 3.6 No Sample - See Sample SC-1
Seawater + sand/clay Mixture 10.7 SSC-1 Seawater + sand/clay Mixture 14.5 SSC -2 Seawater + sand/clay Mixture 23 SSC -3 Seawater + sand/clay Mixture 32 SSC -4 Seawater + sand/clay Mixture 44 SSC -5 Seawater + sand/clay Mixture 64 SSC -6 Seawater + sand/clay Mixture 83 SSC -7 Seawater + sand/clay Mixture 104 SSC -8 Seawater + sand/clay Mixture 130 SSC -9 Seawater + sand/clay Mixture 156 SSC -10 Seawater + sand/clay Mixture 185 SSC -11 Seawater + sand/clay Mixture 216 SSC -12 Seawater + sand/clay Mixture 248 SSC -13