port phillip and westernport catchment …
TRANSCRIPT

PORT PHILLIP AND WESTERNPORTCATCHMENT MANAGEMENT AUTHORITY
PO Box 48 Frankston Vic 3199Phone: (03) 9785 0183 Fax: 9773 6521
Website: www.ppwcma.vic.gov.au

Foreword 3
Water Target WT1 - Water Consumption 4
Water Target WT2 - Recycled Water 6
Water Target WT3 - Diversions from Waterways 8
Water Target WT11 - Groundwater Extractions 11
Water Target WT20 - Beaches 13
Land Target LT2 - Salinity 17
Land Target LT4 - Weeds 20
Land Target LT5 - Rabbits 23
Land Target LT10 - Parks 28
Biodiversity Targets BT1 - Extent of Native Vegetation 32
Biodiversty Target BT5 - Threatened Species 35
Biodiverstiy Target BT8 - Seagrass and Marine Habitats 37
People and Organisations Target PT3 - Links with Local Government 41
People and Organisations Target PT5 - Community Groups 45
People and Organisations Target PT6 - Community Awareness 49
Some other Activities around the region 51
Table of Contents
Port Phillip and Western Port Catchment Condition Report 2005/06 1

2 Port Phillip and Western Port Catchment Condition Report 2005/06
Port Phillip and Westernport Catchment Management Authority2005/06 Catchment Condition Report
October 2006
ISBN 0 9757375 4 6
This publication may be of assistance to you but the Port Phillipand Westernport Catchment Management Authority (PPWCMA),its Board and its employees do not guarantee that the publicationis without fl aw of any kind or is wholly appropriate for yourparticular purposes. The PPWCMA therefore disclaims all liabilityfor any error, loss or other consequence, which may arise fromyou relying on any information in this publication.
Acknowledgments
The PPWCMA gratefully acknowledges the work of its Monitoring, Evaluation and ReportingCoordinator, Janty Taylor, in preparing this Catchment Condition Report.
The PPWCMA would like to express its appreciation to the state government agencies, water authorities, localgovernments, non-government organisations and community groups who contributed data andanalysis to this Catchment Condition Report.
Photographic credits:Cover image courtesy Bayside City CouncilFrankston beach, Frankston Swim and Frankston Sea Festival photographs courtesy Frankston City CouncilClean Beach Challenge and Balnarring beach photographs courtesy by Keep Australia BeautifulSalinity images courtesy Department of Primary IndustriesRabbit images courtesy Department of Primary Industries.Helmeted Honeyeater images courtesy Iain Stych, Wildlife Project Supervisor with Healesville Sanctuary.Seagrass and mangrove images courtesy the Department of Primary Industries, Guy Werner, and Dr Tim Ealey,Westernport Seagrass PartnershipPark survey photos courtesy Victorian National Parks AssociationGroundwater drill photos courtesy Glenn Berry, Atma Environmental
Designed and Printed by: Docklands Group
This document, the related 2005/06 Annual Report and the Port Phillip and Western Port Regional CatchmentStrategy can be obtained by contacting the Port Phillip and Westernport Catchment Management Authority,Tel: 03 9785 0183. They are also available for electronic download on the PPWCMA website – www.ppwcma.vic.gov.au

Port Phillip and Western Port Catchment Condition Report 2005/06 3
One of the principal responsibilities of the Port Phillip and WesternportCatchment Management Authority (PPWCMA) is to report annually toGovernment and the community on the condition of the catchmentassets in the region.
Previously, in the absence of an agreed statewide standard reporting framework, thePPWCMA used a broad set of indicators and interim targets for reporting against each year. These indicators and targets were related to the major issues of concern in the region, such as salinity, native vegetation, water quality, pest species, etc.
With the accreditation and launch of the Port Phillip and Western Port RegionalCatchment Strategy in December 2004, the PPWCMA is now able to report oncatchment condition in a more structured manner.
The strategy has established a series of 55 Targets. Changes to the condition ofcatchment resources can be assessed against these Targets, and the progress ofimplementation of the strategy can be measured and reported.
It has not been possible to report against each of the strategy’s 55 Targets this yeardue in part to the lack of suffi cient data available for many Targets at this time.Therefore a detailed assessment of actions and programs contributing toimplementation of the strategy has been carried out for a selection of 15 Targets. These Targets were taken from across the four distinct but inter-related catchment asset classes identifi ed in the strategy:
● Water (covering quality, health and protection of surface waters, groundwater, wetlands, coastal environments and estuaries, bays and seas) ● Land (incorporating urban spread, rural productivity and health, and public land use and health) ● Biodiversity (focussing on terrestrial and aquatic fl ora and fauna protection and enhancement) ● People and Organisations (dealing with investment by and engagement of organisations and the community).
It is important to recognise that change in the condition of natural assets is often a slow process. The PPWCMA is attempting to assess these changes in a highly complex region, where the impacts from expanding populations and increasingly intensive agriculture andhorticulture will continue to infl uence catchment condition.
The following “Port Phillip and Western Port 2005/06 Catchment Condition Report” is the second in an annual series designed to review progress towards achieving the Targets of the Regional Catchment Strategy. The information presented illustrates a selection of the many programs and activities undertaken by natural resource management organisations in the Port Phillip and Western Port region.
Forward

Water Consumption - Water Target WT1
In the Drink
Potable (drinking-quality) water is one of the world’s mostvaluable resources. Melbourne is fortunate to enjoy high quality potable water sourced from several closed catchments located in the Upper Yarra ranges and open catchments located in the north of the region.
However the pressure on our potable water resources isincreasing. Growing urban populations combined with lowrainfalls over recent years have reduced the region’s waterstorages to record low levels. Melbourne could experience a water supply shortfall within the next 15 years if measures to reduce water usage are not taken immediately.
The Port Phillip and Westernport Regional Catchment Strategy recognises the need for water conservation to meet future needs and to maintain the health of the region’s rivers, wetlands and estuaries. Achieving the target of reducing the per capita use of potable water by 15 per cent will be pursued through a range of water conservation programs under the Victorian Government’s Our Water Our Future initiative.
4 Port Phillip and Western Port Catchment Condition Report 2005/06
Target PPWCMA assessment of current condition
PPWCMA assessment of trend
Moderate Relatively StableAverage potable water consumption per person reduced by 15% by 2010 WT1
Condition and trend
Melbourne Water and the fi ve retail waterauthorities; Western Water, City West Water, Yarra Valley Water, South East Water andWesternport Water, are responsible forsupplying and monitoring potable wateruse in the region.
The draft Water Supply-Demand Strategy forMelbourne 2006–2055 has reported that the majority of water used in Melbourne (59 per cent) is for domestic purposes. Industry and agriculture accounted for 30 per cent of total use, 7 per cent was lost due to leakage and the remaining 4 per cent covered factors such as fi refi ghting, theft and meter inaccuracies.
Melburnians used signifi cantly less water in 2005/06 than in the 1990s. However, in 2005/06 Western Water, Yarra Valley Water and Westernport Water reported small increases in potable water consumption per person compared to the previous year. An increase in drinking water consumption by Western Water customers appeared to be due to the lift of Stage 2 restrictions across the region during the later part of the previous year. City West Water and South-East Water reported declining per-capita water use.
Water Authority 2004/05 2005/06 % change
Western Water 262 274 4.6% increase # City West Water 202 200 0.8% decrease Yarra Valley Water 202 208 3% increase South East Water 310 304 2% decrease Westernport Water 242 272 12% increase
Table 1: Average potable water use (litres per person per day)# - includes commercial and domestic water usage
Figure 1: Average potable water use
2004/05 2005/06 2006/07 2008/09 2009/10
5 0 0
4 0 0
3 0 0
2 0 0
1 0 0
0Aver
age
litre
s pe
r pe
rson
per
day Example of trend needed to achieve target Western Water
City West Water Yarra Valley Water
South East Water Westernport Water

Port Phillip and Western Port Catchment Condition Report 2005/06 3 Port Phillip and Western Port Catchment Condition Report 2005/06 5
Actions in 2005/06
Permanent Water Saving Rules
A series of fi ve permanent water saving rules were introducedin 2005 by the Victorian Government. Designed to achievelong-term water savings, the rules are mainly aimed at moderating water use in activities outside the home, such as watering gardens and fi lling swimming pools.
Tips on saving water
Water authorities provide information on water saving tips and conservation methods for domestic water use on their websites and in pamphlets. In addition, they outline the permanent water saving rules, rebate information and a range of water saving products available for purchase.
Water Smart Gardens and Homes Rebate Scheme
The Victorian Government has committed $10 million over the next four years to provide incentives for the purchase of AAA rated water-effi cient appliances and fi ttings such as washing machines and dishwashers, shower heads and dual-fl ush toilets. Rebates are also provided for the purchase of greywater reuse systems, rainwater tanks, high-pressure cleaning devices andgarden appliances such as drip watering systems and triggernozzles.
Alternative Water Sources
An important strategy to assist in the conservation of potablewater is to substitute storm water or treated recycled water for those purposes that can use water of a lesser quality, such as irrigation, toilet fl ushing and many industrial uses. The uses of stormwater and recycled water in the Port Phillip and Westernport region are vital parts of water conservation programs.
Rebates for Not-For-Profi t Organisations
In 2005/06, Not for Profi t organisations such as sporting clubs, aged care and nursing homes, religious organisations andpreschools and kindergartens were offered rebates for arange of water effi ciency improvements including : ● Water audits;● Retrofi tting of water effi cient shower roses;● Flow regulators or fl ow control valves;● Dual fl ush toilets;● Maintenance for leaking taps toilets and showers;● Purchase and installation of rain and/or soil moisture sensors.
Schools Education Program
Water - Learn it! Live it is a comprehensive water conservation and education program for Primary and Secondary Schools. Theprogram was developed to assist schools to actively implement water conservation and water education across the curriculum. The program brings water conservation opportunities to every school in Victoria while adding to initiatives already undertaken by the Department of Education and Training.
Corinella Aquifer
In the Sustainable Water Strategy for the Central Region, the State Government announced that it would grant an exploration licence to Westernport Water to explore the Corinella aquifer as a source of potable water

Recycled Water - Water Target WT2
6 Port Phillip and Western Port Catchment Condition Report 2005/06
Water authority Volume treated (ML) Volume reused (ML) % of total treated % change from 2004/05
Melbourne Water 299,481 *43,760 14.6% 3.3% increase
Western Water 7,452 5,820 78% 10% decrease
City West Water 5,500 0 0% No change
Yarra Valley Water 8,856 370 4.2% 2% increase
South East Water 11,365 2,103 18.5% 2.6% increase
Westernport Water 1,258 226 18% 2% increase
TOTAL 333,912 52,856 15.6% 2.4% increase
Table 2: Water recycling volumes in ML in the region in 2005/06. * Excludes fl ows for environmental management purposes at Western Treatment Plant
Overall, the trend in water recycling is improving across the region. The only exception to this trend occurred in the Western Water supply area. Western Water reported a 10 per cent decrease in the amount of water recycled by their customers; from 88 per cent of the total treated volume in 2004/05 to 78 per cent in 2005/06. This was due to lower than anticipated recycled water demand from a number of customers, due mainly to seasonal fl uctuations in demand. Western Water continues to pursue its long-term target of 100 per cent re-use.
Around we go again
The demand for water in the Port Phillip and Western Port region continues to increase, fuelled by population growth and the progressive shift from traditional broad-acre farming to intensive agriculture and horticulture.
One of the important mechanisms to assistwater conservation and reduce the demand for potable water is to increase the availability and acceptance of recycled water for appropriate uses such as in primary production, irrigating sporting reserves and gardens, industry and domestic uses via dual water supply schemes.
The Regional Catchment Strategy’s target forwater recycling is in line with the VictorianGovernment‘s goal for 20 per cent of the total volume of treated wastewater to be recycled by 2010.
Condition and Trend
Water is recycled and supplied through various schemes by Melbourne Water and the retail water supply companies, Western Water, City West Wa-ter, Yarra Valley Water, South East Waterand Westernport Water.
Table 2 shows that 333,912 ML of sewage was treated across the region in 2005/06 to produce recycled water. Of this, 52,856 ML or 15.6 per cent of the total was reused for various purposes, an increase of 2.4 per cent over the previous year. This trend is also illustrated in Figure 2
Target PPWCMA assessment of current condition
PPWCMA assessment of trend
Moderate ImprovingThe volume of recycled water used in the region increased to 20% of the total treated volume by 2010
WT2

Port Phillip and Western Port Catchment Condition Report 2005/06 7
Actions in 2005/06
In 2005/06, new recycling projects were developed by the water supply companies, with a number commencing supply ofrecycled water to open space areas in residential developments.
City West Water
City West Water, the Wyndham City Council, Melbourne Waterand residential housing developers are working together to deliver Class A recycled water from the Western Treatment Plant forgardens and toilet fl ushing in new housing estates in WestWerribee. The construction of a major transfer main is plannedfor this project to deliver recycled water by 2009.
City West Water is also investigating a number of projects toencourage water conservation and increase the use of recycled water in the Altona industrial zone, Flemington, Keilor and Princes Park areas. City West Water’s Water Conservation SolutionsProgram seeks to improve water use effi ciency among itscommercial and institutional customers by providing support materials, education, training and funding.
As part of the Werribbee Technology Precinct Recycled water project. City West Water is extending the Werribee Irrigation District pipeline to provide Class A recycled water to the Werribee Technology Precinct, Hoppers Crossing Pumping Station,Heathdale Christian College and open spaces and reserves inthe city of Wyndham. Project construction works are due to be completed by December 2006.
Project construction works were also undertaken to supply Class A recycled water from the Western Treatment Plant to MacKillop College. Supply to the College is due to commence in December 2006.
Western Water
Western Water operates seven wastewater treatment plants where waste water and licensed trade waste collected from domestic, commercial and industrial customers is treated. Of the total 5,820 ML of water recycled by Western Water in 2005/06, 607 ML was used in place of drinking water supplies. The Sunbury-Melton Recycled Water Scheme operated by Western Water was extended by 8 kilometres in 2005 to provide recycled water to the Toolern Vale area. The new supply main can carry up to 215ML of recycled water per day and is currently servicing 10 properties between Diggers Rest and Toolern Vale. Western Water, the Victorian Government and new customers jointly funded this project.
A two-kilometre extension of the Sunbury-Melton Recycled Water Scheme has also enabled supply of recycled water to SalesianCollege, Sunbury Secondary College and Hume City Council’s Clarke Oval recreation reserves in Sunbury. The project will substitute 44 ML of drinking water a year and deliver signifi cant community benefi ts.
Yarra Valley Water
Yarra Valley Water’s major recycling project is the AuroraDevelopment in Epping North. The Aurora development is planned to begin receiving Class A recycled water in 2008. The scheme will ultimately service a residential development of 8,500 homes.
Yarra Valley Water has also commenced operation of the Wallan irrigation schemes, which have the potential to recycleapproximately 400 ML of water each year.
Melbourne Water
Melbourne Water’s Western Treatment Plant produces largevolumes of Class A and Class C recycled water. Class C water is used on-site to maintain wildlife habitats and for pastureirrigation to support livestock in areas that have historically been used for sewage treatment via land fi ltration. Work is continuing to increase the uptake of Class A Recycled Water supplied off-site, through Southern Rural Water, to market gardens in the Werribee Irrigation District and recreational sites in the Werribee Tourist Precinct. The Department of Primary Industries is conductinginvestigative trials using various water sources similar to those supplied to the Werribee Irrigation District. These trials are focusing on issues such as salinity, sodicity, productivity and land capability.
The Eastern Treatment Plant supplies Class C recycled water to customers (via South East Water) along the South East Outfall, the 56km discharge pipeline to Bass Strait. Class C recycled water is also supplied to TopAq, a private company and subsidiary of EarthTech, which further treats the water with an ultrafi ltration membrane plant to Class A standard for distribution to the Eastern Irrigation Scheme.
2 5 %
2 0 %
1 5 %
1 0 %
5 %
0 %2002/03 2003/04 2004/05 2005/06 2006/7 2007/08 2008/09 2009/10
% of treated water re-used Trend needed to achieve target
1 1 %1 3 . 2 %
1 5 . 6 %
2 0 %
Figure 2: Reuse of treated water

Diversions from Waterways - Water Target WT3
Target PPWCMA assessment of current condition
PPWCMA assessment of trend
Moderate ImprovingDiversions from all waterways to be within sustainable limits by 2015WT3
Water sometimes fl ows uphill
Not all of the Port Phillip and Western Port region’s water needs are met by the potable water supply system. Water is also di-verted directly from rivers and streams to supplement the needs of communities for irrigation, stock watering anddomestic purposes.
The Regional Catchment Strategy recognises that to sustainably produce water to meet the economic, environmental and social needs of the region, our rivers must be maintained in a healthy condition. Therefore, careful management of diversions isnecessary to ensure the hydrological fl ow needs of the waterways themselves are met. This requires the management of extractions from waterways to ensure they are withinpre-determined sustainable limits. Target WT3 is concernedwith the long-term sustainability of waterways through the management of diversions taken from them.
Monitoring
Melbourne Water and Southern Rural Water manage the licensing of diversions fromwaterways within the Port Phillip and Western Port region.
Melbourne Water is rolling out a meterinstallation program to monitor the volumes of water taken by diverters with licences for annual volumes of fi ve megalitres or greater. Around 500 meters have now been installed and the program is on-track for completion by mid 2007.
Southern Rural Water has had a user-funded metering program in place since 2002. All commercial extractions (including transfers of licensed volume) approved since then have been metered. Southern Rural Water has made a commitment to meter all existing signifi cant usage by mid 2007.
Condition and Trend
Within the part of the region wherediversions are managed by Melbourne Water, 20 waterways have previously been identifi ed as requiring improved diversion management because of the threat to waterway health posed by diversions.
8 Port Phillip and Western Port Catchment Condition Report 2005/06

Now, all 20 of these waterways are managed to withinsustainable diversion limits through the development andimplementation of a range of management instruments including Bulk Water Entitlements, Stream Flow Management Plans, Local Management Rules and Drought Response Plans.
Melbourne Water is also in the process of developing Stream Flow Management Plans to improve the management of diversion for three other priority waterways within the region.
Table 3 summarises the status of environmental fl ows andmanagement tools for these waterways.
Actions in 2005/06
Diversion Limits
The Victorian Government’s White Paper on water, Securing Our Water Future Together, has placed a moratorium on any further diversions from waterways in the Yarra, Werribee, Bunyip and Maribyrnong basin catchments in recognition that the system has already reached its limits for sustainable diversions.
Drought Response Plan
This plan was established by Melbourne Water to providesecurity for environmental fl ows in times of drought or lowrainfall while ensuring equity of access to water for irrigators. Minimum environmental fl ows are identifi ed for waterways and when fl ows reach a defi ned trigger level, extractions from affected waterways are restricted or banned to ensure environmental fl ows are maintained.
Environmental fl ow studies and reserves
Studies of environmental fl ow requirements have now been completed for the Yarra, Maribyrnong and Werribee Rivers and are at an advanced stage for the Tarago and Bunyip Rivers. These studies have resulted in signifi cant improvements in the security and value of environmental fl ows for the Yarra, Maribyrnong and Werribee Rivers which will shortly have legal entitlements toannual environmental fl ows of 20GL, 3GL and 6GL respectively. Environmental fl ows for the Yarra were previously determined only by the need to meet minimum daily fl ows at Yering Gorge and Millgrove. These requirements did not mimic natural variable stream fl ow patterns which have important ecological and stream channel maintenance functions. The new arrangements propose to reserve 17GL in Melbourne Water’s storages to provide these fl ow variations.
Stream Flow Management Plans
Stream Flow Management Plans are developed in closeconsultation with relevant stakeholders, including water diverters. They are used to defi ne how waters in unregulated catchments will be shared between the environment and water users. The plans recognise the needs of licensed water users whilstmaintaining or improving waterway health by protecting or improving minimum and fl ood fl ows for the environment during the year. The Victorian Government’s Securing Our Water Future Together document lists 21 priority waterways for which Stream Flow Management Plans will be developed to improveenvironmental fl ows. Of these, nine are located in the Port Phillip and Westernport region.
Port Phillip and Western Port Catchment Condition Report 2005/06 9

10 Port Phillip and Western Port Catchment Condition Report 2005/06
Catchment Environmental fl ows in place Current management tool Status
Arundel Creek Yes Drought Response Plan Approved
Brushy Creek Yes Drought Response Plan Approved
Darebin Creek Yes Local Management Rules Approved
Diamond Creek Yes Stream Flow Management Plan Approved
Don River Yes Drought Response Plan. Stream Flow Management In progress Plan process commenced
Gardiners Creek Yes Local Management Rules Approved
Hoddles Creek Yes Stream Flow Management Plan Approved
Little Yarra River Yes Drought Response Plan. Stream Flow In progress Management Plan process commenced
Maribyrnong River Yes Bulk Water Entitlement Granted
Merri Creek Yes Local Management Rules Approved
Moonee Ponds Creek Yes Local Management Rules Approved
Mullum Mullum Creek Yes Local Management Rules Approved
Olinda Creek Yes Drought Response Plan. Draft Stream Flow In progress Management Plan fi nalised
Plenty River Yes Drought Response Plan. Stream Flow In progress Management Plan awaiting approval.
Steels, Pauls and Yes Drought Response Plan. Draft Stream In progress Dixons Creeks Flow Management Plan fi nalised
Stringybark Creek Yes Drought Response Plan. Stream Flow In progress Management Plan consultations in progress.
Watsons Creek Yes Drought Response Plan Approved
Watts River Yes Drought Response Plan and Bulk Water Entitlement Draft
Woori Yallock Creek Yes Drought Response Plan. Stream Flow In progress Management Plan process commenced
Yarra River Yes State Environment Protection Policy Bulk water and Drought Response Plan. Bulk Water entitlements and environmental entitlement complete. in progress. Environmental fl ows completed
Werribee River Yes Bulk Water Entitlement Approved
Upper Maribyrnong Yes Diversion restrictions ensure fl ow. Stream Commencing in River Flow Management Plan to be developed 2006/07
Lerderderg River Yes Part of Werribee River Bulk Water Entitlement Approved
Table 3: Status of environmental fl ow management and regulatory mechanisms for priority diversion management waterways in the Port Phillip and Western Port region.
Melbourne Water has applied to the Minister for Water todeclare Water Supply Protection Areas for the Don River, Little Yarra River and Woori Yallock Creek as the fi rst stage in the development of Stream Flow Management Plans for these waterways. These plans are expected to be completed by 2009. Draft plans have been fi nalised for the Olinda, Pauls, Steels and Dixons Creeks while public consultations for the Stringybark Creek are at an advanced stage.
The Upper Maribyrnong River is currently an unregulated part of the region. Southern Rural Water has indicated that a Stream Flow Management Plan has been scheduled for development in 2006/07.
Local Management Rules
Melbourne Water has completed Local Management Rules for all six of the region’s waterways where the number of diverters and other uses are not as critical to waterway health. Each waterway has low-fl ow thresholds that trigger diversion rationing or bans. Diverters on these waterways and the general public can useMelbourne Water’s website to fi nd updated daily information about stream fl ows and diversion restrictions.

Well, Well, Well…
Groundwater is used throughout the region as a supplement or replacement to potable water from the reticulated system and diversions from waterways. It is used for a variety of domestic purposes, for stock watering, crop irrigation and limited industrial applications.
Groundwater is a fi nite resource and as such it is important to ensure it is used sustainably. The Regional Catchment Strategy’s Target WT11 highlights the importance of keepingextractions within defi ned limits to ensure the long-term sustainability of the region’s main aquifers.
Extractions from groundwater reserves are managed within a framework called Permissible Annual Volumes (PAV). These are a scientifi -cally based estimate of the average volume of groundwater that can be extracted from an aq-uifer on a yearly basis without exhausting the groundwater resource. Once licensed extrac-tions reach the permissible annual volume, no further allocations for extractions are allowed.
Condition and Trend
Within the Port Phillip and Western Port region, there are 11 Groundwater Management Areas.(Figure 3) Southern Rural Water manages the construction and licensing of bores andextraction of groundwater for ten of these areas while the eleventh, Kinglake, is managed by Goulburn Murray Water.
Target PPWCMA assessment of current condition
PPWCMA assessment of trend
Moderate Relatively stableAll groundwater extractions managed within set Permissible Annual Volumes by 2009 WT1
1
Groundwater Extractions - Water Target WT11
Only a small proportion of the Kinglake area is found in this region with the majority being in the Goulburn Broken catchment management region.
There are currently 1,710 licences for groundwater extraction in the region. Bores that are used solely for stock and domesticpurposes are exempt from groundwater extraction licensing requirements but are required to be registered.
Data supplied by Southern Rural Water indicate that themajority of aquifers within the region are managed at or below their respective permissible annual volume. Table 4 illustrates the total licensed volume for groundwater extraction (excluding stock and domestic use) for each groundwater management area in the region.
Port Phillip and Western Port Catchment Condition Report 2005/06 11

12 Port Phillip and Western Port Catchment Condition Report 2005/06
Figure 3: Groundwater management areas in the region
Table 4: Licensed allocations (excluding stock and domestic use) from Groundwater Management Areas within the Port Phillip and Western Port region.
Groundwater No. of licensed Licensed volume of Permissible Annual Allocations Proportion of Management bores extraction (ML) Volume (ML) within PAV? PAV allocated Area
Deutgam 263 5,100 2,400 No 212% of PAV
Cut Paw Paw 26 532 3,650 Yes 14% of PAV
Moorabbin 95 2,460 4,305 Yes 57% of PAV
Frankston 42 1,027 3,200 Yes 32% of PAV
Koo Wee Rup 567 12,943 13,550 Yes 95% of PAV
Nepean 141 6,013 5,000 No 120% of PAV
Corinella 16 108 2,550 Yes 4% of PAV
Merrimu 27 421 450 Yes 93% of PAV
Lancefi eld 36 1,363 1,485 Yes 91% of PAV
Wandin Yallock 452 2,923 3,300 Yes 88% of PAV
There are two Groundwater Management areas in which licensed allocations currently exceed the permissible annualvolume. At present the licensed allocations from the Deutgam area are 212 per cent of the permissible annual volume of 2,400 ML per year, while allocations in the Nepean area are 120 per cent of its permissible annual volume of 5,000 ML per year. In the Deutgam area, a program has been initiated to reduce groundwater extractions to a level less than the permissible annual volume. In the Nepean area, Southern Rural Water has commenced metering extractions for the most substantial groundwater users in this area. Data gathered suggests that while declining water levels are a threat to the aquifer, theyappear to be seasonal.
Data from Goulburn Murray Water indicates that the Kinglake area is managed below its respective permissible annualvolume, at approximately 48 per cent of the permissibleannual volume including stock and domestic use.
Actions in 2005/06
Monitoring of Bores
For groundwater management areas where groundwater is at serious risk of over use, Southern Rural Water conduct monitoring of the aquifer. When groundwater levels in the aquifer approach a pre-determined threshold, restrictions are put in place against groundwater pumping to allow the aquifer to recharge.
Southern Rural Water has been implementing a program for the metering of all active commercial bores in declared Water Supply Protection Areas (including Deutgam, Wandin Yallock and Koo Wee Rup). This has enabled groundwater usage in these areas to be quantifi ed for the fi rst time.
Data collected from monitoring bores in the Lancefi eld areaindicates that the actual level of groundwater extraction and use is lower than the rate of natural recharge for the aquifer.
In light of the recent water White Paper, Securing Our Water Future Together, Southern Rural Water is committed to metering and monitoring the remaining licensed commercial use by the end of 2007.
Goulburn Murray Water monitors both state observation bores and some private bores in the Kinglake area on a quarterly basis each year. Goulburn Murray Water is also committed tometering all currently un-metered licensed groundwater (>20ML) and surface water diversions (>10 ML) by November 2007.

Target PPWCMA assessment of current condition
PPWCMA assessment of trend
Healthy Relatively stableNumber of days where beaches are unsuitable for swimming reduced to zero by 2010 WT2
0
Beaches - Water Target WT20
Port Phillip and Western Port Catchment Condition Report 2005/06 13
Life’s a beach
High standards of water quality at beaches are not only important to the region’s community but are a good indicator of how well thecatchment and bay are being managed.
Beaches in the Port Phillip and WesternPort region generally have high natural conservation values and support recreational and leisure activities for the whole community including swimming, boating, fi shing andsightseeing. The high quality of water in Port Phillip Bay was on show for the world whenthe 1.5 km swimming leg of the men’s and women’s triathlon events for the Melbourne 2006 Commonwealth Games were both heldat St Kilda Beach in March 2006.
Monitoring
The Environment Protection Authority Victoria is the principal monitoring authority of beach water quality at Port Phillip Bay and Western Port beaches. Its monitoring activities aim to provide up to date information on water quality and enable beachgoers to make informeddecisions about visiting bay beaches.
Water quality objectives for primary contact recreation have been established by theEnvironment Protection Authority Victoria in the State Environment Protection Policy (Waters of Victoria).
Weekly assessments of beach water quality are made duringsummer by measuring levels of Enterococci bacteriacontamination. Enterococci are found in the intestinal tract of humans and warm-blooded animals and are a good indicator of water contamination that may cause disease.
Where bacteria levels reach a trigger point, a warning is issued against swimming and a more intense monitoring program isinitiated until water quality returns to safe levels.
From December 2005 to March 2006, as part of the Better Bays and Waterways water quality improvement plan, the EnvironmentProtection Authority Victoria conducted weekly water quality evaluations for 35 beaches in Port Phillip Bay and commenced a new monitoring program at 10 beaches in Western Port(Figure 4).
In addition to its weekly water quality monitoring program, the Environment Protection Authority Victoria also undertakes daily water quality forecasting. This is based on risk assessments using data on bacteriological history, predicted rainfall, cloud cover and recent monitoring results. The results of the weekly monitoring and daily risk assessments are published on the Environment Protection Authority Victoria website and in the metropolitan dailynewspapers. Beach water quality ratings established by theEnvironment Protection Authority Victoria are:
Good Water quality is expected to be suitable for swimming
Water quality is expected to be generally Fair suitable for swimming but may be affected by stormwater
Poor Not recommended for swimming
Unacceptable A ‘no swimming’ advisory has been issued
14 Port Phillip and Western Port Catchment Condition Report 2005/06
A series of 12 fi xed sites in Port Phillip Bay and Western Port are also monitored for nutrients, dissolved oxygen and water clarity.
Water quality monitoring is complemented by litter surveys. Keep Australia Beautiful has been commissioned by the Environment Protection Authority Victoria since 1999 to monitor and report on the quantity and types of visible litter on our beaches.
Condition and Trend
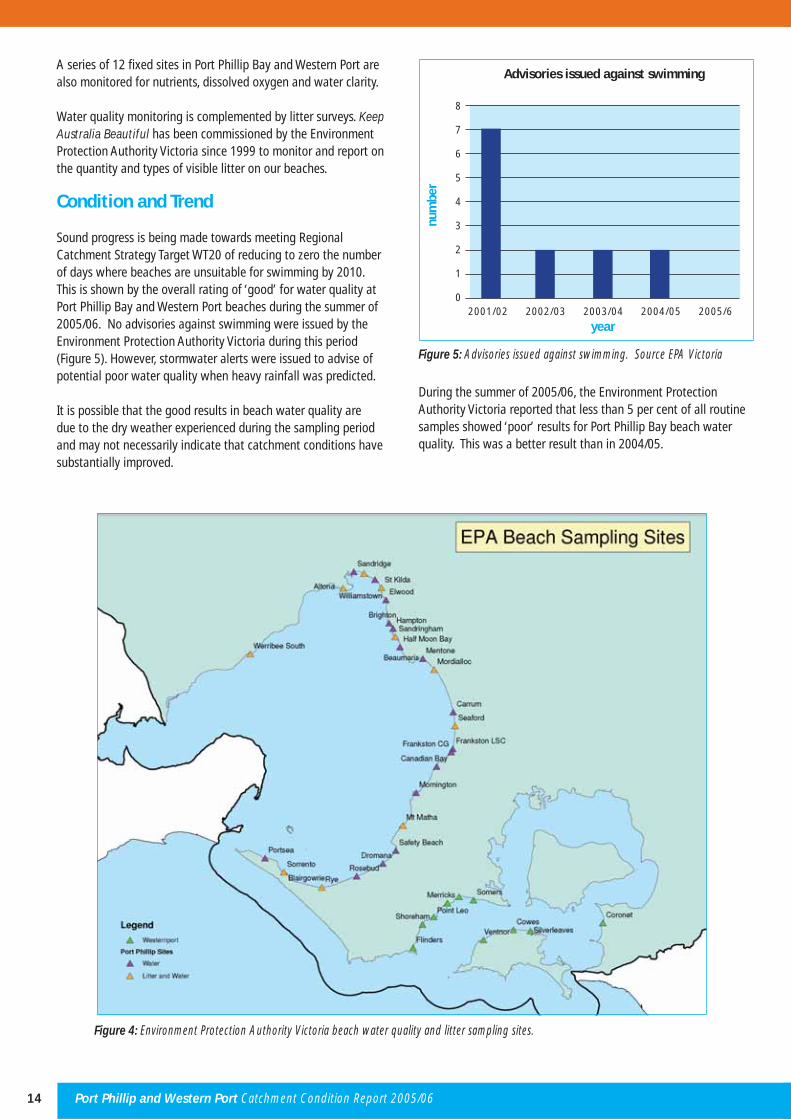
Sound progress is being made towards meeting RegionalCatchment Strategy Target WT20 of reducing to zero the number of days where beaches are unsuitable for swimming by 2010. This is shown by the overall rating of ‘good’ for water quality at Port Phillip Bay and Western Port beaches during the summer of 2005/06. No advisories against swimming were issued by theEnvironment Protection Authority Victoria during this period (Figure 5). However, stormwater alerts were issued to advise of potential poor water quality when heavy rainfall was predicted.
It is possible that the good results in beach water quality are due to the dry weather experienced during the sampling period and may not necessarily indicate that catchment conditions have substantially improved.
2001/02 2002/03 2003/04 2004/05 2005/6
8
7
6
5
4
3
2
1
0
num
ber
year
Advisories issued against swimming
During the summer of 2005/06, the Environment Protection Authority Victoria reported that less than 5 per cent of all routine samples showed ‘poor’ results for Port Phillip Bay beach water quality. This was a better result than in 2004/05.
Figure 5: Advisories issued against swimming. Source EPA Victoria
Figure 4: Environment Protection Authority Victoria beach water quality and litter sampling sites.

Port Phillip and Western Port Catchment Condition Report 2005/06 15
All samples taken from each of the 10 Western Port beaches over the summer period met the State environment protection policy objectives for primary contact recreation.
There was a reduction in the amount of litter surveyed in 2005/06 from the 7 year average on the 10 Port Phillip Bay beaches that form part of the Beach Litter Report; Williamstown, Werribee South, Sorrento, Rye, Mt Martha, Seaford, Mordialloc, Sandringham, St Kilda and Port Melbourne. St Kilda and Port Melbourne were the beaches with the most litter reported and Werribee South reported the least amount of litter during the surveys.
These studies show that cigarette butts continue to be the most common item of litter on Port Phillip Bay beaches.
Actions in 2005/06
Better Bays and Waterways
The Regional Water Quality Improvement Plan, Better Bays and Waterways, is being developed as a detailed action plan for water quality improvement and protection in the region’srivers, streams and bays. Funded by the Australian Government’s Coastal Catchments Initiative and jointly managed by Melbourne Water and the Environment Protection Authority Victoria, theproject was substantially advanced during 2005/06. The Better Bays and Waterways project will be a major response
to the Port Phillip Bay Environmental Management Plan target to reduce annual nitrogen discharges into Port Phillip Bay by 1,000 tonnes.
Components of the Better Bays and Waterways plan include:● the development of a sophisticated catchment model and decision support system;● a project to reduce nutrient pollution from hot-spot agricultural land-uses in the Yarra and Werribee catchments;● a study of the options to establish a nutrient offsets trading system;● a project to embed established water sensitive urban design practices in development planning regulations.
Western Treatment Plant Upgrade
Melbourne Water’s upgrade of the Western Treatment Plant at Werribee has exceeded its 500 tonne target for reduced annualnitrogen discharges to Port Phillip Bay. This is half the 1,000 tonne target for total nitrogen discharges to the bay required by the Port Phillip Bay Environmental Management Plan.
Urban Stormwater Management
As part of the Yarra Action Plan implementation, theDepartment of Sustainability and Environment allocated $20 million in 2005/06 to improve stormwater quality across the Yarra catchment. The program is expected to achieve fl ow-on effects

16 Port Phillip and Western Port Catchment Condition Report 2005/06
for water quality in Port Phillip Bay. The program provides funds to local governments to address priority problems identifi ed in Stormwater Management Plans and included specifi c works on priority problems in the lower Yarra.
Victorian Coastal Council Awards for Excellence 2005
The Victorian Coastal Awards for Excellence were established by the Victorian Coastal Council in conjunction with the CoastAction / Coastcare program. These awards acknowledgeoutstanding contributions to Victoria’s unique and diversemarine and coastal environments through efforts to improvethe ecosystems.
Clean Beach Challenge
Western Port’s Balnarring Beach was the winner of the Victorian 2006 Clean Beach Challenge. Conducted by Keep AustraliaBeautiful the awards encourage local governments andcommunities to work together on litter prevention, resource conservation, fauna and fl ora management activities and waste management.
Clean Up Australia Day - 5 March 2006
Clean Up Australia conducted its annual community participation activity to clean up many public areas including beaches andwaterways which assist in keeping the beaches in the region clean and free of litter.
Beach cleaning
Many bayside Councils conduct regular beach cleaning to rake and sieve sand. This prevents litter and maintains the aesthetic quality of beaches.
Bin it or Swim in it
The Association of Bayside Municipalities conducts the “Bin it or Swim in it” campaign to promote awareness of the litter that fi nds its way from gutters and roadways to the beach. This campaign has included media coverage, the distribution of ‘Butts Out’ personal ash trays and promotional material distributed to beach users and at Life Saving Clubs, kiosks and cafes.
Target PPWCMA assessment of current condition
PPWCMA assessment of trend
Moderate Relatively stableNo more than a 10% increase from 2004 levels in the area with shallow watertables (< 2 m) and the area of saline discharge
LT2
Salinity - Land Target LT2
Port Phillip and Western Port Catchment Condition Report 2005/06 17
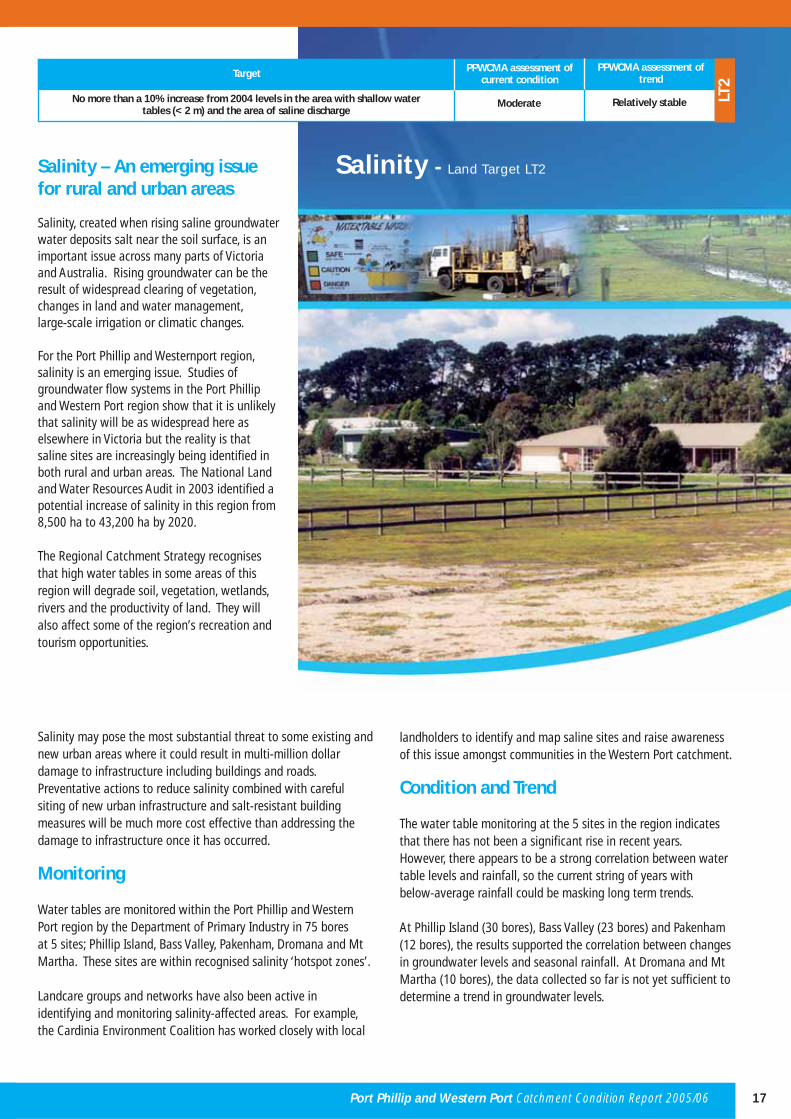
Salinity – An emerging issue for rural and urban areas
Salinity, created when rising saline groundwater water deposits salt near the soil surface, is an important issue across many parts of Victoria and Australia. Rising groundwater can be the result of widespread clearing of vegetation, changes in land and water management,large-scale irrigation or climatic changes.
For the Port Phillip and Westernport region,salinity is an emerging issue. Studies of groundwater fl ow systems in the Port Phillip and Western Port region show that it is unlikely that salinity will be as widespread here as elsewhere in Victoria but the reality is that saline sites are increasingly being identifi ed in both rural and urban areas. The National Land and Water Resources Audit in 2003 identifi ed a potential increase of salinity in this region from 8,500 ha to 43,200 ha by 2020.
The Regional Catchment Strategy recognises that high water tables in some areas of this region will degrade soil, vegetation, wetlands, rivers and the productivity of land. They will also affect some of the region’s recreation and tourism opportunities.
Salinity may pose the most substantial threat to some existing and new urban areas where it could result in multi-million dollardamage to infrastructure including buildings and roads. Preventative actions to reduce salinity combined with careful siting of new urban infrastructure and salt-resistant building measures will be much more cost effective than addressing the damage to infrastructure once it has occurred.
Monitoring
Water tables are monitored within the Port Phillip and Western Port region by the Department of Primary Industry in 75 boresat 5 sites; Phillip Island, Bass Valley, Pakenham, Dromana and Mt Martha. These sites are within recognised salinity ‘hotspot zones’.
Landcare groups and networks have also been active inidentifying and monitoring salinity-affected areas. For example, the Cardinia Environment Coalition has worked closely with local
landholders to identify and map saline sites and raise awareness of this issue amongst communities in the Western Port catchment.
Condition and Trend
The water table monitoring at the 5 sites in the region indicates that there has not been a signifi cant rise in recent years. However, there appears to be a strong correlation between water table levels and rainfall, so the current string of years withbelow-average rainfall could be masking long term trends.
At Phillip Island (30 bores), Bass Valley (23 bores) and Pakenham (12 bores), the results supported the correlation between changes in groundwater levels and seasonal rainfall. At Dromana and Mt Martha (10 bores), the data collected so far is not yet suffi cient to determine a trend in groundwater levels.

18 Port Phillip and Western Port Catchment Condition Report 2005/06
Actions in 2005/06
Port Phillip and Westernport Salinity Management Plan
In 2005/06, the Department of Primary Industries and thePort Phillip Catchment Management Authority further progressed the Port Phillip and Westernport Salinity Management Plan. The plan will prescribe the priority actions required to prevent and manage salinity in each of the region’s 14 salinity management zones (Figure 6) and the likely costs of these actions.
It will particularly focus on addressing the threats to urban infrastructure and agricultural production.
The plan’s actions will include:● Local scale research, modelling and mapping of groundwater processes;● Prioritising areas and assets that are threatened by salinity;● Implementing programs, tailored to rural and urban areas, to prevent and address salinity;● Ensuring salinity is appropriately considered in urban and rural planning schemes;● Using the knowledge and skills of local stakeholders, including councils and community groups, to develop local salinity management programs;● Appropriate monitoring and accessible reporting programs.
Review of monitoring program
The Department of Primary Industries has begun a review of its bore monitoring program with a view to improving theusefulness of data obtained. Currently the usefulness of data is variable between the areas due to the age and condition of the bores and changes in the local land use. Initial directions from the review include:● Undertaking a bore audit to ensure information collected is accurate● Extending the network of bores● Installation of bores in tree plantation areas.
Salinity Alert!
In 2005/06, the Cardinia Environment Coalition received National Landcare Program funds to implement the Pakenham/Bunyip Hotspot Integrated Action Project in the northern foothills of the Bunyip River. This coalition of nine Landcare groups and the Cardinia and Baw Baw Shire Councils conducted the project, providing incentives and technical assistance to landholders to undertake remedial actions such as fencing off saline areas and revegetation of salinity recharge and discharge sites. Activities included the planting of 4,800 indigenous species plants. Associated benefi ts from works undertaken in this projectincluded pasture protection, erosion control and enhancedhabitat for native species.

Port Phillip and Western Port Catchment Condition Report 2005/06 19
Sustainable Landuse Management and Planning
Salinity and land use management practices were the subject of a Sustainable Landscape Management and Planning project in 2005/06. The Department of Primary Industry undertook this $250,000 project, using Victorian and Australian Government funding, to develop and provide sustainable land management and salinity advice to agencies, Councils and community groups and landholders in the salinity hotspot zones. The project also included some mapping of salinity-affected areas and themaintenance of a database of regional salinity information.
Grow West
Grow West, a fl agship program of the PPWCMA, continues to address a range of immediate and long term land management issues, including salinity, in the salinity ‘hotspot zone’ nearBacchus Marsh. The program engages landholders andcommunity groups in undertaking improved land management, replanting and protecting native vegetation and establishing farm forestry plantations. Since 2002, landscape restoration has occurred on around 1,500 hectares including protection of eroded soils, native revegetation and plantations.
Figure 6: Salinity Management Zones in the Port Phillip and Western Port region.

Weeds - Land Target LT4
Weeds are everyone’s property
Weeds have a serious impact on the productivity of the agricultural sector and the integrity of the natural environment. While millions of dollars are spent each year by public and private landholders to control of weeds in the Port Phillip and Western Port region, it is not realistic to eradicate all established weed species. Effort is directed to maintaining control over high priority established species and eradicating ‘new and emerging’species before they become established and widespread.
Target LT4 of the Regional Catchment Strategy recognises the importance of this prioritised approach to weed control. In line with the Regional Weed Action Plan, the strategy provides for the control of ‘new and emerging’ weeds and ‘high priority established’ weed species through targeted investment and works.
Monitoring
Monitoring of weed species in the region is conducted by the Department of Primary Industries with site details and landholder informationrecorded in the Integrated Pest Management System database.
20 Port Phillip and Western Port Catchment Condition Report 2005/06
However, the monitoring program isinsuffi cient to provide systematic, region-wide trend analysis or to evaluate the success of control programs. For example, up-to-date information about many established species is not available. Similarly, monitoring of new andemerging weed species is not undertaken for the whole region and records of infestations are compiled only from inspections in priority areas.
On this basis, from a regional perspective there is insuffi cient monitoring being conducted to evaluate the success of weed control programs or to reliably plan future weed controlinvestments.
Aside from departmental monitoring, Council staff, contractors and community groups often provide information about weed infestations in public land conservation reserves,roadsides and this is used to support weedcontrol operations. However, Councils do not have the responsibility or resources toundertake and coordinate comprehensive weed monitoring across whole catchments andlandscapes. Parks Victoria also monitors weeds on the public lands under its jurisdiction. Weed monitoring and control programs were undertaken across 76 parks and public reserves in the region during 2005/06.
Target PPWCMA assessment of current condition
PPWCMA assessment of trend
Moderate Relatively stableNo establishment of ‘new and emerging’ weed species
Poor Relatively stableNo further spread of ‘high-priority established ‘weeds
LT4

Port Phillip and Western Port Catchment Condition Report 2005/06 21
Condition and trend
Available data indicates that some of the region’s high priority established species are being contained, namely serratedtussock (Table 5) and ragwort, though reliable records for otherestablished priority species do not exist. Key points of evidence include:● There are records of 4,271 properties in the region with infestations of serrated tussock covering approximately 114,000 hectares. ● While the density of serrated tussock across these properties is variable, only 9,693 hectares are recorded as having an infestation density greater than 50 per cent. ● Anecdotal evidence provided by offi cers from the Department of Primary Industries suggests that there has been a signifi cant reduction in the density of serrated tussock infestations across the region but the number of properties recorded as containing serrated tussock has not reduced markedly. ● Departmental offi cers also suggest that the density of ragwort has decreased signifi cantly within the last 5 years but the number of properties with Ragwort infestations has not decreased markedly.
2004 2005 2006
Properties with infestations (number) 4,084 4,171 4,271
Total area of infestation (hectares) 112,524 117,699 114,671
Density of infestations (hectares) High (>50%) 12,554 12,347 9,693
Medium (21-50%) 17,266 9,991 13,673
Low (1-20%) 70,299 84,350 77,466
Unspecifi ed 1,157 1,157 1,025
less than 1% 11,248 9,854 12,814
Table 5 : Serrated tussock infestations in the region. Source – Department of Primary Industries
Actions in 2005/06
Most weed control activities in the region are undertaken byindividual landholders and land managers on private and public lands. Government agencies, Councils and community groups undertake various programs and activities to assist thelandholders and to achieve coordination in weed control. Some of the activities occurring in 2005/06 are outlined below.
Tackling weeds on private and public land
“Tackling Weeds on Private Land” is a $9 million, three-year State Government initiative to encourage landowners to work together to manage weeds. It operates through the Department of Sustainability and Environment in a collaborative venture between governments, private land managers, hobby farmers and agricultural industry groups. The program recognises that all have a responsibility to control weeds.
A complementary program, the “Weeds and Pests on PublicLand” Initiative, is a $14 million, four-year Victorian Government
initiative for major weed and pest animal control programs inNational Parks, State Forest and other public land. It aims tocollaborate with public and private land managers to protectpublic areas with high-value natural assets and minimise the movement of weeds and pest animals between public andprivate land.
Weed Alert and Weed Spotter
The Victorian Weed Alert Rapid Response Plan for Victoria is a surveillance and response plan for potential new andemerging weeds in Victoria and is implemented by theDepartment of Primary Industries. Under this plan, theDepartment has a “Weed Alert” program to prevent theintroduction of pests or eradicate them when they do emerge. A “Weed Spotter” program is also being developed to provide a network of people across the region to detect new and emerging weeds. Weed Alert Contact Offi cers are also being specifi cally trained to identify and eradicate new and emerging weeds.
Weed control in parks
Parks Victoria completed weed control programs acrossapproximately 9,500 hectares in 2005/06. This work includedapproximately 2,150 hectares of control under the “GoodNeighbour” program. Eighty-one weed species were targeted including high priority species; serrated tussock (approximately 1,500 ha), blackberry (approximately 1,400 ha), Patersons curse (approximately 500ha), Chilean needle grass, spear thistle and Ragwort (approximately 400 ha each) and Boneseed(approximately 300 ha).
Markets and nurseries
The removal of noxious weeds from sale in markets and nurseries by the Department of Primary Industries has continued in 2005/06. horsetails, water hyacinth and salvinia have been commonsiezures.
Melbourne International Flower and Garden Show
A ‘Plant Advice Clinic’ was held at the Melbourne International Flower and Garden Show in Melbourne from 5th to 9th April 2006. The display was a joint event between the Nursery & Garden Industry Victoria and the Horticultural Media Association. Banners

22 Port Phillip and Western Port Catchment Condition Report 2005/06
advertising the problems associated with invasive garden plants were displayed. No State Prohibited weeds were found during inspection of trade and fl oral displays at the show. A total of 110,000 visitors attended the show, and feedback about the display was positive.
Grants to community groups
The Community Grants program of the PPWCMA funded projects by various community groups to continue their valuable work in weed eradication and control. For example:
● In the Western Port catchment, the Bass Integrated Pest Plant Animal Program of the Bass Coast Landcare Network targeted high priority established weeds including ragwort and sweet pittosporum plus 21 other weed species including blackberry, prickly pear, hawthorn and boneseed.
● The City of Casey’s Biodiversity Incentive Scheme provided $25,000 for weed removal to community groups. Groups including the Friends of Cardinia Creek Sanctuary, Friends of Rivergum Creek and Friends of Morning Mist carried out weed removal and revegetation.
● The Manningham Environmental Action Group in the Yarra catchment developed a Group Facilitator role to integrate weed and rabbit controls undertaken by the many groups within its network involved in protecting the biodiversity of the green wedge.
● Cardinia Hills Ragwort and Landcare Group received funding to facilitate the control and monitoring of ragwort and Paterson’s curse.
● Corinella Foreshore Committee undertook weed eradication of bridal creeper and blackberries on the Western Port shoreline.
Councils fi ghting weeds
Councils in the region implement a range of programs andmunicipality-specifi c strategies to target established and new and emerging weeds. These programs include rate rebates, education and awareness programs and incentive schemes to manage infestations.
For example:
● The Melton Shire Council targets serrated tussock, boxthorn, thistles and other weeds in a range of programs including roadside spraying, weed control on Council managed land and assistance for private properties. Large-scale weed reduction has been achieved through the Council’s Environmental Enhancement Policy. Total expenditure on weed control programs is in the order of $1.5 million per annum.
● The City of Casey conducts weed eradication programs, grant programs and funds community group activities, particularly targeting sweet pittosporum and blackberry infestations.
● The Wyndham City Council targets serrated tussock, Chilean needle grass and tiger pear through a rate rebate scheme, eradication programs and assistance for community group activities.
● The Shire of Yarra Ranges undertakes weed “blackspot”, bushland management, roadside and noxious weed programs involving mapping and partnerships with various agencies to target numerous weed species including ragwort, St Johns wort, St Peters wort, blackberry and Paterson’s curse.
● The Hume Shire Council has developed a “weed profi le” for its municipality showing trends in the occurrence of weeds based on data obtained from its Hume Farm (Weed Management) Rebate applications. Analysis is continuing on this data to gain a comprehensive understanding of weed population changes in the shire. Serrated tussock and needle grasses have been identifi ed as key indicator species to measure reduction in weed coverage and are a component of the Hume City Council “State of the Environment” Report.
● The Manningham City Council undertakes weed mapping and control activities focussing on blackberry, Paterson’s curse, Chilean needle grass, serrated tussock and gorse.
● The Nillumbik Shire Council has drafted a Weed Action Plan and undertakes roadside weed eradication programs and community support programs with an emphasis on serrated tussock and other noxious weeds.
Grow West
The Grow West program continues to establish extensive native vegetation plantings as part of the environmental regeneration of over 50,000 hectares of land between Bacchus Marsh and Ballan in the Werribee River catchment. The permanent tree cover will play a critical role in achieving long-term control of serratedtussock on non-arable steep escarpment and stony rise country.
Cooperative research
The Cooperative Research Centre for Australian WeedManagement works to reduce the risks posed by weedsthrough research, education and communication across Australia. It addresses the problems of weeds through assessment and evaluation of current weeds and potential new weeds,developing new technologies and techniques for farmers to reduce weed populations and communication of weed issues to the broader community.

Rabbits are down but not out
Rabbits are a damaging pest animal toenvironmental and economic assets and it is unlikely that they will ever be eradicated from the Port Phillip and Western Port region. The key to minimising their impact onenvironmental and economic values is to keep rabbit populations low and under control.
Private landholders and public landmanagers carry out most rabbit control works in the region. Coordination, monitoring and enforcement are provided by the Department of Primary Industries.
Target LT5 of the Regional Catchment Strategy requires the reduction of rabbit population densities to a level at which they can beclassifi ed as being “under long-term control”, where rabbits infl ict no measurable impact on land stability, productivity or biodiversity.
Monitoring
Limited monitoring of rabbit populations was undertaken by the Department of Primary Industries in 2005/06. Three sites covering approximately 94,000 hectares in the Werribee River catchment at Pentland Hills, Ingliston and Lancefi eld were monitored twice during the year.
Target PPWCMA assessment of current condition
PPWCMA assessment of trend
Moderate Declining ‘Long term’ rabbit control achieved on 400,000 ha of rural land by 2008 LT5
Rabbits - Land Target LT5
Condition and Trend
Anecdotal evidence suggests that rabbit populations havedecreased in recent years but appear to be rising again.
It is estimated that the area in the region in 2005/06 for whichrabbits are under long term control is similar, or perhaps less than, the 250,000 hectares estimated in 2004/05 and is only two-thirds of the target of 400,000 hectares. Figure 7 illustrates the areas of the region prone to rabbit infestation.
Actions in 2005/06
Departmental support for landholders
The Department of Primary Industries conducts a “Rabbit Free” program to acknowledge the signifi cant and continuingcommitment of landholders in the region to controlling infestations
of rabbits on private land. In this program, offi cers assess theland for rabbit infestations and develop an agreement with thelandholder to perform a combination of eradication methods.
The Department also conducts a program to provide rabbitbaits to landholders and community groups through a tightlycontrolled system. Specialised Departmental staff assess therequests for baits and provide technical advice to supportlandholders.
In 2005/06, the Department’s delivery of these rabbit-controlprograms was reduced as Departmental priorities shifted toassist the recovery from major bushfi res. However, a number of agreements were established with landowners in priority areas to guide on-ground works.
Port Phillip and Western Port Catchment Condition Report 2005/06 23

24 Port Phillip and Western Port Catchment Condition Report 2005/06
Table 6: Summary of 13 Local Government rabbit control programs in the Port Phillip and Western Port region in 2005/06
Community Grants
The PPWCMA Community Grants program provided a number of grants to community groups and Councils in 2005/06 thatcontributed to the control and management of rabbitpopulations. Projects funded which contributed to rabbitreduction included:
● Nillumbik Council received $15,000 funding to employ a Community Rabbit Control Facilitator
● The Manningham Environmental Action Group received $17,500 for pest plant and animal control.
● French Island Landcare Project – ‘Tankerton Creek and Beyond‘ – creating wildlife corridors between remnants.
● Macclesfi eld Landcare Group’s project to facilitate sustainable and better land management practices.
● WACMAC landcare networking – pest plant and animal control and revegetation.
Rabbit management in parks
Parks Victoria undertook pest animal programs targeting rabbits in 15 parks and reserves during 2005/06, treating approximately 1,500 hectares. The activities included rabbit eradication on 350 hectares as part of “Good Neighbour” programs and large con-trol programs in Woodlands Historic Park, Braeside Park, Plenty Gorge Parklands and Warrandyte State Park. The activities to control rabbits are designed to protect the native vegetationcommunities of the parks.
Council programs
A number of Councils in the region implement programs including provision of information to landholders, on-ground rabbit eradication works and grants to individuals and community groups to control the spread of rabbits (Table 6).
Council Activities and programs
Banyule Eradication activities are undertaken on Council-managed land and support is provided for community based rabbit action groups to undertake relevant activities on private land.
Bayside/Kingston Bayside undertakes rabbit control programs in conjunction with Kingston City Council.
Casey Support is provided to community groups to enable rabbit eradication and control activities.
Hobson’s Bay Activities to eradicate rabbits are focussed on important council-managed land including the Altona Coastal Park and Altona Explosives Reserve.
Hume The Council’s rabbit control program includes activities to remove harbours and lay baits on nine Council-managed reserves.
Manningham A Pest Plant and Animal Control program provides support to community groups and residents to target rabbits.
Melton The Pest Animal Program includes activities to control rabbit populations on council-managed land.
Mitchell A land management rebate program is available that includes a focus on the eradication and control of rabbits.
Moorabool The Council undertakes rabbit eradication activities on its reserves.
Nillumbik A Community Rabbit Control Facilitator is employed to support community groups in their rabbit control activities. The Council also undertakes rabbit control programs on Council reserves.
Wyndham The Council implements a rate rebate scheme that includes a focus on the eradication and control of rabbits. Rabbit eradication activities are also undertaken on Council reserves.
Yarra Ranges The Council undertakes and coordinates a range of rabbit eradication activities.

Port Phillip and Western Port Catchment Condition Report 2005/06 25
Figure 7: Zones prone to rabbit infestation in the Port Phillip and Western Port region.

26 Port Phillip and Western Port Catchment Condition Report 2005/06
WaterConsumption
RecycledWater
use
Diversionsfrom
waterwaysGround water
extractions Beaches
ModerateStable
ModerateImproving
HealthyStable
ModerateImproving
ModerateStable
WATER LAND
SalinityNew
WeedsRabbitcontrol
ModerateDeclining
ModerateStable
Established Weeds
ModerateStable
PoorStable
Par
ModeStab

Port Phillip and Western Port Catchment Condition Report 2005/06 27
PEOPLE AND ORGANISATIONS
Links withLocal Government
Community Groups
Community awareness
ModerateImproving
Moderate Stable
HealthyImproving
BIODIVERSITY
Extent ofNative Vegetation
ThreatenedSpecies
MarineHabitats
ModerateStable
PoorDeclining
Seagrass
PoorStable
PoorDeclining
rks
erateble

Parks - Land Target LT10
Target PPWCMA assessment of current condition
PPWCMA assessment of trend
Moderate Relatively stableIncrease the environmental quality of parks and other public land, and communitysatisfaction with these features
LT10
Ah, the serenity!
A feature of the Port Phillip and Western Port region is itsextensive array of parks, open space and scenic landscapes. The social and environmental benefi ts of these areas are many including conservation of natural areas, maintenance ofbiodiversity, protection of cultural and heritage values, provision of recreation and tourism opportunities, provision of amenity and landscape values, and assimilation of some waste products including carbon dioxide.
The Regional Catchment Strategy seeks the continued provision of parks and open spaces that are accessible to the community for a range of social and cultural purposes including recreation, heritage and tourism. Target LT10 provides two quantifi able measures of the values we place on our parks; their contribution to the region’s environmental quality and their contribution to the region’s social amenity via measures of visitor satisfaction.
Condition and trend
Monitoring the ‘State of the Parks’
Parks Victoria’s most recent records of visitor numbers show an estimated 118 million visits were made to parks and gardens in theMelbourne metropolitan area in 2004/05. Of this, 14.1 million visits (12 per cent) were made to major metropolitan parks, an increase from 13.5 million in 2001/02. The other 104.5million visits (88 per cent) were to other smaller parks and gardens around Melbourne.
Parks Victoria also monitors and reports onthe “State of the Parks”, surveying visitorsatisfaction and providing an assessment ofenvironmental quality and risks to parks throughout Victoria. The most recent visitor survey was conducted in 2004/05 where 60 to 100 visitors were interviewed in person at each of 50 sites in 34 parks across Victoria. The surveys were conducted in peak season and covered perceptions of scenery and the atmosphere plus practical aspects such as maintenance, signage, bins, camp grounds, play ground facilities, toilets and water.
The surveys indicated that Melbourne’s park users were generally satisfi ed with the services and facilities of Melbourne metropolitan parks. For major urban parks, the overall Satisfaction Index was 59.3 (out of 100) which was 9 less than the 2003 index of 68.3.
28 Port Phillip and Western Port Catchment Condition Report 2005/06

In these surveys, urban parks received high scores for themaintenance of tracks and paths and large areas of lawn, but received low scores for rangers providing supervision of visitor behaviour and park information. For parks on the urban fringe, the Satisfaction Index was 67.6, higher than the 2003 index of 64.3. Urban fringe parks received high scores for suffi cient and accessible toilets and adequate car parking, but low scores for suffi cient and accessible camp grounds and playground facilities.
ParksMates surveys
The Victorian National Parks Association has operated an active ParksMates program of surveying parks throughout Victoria since 2003. During 2005 and early 2006, teams of specially trained surveyors spent a total of 220 survey hours monitoring parkconditions in eight urban fringe parks in the east of the PortPhillip and Western Port region. The surveys resulted in a high level assessment of the quality of parks. The results of theprogram indicate an overall community satisfaction of thesedesignated parks and give an idea of the general level ofenjoyment to be found by park visitors in these areas.
The ParksMates survey looked at issues such as quality and clarity of interpretive signage and information boards, maps, satisfaction with tracks, picnic areas and other facilities, presence of pests and weeds and impacts from surrounding land use. The facilities given the highest levels of assessment were public amenities, walking tracks, car parks and picnic facilities. Lower levels of assessment were given to provision of signage and maps. Weeds and pest animals were detected throughout the parks but did not appear to lessen enjoyment by visitors.
Municipal surveys
Numerous Councils in the region also conducted surveys in 2005/06 that included questions about the communitysatisfaction and quality of parks and public land. The results gave insight into residents’ perceptions of the management of Council owned reserves and parks and provided suggestions for improved facilities. Key results from some of these surveys are listed in Table 7:
Council Key results from surveys
Banyule Respondents indicated “appearance of public areas” and “performance on sustainability and environment” were of adequate standardBayside Respondents provided an average rating of 59/100 for parks, 53/100 for bushlands and 48/100 for foreshore areasHume 97% of respondents considered management of weeds a high priority on council landMelbourne Respondents had an average satisfaction rating of 6 for parks (on a 7-point scale)Melton 66% of respondents expressed satisfaction with park facilities and 65% expressed satisfaction with park appearanceMoreland 80% of respondents expressed high satisfaction with the quality of parks and 72% expressed a need for improved maintenanceSouth Gippsland Respondents had an average satisfaction rating of 70% for parksWyndham 80% of respondents expressed satisfaction with parksYarra Ranges 80% of respondents had high levels of satisfaction regarding the quality of bushland reserve pathways and plants, while 60% expressed a need for more plants along pathways and for more shade and seating
Actions in 2005/06
New parks
The Victorian state budget announced in 2006 includes $13.3 million to establish new parks and $8 million to establish off-road bike trails in Melbourne. The new parks will cover over 1,000 hectares.
The parks at Werribee, Melton, Craigieburn and Point Gellibrand will preserve natural environments for local residents to enjoy and protect important areas from potential subdivisions anddevelopments. The land to be set aside for the parks haspreviously been leased for farming, or in private or Councilownership. The parks will transform these areas into attractive and accessible assets for local communities. Key features are:
● Werribee Regional Park. The public will be able to access this area and the banks of the Werribee River. Funding will be used to protect the environmental values of the area and build visitor facilities. The 230 hectare park will include a trail along the Werribee River, a pedestrian bridge to connect to the Werribee mansion precinct, an entrance road, carpark, playground and fencing. ● Merri Creek Parklands (Craigieburn). Funding will be used to establish visitor facilities, upgrade the Whittlesea Public Gardens and build a trail along the Merri Creek. The public will be able to enjoy a continuous 16 km walking and cycling track in areas between Craigieburn and the Western Ring Road previously closed to the public. Environmentally signifi cant grasslands will also be preserved within the boundaries of the 800 hectare park.● Melton Park. Land that is currently used as paddocks will be become a recreational park. Funding will be used to protect the environmental values of Toolern Creek and surrounds in a 100 hectare park. Visitor facilities, including an entrance road, a trail, a bridge over Toolern Creek and walking tracks will be established. ● Point Gellibrand Coastal Heritage Park. Funding will upgrade Battery Road, build a car park, restore the historic Anne Street. footbridge, provide interpretive signs and visitor facilities including shelters, picnic places, playground and toilet.
Table 7 Summary of results from surveys by some councils regarding community satisfaction of parks
Port Phillip and Western Port Catchment Condition Report 2005/06 29

30 Port Phillip and Western Port Catchment Condition Report 2005/06
Ongoing management of parks
Parks Victoria is responsible for the management of National, State, Regional and Metropolitan parks and conservation reserves.
The Natural Values Management Program of Parks Victoria includes a range of projects to improve the condition of parks in the region including pest plant and animal control, fi remanagement and threatened species management.
Parks Victoria conducts a Community Group Grants program to develop and support projects that are important to thecommunity and that benefi t Victoria’s parks. The program gives support to Friends Groups, volunteers and other community groups and grants are awarded for projects related to theenvironment, conservation, recreation, heritage, community awareness and multicultural support.
Marine National Parks and Sanctuaries
Parks Victoria has responsibility for the management of the region’s Marine National Parks and Marine Sanctuaries. Theseareas safeguard important marine habitats and species,signifi cant natural features, cultural heritage and aesthetic values (Figure 8).
Management plans are being progressively developed and implemented for each of the marine parks and sanctuaries in the Port Phillip and Western Port region. In 2005/06, plans were drafted for Point Cook Marine Sanctuary, Point Nepean National Park , Jawbone Marine Sanctuary, Yaringa Marine National Park, French Island Marine National Park and Churchill Island Marine National Park .
Council action
Council actions to enhance parks and recreation reserves in the region include:
● In 2006, Hobsons Bay City Council took top honours at the LGPro Awards for the Truganina Coastal Parklands project which transformed a former industrial wasteland into a regionally signifi cant coastal parkland for the whole community of over 300 hectares. The Council worked with local industry and community members and government agencies to develop the integrated coastal management project. The Council has also developed a Sport and Recreation Strategy Plan 2004-2007 to establish a new framework for the provision of sport and recreation resources. The plan includes initiatives to improve and extend the 38 active recreation reserves in Hobson’s Bay.
● Yarra City Council has developed a Draft Open Space Strategy to guide the future provision, planning, design and management of public open space in the city. The strategy incorporates environmental sustainability principles and seeks to protect indigenous values and improve the interface between open space and adjoining development.
● Casey City Council is enhancing its parks, playgrounds and reserves through initiatives in its development strategy C21 A vision for the future which will create new recreation facilities, sports and parklands reserves and quality passive parklands.
● Whitehorse City Council is developing an Open Space Strategy to guide the future direction for all publicly owned land that is used for recreation, passive outdoor enjoyment and nature conservation.
● Brimbank City Council is developing two parks in Brimbank; Buckingham Reserve in West Sunshine and The Lakes Reserve in Taylors Lakes. These two parks will be part of several areas in Brimbank designed for non-sporting recreation and to become focal points for the community.
● Glen Eira City Council has developed a management plan for parks on the Outer Circle Railway Line Corridor of Boyd Park, Springthorpe Gardens and Riley Reserve. It will provide a blueprint on the future of these parks and eliminate adhoc development as well as protecting remnant indigenous vegetation.
Living Links in the Dandenong Creek catchment
In 2006, the PPWCMA joined forces with the City of Greater Dandenong and Melbourne’s South East to develop and launch a Dandenong Creek Corridor Atlas. The atlas, part-funded by the Federal Department of Transport and Regional Services, identifi es the most signifi cant environmental and social assets, including wetlands, parks and vegetation, along the Dandenong Creek and scores and ranks the opportunities to improve each identifi ed asset.
The atlas is a fi rst step in a long-term Living Links program that seeks to improve the amenity and livability of the area byextending and linking existing parks, open space and ‘natural’ areas across the whole Dandenong Creek catchment. Living Links is also designed to implement the social amenity component of Melbourne’s South East Regional Economic Strategy, Prosperity for the next Generation and contribute to the Transit Citiesdevelopments and redevelopment of the Dandenong City Business District.

Port Phillip and Western Port Catchment Condition Report 2005/06 31
Figure 8: Marine Parks and Sanctuaries in Port Phillip and Western Port region .

Extent of Native Vegetation - Biodiversity Target BT1
Target PPWCMA assessment of current condition
PPWCMA assessment of trend
Poor DecliningThe total extent of indigenous vegetation increase to at least 35% of the region by 2030BT1
A depleted core
Target BT1 seeks an overall increase in native vegetation in the region from its existing 30 per cent towards 35 per cent by 2030. Attainment of this target will require determined protection and management of existing native vegetation, plus a further 40,000 hectares of revegetation above any losses. Protection of existing native vegetation will remain the top regional priority because retaining existing mature habitat is the most effi cient and cost effective way to support biodiversity.
Condition and trend
Our ability to monitor changes in native vegetation cover across the region is currently limited but will be considerably improved by the establishment of a central tracking system for vegetation clearing referrals and permits. This statewide system is planned to be launched by the Department of Sustainability andEnvironment at the end of 2007/08. Remote sensing
technology has also improved. A system that analyses aerial photographs to identify where there is a high likelihood that a given area contains native grassland and other vegetation types was successfully trialed during 2005/06. A similar system is being developed in theCorangamite region to identify wetlandvegetation.
Table 8 and Figure 9 summarise the extent of native vegetation across the region compared to estimates of its extent before 1750. The vegetation is shown within bioregions; areas with similar patterns of landscape, geology and climate. The summary is underpinned bymapping of ecological vegetation classes (a system of classifying native vegetation) onfreehold and public land at 1:100,000 and 1:25,000 scales that was completed across Victoria in 2003. Table 8 shows how much of the original vegetation remains in eachbioregion in the Port Phillip and Western Port region and, for each bioregion, how muchvegetation belongs to ecological vegetation classes that are considered to be endangered, vulnerable, depleted, rare or of least concern.
32 Port Phillip and Western Port Catchment Condition Report 2005/06
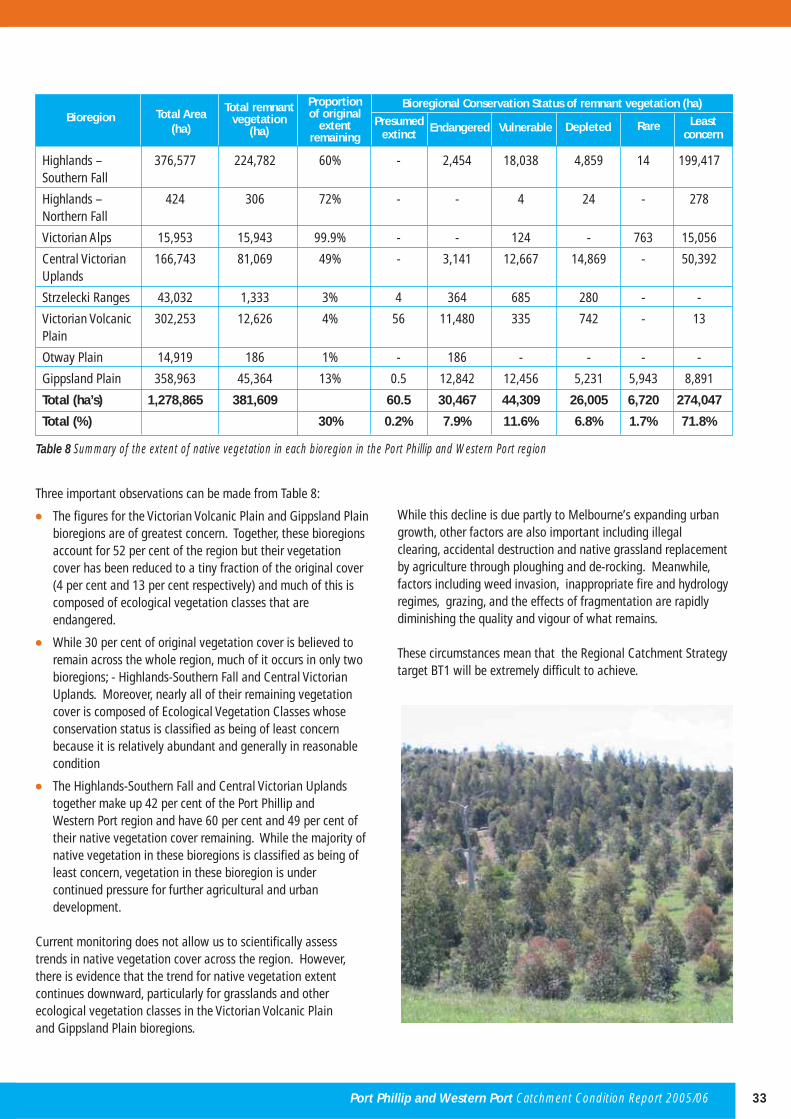
Highlands – 376,577 224,782 60% - 2,454 18,038 4,859 14 199,417 Southern Fall
Highlands – 424 306 72% - - 4 24 - 278 Northern Fall
Victorian Alps 15,953 15,943 99.9% - - 124 - 763 15,056
Central Victorian 166,743 81,069 49% - 3,141 12,667 14,869 - 50,392 Uplands
Strzelecki Ranges 43,032 1,333 3% 4 364 685 280 - -
Victorian Volcanic 302,253 12,626 4% 56 11,480 335 742 - 13 Plain
Otway Plain 14,919 186 1% - 186 - - - -
Gippsland Plain 358,963 45,364 13% 0.5 12,842 12,456 5,231 5,943 8,891
Total (ha’s) 1,278,865 381,609 60.5 30,467 44,309 26,005 6,720 274,047
Total (%) 30% 0.2% 7.9% 11.6% 6.8% 1.7% 71.8%
Bioregional Conservation Status of remnant vegetation (ha)Presumed
extinct Endangered Vulnerable Depleted Rare Leastconcern
Proportionof original
extentremaining
Total remnantvegetation
(ha)Total Area
(ha)Bioregion
Table 8 Summary of the extent of native vegetation in each bioregion in the Port Phillip and Western Port region
Three important observations can be made from Table 8:
● The fi gures for the Victorian Volcanic Plain and Gippsland Plain bioregions are of greatest concern. Together, these bioregions account for 52 per cent of the region but their vegetation cover has been reduced to a tiny fraction of the original cover (4 per cent and 13 per cent respectively) and much of this is composed of ecological vegetation classes that are endangered.
● While 30 per cent of original vegetation cover is believed to remain across the whole region, much of it occurs in only two bioregions; - Highlands-Southern Fall and Central Victorian Uplands. Moreover, nearly all of their remaining vegetation cover is composed of Ecological Vegetation Classes whose conservation status is classifi ed as being of least concern because it is relatively abundant and generally in reasonable condition
● The Highlands-Southern Fall and Central Victorian Uplands together make up 42 per cent of the Port Phillip and Western Port region and have 60 per cent and 49 per cent of their native vegetation cover remaining. While the majority of native vegetation in these bioregions is classifi ed as being of least concern, vegetation in these bioregion is under continued pressure for further agricultural and urban development.
Current monitoring does not allow us to scientifi cally assess trends in native vegetation cover across the region. However, there is evidence that the trend for native vegetation extentcontinues downward, particularly for grasslands and otherecological vegetation classes in the Victorian Volcanic Plainand Gippsland Plain bioregions.
While this decline is due partly to Melbourne’s expanding urban growth, other factors are also important including illegalclearing, accidental destruction and native grassland replacement by agriculture through ploughing and de-rocking. Meanwhile, factors including weed invasion, inappropriate fi re and hydrology regimes, grazing, and the effects of fragmentation are rapidly diminishing the quality and vigour of what remains.
These circumstances mean that the Regional Catchment Strategy target BT1 will be extremely diffi cult to achieve.
Port Phillip and Western Port Catchment Condition Report 2005/06 33

Actions in 2005/06
Regional planning
The Regional Native Vegetation Plan was completed in 2006. This will provide a detailed and systematic approach to native vegetation conservation and provides specifi c targets for each of the region’s Ecological Vegetation Classes. These will better direct conservation efforts to where they are most needed to address losses in the most threatened remnants and on landscapes where vegetation loss has been most severe.
On-ground vegetation protection and enhancement
Native vegetation restoration continues to be one of the largest areas of investment in the region, with particular focus on protecting and managing existing vegetation. The PPWCMA directed Australian Government Natural Heritage Trust funding
to nine projects undertaking native vegetation protection and management, planning and research in 2005/06. These included Biodiversity Action Planning in three areas and the Trust forNature’s covenanting work. Grants were also made to 21community revegetation projects through the PPWCMACommunity Grants program and the Commonwealth GamesTree Planting project sponsored over 200 hectares ofrevegetation works in the west and north of the region. Major investments were also made in riparian vegetation by Melbourne Water through its Stream Frontage Management Program.
Detailed mapping
Mapping of ecological vegetation classes for the region at 1:25,000 scale is being conducted by the Department ofSustainability and Environment with priority work beingdirected to the urban growth corridors.
Figure 9: Remnant native vegetation in the Port Phillip and Western Port region.
34 Port Phillip and Western Port Catchment Condition Report 2005/06

Keeping the gene pool full!
The Regional Catchment Strategy commits to maintaining viable populations of indigenous fl ora and fauna in the region’s terrestrial, aquatic and marine environments.
This commitment responds to 200 years of alterations to the Port Phillip and Western Port region’s natural environments. Some species that were present before Europeansettlement are now extinct in the region while many more are known to be under threat. Clearing and fragmentation of vegetation, changes to natural wetlands and water fl ows and fi re regimes and the introduction of exotic plants and animals have all taken a heavy toll on the native fl ora and fauna species of the region.
Condition and trend
The Department of Sustainability andEnvironment conducts the majority of monitor-ing activities for threatened fl ora and fauna species in the region and leads ongoing sci-entifi c assessment of species nominated for listing under relevant State and Commonwealth legislation.
Threatened species management in Victoria is governed by the Flora and Fauna Guarantee Act 1988.
Target PPWCMA assessment of current condition
PPWCMA assessment of trend
Poor Relatively stableReduce the number of threatened fl ora species to less than 250 by 2030 and reduce the number of threatened fauna species to less than 100 by 2030 with no further regional extinctions
BT5
Threatened Species - Biodiversity Target BT5
When species or communities are nominated for protection, ascientifi c advisory committee commences assessment of the nominations, and where necessary recommendations for listing are made. At any one time there are species or communities that have been nominated for assessment but have yet to bereviewed through the scientifi c process. As assessments arefi nalised and signed off by the relevant Government Ministers the lists of threatened species are updated.
Since 2004, the process of scientifi c assessment has raised the number of fl ora species recognised as threatened from 296 to 358, and the number of threatened fauna species from 128 to 179.
There is insuffi cient data to make sound scientifi c assessments of the long term population and viability trends. However, in that time, no further species losses have been reported and the trend in threatened fl ora and fauna species condition appears to be relatively stable.
Actions in 2005/06
Some encouraging results towards the stabilisation and protection of threatened species have been achieved as a result of various programs run by government agencies and community groups across the region.
Guaranteeing our fl ora and fauna
Department of Sustainability and Environment maintains a record of the actions taken to implement the Flora and Fauna Guarantee Act 1988. In 2005/6 records show over 380 actions werecompleted and 190 partially completed to address threats to 43 species of fauna and 30 species of fl ora in this region. No further information has yet been entered for a further 1013 actions. Listed fauna species include the hooded plover, eastern barredbandicoot, brush-tailed phascogale and helmeted honeyeater.
Port Phillip and Western Port Catchment Condition Report 2005/06 35

Flora species include coast correa, brittle green-hood,wine-lipped spider orchid and Adamson’s blown grass. Actions include ecological burning, propogation of specifi cplant species, weed control, mapping, access closures andmanagement agreements with the owners of private holdings.
The Department of Sustainability and Environment, Parks Victoria, Councils, private landholders and infrastructure utilities such as VicRoads and Victorian Rail Track have various roles in undertaking these conservation programs.
Flora Recovery Plans
Flora Recovery Plans for threatened orchids, spiny rice-fl ower, purple eyebright and swamp everlasting were supported by the PPWCMA with funding from the Australian Government’sNatural Heritage Trust in 2005/06.
The recovery plan for orchids in the region, covering 10nationally threatened species of orchids, aims to both reduce threats to the orchid populations and increase their numbers in the wild. These species include moth orchids, spider orchids, greenhood and leek orchids.
The recovery plans for spiny rice-fl ower, purple eyebright and swamp everlasting aims to improve the baseline information about the area and extent of each species, reduce threats to their wild populations collect seeds and cuttings and improvecommunity awareness of how to manage land for their recovery.
Growling Grass Frog Recovery Plan
This recovery program continued in 2005/06 with funding from the Natural Heritage Trust to minimise the risk that one of the largest populations of growling grass frogs in Australia could be lost. Baseline information about the population in theCasey-Cardinia urban growth corridor was obtained to allow the immediate threats from urban and industrial development to be managed to ensure the population is self-sustaining.
Helmeted Honeyeater Recovery Plan
The helmeted honeyeater is one of the most criticallyendangered birds in Australia. The recovery program to conserve the species is ongoing and has strong community support. It received funding from the Natural Heritage Trust. The project is in the hands of the Helmeted Honeyeater Recovery Team, acollaboration of the Department of Sustainability andEnvironment, Zoos Victoria, Parks Victoria, Friends of theHelmeted Honeyeater, Friends of Bunyip State Park, BirdsAustralia and the Bird Observers Club of Australia. Theconsortium is supported by a group of contributing ecologists and geneticists and the Parks Victoria program to protect the sedge-rich Eucalyptus camphora swamp community.
The 2005/06 program monitored wild birds breeding at Yellingbo and Tonimbuk and facilitated a re-introduction program to detect breeding behaviour, fi nd and protect nests and band nestlings. Helmeted honeyeater habitat was monitored and enhanced with plant propagation and re-vegetation. Databases continue to be updated with breeding details.
36 Port Phillip and Western Port Catchment Condition Report 2005/06

Seagrasses go quickly and come back slowly
The health of the marine environment depends on the retention of its diverse habitatcommunities. There are a number of different marine vegetation communities found in Port Phillip Bay and Western Port including seagrass meadows, kelp forests and coastal mangrove fringes. Each vegetation community plays an important role in the maintenance of marine health by assisting in the stabilisation of sediments, providing a food source for marine fauna and habitat for fi sh and other marine organisms.
The Regional Catchment Strategy’s Target BT8 commits the region to managing the threats to its valuable marine vegetation communities to ensure no further losses, whilst achieving a net gain in the distribution and quality of the region’s susceptible seagrass communities.
Seagrasses are a critical vegetationcommunity in coastal lagoons, estuaries and open coasts. They form the basis of highlyproductive ecosystems providing food and shelter for many varieties of marine lifeincluding algae which grow on them. Seagrass beds provide vital habitat and breeding grounds for marine species and play an important role in trapping and stabilising sediments.
Seagrass and marine habitat - Biodiversity Target BT8
Victorian seagrass species include Zostera tasmanica (formerly known as Heterozostera tasmanica), Zostera muelleri, Halophila australis and Amphibolis antarctica.
Mangrove communities play an important role in shorelinestabilisation and nurseries for fi sh including the species whichpenguins eat.
Monitoring
The main marine vegetation communities that have been mapped and assessed for condition are seagrass and mangroves. Limited information exists on algae and kelp forests.
The major project monitoring the health and extent of seagrass beds in Port Phillip Bay and Western Port is a three year program conducted from 2004 to 2007 by Primary Industries ResearchVictoria - Marine and Freshwater Systems. The project aims to address the lack of quantitative baseline data, which has been a barrier to identifying the causes of seagrass loss.
Seagrass beds are being monitoring at three sites established in each bay. In Port Phillip Bay, monitoring sites are located at Point Richards, Kirk Point and Swan Bay.
Target PPWCMA assessment of current condition
PPWCMA assessment of trend
Poor DecliningAchieve a net gain in the extent and quality of seagrass communities by 2020 BT8
Moderate Relatively stableRetain the extent of all other broad marine habitat classes in the region at 2004 levels
Port Phillip and Western Port Catchment Condition Report 2005/06 37

38 Port Phillip and Western Port Catchment Condition Report 2005/06
Monitoring
The main marine vegetation communities that have been mapped and assessed for condition are seagrass and mangroves. Limited information exists on algae and kelp forests.
The major project monitoring the health and extent of seagrass beds in Port Phillip Bay and Western Port is a three year program conducted from 2004 to 2007 by Primary Industries ResearchVictoria - Marine and Freshwater Systems. The project aims to address the lack of quantitative baseline data, which has been a barrier to identifying the causes of seagrass loss.
Seagrass beds are being monitoring at three sites established in each bay. In Port Phillip Bay, monitoring sites are located at Point Richards, Kirk Point and Swan Bay.
An additional site at Blairgowrie is being monitored by aerial photography. In Western Port, the project is monitoring sites at Rhyll on Phillip Island, Woolleys Beach on the western shoreline and Chicory Lane on French Island’s northern shore (Figure 10). Monitoring includes:
● Site sampling at the beginning and end of summer for analysis of leaf length, shoot density, algae and grazing animals.
● Aerial photograph interpretation to assess broad scale changes in quality and extent.
● Underwater light monitoring used to measure availability of light and water clarity which are essential for photosynthesis for the seagrasses.
There is no monitoring site in the north east of Western Port where extensive deterioration has occurred.
The extent and health of mangroves in Western Port wasmonitored in 2005/06 in a joint mangrove planting project by the Western Port Seagrass Partnership with Bass Coast Primary School. The Western Port Seagrass Partnership obtained aCommunity Water Grant of $19,729 to work with the school on this activity.
Parks Victoria undertakes annual monitoring of subtidal andintertidal zones in most of the region’s marine protected areas. In Port Phillip Bay and along the Bass Strait coastal parks, theprogram aims to track the effects of visitor access to rockplatforms. In Western Port, marine protected areas are assessed by aerial photography and mapping.
Condition and trend
Port Phillip Bay
In Port Phillip Bay, signifi cant decline in seagrasses occurred at the Blairgowrie and Point Richards monitoring sites between 2000 and 2005. Visual seagrass assessment along the Bay’s southern coast between Rosebud and Sorrento also showed widespread decline.
Conversely, seagrass at Kirk Point on the Bay’s western shoreline showed a signifi cant increase between 2000 and 2005. Kirk Point is adjacent to the Werribee Treatment Plant Murtcaim Drain. In 2004 Melbourne Water achieved major discharge reductions from this drain. Whether this improved the site for seagrass compared to the other sites in Port Phillip Bay has not been established.
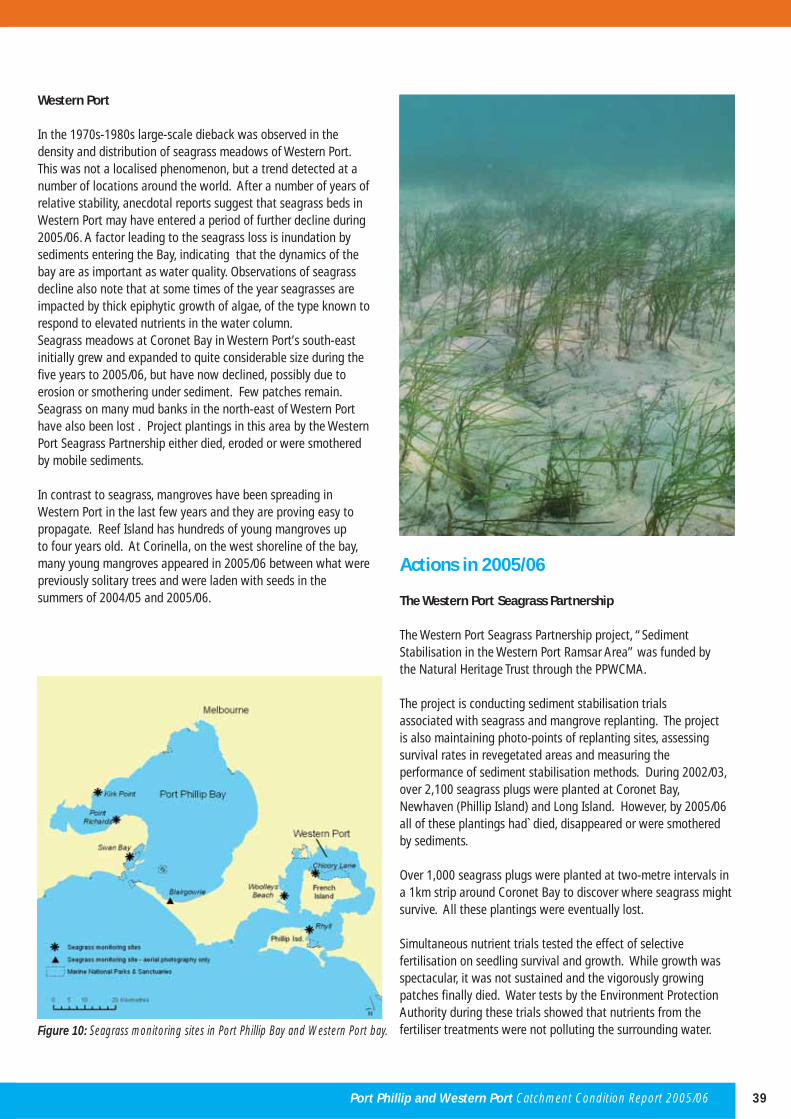
Port Phillip and Western Port Catchment Condition Report 2005/06 339
Western Port
In the 1970s-1980s large-scale dieback was observed in the density and distribution of seagrass meadows of Western Port. This was not a localised phenomenon, but a trend detected at a number of locations around the world. After a number of years of relative stability, anecdotal reports suggest that seagrass beds in Western Port may have entered a period of further decline during 2005/06. A factor leading to the seagrass loss is inundation by sediments entering the Bay, indicating that the dynamics of the bay are as important as water quality. Observations of seagrass decline also note that at some times of the year seagrasses are impacted by thick epiphytic growth of algae, of the type known to respond to elevated nutrients in the water column.Seagrass meadows at Coronet Bay in Western Port’s south-east initially grew and expanded to quite considerable size during the fi ve years to 2005/06, but have now declined, possibly due toerosion or smothering under sediment. Few patches remain. Seagrass on many mud banks in the north-east of Western Port have also been lost . Project plantings in this area by the Western Port Seagrass Partnership either died, eroded or were smothered by mobile sediments.
In contrast to seagrass, mangroves have been spreading in Western Port in the last few years and they are proving easy to propagate. Reef Island has hundreds of young mangroves up to four years old. At Corinella, on the west shoreline of the bay, many young mangroves appeared in 2005/06 between what were previously solitary trees and were laden with seeds in thesummers of 2004/05 and 2005/06.
Actions in 2005/06
The Western Port Seagrass Partnership
The Western Port Seagrass Partnership project, “SedimentStabilisation in the Western Port Ramsar Area” was funded bythe Natural Heritage Trust through the PPWCMA.
The project is conducting sediment stabilisation trialsassociated with seagrass and mangrove replanting. The project is also maintaining photo-points of replanting sites, assessing survival rates in revegetated areas and measuring theperformance of sediment stabilisation methods. During 2002/03, over 2,100 seagrass plugs were planted at Coronet Bay,Newhaven (Phillip Island) and Long Island. However, by 2005/06 all of these plantings had` died, disappeared or were smothered by sediments. Over 1,000 seagrass plugs were planted at two-metre intervals in a 1km strip around Coronet Bay to discover where seagrass might survive. All these plantings were eventually lost.
Simultaneous nutrient trials tested the effect of selectivefertilisation on seedling survival and growth. While growth was spectacular, it was not sustained and the vigorously growing patches fi nally died. Water tests by the Environment Protection Authority during these trials showed that nutrients from thefertiliser treatments were not polluting the surrounding water.Figure 10: Seagrass monitoring sites in Port Phillip Bay and Western Port bay.

The project also continued to conduct experiments in plantingseagrass seedlings with nutrients in the mud fl ats at Lang Lang. The project found that seagrass cannot regenerate in the Lang Lang area while adjacent cliff erosion persists and produces mud which smothers seagrass soon after planting. When seagrass planted in mud from Lang Lang was taken to Coronet Bay, it grew successfully in the mud both offshore and onshore. If the Lang Lang cliff erosion problem can be solved, seagrass may again fl ourish in the area. Research on nutrient enrichment
A research project by the Department of Primary Industriesinvestigated the effects of increased nutrient loadings on intertidal seagrass beds. The study found that increased nutrient loads did affect seagrass growth and health by increasing the amount of algae growing on the leaves. Seagrass beds in the study area near Blind Bight appeared to be the most vulnerable to this effect. Algal growth stimulated by nutrient enrichment in other study areas appeared to be offset by reduced light availability or increased grazing by algae feeders. Smothering of seagrass by fi lamentous algae growth was prolifi c at Reef Island and could be stimulated by high nutrient levels..
Primary Schools Mangrove Project
This project, conducted by the Western Port Seagrass Partnership and Bass Coast Primary Schools in 2005, collected seed andgerminated mangrove seedlings which were planted atNewhaven and Grantville. These have continued to grow well in 2006.
In the Summer of 2005/06, about 10,000 mangrove seeds were collected. Most were direct seeded along the Grantville mud fl ats, Queensferry Rd and Coronet Bay. Seeds at the latterlocations all germinated. However very few germinated at
Grantville although the substrate had been tested and found suitable. It is thought that seeds planted with seed coats in place in an anaerobic environment may have been poisoned by toxic products from the decaying seed coats.
Mangrove plantings at Lang Lang Cliffs
At Lang Lang, over 2,000 mangrove seedlings were planted by the Western Port Seagrass Partnership. This project was conducted in conjunction with Department of Sustainability and Environment. Some mangroves were washed away but others have survived and doubled in size. Different methods of staking and protection for mangroves appears to improve seedling survival. Nutrienttrials may also identify how to achieve faster seedling growth.
40 Port Phillip and Western Port Catchment Condition Report 2005/06

Wise council
There are 38 councils in the Port Phillip and Western Port region; many more than in any of Victoria’s other catchment management regions. Councils are major investors in and practitioners of natural resource management in the region but achieving engagement of and coordination between this number of Councils for these activities is a signifi cant challenge for the PPWCMA and its partners.
Target PT3 of the Regional CatchmentStrategy seeks Local Government adoption of the Regional Catchment Strategy’s naturalresource management priorities in theirstrategic planning and operations.
Status and trend
Effective implementation of the Regional Catchment Strategy at Council level depends partly on it being a key informing document for Council investment and activities, especially because Councils have to balance between competing priorities with limited resources.
There was a high level of involvement byCouncils in the preparation of the Regional Catchment Strategy. Each of the 38 Councils was involved at various stages of thedevelopment process. Many Councils were also closely involved in the preparation anddevelopment of projects for the RegionalCatchment Investment Program submitted in April 2006 for the 2006/07 fi nancial year.
Links with Local Government- People and Organisations Target PT3
Generally, there is a good level of understanding of the role and operation of the Regional Catchment Strategy amongst Councils, in particular regarding its role in investing Victorian and Australian Government funds for regional natural resource management.
Ideally, the priorities of Council Municipal Strategic Statements and Local Planning Scheme Provisions will be closely aligned with the Regional Catchment Strategy. However, the strategic and re-gion-wide focus of the Regional Catchment Strategy creates some diffi culties in it being adopted by Councils as a referencedocument in their planning schemes and information in the strategy is often not in an appropriate format for Councils to use immediately and easily. Other Victorian Catchment Management Authorities are encountering similar challenges in encouraging Councils to use the relevant Regional Catchment Strategies as planning reference tools. This issue is being
addressed at a state-wide scale in the development of guidelines for the next reviews of Regional Catchment Strategies andCouncil Planning Schemes. Despite the limited formal links between the Regional Catchment Strategy and Council planning schemes, across the region Councils are increasingly including appropriate references to the Regional Catchment Strategy and natural resource management activities in their policies and plans, as well as increasing in contributing to regional natural resource management outcomes.
Data on this relationship has recently come to light from theMunicipal Association of Victoria’s 2006 Victorian LocalGovernment Environment Survey Report. The report collates responses from 76 of Victoria’s 79 Councils and includes abreakdown against the “metropolitan Councils” and the“interface Councils”, all of which are from this region.
Target PPWCMA assessment of current condition
PPWCMA assessment of trend
Moderate ImprovingAt least half the region’s 38 Councils to have formally adopted the Regional Catchment Strategy as a reference document by 2008 refl ecting relevant sections of it appropriately in their planning
schemes and/or implementing relevant actions through their annual programs
PT3
Port Phillip and Western Port Catchment Condition Report 2005/06 41

42 Port Phillip and Western Port Catchment Condition Report 2005/06
The report is a comprehensive survey of local governmentenvironment priorities, resources and management approaches.
It provides an important benchmark for the links betweenCouncils and the catchment management sector, and is a reference for improved statewide and local collaboration on environment management. It also raises the profi le of the work being done by Victorian Councils and is a catalyst for innovative partnerships between Councils and other environment managers. Some of the key fi ndings from the report are:
● The management of waste, stormwater and native vegetation are the three highest priority issues currently facing the sector.
● The key resource needs for interface and metropolitan Councils are funding for on-ground projects, data resources (such as mapping) and staff training.
● Virtually all Councils across Victoria were involved in the most recent the current Regional Catchment Strategies. 100 per cent of interface Councils and 82 per cent of metropolitan Councils were involved in briefi ng sessions. 88 per cent of interface Councils and 77 per cent of metropolitan Councils contributed locally relevant information and comments. 63 per cent of interface Councils reviewed the Regional Catchment Strategy and linked it to Council business planning, budget process and activities.
● The majority of interface and metropolitan Councils feel they have a “comprehensive’ or ‘general’ understanding of natural resource management in both a local and regional context.
● 50 per cent of interface Councils stated they have a ‘general’ level of involvement with the Catchment Management Authority, while 48 per cent of metropolitan Councils rate their level of involvement with the Catchment Management Authority as ‘limited’.
● Two key issues limiting Council involvement in natural resource management are the availability of funding and resources and other Council activities taking priority.
● The most highly regarded benefi t of being involved in regional natural resource management is the provision of a ‘strategic approach’.
● The key environment management activities being undertaken by Councils include:
● provision of support to community environment groups
● participation in the Cities for Climate Protection program
● provision of incentives for biodiversity and land management
● participation in the International Council for Local Environmental Issues water campaign and provision of community environmental education programs
● There are at least 25 different types of environment strategies developed by Victorian Councils. Stormwater management strategies are the most common, in place in 84 per cent of Councils, followed by waste management and native vegetation protection measures in 67 per cent
and 64 per cent of Councils respectively. A signifi cant number of Councils are in the process of developing or are intending to develop sustainable water use strategies and domestic wastewater strategies. The number of Councils with green house strategies and energy conservation strategies has more than doubled since 2002.
● 29 out of the 31 responding metropolitan and interface Councils had at least one dedicated environment offi cer funded from Council’s core budget in 2005.
● 88 per cent of interface Councils and 78 per cent of metropolitan Councils use environment indicators to inform Councils programs.
● When asked about the level of connection between the Regional Catchment Strategy(s) and Council’s Corporate Plan or Municipal Strategic Statement, 50 per cent of the Councils stated that the connection is ‘limited’ and 30 per cent stated that the link is ‘general’. One interface Council felt that its connection is comprehensive’. Only 33 per cent of interface Councils and 9 per cent of metropolitan councils stated that the Regional Catchment Strategy is a reference document in Council’s Local Planning Policy Framework.
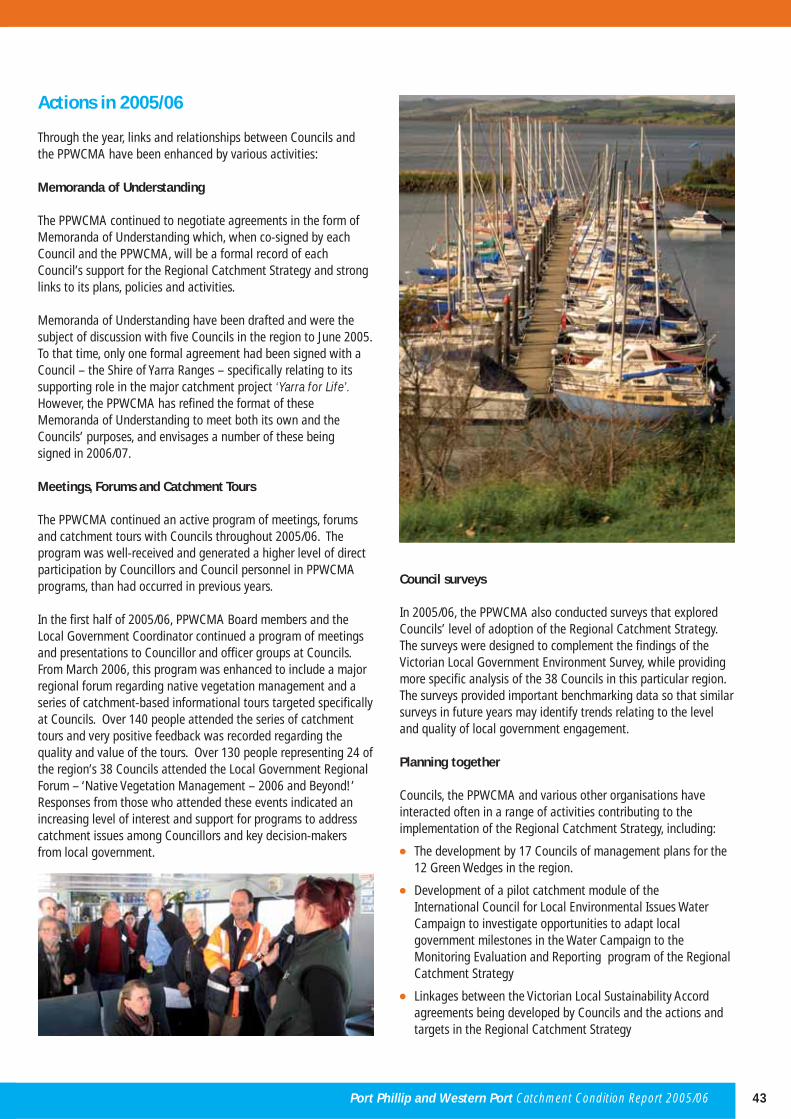
Port Phillip and Western Port Catchment Condition Report 2005/06 43
Actions in 2005/06
Through the year, links and relationships between Councils and the PPWCMA have been enhanced by various activities:
Memoranda of Understanding
The PPWCMA continued to negotiate agreements in the form of Memoranda of Understanding which, when co-signed by each Council and the PPWCMA, will be a formal record of eachCouncil’s support for the Regional Catchment Strategy and strong links to its plans, policies and activities.
Memoranda of Understanding have been drafted and were the subject of discussion with fi ve Councils in the region to June 2005. To that time, only one formal agreement had been signed with a Council – the Shire of Yarra Ranges – specifi cally relating to its supporting role in the major catchment project ‘Yarra for Life’. However, the PPWCMA has refi ned the format of theseMemoranda of Understanding to meet both its own and theCouncils’ purposes, and envisages a number of these beingsigned in 2006/07.
Meetings, Forums and Catchment Tours
The PPWCMA continued an active program of meetings, forums and catchment tours with Councils throughout 2005/06. The program was well-received and generated a higher level of direct participation by Councillors and Council personnel in PPWCMA programs, than had occurred in previous years.
In the fi rst half of 2005/06, PPWCMA Board members and the Local Government Coordinator continued a program of meetings and presentations to Councillor and offi cer groups at Councils. From March 2006, this program was enhanced to include a major regional forum regarding native vegetation management and a series of catchment-based informational tours targeted specifi cally at Councils. Over 140 people attended the series of catchment tours and very positive feedback was recorded regarding the quality and value of the tours. Over 130 people representing 24 of the region’s 38 Councils attended the Local Government Regional Forum – ‘Native Vegetation Management – 2006 and Beyond!’ Responses from those who attended these events indicated an increasing level of interest and support for programs to address catchment issues among Councillors and key decision-makers from local government.
Council surveys
In 2005/06, the PPWCMA also conducted surveys that explored Councils’ level of adoption of the Regional Catchment Strategy. The surveys were designed to complement the fi ndings of the Victorian Local Government Environment Survey, while providing more specifi c analysis of the 38 Councils in this particular region. The surveys provided important benchmarking data so that similar surveys in future years may identify trends relating to the level and quality of local government engagement.
Planning together
Councils, the PPWCMA and various other organisations have interacted often in a range of activities contributing to theimplementation of the Regional Catchment Strategy, including:
● The development by 17 Councils of management plans for the 12 Green Wedges in the region.
● Development of a pilot catchment module of the International Council for Local Environmental Issues Water Campaign to investigate opportunities to adapt local government milestones in the Water Campaign to the Monitoring Evaluation and Reporting program of the Regional Catchment Strategy
● Linkages between the Victorian Local Sustainability Accord agreements being developed by Councils and the actions and targets in the Regional Catchment Strategy

44 Port Phillip and Western Port Catchment Condition Report 2005/06
Table 9: Council activities contributing to Catchment health.
Partnership projects
Councils are undertaking numerous projects that contribute to regional catchment health and are an indication of growing links between the local government sector and the catchment management sector. A number of projects have been directly supported by the PPWCMA and other organisations involved in natural resource management. Examples are listed in Table 9:
Council Projects and Activities
Banyule Waterwatch activities, the Yandell Reserve Recovery project, Wildlife Corridor Program, Stormwater Management Program and Water Conservation Strategy
Bass Coast Coastal rehabilitation, waterway protection, wildlife conservation and weed and pest animal control
Brimbank Development of Sydenham Regional Conservation Park
Cardinia Tackling Weeds on Private Land projects; Western Port Biolinks and National Landcare Program projects
Darebin Urban Bushcare projects with Greening Australia Victoria
Greater Dandenong Dandenong Creek redevelopment
Hobsons Bay Implementation of a regional strategy for Kororoit Creek (with Brimbank, Wyndham and Melton Councils)
and the Truganina Coastal Parklands project
Hume Development of Merri Creek Regional Park (Galada Tamboore) with the Merri Creek Management Committee, Pest Animal Action Plan, Integrated Weed Control Strategy, annual State of Environment reporting
Kingston Development of a Biodiversity Strategy, waterway protection and bushland restoration in Mordialloc Creek Reserve
Macedon Ranges Rehabilitation of Jackson’s Creek at Gisborne, corporate support for the Regional Landcare Coordinator position in the Werribee and Maribyrnong catchments
Manningham Pest plant and animal control program, Bushland Management Strategy, bushland restoration in Mullum Mullum Creek Linear Park
Melton Native Vegetation Incentive Scheme
Moorabool Lerderderg River Restoration Project and the Grow West landscape restoration project
Moreland Development of the Jacana Wetlands on Moonee Ponds Creek
Mornington Peninsula Land Protection Incentive Scheme
Whitehorse Wetland rehabilitation and erosion control at Campbells Croft in Vermont
Yarra Ranges Whole-farm planning in horticultural businesses in the Yarra Valley with the Department of Primary Industries, Domestic Wastewater Management Plan

Port Phillip and Western Port Catchment Condition Report 2005/06 45
We’ll get by with a little help from our friends
The PPWCMA estimates that there are around 480 active community groups working for environmental improvement across the region. The majority of these groups are comprised of Friends groups (typically urban locations with a focus on public land) and Landcare groups (typically rural and semi-rural locations with a focus on private land) (Figure 11).
They form a network of volunteers, critical to the protection and maintenance of ourbushland, wildlife, waterways, beaches andcultural heritage and make signifi cantcontributions to improvements in thecondition of our catchments. They play a key role in implementing practical solutions for local environmental problems and developing an ethic of stewardship for our natural assets. Groups provide leadership, innovation andmotivation for change within their localcommunities, and provide socialinteractions that contribute to the strengthand fabric of local communities.
To maintain and build the long-termeffectiveness of groups in catchmentmanagement, it is essential they be supported and encouraged through the provision offunding opportunities, training andnetworking events and recognition for their works. It is also important to ensure that groups are ‘healthy’, strong, robust, effective and dynamic organisations with capablememberships that are working strategicallyand effi ciently.
For these reasons, the Regional Catchment Strategy’s target PT5 focuses on improving the health and memberships of groups in the region.
Target PPWCMA assessment of current condition
PPWCMA assessment of trend
Healthy ImprovingA 20% increase in the number of groups active in the region by 2008 and a 20% increasein active membership by 200
PT5
Extent and health of Community Groups - People and Organisations Target PT5

46 Port Phillip and Western Port Catchment Condition Report 2005/06
Monitoring
In the last fi ve years, the groups in this region have beensurveyed three times to obtain a picture of group needs,membership numbers and activities:
● An initial survey of the region’s groups in 2001 as the basis for developing the Strategy for Support and Coordination of Landcare and Community Groups in the Port Phillip and Westernport Region. From the estimated 470 groups, 239 responses were received.
● A ‘Group Health Self-assessment’ survey conducted in 2004 (requesting current and 2002 ratings of group health). A total of 480 surveys were sent out with 79 responses received (from 36 Landcare groups and 43 other groups).
● A second ‘Group Health Self-assessment’ survey conducted in 2006 (requesting updated ratings of group health). A total of 461 surveys were sent out with 116 responses received (from 38 Landcare groups and 78 other groups).
It is planned that surveys will be undertaken periodically in years to come to continue to monitor group health and to identify trends.
Condition and Trend
Key results from the surveys and other contacts with groups include:
● In 2005/06, there were 83 Landcare groups operating with a coverage of an estimated 500,000 hectares or around 40 per cent of the region. There were also almost 200 Friends groups and over 180 other groups (including Committees of Management, community nurseries, advisory groups, resident action groups, etc.) active in the region, plus Melbourne Water supports an estimated 100 Waterwatch groups in the region (typically with a water quality monitoring focus).
● The number of Landcare groups in the region continues to grow. At least four (and possibly many more) new groups formed between 2002 and 2004. In 2005/06 a further eight new Landcare groups were established, although another group went into recess. This increase is contrary to an apparent downward trend in Landcare group numbers across Victoria reported in recent research by Charles Sturt University.
● The average total membership of Landcare groups appears to have decreased slightly over the past fi ve years, though the average active membership has increased, as shown in Table 10 and Figures 12 and 13.
Figure 11: Community Enviroment Groups in the Port Phillip and Western Port region.

Port Phillip and Western Port Catchment Condition Report 2005/06 47
Figure 12: Number of Landcare groups in the region
Figure 13: Active membership of Landcare groups in the region
2001 survey of 2004 survey of 2006 survey of Landcare Groups Landcare Groups Landcare Groups
No. of active groups 56 (estimated) 76 83
Average total membership 40 49 38
Average active membership 19 19 26
Table 10: Changes in Landcare group membership
2 0 0 1 2 0 0 2 2 0 0 3 2 0 0 4 2 0 0 5 2 0 0 6 2 0 0 7 2 0 0 8
No of active Landcare groups Trend needed to achieve target 1 2 0
1 0 0
8 0
6 0
4 0
2 0
0
5 6
7 68 3
2 0 0 1 2 0 0 2 2 0 0 3 2 0 0 4 2 0 0 5 2 0 0 6 2 0 0 7 2 0 0 8
Average active membership of Landcare groups Trend needed to achieve target 3 0
2 5
2 0
1 5
1 0
5
0
5 6
7 68 3

48 Port Phillip and Western Port Catchment Condition Report 2005/06
● The 39 Landcare groups that responded to the most recent survey reported a contribution of 69,762 hours in 2005/06. Extrapolated to the 83 groups in the region, there may have been around 150,000 hours of voluntary time contributed in 2005/06 to environmental activities by the Landcare groups alone.
● The health of the Landcare and other community groups, as assessed by the groups themselves, has steadily improved since 2002 as shown in Table 11.
Self assessment of group health Total Average
5 4 3 2 1 (Thriving) (Strong) (OK) (Surviving) (Stalled) Number of groups - 2002 8 13 35 11 3 70 3.17 Number of groups - 2004 10 22 36 7 4 79 3.34 Number of groups - 2006 13 36 57 6 4 116 3.41
Table 11: Ratings of group health in 2002, 2004 and 2006.
rating
Actions in 2005/06
Strategic support for community groups
The PPWCMA supports community groups by developing and raising the capacity of Landcare and other community groups to enable them to effectively contribute to catchment management in the region. The Strategy for Support and Coordination ofLandcare and Community Groups in the Port Phillip andWesternport Region guides the activities of the PPWCMA.
During 2005/06, the PPWCMA provided advice and facilitation services leading to the formation of eight new Landcare groups (Christmas Hills Landcare Group, East Creek Organisation for Landcare, Jumping Creek Landcare Group, Lardner and District Landcare Group, Macedon and Mount Macedon Landcare Group, Main Creek Catchment Group, Olinda Creek Landcare Group, Waterholes Creek and Tributaries Landcare Group) and a new network of groups (Jacksons Creek Catchment EcoNetwork). A regional forum for Landcare Coordinators and Facilitatorswas established to improve the sharing of knowledge and experiences in supporting Landcare groups and to improve the coordination of effort.
Regular email bulletins containing alerts to funding and training opportunities, event notifi cations and links to resources were provided. These reduced the number of hardcopy information packages sent to all groups in the region and were a more effi cient means of disseminating this information in a timely manner.
Regular mailouts were still provided to distribute copies of resources such as the Environmental Management in Agriculture Work Sheet Series, the Introductory Weed Management Manual, and How to Plan Wildlife Landscapes.
In an effort to facilitate the adoption of computer-basedcommunication and information sharing by groups, the PPWCMA secured a number of second-hand computers from Parks Victoria and offered them to groups that did not have access to email and internet. 10 computers were distributed during 2005/06.
Funding
As part of the its Community Grants program, the PPWCMAcontinued its program of providing small grants for Landcare groups, resulting in 54 groups each receiving $300 to assistadministration and 43 groups each receiving $500 forpromotional activities during 2005/06.
The PPWCMA’s popular Calendar of Grants and Incentives was again comprehensively revised and distributed to all groups inthe region. Funding application assistance and advice wasprovided to groups upon request.
Local Atlases
42 Landcare Group Atlases were produced during 2005/06. The atlases are a resource provided to Landcare groups to help them plan and operate strategically. A Landcare Group Atlas is a series of full colour, A3 maps, scaled to the Landcare group’s boundary, and depicting state-held GIS datasets.
The maps illustrate aspects such as aerial photography, satellite imagery, fi re history, bore location and depth, cadstral/property boundaries, digital elevation model, contours, current vegetation coverage, conservation status of ecological vegetation classes,geology, land use, Land for Wildlife properties, pest plant and animal records, salinity priority areas, threatened fl ora and fauna records and Registered Sites of Aboriginal Signifi cance. The maps are pre-sented hard copy along with a CD with electronic versions of each map. An A3 transparency sheet with the group boundary depicted is also provided to facilitate manual overlaying ofinformation for group planning purposes.
Victorian Landcare Award
In recognition of its community capacity building efforts thePort Phillip and Westernport CMA was awarded the Australian Gov-ernment Regional Landcare Award at the Victorian Landcare Awards in September 2005.

Target PPWCMA assessment of current condition
PPWCMA assessment of trend
Moderate Relatively StableIncrease community awareness of the condition of catchment assets and associated trends PT6
Community Awareness - People and Organisations Target PT6
Port Phillip and Western Port Catchment Condition Report 2005/06 49
Every resident has infl uence
The degree to which a community becomes involved with and takes ownership of catchment management issues helps to determine the level of investment for our programs.
However the size and diversity of the Port Phillip and Western Port region presents a signifi cant challenge for the region’s natural resourcemanagers. Raising the collective community awareness is the subject of Target PT6 of the Regional Catchment Strategy.
The Target aims to increase the awareness of key catchment issues and to promote protection and management of catchment assets throughout the community.
Condition and trend
Each resident of the region has an infl uence on catchment condition at a local and regional scale. Positive or negative, over 3.4 millionindividual impacts have the potential to make for a signifi cant change in the state of the environment.
Community education, awareness and sup-port are important elements for directing these impacts towards constructive outcomes.
Several programs exist across the region to raise community awareness however there is considerable scope to accelerate development of these activities to further drive environmental and cultural change, thereby infl uencing priorities for investment of governments and other funding bodies.
In general, communities are quite willing to make modest changes to their daily activities if they can see the positive benefi ts to their local environment. This is evidenced by the increasing publicacceptance and participation in programs such as waterconservation, household and green waste recycling schemes and the continuing establishment of new community environment groups across the region.
While a growing number of schools in the region now incorporate environmental education into their curricula, there remainsconsiderable potential for the development and coordination of more tailored education programs about catchment management at both primary and secondary school levels.
Actions in 2005/06
Every Drop Counts
The Victorian Government has championed a major, ongoingmedia campaign on water conservation. The aims includebringing water conservation to the front of mind of Victorian households, businesses and communities. A particular goal is to reduce the amount of water used on average per person. The campaign has included extensive television, radio,newspaper and billboard coverage across greater Melbourneand has featured messages such as “Every Drop Counts”,encouraging people to save water by changing their habits.
Melbourne 2006 Commonwealth Games
The Melbourne 2006 Commonwealth Games included asubstantial environmental program with a focus on raisingcommunity awareness of environmental issues as well asimplementing numerous practical environmental enhancements.

50 Port Phillip and Western Port Catchment Condition Report 2005/06
For example, a feature of the Games’ environmental program was a large-scale, tree planting project so that staging the Games would be carbon neutral. The PPWCMA coordinated this program by working with a range of organisations including Landcare groups, Councils, Catchment Management Authorities,Government departments, Greening Australia Victoria and theOffi ce of Commonwealth Games Coordination.
Plantings involving over 1,900 volunteers and covering morethan 450 hectares were undertaken at 17 sites across Victoria, generating community interest plus local and statewide media and a lasting on-ground legacy. This included over 170,000indigenous trees, shrubs and grasses planted in the Grow West project area on 170 hectares in the Rowsley Valley and Pentland Hills. It is estimated that the plantings will reduce greenhouse gases by over 100,000 tonnes – the approximate equivalent of taking more than 25,000 cars off the road for one year.
Waterwatch and LandLearn
Two examples of successful education programs are Melbourne Waterwatch and LandLearn. These programs engage school and community group audiences through combined education and training activities to raise awareness of catchment management issues while delivering practical and useful outcomes. Using the lessons learned from these programs similar activities focussing on other catchment management issues could be developed to great effect.
Public seminars on the “State of the Catchment”
In 2005/06, three community seminars were conducted by the PPWCMA to present up-to-date facts to the community on the state of the environment .
The ‘State of the Catchment’ seminars were held for the Werribee and Maribyrnong catchments, the Western Port catchment and the Yarra catchment. The audiences totalled over 600 people and included Landcare and friends groups, Councillors and coun-cil staff, government agency personnel, lecturers and students from secondary and tertiary education institutions.
The seminars provided a snapshot of the region’s health and the latest information from experts on issues including river health, water quality, the health of Port Phillip Bay and Western Port,native vegetation, threatened species, urban development and rural land use.
Mornington Peninsula and Western Port Biosphere
A Biosphere Reserve is a special designated area in which governments and communities work together to improve the sustainability of the ways they work and live. The Man and Biosphere Program has been developed by the United Nations to encourage economic and social development that is sustainable in the long term, whilst protecting and enhancing thebiodiversity within the Reserve.
The Mornington Peninsula and Western Port Biosphere Reserve has been established in recent years and is one of one of 12 biosphere reserves in Australia. It covers all of the Mornington Peninsula, French Island, parts of the Shires of Cardinia and Bass Coast (including Phillip Island), and parts of the Cities of Casey and Frankston. It includes national parks and other reserve areas. More importantly, it is unique in that it also includes farms, tourist sites, industries and towns. Actions to achieve Man and Biosphere objectives are initiated and implemented by community groups, the fi ve local governments and the State Government.
Through 2005/06, the Biosphere Foundation has focussed on identifying key opportunities and programs that it will pursue to turn the Biosphere from a concept into real benefi ts for the local environment and the people that live, work and visit the area.
Six community-based roundtables are developing projects towork with existing community groups, industries and businesses. They are obtaining funds though grants, sponsorship andmembership fees. Roundtables are undertaking community and school education relating to sustainable practice. Examplesinclude implementing water audits conducted under theSustainable Schools Program, surveying households to identify and reduce their ‘eco-footprint’, reducing use of plastic andchemicals, and caring for threatened wildlife and habitat. Partnerships are being developed for example, with touristoperators to improve the sustainability of their businesses. Research is being promoted - for example, investigating energy alternatives, monitoring wildlife and potential re-establishmentof sea grasses.
School Curricula
Environment-based programs are increasingly being incorporated into primary and secondary school curricula across the region,often at the instigation of the schools themselves. Examples within the Port Phillip and Western Port region include:
● Darraweit Guim Primary School’s creekside revegetation program to help protect platypus populations and assess wetland condition;
● Romsey Primary School’s revegetation program to protect remnant native vegetation; and
● Balnarring Primary School’s revegetation of the Balbirooroo wetland.
Gould Group
One of Australia’s oldest environment organisations, the Gould Group, has launched a three-year “Multicultural School Gardens Program”. The program is designed to engage older community members from diverse ethnic backgrounds to share with school students their culture, experiences and the traditional food plants that they grow. Up to 40 schools will build and maintain garden beds, growing a variety of fruit and vegetables with theencouragement and assistance of the local ethnic communities.

Port Phillip and Western Port Catchment Condition Report 2005/06 51
Some other work aroundthe regionAcross the Port Phillip and Western Port region, an extensive array of projects and programs are being undertaken by government agencies, local governments and community groups. While it is not possible to detail all activities undertaken in the region, the following selection outlines some that are helping to implement the Regional Catchment Strategy.
Environmental Management Systems
Environmental Management Systems are tools that help landholders assess and improve the environmental performance of their farms. Over 20 projects are either in development of have been completed across the region by the Department of Primary Industries, the Victorian Farmers Federation, the Mornington Peninsula Vignerons Association, Gippslandcare, Bass Coast Landcare Network, Ausveg, Horticulture Australia, Yarra Valley Winegrowers Association and the Winemakers Federation of Australia. These programs are assisting landholders and industries to manage productive, profi tableenterprises using environmental best practice.
Frog Census
Melbourne Water, the Melbourne Waterwatch Program and the Amphibian Research Centre cooperate on a biannual frog census across the greater Melbourne area. By analysing frog calls recorded by volunteers at waterways, the census provides an indication of the distribution and abundance of frogs and is especially useful in identifying the locations of rare and endangered species. As frogs are sensitive to environmental conditions, the census is also useful in providing an indication of the health of our waterways.
Waterwatch
The Melbourne Waterwatch program works with community groups to collect reliable and practical data on water quality within theregion and raises community awareness and understanding of water quality.
In 2005/06 Melbourne Waterwatch involved thousands ofparticipants from community groups and primary and secondary schools. Quality-controlled monitoring was carried out at manylocations across the region, contributing to Melbourne Water’s water quality database.
Sponsored by the Australian Government’s Natural Heritage Trust and locally by Melbourne Water, the program is supported by a number of other organisations including the Department of Primary Industries, the Forestry program of the Department of Sustainability and Environment and local governments.
Rate Rebates in Melton Shire
Melton Shire Council is targeting 1,200 properties with a rate rebate scheme to assist landowners to look after waterways, native trees
and grasslands, to fence remnant vegetation, manage grazing and remove environmental and noxious weeds.
In a program partly funded through a grant from theAustralian Government’s Natural Heritage Trust, the Council issigning long-term agreements with landholders to undertake works that will implement the priority actions in Council’sEnvironmental Enhancement Policy. The policy incorporates a number of the priority actions identifi ed in the RegionalCatchment Strategy, Rabbit Action Plan and Weed Action Plan.
Reef Watch
In 2005/06, Reef Watch has been involved in eradicationprograms for marine pest animals including the Northern Pacifi c Seastar, providing baseline data on Victoria’s marine national parks and sanctuaries, reporting illegal fi shing and developing a fi eld guide with Museum Victoria to the nudibranchs (marine snails) and fl atworms of Bass Strait. The volunteers involved in the project are also helping to map seagrass beds and marine species, report new species and invasive pests, and give valuable insights into the seasonal cycles of plants and animals.
Stream Frontage Management
Melbourne Water’s Stream Frontage Management Programcontributed to the improvement of the health of streamsides throughout the region’s rural catchments. Working withcommunity groups and landholders, the program provides funding and technical support to rural landholders with waterway frontages for weed removal, revegetation and fencing. In 2005/06, a total of 398 agreements were signed with rural landholders, 122,850 locally indigenous plants were planted and over 65 kilometres of fencing was erected across the region.
Private landholders in some urban areas, Councils and community groups also received assistance through Melbourne Water’s Urban Stream Frontage and Corridors of Green programs.
Solutions at the Source
The Bass Coast Landcare Network’s successful Solutions at the Source program continued in 2005/06. An Australian Government National Landcare Program grant has funded a broad range of activities including farm-scale mapping, training programs and educational fi eld days for landholders and the establishment of four greenhouse demonstration farms. Over 20 kilometres of new fencing will help prevent soil erosion, protect native vegetation andwaterways and create corridors to link remnant vegetation patches. Other activities in this program include targeted fox and rabbit control over at least 60 hectares and 118,000 new indigenous trees, shrubs and grasses planted.
Stormwater Initiatives
The Victorian Government, through the Department ofSustainability and Environment, has allocated $20 million for tackling stormwater quality issues through the Yarra Action Plan, including addressing priority issues identifi ed in Municipal

52 Port Phillip and Western Port Catchment Condition Report 2005/06
Stormwater Management Plans and installing water sensitive urban design features in the lower Yarra catchment.
The Department also prepared draft residential subdivisionprovisions for the management of stormwater. These provisions, once fi nalised, will update Clause 56 (Residential Subdivision) of the Victorian Planning Provisions. Implementation will beaccompanied by Practice Notes and introductory sessions for users in metropolitan and regional areas.
Water Quality Improvement Plan
The development of a regional Water Quality Improvement Plan, funded by the Natural Heritage Trust’s Coastal CatchmentsInitiative, was initiated in late 2004. The PPWCMA has beenworking with the program’s leaders, Melbourne Water and the Environment Protection Authority Victoria, and other organisations to develop the plan.
Wetland Management
A draft Index of Wetland Condition has been developed by theDepartment of Sustainability and Environment as a provisional method for assessing wetland condition across Victoria. It is arapid assessment technique for inland, naturally-occurringwetlands that assesses components such as hydrology, waterproperties, biota and soil.
With assistance from Parks Victoria, the Department has alsoproduced strategic management plans for two of the threeRamsar Convention listed wetlands in the region, namely thePort Phillip Bay (Western Shoreline) / Bellarine Peninsula, andthe Western Port wetlands.

PORT PHILLIP AND WESTERNPORTCATCHMENT MANAGEMENT AUTHORITY
PO Box 48 Frankston Vic 3199Phone: (03) 9785 0183 Fax: 9773 6521
Website: www.ppwcma.vic.gov.au