port said engineering research journal...94 figure 6 (axial loads vs. axial displacement) 3.2....
TRANSCRIPT

90
Analysis of Micropile Constructed in Sandy Soil of Ismailia Area
K. Hafez1, A.Moubarak2, A. Hamad3 1 Professor, Faculty of Engineering, Suez Canal University, Egypt.
2Assistant professor, Faculty of Engineering, Suez Canal University, Egypt. 3Assistant Lecturer, wassit University, Iraq.
ABSTRACT The main object of the paper is to study the behavior of Micropile in sandy soil of Ismailia. A full scale
field test result on Micropiles in USA for rocky soil are numerically verified using the finite element
analysis software ABAQUS. Then, the verified numerical model of the software ABAQUS is used to curry
out the analysis of Micropiles constructed in sandy soil of Ismailia area. Numerical results obtained are
very close to the field results. The chosen model is suitable for initial prediction of the behavior of
micropile instead of field tests which take more time and cost. Results indicated that, application of the
combined load on the micropile causes a decrease in the lateral displacement and bending moments
compared with application of the lateral load at Ismailia site (sandy soil). The effect increasing the diameter
by 50[%] on the behavior of the micropile is reducing the axial displacement by 22[%] and increasing the
axial ultimate load by 30[%]. The lateral loading results indicate that the lateral displacement is reduced by
43.5[%] and the lateral ultimate load increases by 35.1[%], whereas the maximum bending moment
increases by 192.4[%]. The combined loading results show that the lateral displacement is reduced by 40.4
[%] and the lateral ultimate load increases by 41[%], but there is more change in the maximum bending
moment which increases by 292[%]. The study also presents guidelines and diagrams for the similar sites
for different types of load.
KEYWORDS: Micropile; 3D finite element analysis; Soil–Micropile interaction; Combined loads; Rocky
soil; Sandy soil.
ملخص اتاالختبار نتائج من التحقق تم. اإلسماعيليةفي الرملية التربة فيالمنفذ الخازوق االبري سلوك دراسة هو هذه الورقة من الرئيسي الهدف
المحددة بالعناصر التحليل برنامج باستخدام عدديا الصخرية للتربة األمريكية المتحدة الواليات فيالمنفذة للخوازيق االبرية الحقلية
(ABAQUS) . النتائج العددية . اإلسماعيلية منطقة في الرملية التربة في المنفذ الخازوق االبري تحليلل برنامجال هذا استخدام تم ثمومن
حقليةبدال من االختبارات ال الخوازويق االبريةسلوك ب. النموذج المختار هو جيد للتنبؤ يةنتائج الحقلالالتي تم الحصول عليها قريبة جدا من
(الرملية التربة) اإلسماعيلية فيالمنفذ ةوأظهرت النتائج أن تسليط الحمل المركب على الخازوق االبري. التي تأخذ المزيد من الوقت والتكلفة
بنسبةللخازوق االبري قطرال زيادة تأثير. فقطمقارنة مع تسليط الحمل الجانبي وعزم االنحناء ةالجانبي االزاحة في التقليل يؤدي إلى
بنسبة المحوري التصميمي الحمل وزيادة 22]٪[ يقلل االزاحة المحورية بمقدار في التحميل المحوري ميكروبيل سلوك علىيؤثر 50]٪[
]٪[ بنسبة الجانبي التصميمي الحمل ويزيد 43.5]٪[ بنسبة قلت ةالجانبي االزاحة أن إلى الجانبي التحميلفي نتائجال وتظهر. 30 ]٪[
ويزيد 40.4 ]٪[ بنسبة قلت ةالجانبي االزاحة أن المركب التحميل نتائج وتظهر. 192.4 ]٪[ بمقدار يزيد االنحناء عزم أن حين في ، 35.1
ومخططات توجيهية مبادئ الدراسة تقدم كما. 292 ]٪[بمقدار يزيد االنحناء عزم أن حين في،]٪[ 41 بنسبة الجانبيالتصميمي الحمل
.الحمل من مختلفة ألنواع مماثلة لمواقع
1. INTRODUCTION Micropiles are defined in geotechnical engineering
as a small-diameter pile, grouted after drilling the
pile, the commonly used diameter of micropile
range between 100 to 300 [mm], and the length of
micropiles range between 5 to 30 m. It is slender in
nature, having a small diameter to length ratio,
finishing in a majority of load transfer to the soil
depending on friction along the surface of the pile
for capacity, resulting in design as a friction pile,
the micropiles can withstand axial and lateral loads.
(FHWA [1]). Micropiles used their debut as a
lower cost suitable way to retrofit existing old
historical buildings. In the middle of the last
century, the use of micropiles has increased in most
parts of the world. It can be used in new innovative
ways in the last 20 to 25 years for small bridges,
buildings in congested areas, slope stability, seismic
remediation, electrical towers, residential
construction. It can support both axial and lateral
loads (combined loading) beneath structures. The
use of micropiles in more of these situations is
relatively new. Micropiles alluring in hard boring
zone and comprise of any blend of grout, rebar,
empty bar, steel stick, and steel packaging. The
grout is either placed or infused under weight
around 0.8 to 1 [MPa]. Micropile has many names
such as stick heaps, minipiles, needle heaps, root
heaps, and grating (FHWA [1]).
2. MODELING OF MATERIAL
Port Said Engineering Research Journal Faculty of Engineering - Port Said University
Volume 22 No. 1 March 2018 pp. 90:100

91
The numerical study of this research has been
carried out by the program ABAQUS, which can
analyze micropiles and different types of soil using
different subsoil models. In the analysis, 3-D finite
element model for the micropiles and soil are used.
The model cannot be simulated as two-dimensional
as long as there is a lateral load and the model must
be treated using a three-dimensional analysis
(Helwany [2]). The micropile model consists of two
basic materials (steel and grout). The steel casing is
modeled as linear elastic behavior described by the
Poison's ratio of 0.25 and Young's modulus of
2000000[MPa].The soil is modeled as elasto-plastic
model. The Mohr-Coulomb is a part of the
constitutive soil model. Two types of soils are
studied, the first site is the state of Missouri in the
United States of America constructed in rocky soil
that consists of two layers: the first layer is stiff to
hard clay and the second layer is shale rocky soil, as
shown in Figure 1. The second site in Egypt at
Ismailia which contains sandy soil, consists of four
layers: the first and the second layers are medium
dense sand, the third layer is medium to fine loose
sand and the forth layer is medium dense sand as
shown in Figure 2. The interaction between the
outer side of the micropile (casing and bond) is
designed on friction values is simulated using
penalty-type interface between the casing and the
soil on the one hand and between bond and soil on
the other hand. Different friction coefficients are
used in micropile ranging from (0.47 to 0.6). The
interaction between the outer side of the micropile
(casing and bond) is designed on friction values is
simulated using penalty-type interface between the
casing and the soil on the one hand and between
bond and soil on the other hand. Different friction
coefficients are used in this case ranging between
(0.23 to 0.45). The grouted material is modeled as
linear elastic behavior described by the Poison's
ratio of 0.25 and Young's modulus of 25[MPa].
3.9[m]
3.65[m]
1[m]
3 [m]
9.35 [m]
5.1[m]
Figure 1 Site 1 USA (Rocky soil) Figure 2 Site 2 Ismailia, Eygpt ( Sandy soil)
Notes: γ= unit weight; E= Elastic Modulus; φ = Friction Angle; = Passion's Ratio
The properties of the Micropile are shown in Table 1.
Table 1 Micropile Properties.
Notes: L= length of element; OD= Outer Diameter E= Elastic Modulus; = Passion's Ratio; γ= unit weight
Element L [m] OD [cm] E [MPa] γ [kN/m3]
Cased Zone (Steel) 4.87 17.8 200000 0.2 75.5
Middle grout (concrete) 4.87 15.6 20000 0.25 23.5
Bond Zone (concrete) 3 20 20000 0.25 23.5
4.87[m]
Stiff Clay γ =21 [kN
/m3] E = 25
[Mpa] C= 41.2[KPa]
Shale rock γ =22.7
[kN/m3] E = 59.6
[Mpa]
3[
Dense sand γ =17.7[kN/m3] E = 19 [MPa] φ = 37 [degree] = 0.35
Fine medium dense sand γ =17.2[kN /m3] E = 10[Mpa] φ = 34[degree]
= 0.35
Medium dense
sand γ =16.7[kN /m3] E = 17.5 [MPa]
4.87[
m]
3[m]
Dense sand γ =17.7[kN /m3] E = 19 [Mpa] φ = 37 [degree] = 0.35
casing
casing
Middle
grout
bond
zone bond
zone

92
The ABAQUS symmetry feature is used to reduce
the number of degrees of freedom (DOF) and
consequently the number of elements and the
overall mesh size. Then, The analysis can be
performed on half of the soil and micropile to
reduce the computational time. In this model, the
symmetry is used on the axis which contains the
pile and the line of action of the combined load as
shown in Figure 3. The side distance of the model
should not be less than 50 times the pile diameters
as measured from the center of the pile (Randolph
and Wroth [3]). Helwany made the axisymmetric
model in the ABAQUS program to simulate the
behavior of piles. Vertical distance under micropile
in soil should be greater than 70[%] of the pile
length (Helwany [2]). The model consists of two
parts: the first one is the micropile, while the second
is the soil. The micropile with diameter 0.178[m]
and length 7.87 [m]and the soil is 20 [m] width (in
the x-direction), 10 [m] wide (in the y-direction),
and 13 [m] depth (in the z-direction) as shown in
Figure 4.
Figure 3 Finite element discretization (Elevation)
Figure 4 Finite element discretization (Boundary conditions).
10 [m]
Micropile
Soil
13 [m]
Fixed x-axis
U1=0
Fixed y-axis
U2=0
Fixed(x,y,z) axis
U1=U2=U3=0
Axis of symmetry
10[m]

93
After the geometry model is complete, the mesh is
working through this step. The model consists of
two main parts of the micropile and soil. The
micropile consists of the casing inside concrete and
bar reinforcement, and bond zone having an 8-node
linear brick element. The number of elements of
casing, bond zone, grout and soil are (128,228,352
and 352) respectively, as shown in Figure 3 and
Figure 5
Figure 5 Mesh of (casing, bond zone and grout inside steel
pipe).
3. MODEL VERIFICATION
The numerical model is first verified using the same
micropile model and the same loads the site in the
state of Missouri at United States of America
according to (Kershaw [4]) as shown in Figure 1.
The test results of this research are modeled by
using ABAQUS program are compared with field
results of the (Kershaw [4]). A numerical model
was created to simulate the micropile-loading test
(axial, lateral and combined) in the field test as
shown in Figure 4. The model is symmetric, and
thus half of the model is used in the analysis.
3.1. Axial load results
A load cycle sequence which used in the analysis is
presented in Table 2. The results are shown in
Figure 6 to investigate the behavior of the
micropile. The numerical (dotted) results are
compared with field values (full line).
Table 2 Axial loads sequence FHWA [1]
Axial loads Time [min]
Alignment loads AL 2.5
Cycle 1 0.15 D.L 2.5
0.3 D.L 2.5
0.4 5D.L 2.5
0 1
Cycle 2
0.15 D.L 1
0.4 5D.L 1
0.6 D.L 2.5
0.75 D.L 2.5
0.9 D.L 2.5
1 D.L 2.5
0 1
Cycle 3 0.15 D.L 1
1 D.L 1
1.15 D.L 2.5
1.3 D.L 10
Casing
Bond Zone
Grout
94
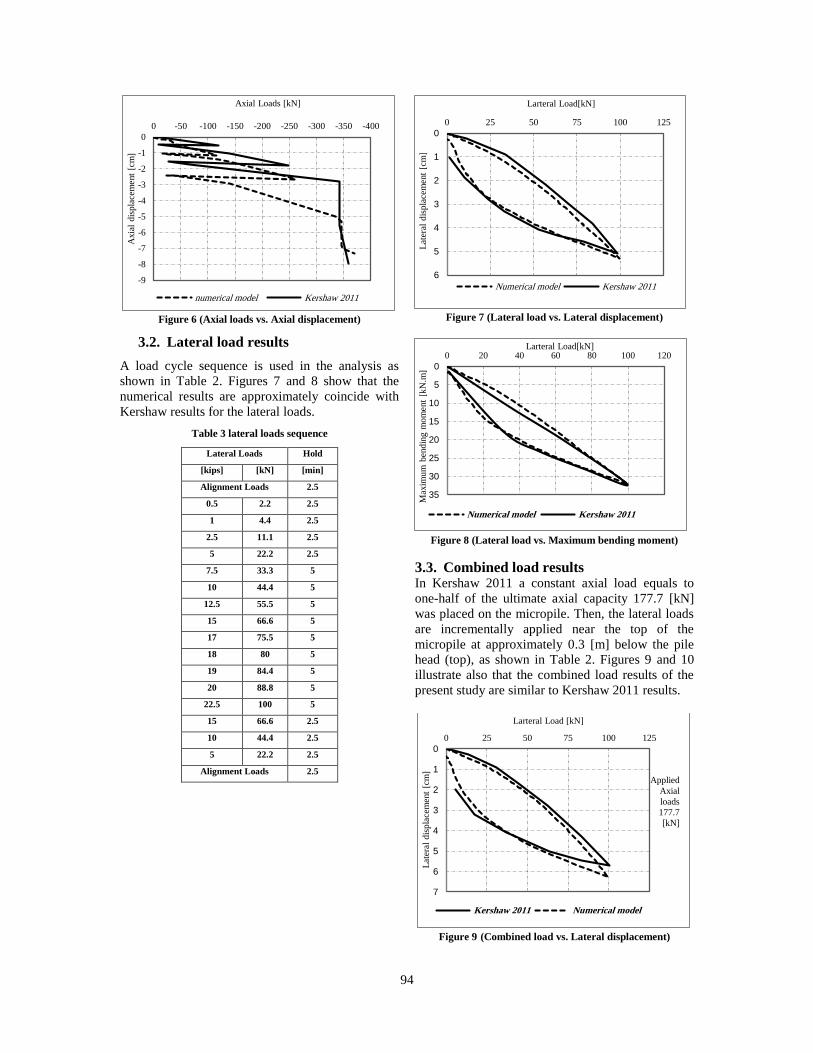
Figure 6 (Axial loads vs. Axial displacement)
3.2. Lateral load results
A load cycle sequence is used in the analysis as
shown in Table 2. Figures 7 and 8 show that the
numerical results are approximately coincide with
Kershaw results for the lateral loads.
Table 3 lateral loads sequence
Lateral Loads Hold
[kips] [kN] [min]
Alignment Loads 2.5
0.5 2.2 2.5
1 4.4 2.5
2.5 11.1 2.5
5 22.2 2.5
7.5 33.3 5
10 44.4 5
12.5 55.5 5
15 66.6 5
17 75.5 5
18 80 5
19 84.4 5
20 88.8 5
22.5 100 5
15 66.6 2.5
10 44.4 2.5
5 22.2 2.5
Alignment Loads 2.5
Figure 7 (Lateral load vs. Lateral displacement)
Figure 8 (Lateral load vs. Maximum bending moment)
3.3. Combined load results In Kershaw 2011 a constant axial load equals to
one-half of the ultimate axial capacity 177.7 [kN]
was placed on the micropile. Then, the lateral loads
are incrementally applied near the top of the
micropile at approximately 0.3 [m] below the pile
head (top), as shown in Table 2. Figures 9 and 10
illustrate also that the combined load results of the
present study are similar to Kershaw 2011 results.
Figure 9 (Combined load vs. Lateral displacement)
-9
-8
-7
-6
-5
-4
-3
-2
-1
0
-400-350-300-250-200-150-100-500A
xia
l dis
pla
cem
ent
[cm
]
Axial Loads [kN]
numerical model Kershaw 2011
0
1
2
3
4
5
6
0 25 50 75 100 125
Lat
eral
dis
pla
cem
ent
[cm
]
Larteral Load[kN]
Numerical model Kershaw 2011
0
5
10
15
20
25
30
35
0 20 40 60 80 100 120
Max
imu
m b
end
ing m
om
ent
[kN
.m]
Larteral Load[kN]
Numerical model Kershaw 2011
0
1
2
3
4
5
6
7
0 25 50 75 100 125
Lat
eral
dis
pla
cem
ent
[cm
]
Larteral Load [kN]
Kershaw 2011 Numerical model
Applied
Axial
loads
177.7
[kN]

95
Figure 10 (Lateral load vs. Maximum bending moment)
4. Numerical Results and Discussion
4.1. Behaviour of the micropile in
Ismailia site (sandy soil) Figure 2 and Table 1 show the plan view and
materials properties of sandy soil and cross section
of Micropile tested in the field (Kershaw [4]). The
numerical model which shown in Figures 3 and 4 is
used in the three dimensional analysis in ABAQUS
program. The load is applied in three conditions,
vertical, lateral and combined loads.
4.1.1. Axial load results
Axial load is applied according to the load sequence
shown in Table 2 The allowable geotechnical bond
capacity of the micropile for axial load of sandy soil
was calculated from equation 1 (FHWA [1]).
PG- allowable = 𝛂 𝐛𝐨𝐧𝐝
𝑭.𝒔 × 𝝅 × Db× Lb …….. 1
where:
αbond = grout to ground ultimate bond strength
FS = factor of safety applied to the ultimate bond
strength; herein, a factor of safety of 2.0
Db = diameter of the drill hole; and
Lb = bond length
The value of α-bond (Grout-to-Ground Bond) for
micropile design for the second and third layer of
the medium dense sand and fine dense sand is equal
to 248 [kPa] for Ismailia site. (FHWA [1]).
In the previous equation, the allowable load of
sandy soil was 160 [kN], then simulated in the
ABAQUS program.
Figure 11 Relation between axial loads and axial
displacement of Micropile in Ismailia site Figure 11 shows the value of the maximum axial
displacement of the micropile in the site of Ismailia
(sandy soil) equals 3.02[cm] when applied the loads
are as presented in Table 2. The allowable load took
place at a total displacement of 0.15 [mm/kN]
(160×0.15) = 2.4 [cm]. The axial allowable load
predicted by (FHWA [1]) and the numerical model
results are shown in Figure 11 and equal to (160,
185.2)[kN] respectively with an increase of 16[%].
4.1.2. Lateral load results Lateral load is applied according to the load
sequence presented in Table 3.
Figure 12 Relation between lateral loads and lateral
displacement of Micropile
Figure 12 shows the failure criteria applied to the
lateral load-displacement curves for the micropile in
Ismailia site. The interpreted failure load of the
micropile according to the failure criteria of Butler
and Hoy (1977) intersection tangent method.
Considering the load at the intersection of tangent
sloping and tangent to the initial straight portion of
the total settlement curve, the approximate ultimate
loads is equal to 52 [kN] and the lateral
displacement is equal to 4 [cm].
-45
-40
-35
-30
-25
-20
-15
-10
-5
0
0 25 50 75 100 125M
axim
um
ben
din
g m
om
ent
[kN
.m]
Larteral Load[kN]
Numerical model Kershaw 2011
Applied
Axial
loads
177.7
[kN]
-3.5
-3
-2.5
-2
-1.5
-1
-0.5
0
-240-200-160-120-80-400
Axia
l dis
pla
cem
ent
[cm
]
Axial Loads[kN]
Numerical model FHWA Method
0
2
4
6
8
10
12
14
16
0 20 40 60 80 100
Lat
eral
dis
pla
cem
ent
[cm
]
Lateral Loads[kN]
Ismailia site (Sandy Soil)

96
Figure 13 Relation between lateral loads and maximum
bending moment of Micropile
Figure 13 shows the relation between the lateral
load and the maximum bending moment of the
micropile. The values of the maximum bending
moment of sandy soil, Ismailia site, is equal to 71.4
[kN.m]. The allowable bending moment of the
micropile for the lateral load of sandy soil is
calculated from equation 2 ( FHWA [1]).
M allowable =0.55Fy * 𝑰
𝑶𝑫/𝟐 …… 2
M allowable = allowable bending moment
I= moment of inertia for casing
OD= Outer Diameter of casing
From the previous equation, the calculated
allowable bending moment is equal to 204.5
[kN.m].
M allowable 204.5 > 71.4 ok .
4.1.3. Combined load results A constant axial load equal to one-half of the
ultimate axial capacity 80 [kN] is applied on the
micropile. Then, the lateral loads are incrementally
applied near the top of the micropile approximately
the lateral loads incrementally applied near the top
of the micropile at approximately 0.3 [m] below the
micropile head, as shown in Table 2.
Figure 14 Relation between combined loads and lateral
displacement of Micropile
Figure 14 shows the failure criteria applied to the
combined load-displacement curves for micropile
in Ismailia site. The interpreted failure load of the
micropile according to the failure criteria of Butler
and Hoy (1977) is the intersection tangent method
(NYSDOT [5]). The load at the intersection of
tangent sloping and tangent to the initial straight
portion of total settlement curve can be
approximately equal to the ultimate load of 50.2
[kN], and lateral displacement is equal to 3.2 [cm].
Figure 15 Relation between combined loads and maximum
moment of Micropile
Figure 15 shows the relation between the combined
loads and the maximum bending moment of the
micropile. The values of the maximum moment is
52.9 [kN.m]. From equation 2, the allowable
bending moment of 204.5 [kN.m] was calculated.
M allowable 204.5 > 52.9 ok.
0
10
20
30
40
50
60
70
80
0 20 40 60 80 100 120
Max
imum
ben
din
g m
om
ent
[kN
.m]
Larteral Loads[kN]
Ismailia Site (Sandy Soil)
0
2
4
6
8
10
12
14
0 20 40 60 80 100
Lat
eral
dis
pla
cem
ent
[cm
]
Lateral Loads[kN]
Ismailia Site (Sandy Soil)
Applied
Axial
loads
80kN
-60
-50
-40
-30
-20
-10
00 20 40 60 80 100 120
Max
imu
m b
end
ing m
om
ent
[kN
.m]
Larteral Loads[kN]
Ismailia (Sandy soil)
Applied
Axial
loads
80kN

97
4.2. Comparison between results of the
lateral and combined loads applied on
the micropile
The main objective of this research is to analyze the
behavior of micropiles in sandy soil. Comparison
between the results is performed to investigate the
effect of axial load on the lateral behavior of
micropiles under the effect of the combined loads.
Figure 16 Lateral and Combined vs. lateral displacement in
Ismailia site
When comparing the results of the lateral load and
combined load versus lateral displacement, the
lateral displacement for both cases was the range (0
to 26) [kN]. The difference in the value of the
lateral displacement clearly begins when the loads
reach 26 [kN]. It's clear that the displacement of the
combined loads is smaller than the displacement of
lateral loads (13.5, 14.7) [cm] respectively by
approximately 8.1[%].
Figure 17 Lateral and Combined Load vs. Maximum
Bending Moment in Ismailia site
As illustrated in the Figure 17, the difference
between the maximum bending moments in case of
the lateral and combined loading is equal to (71.4
and 52.9) [kN.m] respectively. These results were
expected because the results of lateral displacement
versus combined loads and lateral loads
respectively, as shown in Figure 16, was the
displacement of combined loads smaller than the
displacement of lateral loads because the maximum
bending moment is depending on the lateral
displacement.
Finally, results in Figure 16 and 17 show that
combined loading, causes reduction in lateral
displacement and moment compared to the lateral
loading.
4.3. Effect of applied lateral and combined
loads on moment along micropile
depth For a comprehensive study of the micropile, the
percentage of the lateral and combined loads is
increased. The maximum bending moments at
various depths are calculated to determine the
critical depth of the micropile at which the
maximum bending moment takes place.
4.3.1. Effect of lateral load value on moment
versus depth
Figure 18 (Moment vs. Depth) due to lateral load
When applying a lateral load of 22.6 [kN], as shown
in Figure 18, it is noticed that the magnitude of the
bending moment is equal to zero at the depth of
0.3[m]. At a depth of 1.22 [m] the value begins to
increase, and at a depth of 2.74[m] till reaching the
peak, then decreases. When the load is increased
from 22.6 to 97.7 [kN], the maximum bending
moment at depth 2.74[m] in the sandy soil of the
Ismailia increases to 59.9 [kN.m], as shown in
0
2
4
6
8
10
12
14
16
0 20 40 60 80 100 120
Lat
eral
dis
pla
cem
ent
[cm
]
Lateral Loads[kN]
Micropile Combined loadsMicropile Lateral loads
0
10
20
30
40
50
60
70
80
0 20 40 60 80 100 120
Max
imum
ben
din
g m
om
ent
[kN
.m]
Larteral Loads[kN]
Micropile Combinedl Loads
Micropile Lateral Loads
0
0.5
1
1.5
2
2.5
3
3.5
4
4.5
5
0 20 40 60
Dep
th o
f M
oic
rop
ile[
m]
Bending moment [kN.m]
Lateral loads (22.6 kN) Lateral loads (45.3 kN)
Lateral loads (66.2 kN) Lateral loads (77.3 kN)
Lateral loadst (97.7 kN)

98
Figure 18. This increase in the bending moment in
the sandy soil of the curved distribution is
acceptable because it is less than the allowable
bending moment of the micropile section.
M allowable 204.5 > 59.9 ok.
4.3.2. Effect of combined value load on
moment versus depth
Figure 19 (Moment vs. Depth) due to combined load
When applying a lateral load of 21.3 [kN] as shown
in Figure 19, it can observed that the magnitude of
the bending moment equals to zero at the depth of
0.3[m], and the value begins to increase from
1.2[m] to 2.74[m] until it reaches the peak and then
decrease until it reaches close to zero at 4.87 [m]
and 7.87[m] depth.
When the load is increased from 21.3 to 108 [kN],
the maximum bending moment at depth 2.74[m] in
the sandy soil of the Ismailia increases to
46.8[kN.m], as shown in Figure 17. This increase in
the bending moment in the sandy soil of the curved
distribution is acceptable because it is less than the
allowable bending moment of the micropile
structural section.
M allowable 204.5 > 46.8 ok
Figure 20 Maximum moment vs. Various combined loads
When comparing the lateral and combined loads
versus maximum bending moments, Figure (20)
shows that the maximum bending moment that the
maximum bending moments for the cases of lateral
and combined loading are equal to (59.9 and
46.8)[kN.m] respectively. These results were
expected because of the difference between the
calculated lateral displacements in both cases, as
presented in Figure (16).
4.4. Effect of micropiles diameter In this section the diameter of the micropile
increased from 0.178[m] to 0.27[m] or increased by
50[%] for sandy soils. Then comparison between
the results of each case is presented herein below:
4.4.1. Axial load results The Micropile is simulated by the ABAQUS
program under the effect of axial cycle load as in
Table 2 in sandy soil for the same specifications as
Kershaw 2011 except the diameter are increase by
50[%].
Figure 21 Relation between axial loads and axial
displacement of Micropile (Ismailia Site)
Figure 21 illustrates the axial displacement versus
axial load at the micropile head after changing the
micropile diameter. In Ismailia site at diameter of
0.178[m], [0.27[m] the axial displacements are
0
1
2
3
4
5
6
7
8
0 10 20 30 40 50
Dep
th o
f M
oic
rop
ile[
m]
Bending moment [kN.m]
Egypt (21.3 kN) Egypt (44 kN)
Egypt (60 kN) Egypt (79.5 kN)
Egypt (108 kN)
0
10
20
30
40
50
60
70
21.3[kN] 44[kN] 60[kN] 79[kN] 108[kN]
Max
imum
ben
din
g m
om
ent[
kN
.m]
Combined Loads [kN]
Combined Loads Lateral oads
-3.5
-3
-2.5
-2
-1.5
-1
-0.5
0
-250-200-150-100-500
Axia
l dis
pla
cem
ent
[cm
]
Axial Loads[kN]
Diameter 0.178[m] Diameter 0.27[m]

99
equal to 2.57 [cm], 2 [cm] respectively. It can be
observed that at an axial of displacement 2.25 [cm]
the loads increased from 160[kN] to 208[kN] when
increasing the diameter from 0.178[m] to 0.27[m].
These results show that when the micropile
diameter is increased by 50[%], the axial
displacement decreases by 22[%] and the load
increases by 30 [%] at a displacement of 2[cm].
4.4.2. Lateral load results The micropile is modeled by the ABAQUS program
under the effect of lateral cyclic load, as presented
in Table 3, for the same micropile configuration
used in Kershaw 2011 except for increasing the
diameter by 50[%].
Figure 22 Relation between lateral loads and lateral
displacement of Micropile (Ismailia Site)
Figure 22 illustrates that the lateral displacement
versus lateral load for the micropile after changing
the diameter of the micropile. In Ismailia site at
diameter 0.178 [m], and 0.27 [m] the lateral
displacements are equal to 14.7 [cm], 8.3 [cm]
respectively. It can observed that at a lateral
displacement of 8.3 [cm] the loads increased from
73.9 [kN] to 99.9 [kN] when increasing the diameter
from 0.178 [m] to 0.27 [m]. In addition, when the
diameter is increased by 50[%], the lateral
displacement decreases by 43.5[%] and the load
increases by 35.1[%] at 8.3 [cm].
Figure 23 Relation between lateral loads and maximum
bending moment of Micropile (Ismailia Site)
Figure 23 shows the relation between the lateral
loads and the maximum bending moment at the
micropile after changing the diameter of the
Micropile. In Ismailia site at diameter 0.178[m],
0.27[m] the maximum bending moments are equal to
71.4 [kN.m], 208.8 [kN.m] respectively. However,
when the diameter is increased by 50[%], at load of
100[kN] the maximum bending moment decreases
by 192.4[%].
From equation 2, the allowable bending moment is
equal to 204.5 [kN.m].
M allowable 204.5 < 208.8 Not ok.
This increase in the bending moment in the sandy
soil requires changing the micropile properties to
resist the large bending moment. Thus, an increased
thickness in addition to steel reinforcement inside
the casing is needed to resist the relatively large
bending moments resulting from the diameter
change.
4.4.3. Combined load results The micropile was modeled by the ABAQUS
program under the effect of axial load of 80[kN]
which is held constant and then incrementally
applying the lateral loads near the top of the
Micropile approximately 0.3[m] below the
micropile head, as shown in Table 3 using the same
configurations studied in Kershaw 2011, except for
increasing the diameter by 50[%].
Figure 24 Relation between combined loads and lateral
displacement of Micropile (Ismailia Site) .
Figure 24 shows the relation between the lateral
displacement and combined load for the micropile
after changing its diameter. In Ismailia site
changing the diameter from 0.178[m] to 0.27[m] the
computed lateral displacements are equal to 12.6
[cm] and 7.5 [cm] respectively. It can observed that
at lateral displacement of 7.5 [cm] the loads
increased from 70.9 [kN] to 99.9 [kN]and the lateral
displacement is reduced by 40.4[%] and the load is
increased by 41[%] at lateral displacement of 7.5
[cm].
0
2
4
6
8
10
12
14
16
0 20 40 60 80 100 120
Lat
eral
dis
pla
cem
ent
[cm
]
Lateral Loads[kN]
Diameter 0.27[m] Diameter 0.178[m]
0
25
50
75
100
125
150
175
200
225
0 20 40 60 80 100 120
Max
imum
ben
din
g m
om
ent
[kN
.m]
Larteral Loads[kN]
Diameter 0.27[m] Diameter 0.178[m]
0
2
4
6
8
10
12
14
16
0 25 50 75 100 125
Lat
eral
dis
pla
cem
ent
[cm
]
Lateral Loads[kN]
Diameter 0.27[m] Diameter 0.178[m]
Axial
loads
80kN

100
Figure 25 Relation between combined loads and maximum
bending moment of Micropile (Ismailia Site).
Figure 25 illustrates the combined loads versus
maximum bending moments at the micropile after
changing the diameter of the micropile. Increasing
the diameter from 0.178[m] to 0.27[m] resulted in
increasing the maximum bending moment from 52.9
[kN.m] to 207.4 [kN.m] respectively. In addition,
increasing the diameter by 50[%], at loads 100[kN]
the maximum bending moment is decreased by
292[%].
M allowable 204.5 < 207.4 Not ok.
This increase in the bending moment in the sandy
soil requires changing the micropile properties to
resist the larger bending moment. In other words, the
casing thickness should be increased in addition to
adding steel reinforcement inside the casing.
5. Conclusions
1. ABAQUS software was capable of simulating
the micropile field tests performed by ( FHWA
[1]).regarding the axial behavior. In addition the
software was capable of accurate simulation of
the lateral displacements and bending moments
under lateral loads, and of the lateral
displacements and bending moments under the
combined axial and lateral loads.
2. For micropile in Ismailia site (sandy soil), the
applied combined load has noticeable effect on
lateral micropile behavior. The observed
changes are reductions in the lateral
displacement by 14.2[%] and bending moment
by 26[%] compared to the lateral load tests as in
(Klein and Karavaev [6]), ( Karasev, Talanov
[7]), (RAMASAMY [8]), ( Saxena [9]), and (
Jain, Ranjan [10]).
3. Changing the micropile diameter from 0.178[m]
to 0.27[m] in the Ismailia site (sandy soil)
resulted in reducing the axial displacement by
22 [%] and increasing the axial ultimate load by
30[%] at the least displacement.
4. The lateral loading results indicated that the
lateral displacement is reduced by 43.5[%] and
the lateral ultimate load is increased by 35.1[%],
and the maximum bending moment is increased
by 192.4[%].
5. The combined loading results showed that the
lateral displacement is reduced by 40.4 [%] and
the lateral ultimate load is increased by 41[%],
but the change in the maximum bending
moment is increased by 292[%].
The increased bending moments along the micropile
section may need increasing the steel casing
thickness and adding steel reinforcement bars inside
the casing.
Reference 1. FHWA, N., Micropile design and
construction—Reference manual. 2005, FHWA.
2. Helwany, S., Applied soil mechanics with
ABAQUS applications. 2007: John Wiley &
Sons.
3. Randolph, M.F. and C.P. Wroth, Analysis of
deformation of vertically loaded piles. Journal
of Geotechnical and Geoenvironmental
Engineering, 1978. 104(ASCE 14262).
4. Kershaw, K.A., Micropile response to
combined loading. 2011: Missouri University of
Science and Technology.
5. NYSDOT, State of New York Department of
Transportation 2008. Standard Specifications.
Albany, New York 12232.p 1068. . 2008.
6. Klein, G. and V. Karavaev, Design of
reinforced-concrete piles for vertical and
horizontal loading. Soil Mechanics and
Foundation Engineering, 1979. 16(6): p. 321-
324.
7. Karasev, O., G. Talanov, and S. Benda,
Investigation of the work of single situ-cast
piles under different load combinations. Soil
Mechanics and Foundation Engineering, 1977.
14(3): p. 173-177.
8. RAMASAMY, G., NIRMAL KUMAR JAIN",
GOPAL RANJAN. FITTI, 1987. 18: p. 185.
9. Saxena, P.K., PREDICTION AND
PERFORMANCE OF LATERAL LOAD-
DEFLECTION BEHAVIOUR OF PILES. 1982.
10. Jain, N., G. Ranjan, and G. Ramasamy, Effect
of vertical load on flexural behaviour of piles.
Geotechnical Engineering, 1987. 18(2).
-250
-200
-150
-100
-50
0
0 25 50 75 100 125
Max
imum
ben
din
g m
om
ent
[kN
.m]
Larteral Loads[kN]
Diameter 0.27[m]
Axial
loads
177.7
kN