port state control 2002 report · 2019-03-07 · annex annex 1 - list of ships detained in 2002 21...
TRANSCRIPT

PSCAustraliaPort State Control
2002 ReportAustralian MaritimeSafety Authority
AMSA

2002 Port State Control Report
i
2002
PORT STATE CONTROL REPORT
Australia
������
����
��������
�� ���������
������������������
��������
��������
���������
������������
��� ��
���������
���������
�������

2002 Port State Control Report
ii
©Australian Maritime Safety Authority
This work is copyright. It may be reproduced in whole or part subject to the inclusion of anacknowledgment of the source, but not for commercial usage or sale.
Further information may be obtained from:The General ManagerMaritime OperationsAustralian Maritime Safety AuthorityGPO Box 2181,Canberra ACT 2601,AUSTRALIA
Telephone +61 2 6279 5069Facsimile +61 2 6279 5071
This Report is also available at AMSA website - www.amsa.gov.au/psc
AMSA detention data is available at www.amsa.gov.au/sp/shipdet/sdetlink.htm
ISSN 1033-2499
Copy/design/typeset: Australian Maritime Safety Authority

2002 Port State Control Report
iii
Welcome to the 2002 AMSA port State control annual report. 2002 was another very active year forport State control in Australia and once again it was demonstrated that some ship owners, flag Statesand Classification Societies are still unable or unwilling to fulfil all of their obligations under theinternational conventions intended to protect people’s lives and the marine environment.
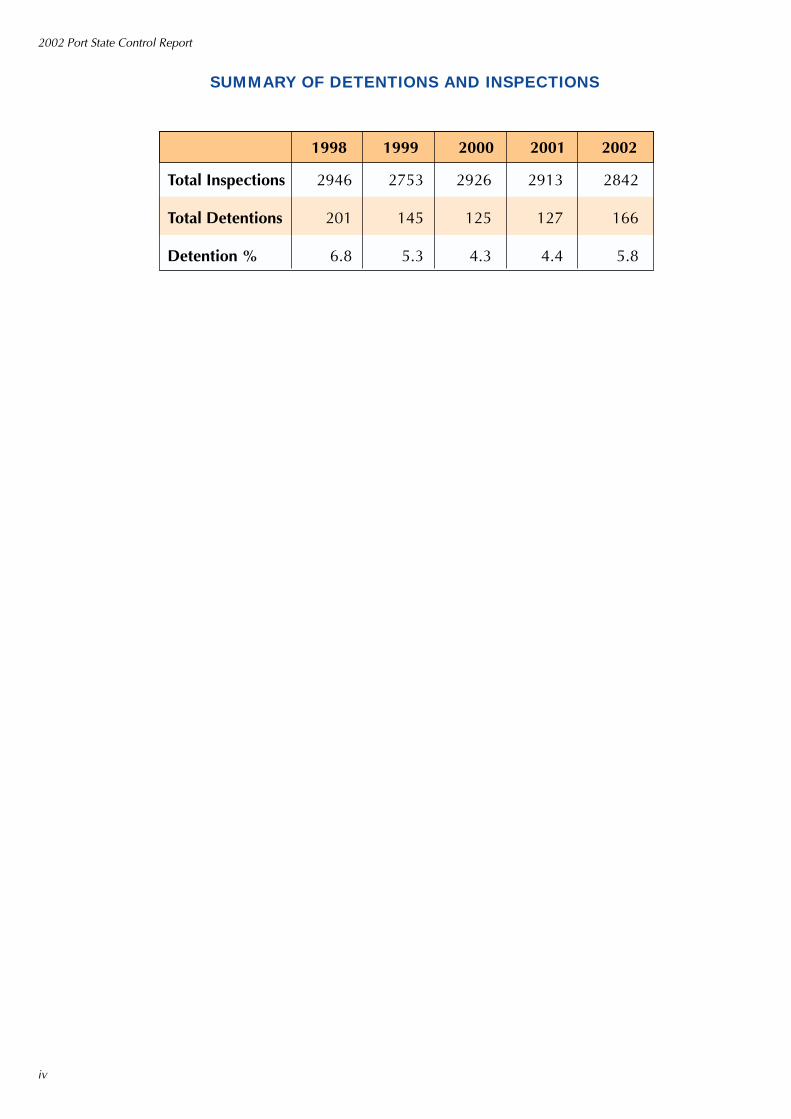
During 2002, 2842 inspections were carried out on foreign flag ships, which resulted in 166 detentions.This represents a detention rate of 5.8% which is an increase of 1.4% when compared to the previousyear’s rate of 4.4%. However, we do not believe that this is due to a decrease in the quality of shipscalling at Australian ports; on the contrary, the average number of deficiencies found per inspectioncontinues to decrease.
Instead, we attribute the increase in detention rate to several factors, which are outlined in detail in thebody of this report, but include:
• The full implementation of the STCW Convention (as amended in 1995) requirements for seafarercertification to be recognised by the flag State of the ship on which the seafarer is serving. Despitethe long transitional period allowed under this Convention, and a further amnesty granted by portState control authorities around the world, many ships were still found to have officers on boardnot in compliance with this requirement;
• The continuation of AMSA’s Focused Inspection Campaign on areas of concern; and
• Further concentration of AMSA inspection resources towards ships considered to pose a higher risk.
World events, such as the loss of the tanker Prestige off Spain and subsequent worldwide reaction, areclosely monitored by AMSA in order to assess how these may impact upon Australia. AMSA willcontinue to respond as necessary to such events and in the case of the Prestige, has taken severalmeasures including raising the inspection rate for single hull oil tankers to 100%.
AMSA continues to devote considerable resources to its port State control program in the form ofpersonnel, training, information systems and contributions to regional agreements on port State control.The objective remains the eradication of substandard shipping. To this end, AMSA also continues toexamine the statistics related to port State control in Australia in order to continually assess theeffectiveness of the program and identify areas where we can improve performance.
Clive DavidsonChief Executive OfficerAustralian Maritime Safety AuthorityMay 2003
PREFACE
2002 Port State Control Report
iv
SUMMARY OF DETENTIONS AND INSPECTIONS
1998 1999 2000 2001 2002
Total Inspections 2946 2753 2926 2913 2842
Total Detentions 201 145 125 127 166
Detention % 6.8 5.3 4.3 4.4 5.8

2002 Port State Control Report
v
Overview
Port State Control - Application 1Port State Control in Australia 1
PSC Training 2Flag State Inspections in Australia 3
Port State Control - International Perspective 3
2002 port State control task
Foreign Flag Shipping Activity 5
Ship Types 5Flag Profile 5
Risk Profile of the Foreign Fleet 6Inspection Rates 6
Inspection Results 8Deficiencies 9
Detentions 11Detention Rate 12
Responsibility of Recognised Organisations for detainable deficiencies 13
Figures
Figure 1 - Foreign flag ships visiting Australia in 2002 by type 5
Figure 2 - Foreign ships flag profile 5Figure 3 - Foreign fleet age profile 6Figure 4 - Age profile of ships arriving and inspected in Australia 7
Figure 5 - Number of inspections 9Figure 6 - Average number of deficiencies per inspection 10
Figure 7 - Deficiencies as a percentage of detentions 11Figure 8 - Impact of the Focused Inspection Campaigne (FIC) on detentions 13
Figure 9 - Percentage of ships inspected compared with percentage of ships detained - by ship type 13
Tables
Table 1 - Total ships inspected by port 15
Table 2 -Total ships inspected by flag State 16Table 3 - Total ships inspected by type of ship 17
Table 4 - Totals and percentage of deficiency categories 17Table 5 - Certification and Watchkeeping for seafarers 18
Table 6 - MARPOL Annex I 18Table 7 - Radio Communications 18
Table 8 - SOLAS related operational deficiencies 19Table 9 - Total ships detained by Ship Type 19
Table 10 - Total ships detained by flag 20
AnnexAnnex 1 - List of ships detained in 2002 21
CONTENTS

2002 Port State Control Report
1
OVERVIEW
Port State Control - Application
A number of international maritime conventions adopted by the International Maritime
Organization (IMO) and the International Labour Organization (ILO) provide nations
with the instruments to conduct control inspections of foreign ships visiting their ports.
These inspections are called port State control (PSC) inspections.
Port State control is the regime under which the Australian Maritime Safety Authority
(AMSA) inspects foreign ships visiting Australian ports to ensure they comply with
internationally accepted standards. This plays an important part in identifying and
then eliminating sub-standard ships from Australian waters.
When shipowners, Classification Societies and flag State administrations have failed
to comply with the requirements of the international conventions, port State control
comes into effect. PSC inspections are conducted to verify that foreign ships are
seaworthy, do not pose a pollution risk, provide a healthy and safe working environment
and comply with the relevant conventions.
Under international law, it is the responsibility of the flag State to ensure that all ships
flying its flag meet the applicable international standards. Port State control complements
the responsibility of the flag State; it does not replace it.
Port State Control in Australia
In Australia, AMSA has the responsibility for conducting PSC inspections in Australian
ports. There are 14 ports permanently manned by 40 AMSA surveyors. These surveyors
undertake PSC inspections and other duties related to ship safety and protection of the
marine environment. In addition there are 65 other ports, that are not permanently
manned by AMSA surveyors, where PSC inspections are regularly carried out. A list of
63 of these ports is presented later in this report showing the number of ships inspected
in each port by AMSA surveyors during the 2002 calendar year.
AMSA’s objective is to inspect at least 50% of foreign ships visiting Australian ports.
The percentage is based on the number of “eligible” ships visiting Australian ports
during a given year. For this purpose, an “eligible” ship means one that has not been
inspected by AMSA during the six months immediately preceding its date of arrival at
an Australian port. In the case of tankers of 15 years of age or over and for all passenger
ships, this period is three months. In achieving this inspection level, eligible ships are
selected for inspection on the basis of assessed risk that a particular ship would be
found unseaworthy.
Briefly, when undertaking a PSC inspection, the surveyor initially verifies that the vessel
has valid certificates and documents on board, as required under the international
conventions for the voyage in question. In addition, surveyors use a standard initial
checklist and inspect critical areas essential for the safe operation of the ship. This approach
allows the surveyor to gain the necessary overall impression of the vessel’s condition.
Where certification is invalid, or there are clear grounds to suspect that the ship and/
or its equipment or crew may substantially not comply with the relevant requirements,
a more detailed inspection may be undertaken.
2002 Port State Control Report
2
During the inspection, details are recorded in a unique Ship Inspection Record (SIR) Book,
which also contains guidelines, checklists and forms required for an inspection. The
guidance and initial checklist provides the baseline standard for conducting PSC inspections.
Beyond this, surveyors also utilise their professional judgement to determine the extent to
which a ship needs to be inspected following the initial inspection. Included in the SIR
Book is a specific section covering tanker inspections. The SIR Book forms the basis for
information to be transferred to the AMSA ship inspection database (Shipsys). The
information from the database is readily available at computer terminals in all AMSA
offices for immediate access by administration and survey staff. During 2002, Shipsys was
enhanced through active information exchange with the Asia Pacific Computer Information
System (APCIS), operated by the Tokyo MOU. Interested parties may view PSC inspection
results from all member countries through the Tokyo MOU website at www.tmou.org
PSC Training
To meet AMSA’s objectives, considerable resources are directed towards training.
A structured training scheme requires all newly recruited AMSA surveyors to receive PSC
training at the commencement of their service. Existing surveyors are given periodic
refresher training. As part of this ongoing training, all AMSA surveyors attended workshops
during 2002 to promote a uniform approach to PSC inspections. At these workshops,
new ideas were exchanged and surveyor knowledge updated to reflect recent changes to
SOLAS, MARPOL and related IMO Codes. A system of surveyor interchange between
AMSA regional offices was explored and a program has been instigated to allow surveyors
to spend time in another region to expand their PSC inspection experience. It is intended
that this exchange program will be completed by all surveyors over a period of two to
three years.
Other outcomes from the workshop included a totally revised SIR Book and ideas for
enhancements to Shipsys. In addition positive discussion was held on the continuation of
the Focussed Inspection Campaigns (FIC). Additional AMSA specific training is being
structured for all surveyors to ensure the effectiveness of the campaigns.
To remain up-to-date with current legislation and technology, AMSA maintains an intranet
surveyor information system that is an integral part of its management system. During
2002 the AMSA intranet was redeveloped. Reference materials available include the
Navigation Act 1912, Marine Orders, Instructions To Surveyors, IMO Resolutions, Circulars
and Conventions. This method of promulgation of reference material keeps AMSA
surveyors’ knowledge current and also solves a quality management issue by ensuring
controlled versions of documents are available at all AMSA offices simultaneously around
the country.
AMSA also operates an external website at www.amsa.gov.au for the interest of other
parties. Port State control information is available here and includes topics such as statistics,
annual reports, focussed inspection campaigns and up-to-date monthly ship detention
lists.
Conscious of the need to actively monitor its PSC activities, AMSA ensures it is performing
in the most effective and efficient manner by continuous auditing. All AMSA office
administrative and survey staff are subjected to periodic audits. The PSC auditing program
2002 Port State Control Report
3
plays a vital role in monitoring AMSA surveyors’ PSC inspection activities and has
been developed to support and reinforce the objectives of the PSC training program.
PSC auditors are Senior Surveyors selected from regional offices and tasked with
auditing areas outside of their own regions. Similarly, a group of PSC trainers are
selected from experienced surveyors in the regional offices to train new and existing
surveyors to maintain consistency in decision making and in actions taken. The ultimate
goal is that all AMSA surveyors properly follow AMSA procedures when conducting
PSC inspections in a consistent and uniform manner.
Flag State Inspections in Australia
Flag State inspections are carried out on Australian ships in the same manner and
with the same frequency as port State control inspections. Australia has delegated
statutory surveys required under the various maritime conventions for ships under its
flag to six prominent Classification Societies (“Recognised Organisations”) with which
it has written agreements which clearly define roles and responsibilities of all parties.
These agreements conform to the model recommended by IMO. Several strategies
are employed by AMSA to ensure that Australian flagged ships continue to meet the
necessary standards:
• Periodic audits are undertaken by AMSA auditors on these six Recognised
Organisations.
• In the terms of the ISM Code, AMSA retains sole responsibility for and carries out
necessary audits of the safety management systems of Australian ship owners and
operators.
• Flag State inspections not only cover the same areas as PSC inspections, but also
incorporate the requirements of AMSA’s role as the Inspectorate under the
Occupational Health and Safety (Maritime Industry) Act 1993.
• When a vessel is found to be unseaworthy it is detained in the same manner as a
PSC detention.
Port State Control - International Perspective
Regional Port State Control
Australia conducts a PSC program that complies with both the spirit and the intent of
the control provisions contained within the relevant international conventions. In
addition to complying with Australian Government safety objectives, AMSA’s PSC
program also focuses on the aims of the Asia-Pacific and Indian Ocean Memoranda
of Understanding on Port State Control, which join the major maritime nations in the
Asia-Pacific and Indian Ocean regions to common PSC strategies through the operation
of uniform and consistent PSC programs.
Success and experience gained from member states which are participating in the
various memoranda of understanding on port State control, has confirmed that more
effectiveness can be gained from regional cooperation. The IMO Assembly Resolution
A.682(17) “Regional Cooperation in the Control of Ships and discharges” recognises
this fact. Identification of unsafe ships and rectification of serious defects before
departure has led to reduced risks posed by substandard ships around the world.
2002 Port State Control Report
4
Since the Paris MOU entered into effect in the early 1980s and the IMO adopted Resolution
A.682(17), port State control has gradually made significant developments. These
developments have been achieved through the dedicated commitments of responsible
maritime Authorities implementing port State control activities. Port State control is now
widely accepted as a major driving force in maritime safety and an effective method for
combating the risks posed by substandard ships. At present there are eight regional PSC
agreements in existence and Australia is an active participant of both the Indian Ocean
MOU and the Tokyo MOU.
2002 Port State Control Report
5
Foreign Flag Shipping Activity
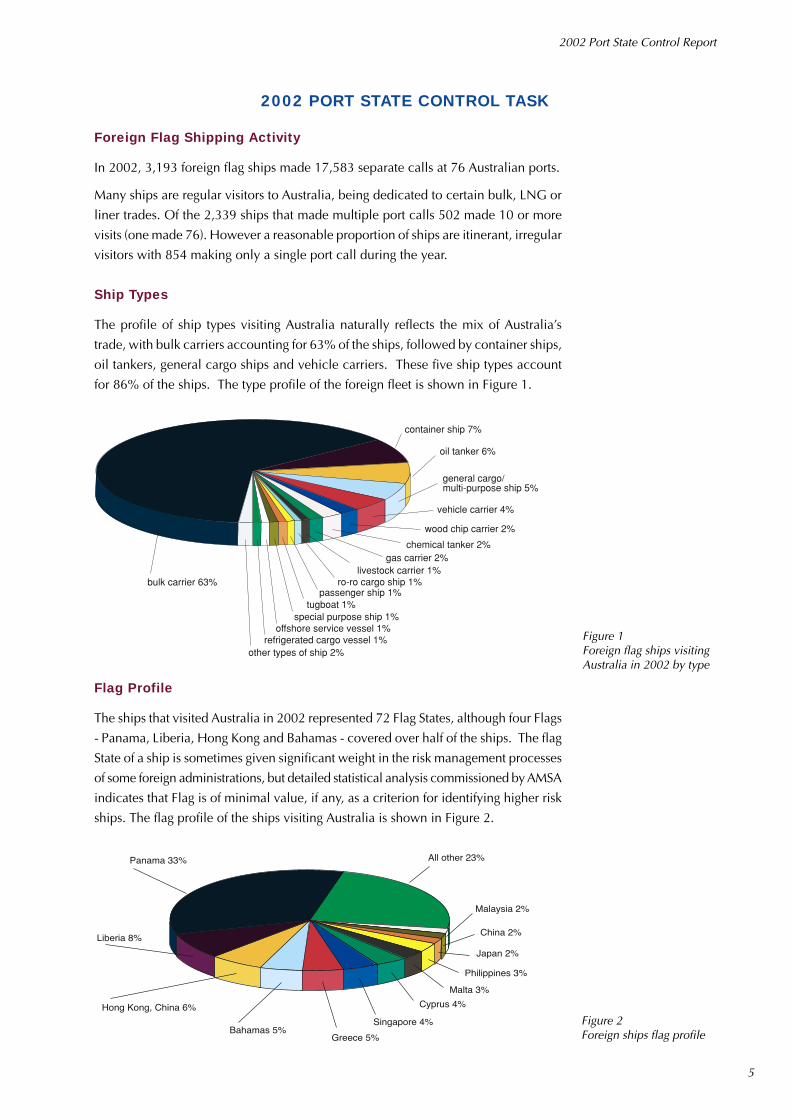
In 2002, 3,193 foreign flag ships made 17,583 separate calls at 76 Australian ports.
Many ships are regular visitors to Australia, being dedicated to certain bulk, LNG or
liner trades. Of the 2,339 ships that made multiple port calls 502 made 10 or more
visits (one made 76). However a reasonable proportion of ships are itinerant, irregular
visitors with 854 making only a single port call during the year.
Ship Types
The profile of ship types visiting Australia naturally reflects the mix of Australia’s
trade, with bulk carriers accounting for 63% of the ships, followed by container ships,
oil tankers, general cargo ships and vehicle carriers. These five ship types account
for 86% of the ships. The type profile of the foreign fleet is shown in Figure 1.
oil tanker 6%
general cargo/multi-purpose ship 5%
vehicle carrier 4%
wood chip carrier 2%
chemical tanker 2%gas carrier 2%
livestock carrier 1%ro-ro cargo ship 1%
passenger ship 1%tugboat 1%
special purpose ship 1%offshore service vessel 1%
refrigerated cargo vessel 1%other types of ship 2%
bulk carrier 63%
container ship 7%
Figure 1Foreign flag ships visitingAustralia in 2002 by type
Flag Profile
The ships that visited Australia in 2002 represented 72 Flag States, although four Flags
- Panama, Liberia, Hong Kong and Bahamas - covered over half of the ships. The flag
State of a ship is sometimes given significant weight in the risk management processes
of some foreign administrations, but detailed statistical analysis commissioned by AMSA
indicates that Flag is of minimal value, if any, as a criterion for identifying higher risk
ships. The flag profile of the ships visiting Australia is shown in Figure 2.
���������� ���� �����
����������
��������
��������
�������� ����
�������
���������
������� ���
�� � �������������
����!��"�������#�
$�& ����'�
Figure 2Foreign ships flag profile
2002 PORT STATE CONTROL TASK
2002 Port State Control Report
6
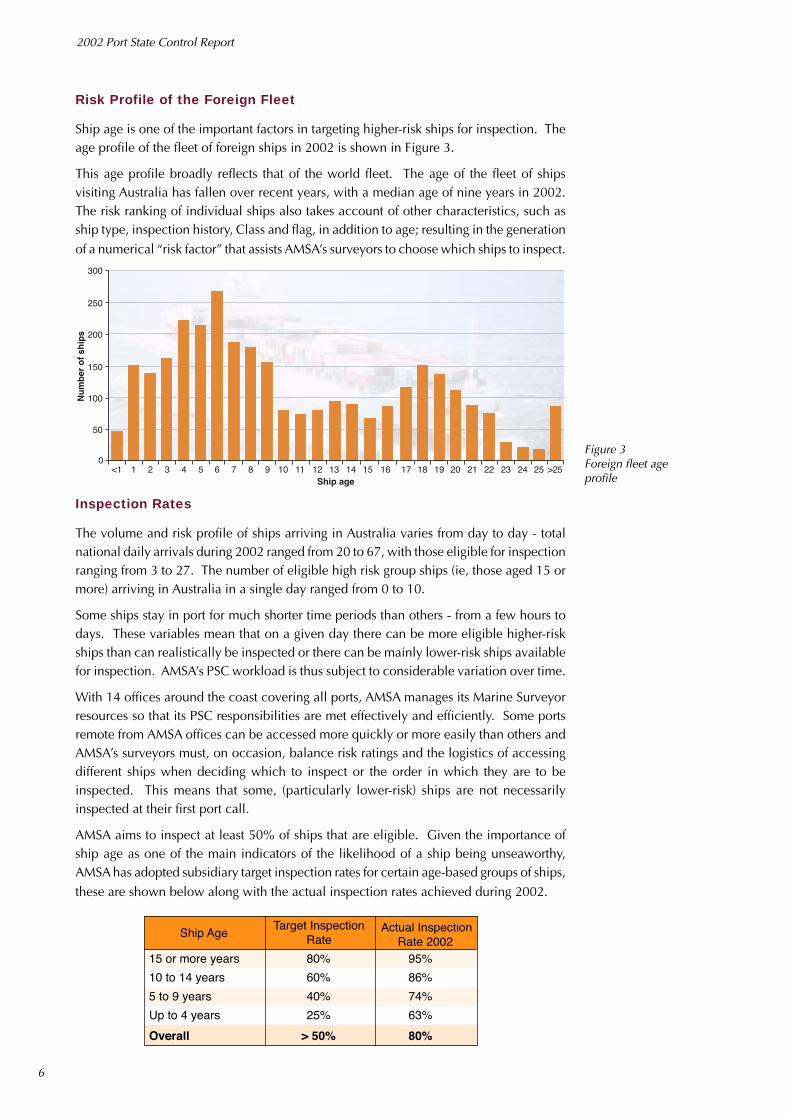
Risk Profile of the Foreign Fleet
Ship age is one of the important factors in targeting higher-risk ships for inspection. Theage profile of the fleet of foreign ships in 2002 is shown in Figure 3.
This age profile broadly reflects that of the world fleet. The age of the fleet of shipsvisiting Australia has fallen over recent years, with a median age of nine years in 2002.The risk ranking of individual ships also takes account of other characteristics, such asship type, inspection history, Class and flag, in addition to age; resulting in the generationof a numerical “risk factor” that assists AMSA’s surveyors to choose which ships to inspect.
��
��
����
��
�
(
�((
)((
)�(
�(
�((
��(
��� ����*) � � # ') � � + , )( )� )� )# )' �( �� ��)) )� )� )+ ), �) �� �� .��
Figure 3Foreign fleet ageprofile
Inspection Rates
The volume and risk profile of ships arriving in Australia varies from day to day - totalnational daily arrivals during 2002 ranged from 20 to 67, with those eligible for inspectionranging from 3 to 27. The number of eligible high risk group ships (ie, those aged 15 ormore) arriving in Australia in a single day ranged from 0 to 10.
Some ships stay in port for much shorter time periods than others - from a few hours todays. These variables mean that on a given day there can be more eligible higher-riskships than can realistically be inspected or there can be mainly lower-risk ships availablefor inspection. AMSA’s PSC workload is thus subject to considerable variation over time.
With 14 offices around the coast covering all ports, AMSA manages its Marine Surveyorresources so that its PSC responsibilities are met effectively and efficiently. Some portsremote from AMSA offices can be accessed more quickly or more easily than others andAMSA’s surveyors must, on occasion, balance risk ratings and the logistics of accessingdifferent ships when deciding which to inspect or the order in which they are to beinspected. This means that some, (particularly lower-risk) ships are not necessarilyinspected at their first port call.
AMSA aims to inspect at least 50% of ships that are eligible. Given the importance ofship age as one of the main indicators of the likelihood of a ship being unseaworthy,AMSA has adopted subsidiary target inspection rates for certain age-based groups of ships,these are shown below along with the actual inspection rates achieved during 2002.
Ship AgeTarget Inspection
Rate Actual Inspection
Rate 200215 or more years 80% 95%
10 to 14 years 60% 86%
5 to 9 years 40% 74%
Up to 4 years 25% 63%
Overall > 50% 80%

2002 Port State Control Report
7
These inspection rates are calculated on the basis of unique eligible ships which are
inspected during the period. Such a ship may have made multiple port calls before
being inspected and so these rates may be somewhat higher than considering
inspection rates on a port call, or voyage to Australia basis.
These are broad groupings only and the choice as to which ships are inspected is
made after considering both the objective risk factor of each individual ship and the
surveyor’s own knowledge of the ships or operators in question, plus any other relevant
intelligence.
The PSC inspections undertaken by AMSA typically reflect the results of risk
management analysis. As ship age is a major factor in determining the risk rankings
of most ship types, the overall age profile of ships inspected should be such that older
ships tend to be inspected more often than younger ships.
This is the case, as shown in more detail in Figure 4, which shows the actual number
of ships eligible and inspected by ship age.
0
50
100
150
200
250
300
Nu
mb
er o
f S
hip
s
0 1 2 3 4 5 6 7 8 9 10 11 12 13 14 15 16 17 18 19 20 21 22 23 24 25 >25Ship Age
����� ������������ � �����������
Of the 3,193 foreign-flag ships that visited Australia in 2002, 2,903 made a total of
5,295 calls at 72 ports while eligible for port State control inspection. Of these 2,317
were subjected to 2,842 inspections at 63 ports - 80% of the eligible ships were
therefore inspected at least once during the year. There were 37 inspections of 36
ships that were technically not eligible for inspection.
Of the 854 ships that made a single visit to Australia in 2002, 756 were eligible for
inspection. Four hundred and thirty nine of these were inspected at their only port
call; an inspection rate of 58%, at 63 ports. Seventy five percent of these single-visit,
eligible ships were bulk carriers, 7% oil tankers and 4% general cargo ships. Two
hundred and eighty two of the single-visit ships were 15 or more years old and thus
categorised as “high risk”. 252 of these were eligible for inspection, and 222, or
88%, were inspected.
AMSA gains best value from its marine surveyor workforce by ensuring that they are
effectively and efficiently deployed. This is achieved by considering the range of
ports where ships typically call and intelligently selecting the optimum location at
which a ship is inspected. This strategy takes account of AMSA’s risk management
Figure 4Age profile of shipsarriving and inspected inAustralia
2002 Port State Control Report
8
analysis of ships and means that higher risk ships are more likely to be inspected sooner,
while inspections of lower risk ships can reasonably be given lower priority, with
inspections of these more likely to be deferred to second or subsequent ports of call.
These targeting priorities adopted by AMSA produced the following inspection profile in
terms of how quickly an eligible ship is inspected.
This data shows that, overall, 90% of PSC inspections were undertaken within the first two
port calls after a ship became eligible and that, the higher the risk group, the more likely it
is that a ship will be inspected as soon as possible after it becomes eligible for inspection.
High risk group ships were much more likely to be inspected within the first two port calls
(97%) after becoming eligible for inspection than low risk group ships (84%).
This result is consistent with sensible risk management prioritisation of inspections.
Inspection Results
An inspection may comprise more than one visit to a ship. An initial visit at which the
vessel is assessed and follow-up visits at which any deficiencies found during the initial
visit are verified as being rectified or requiring further attention. A standard use of codes
allows other PSC inspectors to determine what action is required at a follow-up inspection.
During the year 2002, 2,842 initial inspections were carried out on ships registered under
63 foreign flags in 63 different ports around the country. Additionally, 90 inspections
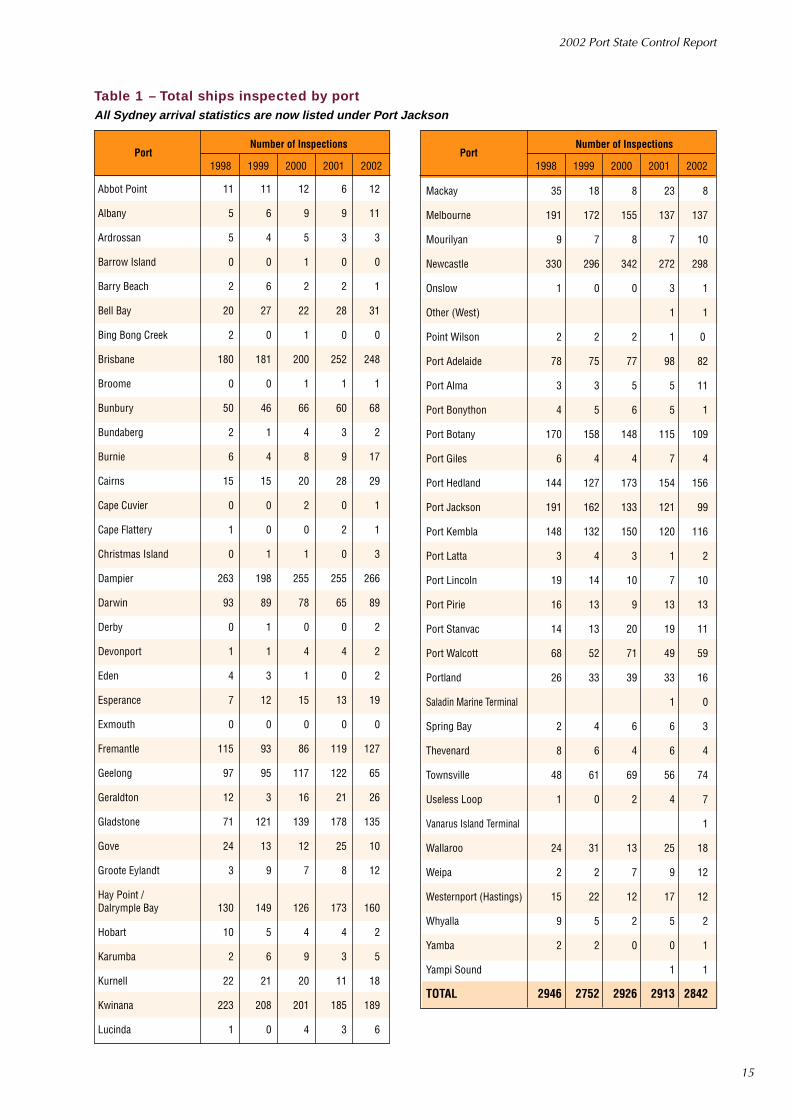
were carried out on ships under the Australian flag. Table 1 (page 15) gives the number of
inspections carried out in each port during the past five years.
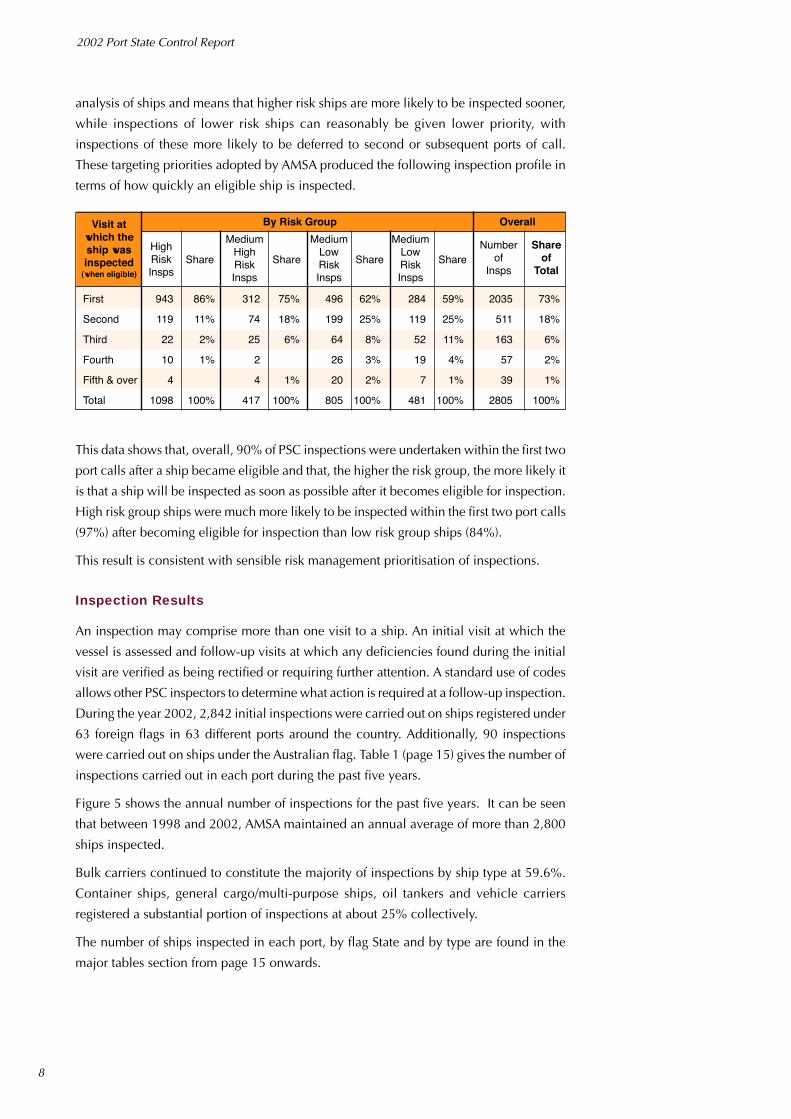
Figure 5 shows the annual number of inspections for the past five years. It can be seen
that between 1998 and 2002, AMSA maintained an annual average of more than 2,800
ships inspected.
Bulk carriers continued to constitute the majority of inspections by ship type at 59.6%.
Container ships, general cargo/multi-purpose ships, oil tankers and vehicle carriers
registered a substantial portion of inspections at about 25% collectively.
The number of ships inspected in each port, by flag State and by type are found in the
major tables section from page 15 onwards.
Numberof
Insps
Visit atwhich theship wasinspected
(when eligible)
By Risk Group Overall
HighRiskInsps
Share
MediumHighRiskInsps
Shareof
TotalShare
MediumLowRiskInsps
Share
MediumLowRiskInsps
Share
First 943 86% 312 75% 496 62% 284 59% 2035 73%
Second 119 11% 74 18% 199 25% 119 25% 511 18%
Third 22 2% 25 6% 64 8% 52 11% 163 6%
Fourth 10 1% 2 26 3% 19 4% 57 2%
Fifth & over 4 4 1% 20 2% 7 1% 39 1%
Total 1098 100% 417 100% 805 100% 481 100% 2805 100%

2002 Port State Control Report
9
Deficiencies
A deficiency is recorded when the condition of a ship’s hull and machinery or its
equipment does not conform to the requirements of the relevant IMO safety or pollution
prevention convention or where hazards to the health or safety of the crew exist
which are considered to be in breach of ILO conventions.
Deficiencies may arise from:
• The absence of either equipment or approved arrangements required byconventions.
• Non-compliance of equipment or arrangements with the appropriate specificationsof the relevant convention.
• Substantial deterioration of the ship or its equipment, such as life-saving appliances,fire-fighting equipment or radio equipment.
• Wastage or cracking of the ship’s structure.
• Crew certification not complying to STCW95.
• Factors related to the Safety Management System (ISM Code).
• SOLAS and MARPOL operational issues.
In 2002, 7,460 deficiencies were observed on ships and are listed by major categories
in terms of totals and percentages in Table 4 (page 17).
Relatively minor deficiencies are found on many ships. These may not pose an
immediate hazard to the safety of the ship or its crew or passengers. In such cases
sufficient time is allowed for rectification at the discretion of the surveyor, taking into
account factors such as the nature of the deficiency, availability of facilities for repairs
in the inspection or destination ports, and level of risk the deficiency poses.
While there was a decrease of 71 ship inspections in 2002 compared with that of
2001, the total number of deficiencies has also decreased by over 1,200. The average
number of deficiencies per inspection was 2.63, resulting in a 0.35 deficiency point
decrease. These overall figures may indicate that the standard of vessels is improving.
Figure 6 shows the annual average number of deficiencies per inspection for the
period 1998 - 2002.
2946
2753
2926 2913
2842
2400
2600
2800
3000
20021998 1999 2000 2001
Figure 5Number of inspections
2002 Port State Control Report
10
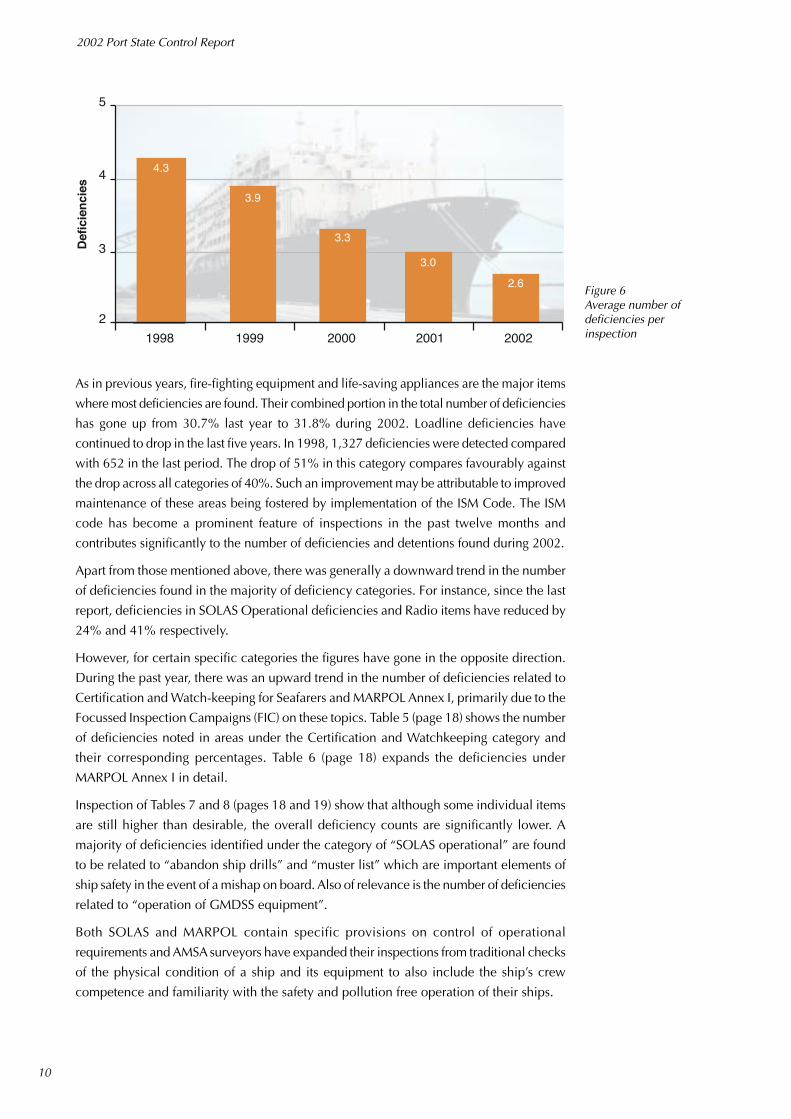
As in previous years, fire-fighting equipment and life-saving appliances are the major items
where most deficiencies are found. Their combined portion in the total number of deficiencies
has gone up from 30.7% last year to 31.8% during 2002. Loadline deficiencies have
continued to drop in the last five years. In 1998, 1,327 deficiencies were detected compared
with 652 in the last period. The drop of 51% in this category compares favourably against
the drop across all categories of 40%. Such an improvement may be attributable to improved
maintenance of these areas being fostered by implementation of the ISM Code. The ISM
code has become a prominent feature of inspections in the past twelve months and
contributes significantly to the number of deficiencies and detentions found during 2002.
Apart from those mentioned above, there was generally a downward trend in the number
of deficiencies found in the majority of deficiency categories. For instance, since the last
report, deficiencies in SOLAS Operational deficiencies and Radio items have reduced by
24% and 41% respectively.
However, for certain specific categories the figures have gone in the opposite direction.
During the past year, there was an upward trend in the number of deficiencies related to
Certification and Watch-keeping for Seafarers and MARPOL Annex I, primarily due to the
Focussed Inspection Campaigns (FIC) on these topics. Table 5 (page 18) shows the number
of deficiencies noted in areas under the Certification and Watchkeeping category and
their corresponding percentages. Table 6 (page 18) expands the deficiencies under
MARPOL Annex I in detail.
Inspection of Tables 7 and 8 (pages 18 and 19) show that although some individual items
are still higher than desirable, the overall deficiency counts are significantly lower. A
majority of deficiencies identified under the category of “SOLAS operational” are found
to be related to “abandon ship drills” and “muster list” which are important elements of
ship safety in the event of a mishap on board. Also of relevance is the number of deficiencies
related to “operation of GMDSS equipment”.
Both SOLAS and MARPOL contain specific provisions on control of operational
requirements and AMSA surveyors have expanded their inspections from traditional checks
of the physical condition of a ship and its equipment to also include the ship’s crew
competence and familiarity with the safety and pollution free operation of their ships.
4.3
3.9
3.3
3.0
2.6
2
3
4
5
20021998 1999 2000 2001
Def
icie
nci
es
Figure 6Average number ofdeficiencies perinspection
2002 Port State Control Report
11
Detentions
A ship is detained under the Navigation Act of 1912, when the deficiencies observed
during an inspection are considered by the inspecting surveyor to render the ship
unseaworthy or substandard. In making this decision, the international maritime safety
and pollution prevention conventions are used as the yardstick. AMSA marine surveyors
use their professional judgement to determine if a ship should be detained.
When intervention action is taken to detain a ship, AMSA follows international
convention requirements of informing the ship’s flag State and the appropriate Recognised
Organisation that issued the ship’s statutory certificates relevant to the detainable
deficiencies. Details of the detention are subsequently reported to the IMO.
Serious deterioration of the hull structure, overloading or defective equipment such
as life saving, radio and fire-fighting appliances would be considered as deficiencies
serious enough to render a ship unseaworthy. Vessels which seriously breach the
provisions of Marine Orders Part 11 (Substandard Ships), which invokes the spirit of
ILO147, may also be detained if considered to be a safety or health hazard.
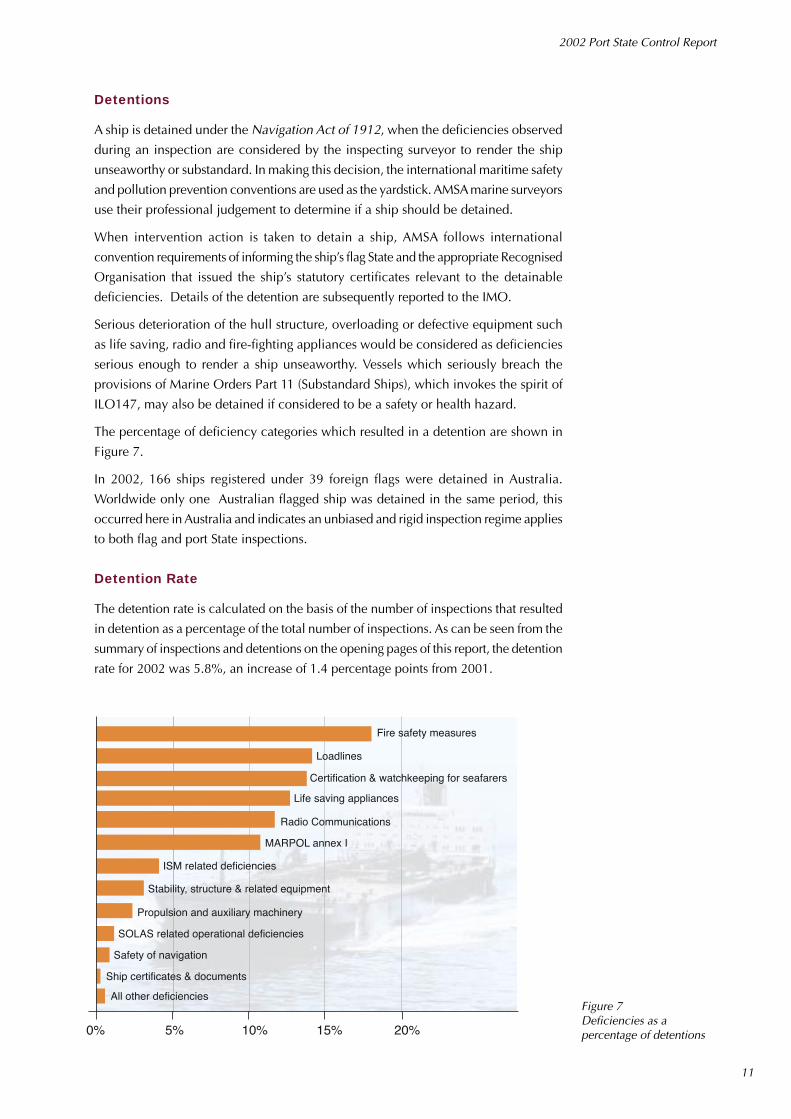
The percentage of deficiency categories which resulted in a detention are shown in
Figure 7.
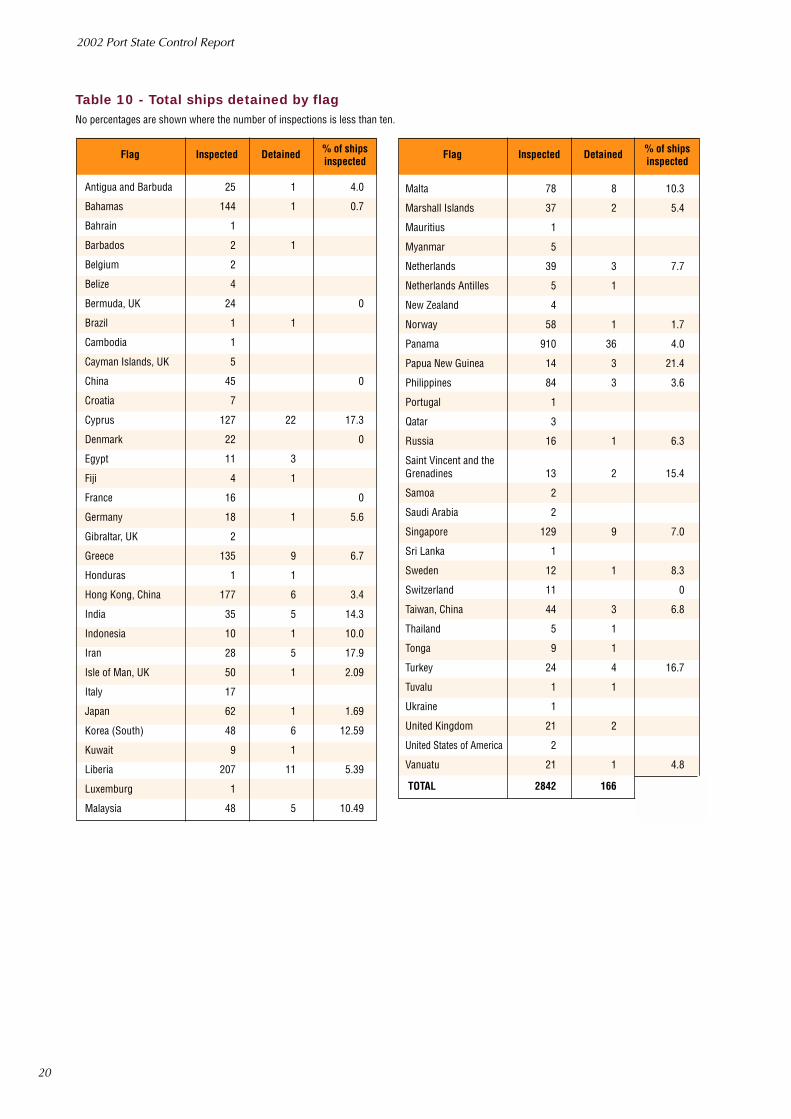
In 2002, 166 ships registered under 39 foreign flags were detained in Australia.
Worldwide only one Australian flagged ship was detained in the same period, this
occurred here in Australia and indicates an unbiased and rigid inspection regime applies
to both flag and port State inspections.
Detention Rate
The detention rate is calculated on the basis of the number of inspections that resulted
in detention as a percentage of the total number of inspections. As can be seen from the
summary of inspections and detentions on the opening pages of this report, the detention
rate for 2002 was 5.8%, an increase of 1.4 percentage points from 2001.
Figure 7Deficiencies as apercentage of detentions
Loadlines
Propulsion and auxiliary machinery
Stability, structure & related equipment
Radio Communications
Fire safety measures
Life saving appliances
0% 10% 15% 20%5%
Certification & watchkeeping for seafarers
MARPOL annex I
ISM related deficiencies
SOLAS related operational deficiencies
Safety of navigation
Ship certificates & documents
All other deficiencies

2002 Port State Control Report
12
Investigations were made to establish if this was cause for concern - did it reflect a drop in
the quality of ships visiting Australia? Noting that the average number of deficiencies per
inspection continued to drop, other factors were considered, rather than a drop in quality.
The first factor to consider is the improved risk management approach to allocating
inspection resources to higher risk ships, as discussed above. If such a strategy is to be
effective and ships with a higher probability of detention are being targeted for inspection,
then it is to be expected that the detention rate will increase (ignoring other factors which
may be at work).
The second factor to consider is the possible impact of focussed inspection campaigns that
were run during 2002, in conjunction with the final expiry of the transitional provisions
permitted under STCW 95 and subsequent period of grace permitted by the IMO.
Impact of the STCW95 amendments
The International Convention on Standards of Training, Certification and Watchkeeping for
Seafarers, as amended in 1995 was adopted on 7 July 1995 and scheduled to come into
effect on 1 February 2002. However, despite the lengthy lead time, it became evident in
late 2001, that many maritime Administrations and seafarers would not be in full compliance
before February 2002. In response, the IMO took the extraordinary step of issuing IMO
STCW 7 / Circ.12. This notice advised that PSC officers not fully enforce the requirements
of the code regarding certification for a period of grace until 31 July 2002, but instead to
issue a letter of warning. Australia complied with this request, however full compliance
was enforced from 1 August 2002 by running a focussed inspection campaign on the area.
The impact of this can be seen clearly in Figure 8.
Obviously, despite the period of grace, action was necessary to ensure full and effective
implementation of the convention. During the period of the campaign, 1043 ships were
inspected of which 28 were detained with deficiencies related to STCW non-compliances.
Nineteen of these ships were detained not having any other deficiencies at that inspection.
If these solely STCW detentions were discounted, the underlying detention rate would
have been reduced to the order of 5.2%. The primary item of detention was the lack of
valid certification for officers which comprised 62% of the deficiencies.
Impact of the MARPOL Annex 1 FIC
During the 2002 FIC on MARPOL Annex 1, starting in April, 1100 vessels were inspected of
which 12 were detained with MARPOL related deficiencies. However, nine of these vessels
were detained as a result of MARPOL deficiencies alone. There was also one other vessel
detained, that had an STCW deficiency in conjunction with the MARPOL deficiency. These
additional 10 vessels being discounted would have further lowered the rate to 4.8%. The
keeping of oil movement records in a proper Oil Record Book, coupled with oil pollution
planning were the items causing the majority of deficiencies and amounted to 39.3% of all
deficiencies in this category. However, the primary item resulting in detentions was the
inoperability of the oil filtering equipment which comprised 18.4%.
In Figure 8, a diagrammatic view is shown of the effect of the resultant MARPOL and STCW
95 detentions on the overall detentions during the year.

2002 Port State Control Report
13
Figure 8Impact of the FocussedInspection Campaign (FIC)on detentions
Ship Type
Figure 9 shows a comparison of how the main ship types inspected performed with
regards to detention. For example, container ships represented 8% of total inspection
for the year and only 5% of the total detentions for the year, and so performed quite
well. Of some concern here are general cargo ships and chemical tankers which
were both over-represented when comparing detentions to inspections.
Figure 9Percentage of shipsinspected compared withpercentage of shipsdetained - by ship type
0
5
10
25
Jan Feb
Nu
mb
er d
etai
ned
15
20
Mar Apr May Jun Jul Aug Sep Oct Nov Dec
STCW MARPOL Other deficiencies Total
0
10
40
Bulkcarriers
60
Generalcargo/multi
Oiltankships
Vehiclecarriers
Containerships
Chemicaltankships
Livestockcarrier
Othertypes
20
30
50
70
% inspected % detained
Responsibility of Recognised Organisations
During 2002, AMSA surveyors began to assess detainable deficiencies to decide if
the detainable deficiency was due to a failure of the recognised organisation to detect
the deficiency during surveys. The procedures for this and criteria used for assessment
are those adopted by the Tokyo MOU and are identical to those used by the Paris
MOU and United States Coast Guard.
Statistics for allocation of responsibility to recognised organisations must be calculated
on the basis of detainable deficiencies rather than inspections; a ship classed by one
organisation may be detained for failure of a safety management system audited and

2002 Port State Control Report
14
certificated under the ISM Code by another organisation, similarly a ship may be detained
for several deficiencies, some of which may be allocated responsibility, and others not.
During 2002, there were 344 detainable deficiencies issued by AMSA surveyors. One
hundred and fifteen of these deficiencies were assessed as being the responsibility of a
Recognised Organisation. The breakdown of these deficiencies is given in the table below.
In time, enough data should be gathered by AMSA surveyors in this area to enable analysis
to be carried out to assess whether the recognised organisation carrying out statutory
surveys or audits is a valid factor to consider in targeting a ship for inspection.
Ship Recognised Organisation (RO)
ROResponsibledetainable
deficiencies
Totaldetainable
deficiencies
ROResponsible aspercentage of
total detainable
American Bureau of Shipping 7 59 11.86%
Biro Klasifikasi Indonesia 3 3 100.00%
Bureau Veritas 14 27 51.85%
China Classification Society 4 5 80.00%
China Corporation Register of Shipping 6 8 75.00%
Det Norske Veritas 10 23 43.48%
Germanischer Lloyd 2 17 11.76%
Honduras International Survey & Inspection Bureau 0 3 0.00%
Indian Register of Shipping 3 4 75.00%
Korean Register of Shipping 5 13 38.46%
Lloyd�s Register of Shipping 31 79 39.24%
Nippon Kaiji Kyokai 30 97 30.93%
Registro Italiano Navale 0 5 0.00%
Russian Maritime Register of Shipping 0 1 0.00%
Totals 115 344 33.43%
2002 Port State Control Report
15
Abbot Point 11 11 12 6 12
Albany 5 6 9 9 11
Ardrossan 5 4 5 3 3
Barrow Island 0 0 1 0 0
Barry Beach 2 6 2 2 1
Bell Bay 20 27 22 28 31
Bing Bong Creek 2 0 1 0 0
Brisbane 180 181 200 252 248
Broome 0 0 1 1 1
Bunbury 50 46 66 60 68
Bundaberg 2 1 4 3 2
Burnie 6 4 8 9 17
Cairns 15 15 20 28 29
Cape Cuvier 0 0 2 0 1
Cape Flattery 1 0 0 2 1
Christmas Island 0 1 1 0 3
Dampier 263 198 255 255 266
Darwin 93 89 78 65 89
Derby 0 1 0 0 2
Devonport 1 1 4 4 2
Eden 4 3 1 0 2
Esperance 7 12 15 13 19
Exmouth 0 0 0 0 0
Fremantle 115 93 86 119 127
Geelong 97 95 117 122 65
Geraldton 12 3 16 21 26
Gladstone 71 121 139 178 135
Gove 24 13 12 25 10
Groote Eylandt 3 9 7 8 12
Hay Point /Dalrymple Bay 130 149 126 173 160
Hobart 10 5 4 4 2
Karumba 2 6 9 3 5
Kurnell 22 21 20 11 18
Kwinana 223 208 201 185 189
Lucinda 1 0 4 3 6
PortNumber of Inspections
1998 1999 2000 2001 2002Port
Number of Inspections
1998 1999 2000 2001 2002
Mackay 35 18 8 23 8
Melbourne 191 172 155 137 137
Mourilyan 9 7 8 7 10
Newcastle 330 296 342 272 298
Onslow 1 0 0 3 1
Other (West) 1 1
Point Wilson 2 2 2 1 0
Port Adelaide 78 75 77 98 82
Port Alma 3 3 5 5 11
Port Bonython 4 5 6 5 1
Port Botany 170 158 148 115 109
Port Giles 6 4 4 7 4
Port Hedland 144 127 173 154 156
Port Jackson 191 162 133 121 99
Port Kembla 148 132 150 120 116
Port Latta 3 4 3 1 2
Port Lincoln 19 14 10 7 10
Port Pirie 16 13 9 13 13
Port Stanvac 14 13 20 19 11
Port Walcott 68 52 71 49 59
Portland 26 33 39 33 16
Saladin Marine Terminal 1 0
Spring Bay 2 4 6 6 3
Thevenard 8 6 4 6 4
Townsville 48 61 69 56 74
Useless Loop 1 0 2 4 7
Vanarus Island Terminal 1
Wallaroo 24 31 13 25 18
Weipa 2 2 7 9 12
Westernport (Hastings) 15 22 12 17 12
Whyalla 9 5 2 5 2
Yamba 2 2 0 0 1
Yampi Sound 1 1
TOTAL 2946 2752 2926 2913 2842
Table 1 – Total ships inspected by portAll Sydney arrival statistics are now listed under Port Jackson

2002 Port State Control Report
16
Table 2 – Total ships inspected by flag State
American Samoa 1 0
Anguilla 1 0 1 0 0
Antigua and Barbuda 20 18 20 21 25
Bahamas 131 126 136 138 144
Bahrain 1
Bangladesh 0 1 0 0 0
Barbados 3 2 3 2 2
Belgium 4 0 2 0 2
Belize 3 4 7 7 4
Bermuda 13 19 32 34 24
Brazil 0 2 0 2 1
Bulgaria 1 2 1 0 0
Cambodia 1
Cayman Islands 7 6 8 10 5
Channel Islands 0 0 0 2 0
China, People’sRepublic of 75 79 78 53 45
Cook Islands 2 0 0 0 0
Croatia 4 6 5 4 7
Cyprus 94 108 106 129 127
Czech Republic 0 0 0 0 0
Denmark 42 38 53 47 22
Egypt 13 7 11 12 11
Estonia 0 0 0 0 0
Fiji 2 1 3 4 4
France 17 17 15 17 16
French Polynesia 0 0 0 0 0
Germany 33 22 27 19 18
Gibraltar 0 1 1 2 2
Greece 127 102 100 109 135
Honduras 0 2 1 0 1
Hong Kong, China 118 104 145 159 177
India 49 38 33 35 35
Indonesia 9 14 10 13 10
Iran 30 22 21 31 28
Ireland 0 0 0 0 0
Isle of Man 25 26 27 38 50
Italy 10 12 14 13 17
Japan 68 71 57 69 62
Jordan 0 0 0 0 0
Kiribati 0 0 0 0 0
Korea, Republic of 53 46 46 47 48
Kuwait 7 9 9 9 9
Kyrgyzstan 0 0 0 1 0
Liberia 295 295 248 231 207
Flag StateNumber of Inspections
1998 1999 2000 2001 2002Flag State
Number of Inspections
1998 1999 2000 2001 2002
Luxembourg 0 1 2 1 1
Malaysia 58 56 66 53 48
Malta 51 48 88 73 78
Marshall Islands 14 15 19 28 37
Mauritius 0 0 0 0 1
Myanmar 8 3 4 8 5
Netherlands 69 38 41 41 39
Netherlands Antilles 2 2 3 5 5
New Zealand 13 11 5 2 4
Norway 117 78 75 72 58
Pakistan 0 0 0 0 0
Panama 842 870 954 918 910
Papua New Guinea 6 7 5 18 14
Philippines 120 99 99 94 84
Poland 2 1 0 2 0
Portugal 2 0 0 0 1
Qatar 3 3 0 3 3
Romania 2 0 0 0 0
Russian Federation 28 27 24 25 16
Saint Helena 0 0 0 1 0
Saint Vincent and theGrenadines 36 24 18 18 13
Samoa 0 0 0 1 2
Saudi Arabia 5 3 4 4 2
Singapore 146 130 131 129 129
Slovakia 2 1 0 0 0
Spain 0 1 0 0 0
Sri Lanka 2 1 2 2 1
Sweden 5 8 12 9 12
Switzerland 5 8 10 5 11
Taiwan 45 47 49 48 44
Thailand 22 16 20 9 5
Tonga 10 5 4 4 9
Turkey 26 16 24 32 24
Tuvalu 0 0 0 0 1
Ukraine 5 0 1 0 1
United Arab Emirates 2 2 2 1 0
United Kingdom 20 15 21 27 21
United States ofAmerica 1 1 2 6 2
Uruguay 1 1 0 0 0
Vanuatu 20 14 21 15 21
Others 0 1 0 0 0
TOTAL 2946 2753 2926 2913 2842

2002 Port State Control Report
17
Table 3 – Total ships inspected by type of ship
Ship TypeNumber of Inspections
1998 1999 2000 2001 2002
Bulk Carrier 1654 1572 1723 1757 1694
Chemical Tanker 86 64 72 65 68
Combination Carrier 13 12 15 22 16
Container Ship 284 275 239 236 226
Fishing Vessel 0 1 0 0 2
Gas Carrier 78 61 64 58 50
General Cargo /Multi-Purpose Ship 182 183 222 196 159
Heavy Load Carrier 7 9 5 8 9
High Speed PassengerCraft 5 7 2 2 2
Livestock Carrier 72 71 74 69 74
MODU & FPSO 2 1 0 0 3
Offshore Service Vessel 33 25 16 18 30
Ship TypeNumber of Inspections
1998 1999 2000 2001 2002
Oil Tanker 186 178 201 208 202
Other Types 29 14 12 15 12
Passenger Ship 28 38 30 27 32
Refrigerated CargoCarrier 27 20 24 20 18
Ro-Ro Cargo Ship 45 20 14 17 22
Ro-Ro Passenger Ships 0 1 0 1
Special Purpose Vessel 11 4 7 15 11
Tankship-Non Specified 11 12 5 3 1
Tugboat 12 12 8 5 12
Vehicle Carrier 131 117 125 113 135
Wood chip/pulp Carrier 50 56 68 58 64
TOTAL 2946 2753 2926 2913 2842
Table 4 – Totals and percentages of deficiency categoriesNote: Safety in General deficiencies now assigned to Stability, Structure and related Items, Accident Prevention and Crew and Accomodation underthe new Tokyo Mou codes now in use
Deficiency Categories
Life-saving Appliances 2423 2030 1641 1375 1218 19.29 19.01 17.08 15.59 16.3
Fire Fighting Appliances 2491 1810 1337 1388 1181 19.84 16.95 16.36 15.74 15.8
Safety in General 1813 1373 1320 14.44 12.85 13.74
Safety of Navigation 931 796 937 934 803 7.41 7.45 9.75 10.59 10.8
Load Line items 1327 997 918 770 630 10.57 9.33 9.55 8.73 8.4
Radio 564 955 849 1206 691 4.49 8.94 8.84 13.68 9.3
Propulsion and Auxiliary Machinery 583 464 343 304 280 4.64 4.34 3.57 3.45 3.8
Marpol Annex I (Oil) 315 308 333 277 413 2.51 2.88 3.47 3.14 5.5
ISM Related Deficiencies 242 214 277 175 229 1.93 2 2.88 1.98 3.1
Solas Operational Deficiencies 271 245 275 478 360 2.16 2.29 2.86 5.42 4,8
Crew and Accommodation (ILO 147) 381 316 241 348 164 3.03 2.96 2.51 3.95 2.2
Food and Catering (ILO 147) 256 208 173 160 87 2.04 1.95 1.8 1.81 1.2
Mooring Arrangements (ILO 147) 160 183 153 151 55 1.27 1.71 1.59 1.71 0.7
Ship’s Certificates and Documents 184 188 120 94 94 1.47 1.76 1.25 1.07 1.3
Accident Prevention (ILO 147) 123 151 101 177 96 0.98 1.41 1.05 2.01 1.3
Carriage of Cargo and Dangerous Goods 137 109 98 97 82 1.09 1.02 1.02 1.1 1.1
Marpol Annex V 18 70 75 83 177 0.14 0.66 0.78 0.94 2.4
Certification and Watchkeeping for Seafarers 130 127 67 69 325 1.04 1.19 0.7 0.78 4.4
Working Spaces 83 60 48 34 22 0.66 0.56 0.5 0.39 0.3
MARPOL Related Operational Deficiencies 56 31 31 23 11 0.45 0.29 0.32 0.26 0.2
Alarm Signals 29 24 18 10 2 0.23 0.22 0.19 0.11 0.02
Oil, Chemical Tankers & Gas Carriers 22 7 10 8 17 0.18 0.07 0.1 0.09 0.2
MARPOL Annex II (Chemicals) 3 0 3 2 3 0.02 0 0.03 0.02 0.02
MARPOL Annex III (Harmful Substances) 2 1 1 1 1 0.02 0.01 0.01 0.01 0.01
Bulk Carriers – Additional Safety Measures 12 35 0.14 0.16
Stability, Structure and related items 669 472 7.59 6.3
All Other Deficiencies 14 14 5 24 12 0.11 0.13 0.05 0.27 0.2
TOTAL 12558 10681 9609 8818 7460
Number of deficiencies
1998 1999 2000 2001 2002
Percentage of total
1998 1999 2000 2001 2002

2002 Port State Control Report
18
Certificates for master and officers 235 71.6
Certificate for ratings for watch-keeping 3 0.9
Certificates for radio personnel 8 2.4
Certificate for personnel on tankers 7 2.1
Manning specified by the minimum safe manning document 19 5.8
Rest period 5 1.5
Other (STCW) 48 14.8
Total 325
Table 5 – Certification and Watchkeeping for Seafarers
Item Number of occurrences Pertentage of total certification andwatch-keeping deficiencies
Table 6 – MARPOL Annex I
Shipboard oil pollution emergency plan (SOPEP) 114 26.9
Oil record book 113 26.71
Control of discharge of oil 22 5.2
Retention of oil on board 18 4.3
Oil filtering equipment 61 14.4
Oil discharge monitoring and control system 17 4.0
15 PPM alarm arrangements 41 9.7
Oil / water interface detector 1 0.2
Suspected discharge violation 3 0.7
Other (MARPOL Annex I) 23 5.6
TOTAL 413
Item Number of occurrences Pertentage of total MARPOL Annex Ideficiencies
Functional requirements 19 2.7
Main installation 3 0.3
MF radio installation 5 0.7
MF/ HF radio installation 166 23.6
INMARSAT ship earth station 16 2.3
Maintenance / duplication of equipment 5 0.7
VHF radio installation 14 2.0
Facilities for reception of marine safety information 101 14.3
Satellite EPIRB 406 Mhz / 1.6 Ghz 39 5.5
VHF EPIRB 2 0.3
Radar transponder 7 1.0
Reserve source of energy 37 5.3
Radio log (diary) 122 17.3
Other (radio) 155 22.4
TOTAL 691
Item Number of occurrences Pertentage of total Radiocommunications deficiencies
Table 7 – Radio Communications

2002 Port State Control Report
19
Functional requirements 19 2.7
Muster list 48 13.3
Communication 1 0.3
Fire drills 3 0.8
Abandon ship drills 148 40.9
Fire control plan 1 0.3
Bridge operation 7 1.9
Operation of GMDSS equipment 102 28.2
Cargo operation 2 0.6
Operation of machinery 9 2.5
Manuals, instructions, etc. 14 3.9
Other (SOLAS operational) 25 6.9
TOTAL 360
Item Number of occurrences Pertentage of total SOLAS relatedoperational deficiencies
Table 8 – SOLAS related operational deficiencies
Table 9 – Total ships detained by ship type
No percentages are shown where the number of inspections is less than ten.
Type Inspected Detained
Functional requirements 19 2.7
Bulk carrier 1694 103 6.1
Chemical tankers 68 7 10.3
Combination carrier 16 0 0
Container ships 226 9 4.0
Fishing vessel 2 0
Gas carriers 50 2 4.0
General cargo / multi purpose 159 16 10.1
Heavy load carriers 9 2
High speed passenger craft 2 0
Livestock carriers 74 3 4.1
MODU & FPSO 3 0
Offshore service vessel 30 0 0
Oil tankers 202 11 5.5
Other types of ships 12 1 8.3
Passenger ships 32 1 3.1
Refrigerated cargo vessels 18 2 11.1
RO-RO cargo ships 22 2 9.1
Special purpose ship 11 0 0
Tanker, not otherwise specified 1 0
Tugboat 12 0 0
Vehicle carriers 135 5 3.7
Wood-chip carriers 64 2 3.1
TOTAL 2842 166
% of ships inspected
2002 Port State Control Report
20
Antigua and Barbuda 25 1 4.0
Bahamas 144 1 0.7
Bahrain 1
Barbados 2 1
Belgium 2
Belize 4
Bermuda, UK 24 0
Brazil 1 1
Cambodia 1
Cayman Islands, UK 5
China 45 0
Croatia 7
Cyprus 127 22 17.3
Denmark 22 0
Egypt 11 3
Fiji 4 1
France 16 0
Germany 18 1 5.6
Gibraltar, UK 2
Greece 135 9 6.7
Honduras 1 1
Hong Kong, China 177 6 3.4
India 35 5 14.3
Indonesia 10 1 10.0
Iran 28 5 17.9
Isle of Man, UK 50 1 2.09
Italy 17
Japan 62 1 1.69
Korea (South) 48 6 12.59
Kuwait 9 1
Liberia 207 11 5.39
Luxemburg 1
Malaysia 48 5 10.49
Table 10 - Total ships detained by flagNo percentages are shown where the number of inspections is less than ten.
Flag Inspected Detained % of shipsinspected
Flag Inspected Detained % of shipsinspected
Malta 78 8 10.3
Marshall Islands 37 2 5.4
Mauritius 1
Myanmar 5
Netherlands 39 3 7.7
Netherlands Antilles 5 1
New Zealand 4
Norway 58 1 1.7
Panama 910 36 4.0
Papua New Guinea 14 3 21.4
Philippines 84 3 3.6
Portugal 1
Qatar 3
Russia 16 1 6.3
Saint Vincent and theGrenadines 13 2 15.4
Samoa 2
Saudi Arabia 2
Singapore 129 9 7.0
Sri Lanka 1
Sweden 12 1 8.3
Switzerland 11 0
Taiwan, China 44 3 6.8
Thailand 5 1
Tonga 9 1
Turkey 24 4 16.7
Tuvalu 1 1
Ukraine 1
United Kingdom 21 2
United States of America 2
Vanuatu 21 1 4.8
TOTAL 2842 166
2002 Port State Control Report
21
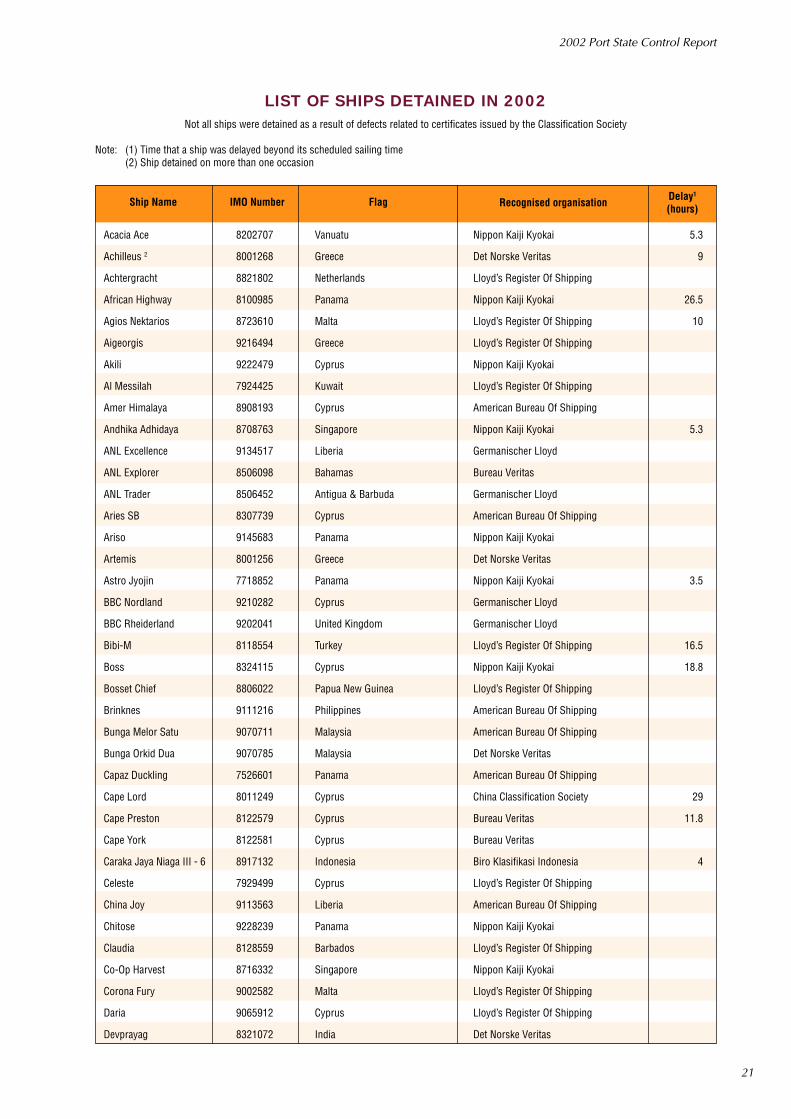
Not all ships were detained as a result of defects related to certificates issued by the Classification Society
Note: (1) Time that a ship was delayed beyond its scheduled sailing time(2) Ship detained on more than one occasion
LIST OF SHIPS DETAINED IN 2002
Recognised organisation
Acacia Ace 8202707 Vanuatu Nippon Kaiji Kyokai 5.3
Achilleus 2 8001268 Greece Det Norske Veritas 9
Achtergracht 8821802 Netherlands Lloyd’s Register Of Shipping
African Highway 8100985 Panama Nippon Kaiji Kyokai 26.5
Agios Nektarios 8723610 Malta Lloyd’s Register Of Shipping 10
Aigeorgis 9216494 Greece Lloyd’s Register Of Shipping
Akili 9222479 Cyprus Nippon Kaiji Kyokai
Al Messilah 7924425 Kuwait Lloyd’s Register Of Shipping
Amer Himalaya 8908193 Cyprus American Bureau Of Shipping
Andhika Adhidaya 8708763 Singapore Nippon Kaiji Kyokai 5.3
ANL Excellence 9134517 Liberia Germanischer Lloyd
ANL Explorer 8506098 Bahamas Bureau Veritas
ANL Trader 8506452 Antigua & Barbuda Germanischer Lloyd
Aries SB 8307739 Cyprus American Bureau Of Shipping
Ariso 9145683 Panama Nippon Kaiji Kyokai
Artemis 8001256 Greece Det Norske Veritas
Astro Jyojin 7718852 Panama Nippon Kaiji Kyokai 3.5
BBC Nordland 9210282 Cyprus Germanischer Lloyd
BBC Rheiderland 9202041 United Kingdom Germanischer Lloyd
Bibi-M 8118554 Turkey Lloyd’s Register Of Shipping 16.5
Boss 8324115 Cyprus Nippon Kaiji Kyokai 18.8
Bosset Chief 8806022 Papua New Guinea Lloyd’s Register Of Shipping
Brinknes 9111216 Philippines American Bureau Of Shipping
Bunga Melor Satu 9070711 Malaysia American Bureau Of Shipping
Bunga Orkid Dua 9070785 Malaysia Det Norske Veritas
Capaz Duckling 7526601 Panama American Bureau Of Shipping
Cape Lord 8011249 Cyprus China Classification Society 29
Cape Preston 8122579 Cyprus Bureau Veritas 11.8
Cape York 8122581 Cyprus Bureau Veritas
Caraka Jaya Niaga III - 6 8917132 Indonesia Biro Klasifikasi Indonesia 4
Celeste 7929499 Cyprus Lloyd’s Register Of Shipping
China Joy 9113563 Liberia American Bureau Of Shipping
Chitose 9228239 Panama Nippon Kaiji Kyokai
Claudia 8128559 Barbados Lloyd’s Register Of Shipping
Co-Op Harvest 8716332 Singapore Nippon Kaiji Kyokai
Corona Fury 9002582 Malta Lloyd’s Register Of Shipping
Daria 9065912 Cyprus Lloyd’s Register Of Shipping
Devprayag 8321072 India Det Norske Veritas
Ship Name IMO Number Flag Delay1
(hours)

2002 Port State Control Report
22
Disco Volante 8114314 Malta Bureau Veritas
Doceserra 8510922 Brazil American Bureau Of Shipping 37.3
Dooyang Hope 8802210 Korea (South) Korean Register Of Shipping
Eastern Garland 8905177 Panama Nippon Kaiji Kyokai 3
Eco Challenge 8029507 Malaysia Nippon Kaiji Kyokai 3.3
Eco Charger 8413954 Malaysia Nippon Kaiji Kyokai 13.5
Enforcer 8029703 Panama Det Norske Veritas
Eternal Spirit 9141998 Panama Nippon Kaiji Kyokai
Fair Voyager 8321395 Liberia Lloyd’s Register Of Shipping
Fairlift 8806905 Netherlands Antilles Lloyd’s Register Of Shipping
Fanari 8013546 Cyprus American Bureau Of Shipping
Faneromeni 8807789 Cyprus Lloyd’s Register Of Shipping
Far Eastern Marina 9162590 Panama American Bureau Of Shipping
Far Eastern Silo 9003108 Taiwan, China China Corporation Register Of Shipping 7.3
Farid F 7203663 Saint Vincent & the Grenadines Registro Italiano Navale 1.5
Ferosa 9004839 Saint Vincent & the Grenadines Bureau Veritas
Forest Venture 9116137 Hong Kong, China Bureau Veritas
Formosabulk Allstar 9107904 Panama American Bureau Of Shipping 138
Francesco 8011421 Panama American Bureau Of Shipping
Frixos 8420218 Liberia Lloyd’s Register Of Shipping
Gargantua 8210211 Cyprus Bureau Veritas
Giant Step 8309282 Panama Nippon Kaiji Kyokai
Global Triumph 9118666 Marshall Islands Bureau Veritas 18
Glorious Halo 9162954 Panama Nippon Kaiji Kyokai
Goada Chief 9154816 Papua New Guinea Lloyd’s Register Of Shipping
Golden Fan 8511263 Panama Nippon Kaiji Kyokai 18
Golden Lucy I 8506763 Panama Nippon Kaiji Kyokai
Grain Union 8026921 Taiwan, China China Corporation Register Of Shipping
Grand Clipper 9121326 Hong Kong, China American Bureau Of Shipping
Grand Ocean 8319691 Liberia Nippon Kaiji Kyokai
Hakula 8508929 Tonga Lloyd’s Register Of Shipping
Handy Trader 8509430 Philippines Nippon Kaiji Kyokai
Hanjin Melbourne 8517982 Korea (South) Korean Register Of Shipping
Hourai Maru 8303654 Singapore Nippon Kaiji Kyokai 1.5
Hyundai Oceania 8211540 Korea (South) Korean Register Of Shipping 17.5
Ioannis Zafirakis 8028644 Greece American Bureau Of Shipping
Ionikos 8017815 Greece Nippon Kaiji Kyokai
Iran Chamran 8309610 Iran Lloyd’s Register Of Shipping
Iran Hamzeh 8320171 Iran Lloyd’s Register Of Shipping
Iran Sadr 8320121 Iran Det Norske Veritas
Iran Shariat 8107581 Iran Det Norske Veritas
Iran Shariati 8309696 Iran Det Norske Veritas
Recognised organisationShip Name IMO Number Flag Delay1
(hours)

2002 Port State Control Report
23
Irene 9034327 Greece American Bureau Of Shipping
Irini 8802210 Marshall Islands Bureau Veritas
Iris Frontier 8602490 Panama Nippon Kaiji Kyokai 7.5
Ivs Super Adventure 9140528 Panama Nippon Kaiji Kyokai
Java Sea 8607684 Singapore Lloyd’s Register Of Shipping 40
Kapitan Kurov 8502717 Russia Russian Maritime Register Of Shipping
Kimtrans Xpress 9225732 Singapore Bureau Veritas 190.5
Kliomar 8813568 Cyprus American Bureau Of Shipping
Lancelot 8018089 Malta Bureau Veritas
Leliegracht 8611099 Netherlands Lloyd’s Register Of Shipping 3.3
Levin 8103755 Singapore Germanischer Lloyd
Lok Maheshwari 8026153 India American Bureau Of Shipping
Lord P 8401250 Malta Nippon Kaiji Kyokai
Lowlands Rose 9136577 Panama Nippon Kaiji Kyokai
Lucky 8303680 Liberia Nippon Kaiji Kyokai 9.5
M Faruk 8028890 Turkey Det Norske Veritas 32.3
Maharashtra 8511653 India Bureau Veritas
Mandakini 8321058 India Indian Register Of Shipping
Mani P 8208165 Malta Nippon Kaiji Kyokai
Marion Green 9164029 Netherlands Lloyd’s Register Of Shipping
Maritime Peace 8312617 Singapore Nippon Kaiji Kyokai 2.3
Mindanao River 2 8319328 Philippines American Bureau Of Shipping 24
Mineral Century 9086095 Liberia Lloyd’s Register Of Shipping
Ming Courage 8026933 Taiwan, China China Corporation Register Of Shipping
Minoan Flame 8005264 Malta American Bureau Of Shipping
Moor Laker 8312162 Hong Kong, China Nippon Kaiji Kyokai
MSC Nuria 7416911 Panama Lloyd’s Register Of Shipping
MSC Pamela 2 7125392 Panama Nippon Kaiji Kyokai 0.5
MSC Peggy 8208672 Panama American Bureau Of Shipping
MSC Samia 7310143 Panama Germanischer Lloyd
Multi-Purpose 5 8921822 Malaysia Lloyd’s Register Of Shipping
Myron N 8811364 Cyprus Bureau Veritas 4
Navigator Venus 9177557 Liberia Germanischer Lloyd
Niugini Coast 8518091 Papua New Guinea American Bureau Of Shipping 28.5
Northgate 8321981 Panama Nippon Kaiji Kyokai
NST Challenge 8306802 Hong Kong, China Nippon Kaiji Kyokai
Ocean Elite 7616236 Singapore Nippon Kaiji Kyokai
Ocean Lord 8308094 Korea (South) Korean Register Of Shipping 18.5
Ocean Queen 8608092 Korea (South) Korean Register Of Shipping
Oji Pioneer 8906858 Liberia Nippon Kaiji Kyokai
Pacific Condor 9216339 Panama Nippon Kaiji Kyokai
Pacific Sky 8024026 United Kingdom Lloyd’s Register Of Shipping
Recognised organisationShip Name IMO Number Flag Delay1
(hours)

2002 Port State Control Report
24
Recognised organisationShip Name IMO Number Flag Delay1
(hours)
Pacific Spirit 8410847 Fiji Det Norske Veritas
Packer 8713598 Liberia American Bureau Of Shipping
Pan Leader 8604905 Korea (South) Korean Register Of Shipping
Panagiotis L 8124876 Greece American Bureau Of Shipping
Panamax Star 8109137 Cyprus Det Norske Veritas
Paradise Island 9233480 Panama Nippon Kaiji Kyokai
Pontonikis 8408521 Cyprus Nippon Kaiji Kyokai
Pontonostos 8914245 Cyprus Nippon Kaiji Kyokai
Pontoporos 8318609 Cyprus American Bureau Of Shipping
Prigipos 7931442 Cyprus Lloyd’s Register Of Shipping
Rani Padmini 7521687 India Lloyd’s Register Of Shipping
Regine 9125877 Germany Germanischer Lloyd
Sanko Prelude 8309141 Panama Nippon Kaiji Kyokai 6.5
Sanko Quality 9066174 Liberia Nippon Kaiji Kyokai 19.5
Sanshu Maru 8919996 Japan Nippon Kaiji Kyokai 5.3
Saqqara 8117031 Egypt Lloyd’s Register Of Shipping 8
Scan Bulker 9105396 Panama Nippon Kaiji Kyokai 146.7
Sea Wisdom 9143714 Panama Nippon Kaiji Kyokai
Silver Zhang 8508187 Hong Kong, China Bureau Veritas 12.8
Star Michalis 8318697 Greece Det Norske Veritas
Stolt Infra 8413980 Panama Nippon Kaiji Kyokai
Sun 8220163 Malta Nippon Kaiji Kyokai
Surmene 4 8308965 Turkey Nippon Kaiji Kyokai
Tahir Kiran 7433713 Turkey Germanischer Lloyd 54.7
Tai Health 9216688 Panama American Bureau Of Shipping
Tai Ping 9086784 Hong Kong, China Lloyd’s Register Of Shipping
Taiyoh Iii 9156591 Singapore Nippon Kaiji Kyokai
Tanja Jacob 7920481 Tuvalu Germanischer Lloyd
Team Merkur 7926241 Norway Det Norske Veritas
Thalassini Tyhi 9071820 Cyprus Lloyd’s Register Of Shipping
Themis P 9075539 Panama Nippon Kaiji Kyokai
Thia Chryssoula 8834586 Cyprus Registro Italiano Navale
Thor Captain 8111752 Thailand Germanischer Lloyd 22
Thor Simba 8308757 Isle Of Man, UK Lloyd’s Register Of Shipping
Thrasyvoulos V 8125820 Panama Lloyd’s Register Of Shipping
Torm Eastern 8400543 Panama Nippon Kaiji Kyokai 26.5
Turandot 9070450 Sweden Lloyd’s Register Of Shipping
Veroika 8421119 Panama Lloyd’s Register Of Shipping
Wadi Al Kamar 8309907 Egypt Lloyd’s Register Of Shipping
Wadi Halfa 8309866 Egypt Lloyd’s Register Of Shipping
Well Pescadores 9198379 Panama Bureau Veritas
Wing Sang 38 8403181 Honduras Honduras International Survey & Inspection Bureau 1085