port year 2019 regional peer review
TRANSCRIPT
x
2019 REGIONAL PEER REVIEW
20
19 R
eport Year
June 2021

2019 REGIONAL PEER REVIEW
2
CONTENTS EXECUTIVE SUMMARY .................................................................................................................................. 3
SNAPSHOT ..................................................................................................................................................... 5
PEER SELECTION ............................................................................................................................................ 6
NOTES/METHODOLOGY ................................................................................................................................ 7
PEER CHARACTERISTICS ................................................................................................................................ 8
RESULTS ........................................................................................................................................................ 9
Service Coverage ....................................................................................................................................... 9
Transit Capacity per Area Resident ....................................................................................................... 9
Vehicle Revenue Miles per Square Mile ............................................................................................... 9
Unlinked Passenger Trips .................................................................................................................... 10
Passenger Trips per Area Resident ..................................................................................................... 10
Passenger Miles Traveled ................................................................................................................... 11
Passenger Miles Traveled per Area Resident ...................................................................................... 11
Service Efficiency and Effectiveness ....................................................................................................... 12
Operating Cost per Unit of Transit Capacity ....................................................................................... 12
Operating Cost per Passenger Trip ..................................................................................................... 12
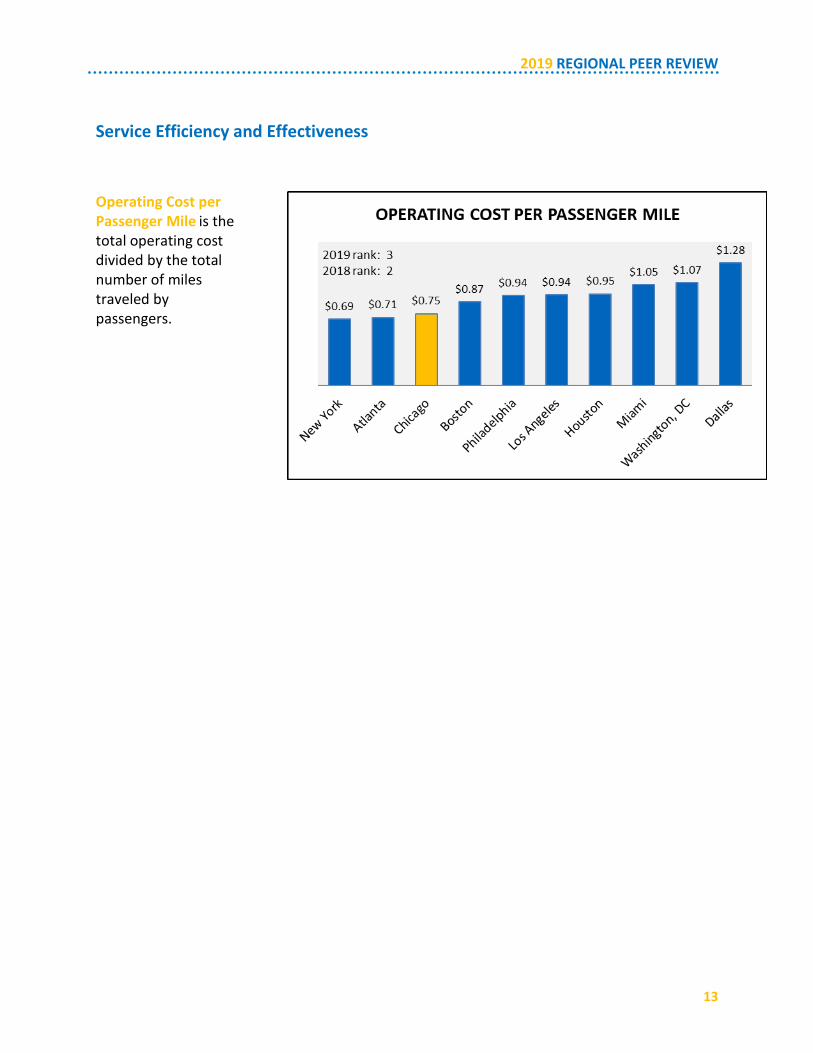
Operating Cost per Passenger Mile .................................................................................................... 13
Service Maintenance and Capital Investment ........................................................................................ 14
Percent of Vehicles Beyond Minimum Useful Life .............................................................................. 14
Miles between Major Mechanical Failures ......................................................................................... 14
Service Level Solvency ............................................................................................................................ 15
Fare Revenue per Passenger Trip ....................................................................................................... 15
Fare Revenue Shortfall per Passenger Trip ......................................................................................... 15
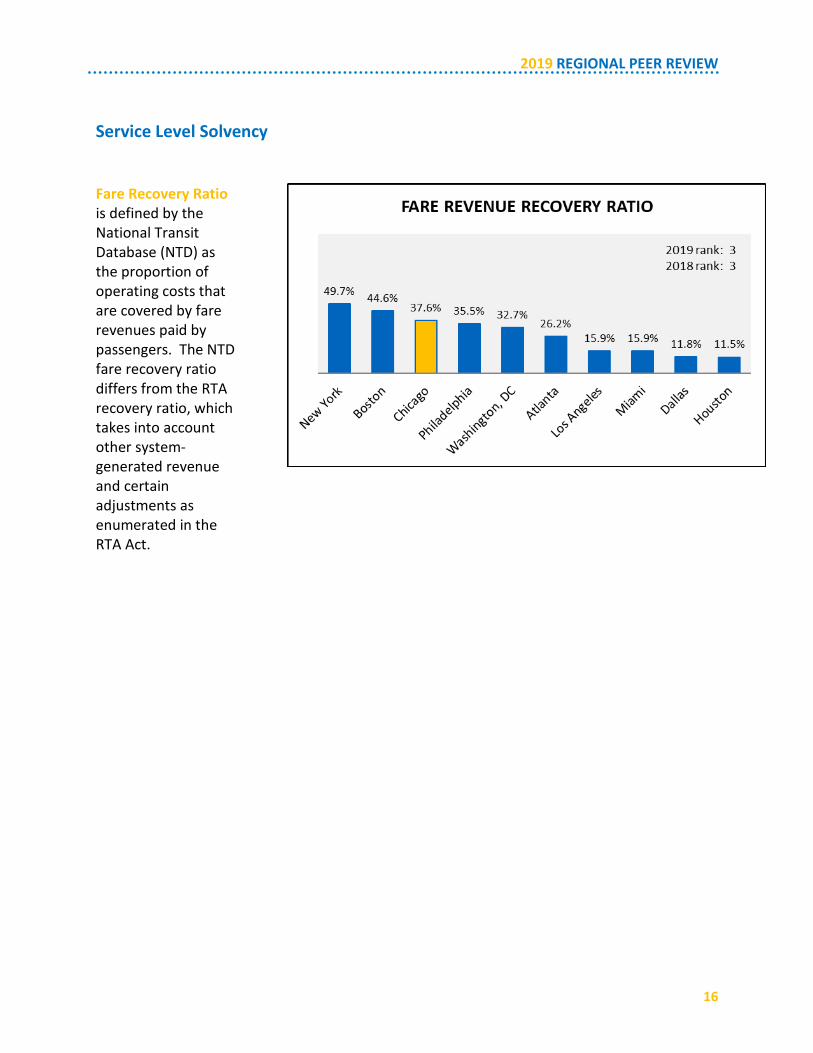
Fare Recovery Ratio ............................................................................................................................ 16
Capital Program Expenditures ............................................................................................................ 17
Capital Program Expenditures per Area Resident .............................................................................. 17

2019 REGIONAL PEER REVIEW
3
EXECUTIVE SUMMARY The regional peer report card was developed to provide context to the performance of the Chicago region’s transit service by relating it to comparable peer regions from across the country. To accomplish this goal, the Regional Peer Review incorporates data reported to the National Transit Database (NTD) by all transit agencies that receive federal funding. This report includes NTD data for report year 2019, the most currently available, which was published in November 2020.
Peer regions were selected based on population, so that the top ten US metropolitan statistical areas (MSAs) are represented: Atlanta, Boston, Dallas, Houston, Los Angeles, Miami, New York, Philadelphia, and Washington, DC, with the Chicago metropolitan area being the third-largest. For each of the top ten regions, the main transit operators were determined so as to best represent each region’s public transportation service.
Chicago-area transit remained ranked in the top half of the peer regions in twelve of the sixteen measures included in this report and again as one of the top three performers for seven of the measures. There was one upward rank change for the year, three downward rank changes, and twelve measures for which Chicago’s ranking remained unchanged from 2018. The Chicago region maintained each rank position in the service coverage area but lost ground for two measures of efficiency and effectiveness. The one upward rank position change was for the reliability measure, miles between major mechanical failures, for which Chicago improved to sixth place. The solvency area saw one downward rank change, for fare revenue per passenger trip, and Chicago maintained its ranking for each of the other four measures.
Employment is closely linked to transit use and is tracked to give context to ridership trends. In 2019, the Chicago region unemployment rate of 3.2%, a 0.7 percentage point improvement over 2018, moving Chicago up two rank positions to sixth, the most favorable position it has held over the past nine years.
The impacts of the COVID-19 pandemic are not apparent in the data contained within this report, but will greatly affect every aspect of transit performance in subsequent report years.

2019 REGIONAL PEER REVIEW
4
Service Coverage: Chicago’s rankings for each of the coverage measures remained unchanged from 2018, ranking in the top three for four of the six measures of coverage. The Chicago region’s best performance compared to its peer regions were for passenger trips, passenger miles, and passenger miles per resident; Chicago ranked second for each measure.
Service Efficiency and Effectiveness: The Chicago region held operating cost increases to 1.7% in 2019, compared to the peer average increase of 5.1%. However, the Chicago region lost three rank positions for operating cost per unit of transit capacity as vehicle revenue miles were unchanged from 2018 and average vehicle capacity decreased nearly 5%. Chicago also dropped one position ranking for operating cost per passenger mile in 2019 as its passenger miles traveled showed one of the steepest decreases among the peer regions.
Service Maintenance and Capital Investment: In 2019, 17.6% of Chicago’s transit fleet vehicles were in service beyond their useful life benchmark, putting Chicago in the 8th rank position for this metric. However, Chicago ranked sixth for the reliability indicator, miles between major mechanical failures, an upward movement of one rank position from 2018.
Service Level Solvency: Although its fare revenue per passenger trip increased 2.7% in 2019, the Chicago region dropped one position to third as Boston saw a greater increase for the year. The Chicago region maintained rank positions for the other two fare-related measures, as well as for both measures relating to capital program expenditures although each increased by roughly 10% 2019. In 2019, the Chicago region expended roughly one-third less than the peer average and roughly one-fourth what New York did on a per-capita basis for capital investment.
Service Coverage•monitors both how much service is available to people in the region (in terms of populationand land area) and how much of that service capacity is used
Service Efficiency & Effectiveness•evaluates the level of resources spent on delivering service in relation to the level of serviceprovided and the extent to which passengers are using that service
Service Maintenance & Capital Investment•indicates the allocation of capital funds and the replacement and maintenance ofinfrastructure components on a schedule consistent with their life expectancy
Service Level Solvency•assesses financial condition to ensure there are sufficient resources to meet current andongoing budgetary needs (both operating and capital)
2019 REGIONAL PEER REVIEW
5
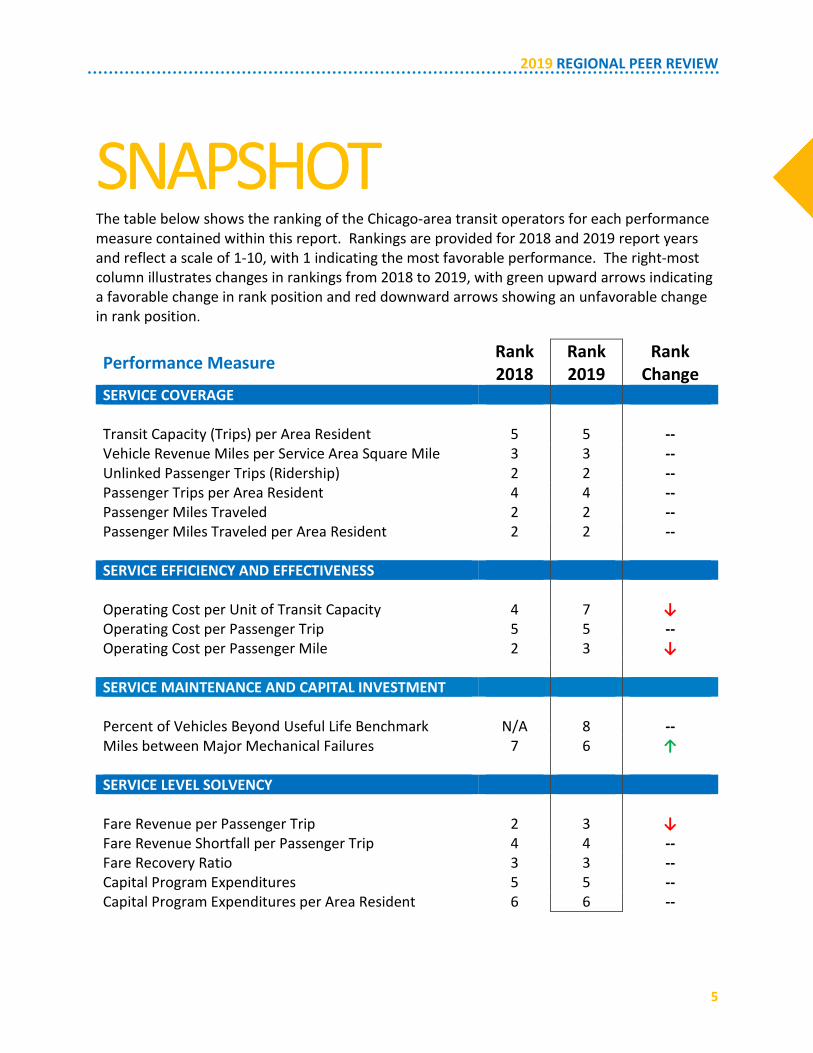
SNAPSHOT The table below shows the ranking of the Chicago-area transit operators for each performance measure contained within this report. Rankings are provided for 2018 and 2019 report years and reflect a scale of 1-10, with 1 indicating the most favorable performance. The right-most column illustrates changes in rankings from 2018 to 2019, with green upward arrows indicating a favorable change in rank position and red downward arrows showing an unfavorable change in rank position.
Performance Measure Rank 2018
Rank 2019
Rank Change
SERVICE COVERAGE
Transit Capacity (Trips) per Area Resident 5 5 -- Vehicle Revenue Miles per Service Area Square Mile 3 3 -- Unlinked Passenger Trips (Ridership) 2 2 -- Passenger Trips per Area Resident 4 4 -- Passenger Miles Traveled 2 2 -- Passenger Miles Traveled per Area Resident 2 2 --
SERVICE EFFICIENCY AND EFFECTIVENESS
Operating Cost per Unit of Transit Capacity 4 7 ↓ Operating Cost per Passenger Trip 5 5 -- Operating Cost per Passenger Mile 2 3 ↓
SERVICE MAINTENANCE AND CAPITAL INVESTMENT
Percent of Vehicles Beyond Useful Life Benchmark N/A 8 -- Miles between Major Mechanical Failures 7 6 ↑
SERVICE LEVEL SOLVENCY
Fare Revenue per Passenger Trip 2 3 ↓ Fare Revenue Shortfall per Passenger Trip 4 4 -- Fare Recovery Ratio 3 3 -- Capital Program Expenditures 5 5 -- Capital Program Expenditures per Area Resident 6 6 --

2019 REGIONAL PEER REVIEW
6
PEER SELECTION The peer group selected for use in the Regional Peer Review consists of the top ten metropolitan statistical areas (MSAs) as defined by the US Bureau of the Census: Chicago, Atlanta, Boston, Dallas, Houston, Los Angeles, Miami, New York, Philadelphia, and Washington, DC. Population and land area data correlate to each MSA region. For consistency with the six-county RTA area, the main transit properties serving each MSA were included in this report.
PEER AGENCIES INCLUDED WITHIN METROPOLITAN STATISTICAL AREAS Geographic
Region Transit Agencies Included
Chicago Chicago Transit Authority, Metra, Pace
Atlanta Metropolitan Atlanta Rapid Transit Authority, Cobb County Department of Transportation Authority
Boston Massachusetts Bay Transportation Authority
Dallas/Fort Worth Dallas Area Rapid Transit, Fort Worth Transportation Authority
Houston Metropolitan Transit Authority of Harris County
Los Angeles
Access Services, Foothill Transit, Long Beach Transit, Los Angeles County Metropolitan Transportation Authority, Los Angeles Department of Transportation, Montebello Bus Lines, Omnitrans, Orange County Transportation Authority, Riverside Transit Agency, Santa Monica Big Blue Bus, Southern California Regional Rail Authority
Miami Broward County Transit, Miami-Dade Transit, PalmTran, South Florida Regional Transportation Authority
New York
All Metropolitan Transportation Authority (MTA) operating agencies (Long Island Rail Road, Metro-North Commuter Railroad, MTA Bus, New York City Transit, Staten Island Railway), Nassau Inter-County Express, New York City Department of Transportation, Port Authority Trans-Hudson, Suffolk County Transportation Division, Westchester County Bee-Line System
Philadelphia Port Authority Transit Corporation, Southeastern Pennsylvania Transportation Authority
Washington, DC
City of Alexandria DASH, Ride-On Montgomery County Transit, Virginia Railway Express, Washington Metropolitan Area Transit Authority

2019 REGIONAL PEER REVIEW
7
NOTES/METHODOLOGY 1. This report is based on 2019 published data from the National Transit Database (NTD),
the most currently available data, released in November, 2020. The data submission bytransit agencies is a requirement of receiving federal funding and thus follows guidelinesand procedures established by the Federal Transit Administration (FTA).
2. The fare recovery ratio used in this report follows the NTD definition, which is theproportion of operating costs that are covered by fare revenues paid by passengers.The NTD recovery ratio differs from the RTA recovery ratio, which takes into accountcertain adjustments as enumerated in the RTA Act such as the exclusion of various costs,the treatment of depreciation, and the inclusion of in-kind services.
3. The use of the metropolitan statistical area (MSA) was selected as the standardrepresentation for each urban area and has been incorporated into this report for bothpopulation and square mileage data. Source: Cumulative Estimates of ResidentPopulation Change and Rankings: April 1, 2010 to July 1, 2019. U.S. Census Bureau,Population Division.
4. New Jersey Transit, which serves both the New York and Philadelphia regions, has beenexcluded from this and prior year reports because there is no way to disaggregate thedata between the two urban areas. As a result, there is some under-representation oftransit service for these urban areas. Similarly, the Maryland Transit Administration,which primarily serves the Baltimore region and also serves the DC area, has not beenincluded in this or prior reports as its operating data cannot be divided among the DCand Baltimore metropolitan statistical areas. As a result, Washington, DC metropolitanarea transit service is slightly understated.
5. 2019 data reflect a change to report the percent of vehicles beyond their useful lifebenchmark, which shifts reporting from the lower limit of a vehicle’s useful lifeexpectation to an upper limit expectation, in lieu of the measure percentage of vehiclesbeyond useful life. Benchmark data reflect unique operating environments andcircumstances of individual transit agencies, which will change as vehicles are rebuilt oroverhauled. Where no benchmark was stated for a revenue vehicle, the default FederalTransit Administration (FTA) benchmark specific to the revenue vehicle type was used.
6. In 2019, Metra began using new methodology to calculate unlinked passenger tripswhich uses data from mobile tickets sold through the Ventra App to estimate thenumber of trips taken using these passes. Metra engaged a qualified statistician toconfirm that this methodology meets the FTA’s statistical sampling requirements andhas the attestation documentation on file.

2019 REGIONAL PEER REVIEW
8
PEER CHARACTERISTICS 2019
CHIC
AGO
ATLA
NTA
BOST
ON
DALL
AS
HOU
STO
N
LOS
ANG
ELES
MIA
MI
NEW
YO
RK
PHIL
ADEL
PHIA
WAS
HIN
GTO
N,
DC
Population Ranking 3 9 10 4 5 2 7 1 8 6
Population (thousands) 9,459 6,020 4,873 7,573 7,066 13,215 6,166 19,216 6,102 6,280
Square Miles 7,197 8,339 3,487 8,928 8,827 4,848 4,602 6,687 5,077 5,598
Population Density 1,314 722 1,397 848 800 2,726 1,340 2,874 1,202 1,122
Vehicle Revenue Miles (millions) 238 62 94 65 77 279 100 710 98 163
Passenger Trips (millions) 550 120 367 75 90 530 122 3,973 319 384
Passenger Miles (millions) 3,563 721 1,680 478 582 3,075 775 19,475 1,522 1,931
Operating Cost (millions) 2,665$ 510$ 1,506$ 647$ 574$ 3,189$ 901$ 13,421$ 1,379$ 2,243$
Fare Revenue (millions) 1,002$ 134$ 672$ 77$ 66$ 509$ 143$ 6,673$ 490$ 733$
Capital Funds Expended (millions)
759$ 304$ 1,065$ 452$ 153$ 1,943$ 287$ 6,524$ 667$ 995$
Average Trip Length (miles) 6.5 6.0 4.6 6.3 6.5 5.8 6.3 4.9 4.8 5.0
Average Vehicle Passenger Capacity
62.8 56.2 120.3 64.6 39.6 45.7 50.1 110.3 86.2 92.0

2019 REGIONAL PEER REVIEW
9
RESULTS Service Coverage
Transit Capacity per Area Resident is the amount of available service, as measured by average vehicle capacity and vehicle revenue miles, per person in each region.
Vehicle Revenue Miles per Square Mile is the total number of miles traveled annually by transit operators in a region per square mile of the metropolitan statistical area (MSA).
2019 REGIONAL PEER REVIEW
10
Service Coverage
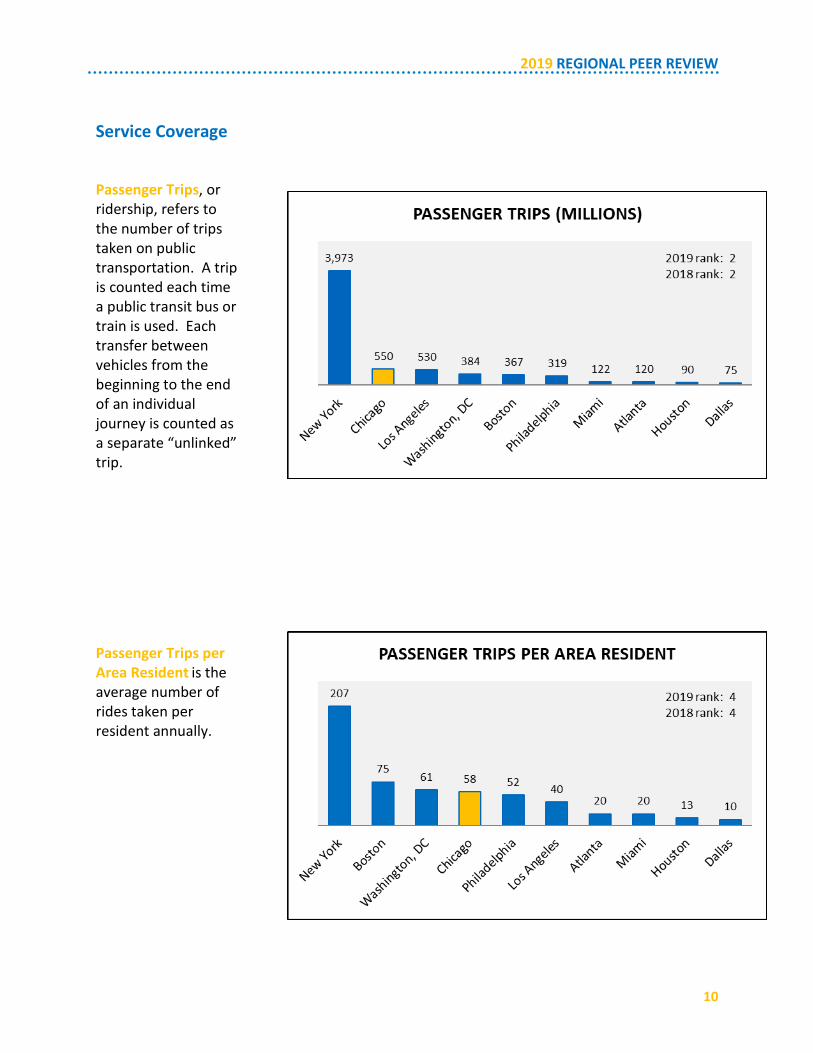
Passenger Trips, or ridership, refers to the number of trips taken on public transportation. A trip is counted each time a public transit bus or train is used. Each transfer between vehicles from the beginning to the end of an individual journey is counted as a separate “unlinked” trip.
Passenger Trips per Area Resident is the average number of rides taken per resident annually.

2019 REGIONAL PEER REVIEW
11
Service Coverage
Passenger Miles Traveled is the cumulative sum of the distances ridden by each passenger.
Passenger Miles Traveled per Area Resident is the average number of passenger miles traveled per resident annually.
2019 REGIONAL PEER REVIEW
12
Service Efficiency and Effectiveness
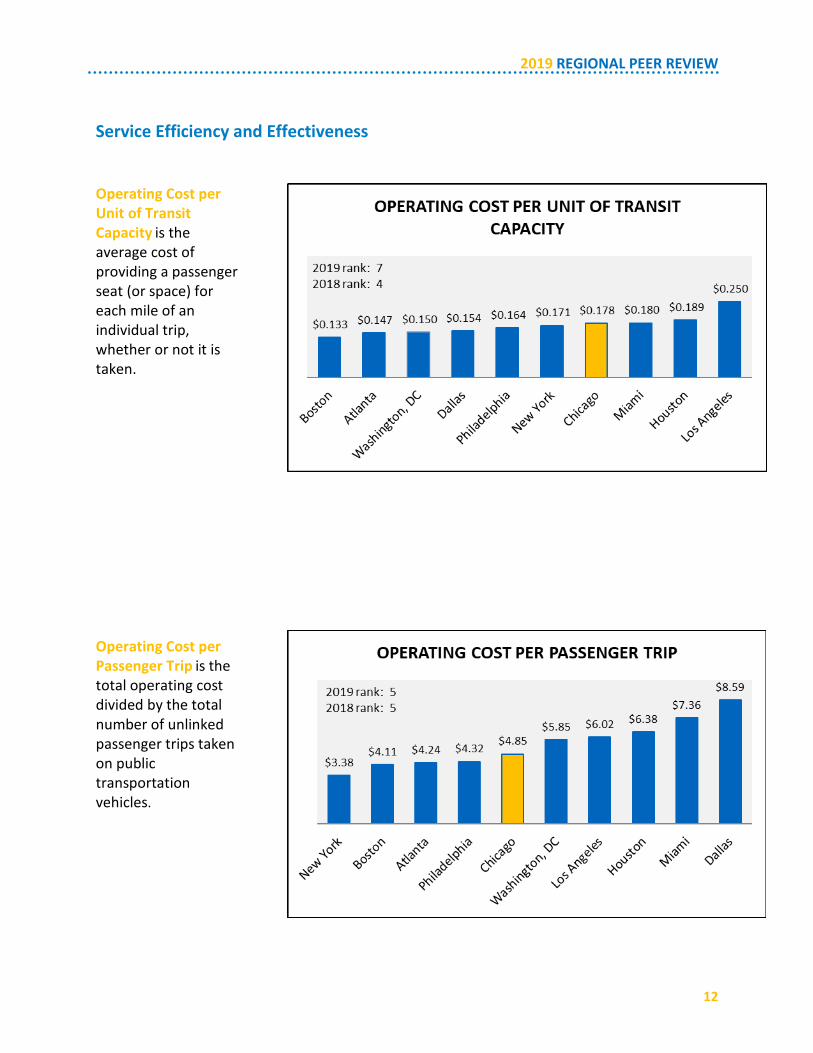
Operating Cost per Unit of Transit Capacity is the average cost of providing a passenger seat (or space) for each mile of an individual trip, whether or not it is taken.
Operating Cost per Passenger Trip is the total operating cost divided by the total number of unlinked passenger trips taken on public transportation vehicles.
2019 REGIONAL PEER REVIEW
13
Service Efficiency and Effectiveness
Operating Cost per Passenger Mile is the total operating cost divided by the total number of miles traveled by passengers.

2019 REGIONAL PEER REVIEW
14
Service Maintenance and Capital Investment
Percent of Vehicles Beyond Useful Life Benchmark The percentage of a revenue vehicle fleet in service beyond the expected lifecycle of a capital asset. Expected lifecycles take into account a particular transit agency's operating environment, and also reflect vehicle rehabilitations and overhauls.
Miles between Major Mechanical Failures is the average number of miles that vehicles travel while in revenue service between failures of some mechanical element or a safety concern that prevents a vehicle from completing a scheduled trip or from starting the next scheduled trip.

2019 REGIONAL PEER REVIEW
15
Service Level Solvency
Fare Revenue per Passenger Trip is the average fare paid by customers per trip.
Fare Revenue Shortfall per Passenger Trip is the average cost of each trip that is not covered by the fare paid by customers. The balance of operating costs is covered by other directly-generated revenue (advertising, concessions, etc.) and public funding (local, state, and federal).
2019 REGIONAL PEER REVIEW
16
Service Level Solvency
Fare Recovery Ratio is defined by the National Transit Database (NTD) as the proportion of operating costs that are covered by fare revenues paid by passengers. The NTD fare recovery ratio differs from the RTA recovery ratio, which takes into account other system-generated revenue and certain adjustments as enumerated in the RTA Act.

2019 REGIONAL PEER REVIEW
17
Service Level Solvency Capital Program Expenditures is the amount of capital funds expended to finance the maintenance, enhancement, and expansion of the transit system’s infrastructure. Note, capital funds expended in one year may include funding from prior years due to the longer-term nature of capital project implementation.
Capital Program Expenditures per Area Resident is the total amount of capital expenditures per resident of the metropolitan statistical area (MSA).
5