portability and hydrogeochemical study of ground water … and... · portability and...
TRANSCRIPT

Beka J.E et al., IJSIT, 2015, 4(2), 186-200
IJSIT (www.ijsit.com), Volume 4, Issue 2, March-April 2015
186
PORTABILITY AND HYDROGEOCHEMICAL STUDY OF GROUND WATER IN
AKWA IBOM STATE, NIGERIA
Beka J.E1, Udom G.J2, Nwankwoala H.O3, Utuedor E4 and Sangoremi A5
1,2, 3 Department of Geology, University of Port Harcourt
4 Department of Enviroment, DESOPADEC, Warri, Nigeria
5Department of Chemistry, Federal University, Otuoke, Nigeria
ABSTRACT
Aquifer delineation and hydrogeochemicalcharacterization of groundwater resources in Akwa Ibom
State was carried out in order to delineate aquifers for the drilling of productive boreholesand evaluate the
groundwater quality. Detailed analysis of borehole lithologic samples shows a multi-aquifer system, with a
sub-regional trend of upper unconfined aquifer and locally restricted subjacent second and third aquifers.
Thirty two groundwater samples were analyzed for their physico–chemical and microbiological properties,
using standard methods. The average temperature of groundwater samples is 27oC. The water is slightly
acidic to slightly alkaline with pH values ranging from 4.28 – 8.92. Electrical conductivity (EC) values range
from 20.3 µs/cm to 343.1 µs/cm. Chloride contents in some boreholes are up to 31.30 mg/l, possibly
indicating saltwater encroachment in those locations (Ibeno, Mbo, Onna and Udung Uko). Microbial analysis
indicates the presence of coliform bacteria in some of the samples (Esit Eket, Onna, and Urue-Offong/Oruko),
which may be indicative of anthropogenic contamination. Total Dissolved Solids (TDS) range from 12.60 –
147 mg/l. Total Iron (Fe) values range from 0.01 - 8.5 mg/l. With the exception of Iron and coliform values in
borehole water samples in some locations, all other analyzed parameters fall within World Health
Organisation and Nigeria Standard for Drinking Water Quality permissible limits for potable water. Both
Piper trilinear and Stiff pattern diagrams were used to determine groundwater types and visualize
groundwater chemistry trends. Compositionally, the trends indicate groundwatercomprising mainly of
mixtures of alkaline earth and alkali metal types. Detailed interpretation of gross for the groundwater
Beka J.E et al., IJSIT, 2015, 4(2), 186-200
IJSIT (www.ijsit.com), Volume 4, Issue 2, March-April 2015
187
chemistry are attributable to ion exchange, carbonate and silicate weathering, precipitation and dissolution
from rocks, through which the water infiltrates. The study provides an applicable scenario in
hydrogeochemical evaluation and aquifer delineation towards sustainable groundwater management in the
study area
INTRODUCTION
Globally, rural communities, particularly in developing nations including Nigeria, have as one of the
major problems, the lack of adequate potable water supply for domestic use. This is the scenario in several
areas, including Akwa Ibom State, because some of the existing water wells which initially produced water
have either dried up, diminished in yield or produced non-potable water. The funds lost or wasted on such
projects would have been properly utilised, if suitable drill sites or depths were recommended from detailed
hydrogeological or geophysical studies.This is the rationale for this research study on Aquifer Delineation and
Hydro-geochemistry.
As further background to this research, a lot of studies have shown that increase in groundwater
abstraction in coastal areas is largely responsible for the encroachment of seawater into coastal groundwater
aquifers (Edet and Okereke, 2001; Udom et al, 1999, 2002). According to Edet andOkereke (2001), the
southern part of AkwaIbom State, which contributes more than 30% of Nigeria’s crude oil is presently
experiencing an increase in human and industrialisation levels. This has resulted in an increase in the rate of
potable water abstraction, with potential impact on groundwater quality, including saltwater encroachment
in the coastal areas.
There are several instances within various regional settings where water boreholes became
unproductive soon after their installation. Within the Nigerian setting, available information indicates that
there was inadequate consideration of existing borehole data to guide the drilling of the boreholes. Studies by
Udom et al(1999) indicate high failure rate of over 70% of the boreholes drilled in Akwa Ibom State, Nigeria.
It is well known that just as in the upstream petroleum sector, well data and site studies are a useful guide to
any drilling operation in the water industry.
(A) LOCATION OF STUDY AREA: The location of study for this research project is AkwaIbom State. The state
occupies part of the southeastern corner of Nigeria. It is located between latitudes 4⁰30’and 5⁰30’ North and
longitudes 7⁰30’ and 8⁰20’ East (Fig. 1.1). Akwa Ibom State is triangular in shape and covers a total land area
of about 6,900 squarekilometers, encompassing the Qua Iboe River Basin, the western part of the lower Cross
River Basin and the eastern part of the Imo River Basin. The State has an ocean front which spans a distance
of 129 kilometers from Ikot Abasi in the west to Oron in the southeast.
(B) AIM AND OBJECTIVES OF THE STUDY: The aim of the study is to systematically generate applicable

Beka J.E et al., IJSIT, 2015, 4(2), 186-200
IJSIT (www.ijsit.com), Volume 4, Issue 2, March-April 2015
188
hydrogeological data, including hydrogeochemical and lithological, from parts of Akwa Ibom State, and use
same to delineateand assess aquifers for proper development of groundwater resources in the state.
Directly deriving from the aim of the study, the specific objectives of this research are:
To use borehole data to delineate the aquifers in the study area.
To determine local groundwater flow direction
To evaluate the hydrogeochemical characteristics of groundwater in Akwa Ibom State with
a view to assessing its suitability with internationally accepted standards for specific uses.
LITERATURE REVIEW
Several research has been done on water quality status of groundwater in the study area, although
several studies have shown effects of increase in human and industrial activities in the Niger Delta (Odigi,
1989; Amadi and Amadi, 1990; Udom, 2004). Uzoukwu (1981) reviewed the importance of groundwater in
Nigeria and highlighted inadequate supply of potable water as the main factor limiting human and economic
activities in many parts of Nigeria, particularly in the eastern Niger Delta. Etu-Efeotor and Odigi (1983)
discussed the groundwater quality problems of the eastern Niger Delta. This was an expansion of the findings
of Etu-Efeotor (1981) on the groundwater hydrogeochemistry in parts of the Niger Delta.
Amajor (1986), outlined the general geochemical characteristics of groundwater in parts of the Niger
Delta, and stressed the high iron and chloride concentrations in some localities. Oteri (1988) interpreted oil
well logs in terms of water quality, and mapped the freshwater/saline water distribution in aquifers of the
eastern Niger Delta.
Amadi and Amadi (1990) in their assessment of the hydrogeochemistry of groundwater in various
parts of the Niger Delta concluded that the geochemical characteristics of the groundwater are closely related
to the peculiar geologic and hydrologic conditions that prevail in the Niger Delta. They noted that the
freshwater aquifers in the Niger Delta occur in three zones: the Northern zone of shallow aquifers generally
less than 100m deep, characterized by continental deposit; Transitional zone of marine and continental
deposits, located southwards towards the coast; and a third aquifer zone that occurs within the sand bars and
beaches of the coastal areas and at depths greater or equal to 200m.
Udom et al (1999, 2002), investigated the hydrogeochemistry of some groundwaters in parts of the
Niger Delta and the results show that the water in these areas are soft and low in dissolved constituents (Fe,
Zn, Ca, Mg, Na, and K) except Fe. Salt water encroachment is evidenced in these areas from geoelectrical
studies (Etu-Efeotor et al., 1989; Oteri, 1990).
Beka J.E et al., IJSIT, 2015, 4(2), 186-200
IJSIT (www.ijsit.com), Volume 4, Issue 2, March-April 2015
189
Edet and Okereke (2001) presented a scheme for detection and monitoring of seawater intrusion in
the Tertiary – Quaternary aquifer systems of the coastal Akwa Ibom State,
HYDROGEOLOGY OF THE STUDY AREA: The Benin Formation forms the main aquifer system in the Niger
Delta, with a total thickness of 1892m (6000ft) around Warri. The lithologic composition is mainly (90%)
sands and sandstones (Offodile, 1979). The remaining percentage is made up of clay and lignite beds that are
hardly continuous over any significant distance, occurring mostly in lenses. The major source of recharge to
this large aquifer system is from rainfall, while discharge sources include interflow and baseflow to the river
systems and abstraction through boreholes from the basin (Offodile, 1979).
The dominant freshwater aquifer is found within the Benin Formation which consists mostly of
continental sands with clay and silt.These materials are believed to have been deposited in a continental
fluviatile to deltaic environment. The clay units have variable thickness ranging from 1m to as much as 15m
in some places. The sand and clay intercalations give rise to a multi aquifer system, characteristic of the Niger
Delta (Etu-Efeotor and Odigi, 1983; Amajor, 1989).
Etu-Efeotor (1981) delineated three (3) main aquifer zones in the Niger Delta (upper, middle and
lower zones). The aquifer of the upper zone are made up of sand, gravels and clay materials. They are
encountered at shallow depth of about 60m. The yield of the aquifer is high. The middle zone comprises of the
mangrove and fresh swamps. There is a common occurrence of clay lenses within the aquifers of this region
and the aquifers occur at lower depth. In the mangrove swamp zone, marine conditions prevail; thick lenses
of marine clays are enclosed. Saline conditions characterize this zone due to the influence of the deltaic front.
Within the sand bars and beaches of the lower region, boreholes must be deep in order to reach good
freshwater aquifers.
Aquifers frequencies have been used to delineate the different units within the multi-layered aquifer
system of the Niger Delta (Etu-Efeotor and Akpokodje, 1990; Akpokodje et al, 1996).The variations in
frequency of aquifers with depth shows that all the aquifers are generally overlain by sands/silt clay or clay at
their respective surfaces, with the exception of coastal beach islands. The stratigraphic sequences of the Niger
Delta Basin with aquifer prospectivety are shown in Table 2.4.
A thick clay layer below overlies the regional aquifer. The thick clay layer below the perched aquifer
is partially continuous laterally, and therefore, constitutes a semi-confining aquitard with very small pressure
head (0.6m above the base of clay).
Ngah (1990) identified three (3) aquiferous zones in the Niger Delta, namely:
An upper unconfined aquifer extending throughout the Benin Formation with its thickness ranging
between 15- 80m, while the static water level varies between 4- 21m.
A middle aquifer system, semi-confined and consisting of thick medium to coarse grained pebbly
Beka J.E et al., IJSIT, 2015, 4(2), 186-200
IJSIT (www.ijsit.com), Volume 4, Issue 2, March-April 2015
190
sands with thick clay lenses. Its thickness varies between 30-60m.
A lower aquifer system that extends from 220-300m and consists of coarse grained sands and some
gravels with some interlayer clay.
The majority of the groundwater supply wells abstract water from the first and second aquifers
(>150m deep). The water table are affected by climate, rainfall and drainage conditions. In the unconfined
aquifer, the water table increases and falls during the dry season (Esu et al, 1999; Udom, 2004
METHODOLOGY
(i) Sample Collection: A detailed field sampling exercise was carried out. This is a very important step in
collecting analytical samples. The groundwater samples were collected observing globally accepted sampling
protocols to maintain sample integrity. Samples were collected after allowing the water from the source run
to for at least five (5) minutes. This was to ensure collection of representative samples. Samples were
collected in three (3) labeled, well drained plastic containers, tightly corked. The choice of plastic containers
is to minimize contamination that could alter the water constituents. The first container was 250ml for
microbial test. The second (1 litre container) was acidified with two (2) drops of concentrated Nitric acid
(HNO3) for cations determination, in order to homogenize and prevent absorption/adsorption of metals to
the wall of the plastic container. Acidification equally stops most bacterial growth, inhibits oxidation
reactions and precipitation of cations. The third plastic container (1litre) was used for anion determination.
These samples were preserved in coolers to keep the temperature below 200C for eventual transfer to the
laboratory for analysis within the standard period of twenty four (24) hours.
(ii) Data Collection: Data collation and collection involved compilation of requisite data including maps,
lithologic logs, borehole data, Static Water Levels. Most of these data were obtained from privately owned
producing boreholes, Akwa Ibom State Rural Water and Sanitation Agency (AK-RUWATSAN) and Akwa Ibom
State Water Corporation (AKSWC)
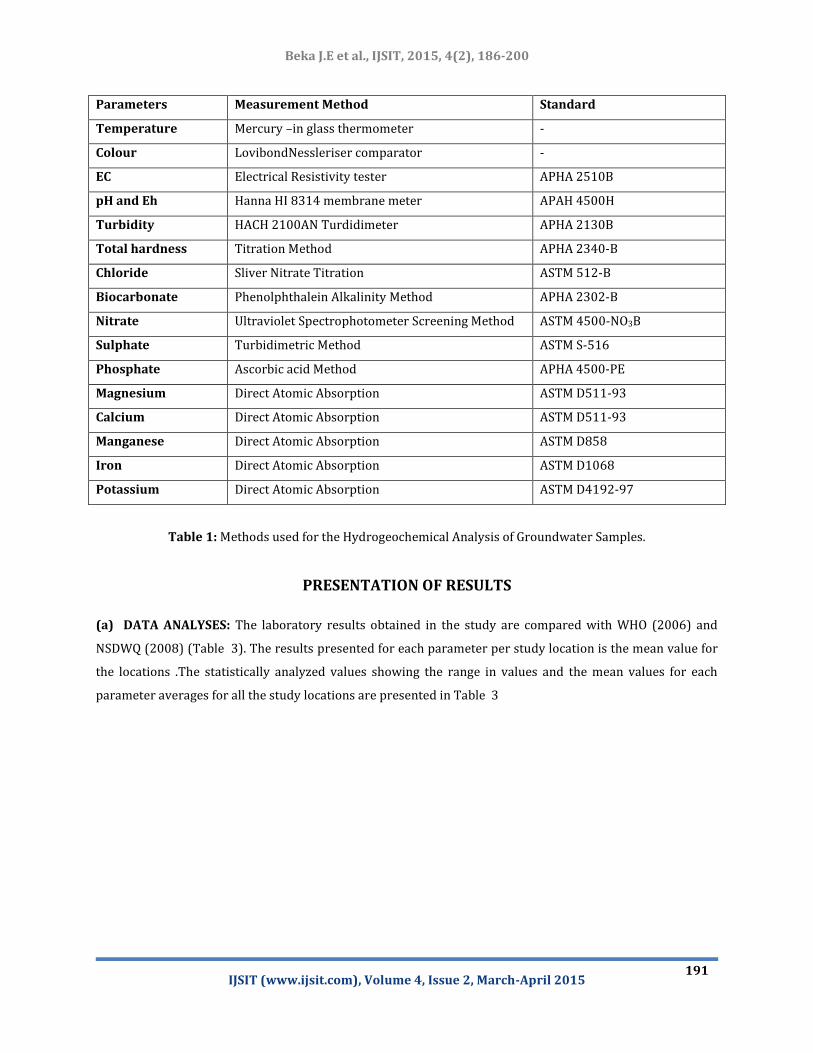
(iii) Laboratory Analyses: The analysis of physico-chemical parameters was done at POCEMA Laboratory
(Port Harcourt), Anal Concept Laboratory, Port Harcourt and University of Port Harcourt laboratories using
standard techniques. The analytical methods used in the determination of water chemistry are in accordance
with the American Standard for Testing Materials (ASTM, 1969) and American Public Health Association
(APHA, 1992) standards and procedures (Table 1).\\
Beka J.E et al., IJSIT, 2015, 4(2), 186-200
IJSIT (www.ijsit.com), Volume 4, Issue 2, March-April 2015
191
Parameters Measurement Method Standard
Temperature Mercury –in glass thermometer -
Colour LovibondNessleriser comparator -
EC Electrical Resistivity tester APHA 2510B
pH and Eh Hanna HI 8314 membrane meter APAH 4500H
Turbidity HACH 2100AN Turdidimeter APHA 2130B
Total hardness Titration Method APHA 2340-B
Chloride Sliver Nitrate Titration ASTM 512-B
Biocarbonate Phenolphthalein Alkalinity Method APHA 2302-B
Nitrate Ultraviolet Spectrophotometer Screening Method ASTM 4500-NO3B
Sulphate Turbidimetric Method ASTM S-516
Phosphate Ascorbic acid Method APHA 4500-PE
Magnesium Direct Atomic Absorption ASTM D511-93
Calcium Direct Atomic Absorption ASTM D511-93
Manganese Direct Atomic Absorption ASTM D858
Iron Direct Atomic Absorption ASTM D1068
Potassium Direct Atomic Absorption ASTM D4192-97
Table 1: Methods used for the Hydrogeochemical Analysis of Groundwater Samples.
PRESENTATION OF RESULTS
(a) DATA ANALYSES: The laboratory results obtained in the study are compared with WHO (2006) and
NSDWQ (2008) (Table 3). The results presented for each parameter per study location is the mean value for
the locations .The statistically analyzed values showing the range in values and the mean values for each
parameter averages for all the study locations are presented in Table 3
Beka J.E et al., IJSIT, 2015, 4(2), 186-200
IJSIT (www.ijsit.com), Volume 4, Issue 2, March-April 2015
192
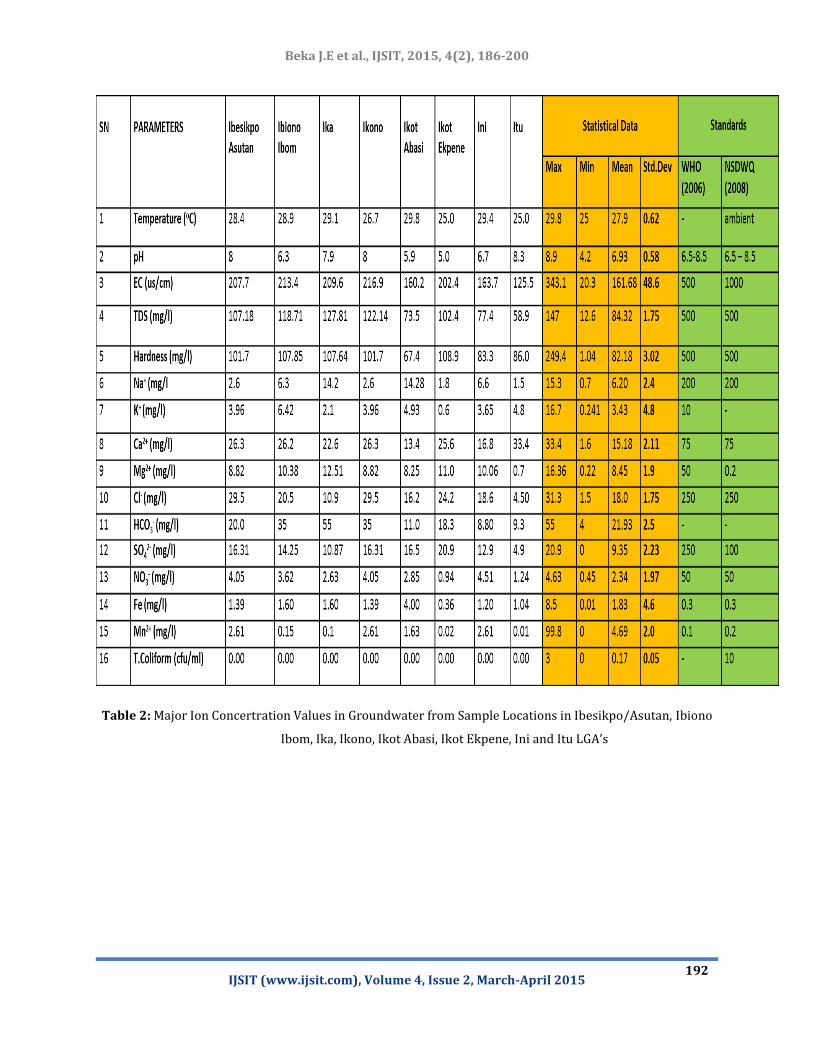
Table 2: Major Ion Concertration Values in Groundwater from Sample Locations in Ibesikpo/Asutan, Ibiono
Ibom, Ika, Ikono, Ikot Abasi, Ikot Ekpene, Ini and Itu LGA’s

Beka J.E et al., IJSIT, 2015, 4(2), 186-200
IJSIT (www.ijsit.com), Volume 4, Issue 2, March-April 2015
193
S/N Parameters Average Maximum Minimum WHO
(2006)
NSDWQ
(2008)
1. Temperature (OC) 27.9 29.8 25 - ambient
2. pH 6.93 8.9 4.2 6.5-8.5 6.5 – 8.5
3. EC (us/cm) 161.68 343.1 20.3 500 1000
4. TDS (mg/l) 84.32 147 12.6 500 500
5. Hardness (mg/l) 82.18 249.4 1.04 500 500
6. Na+(mg/l) 6.20 15.3 0.7 200 200
7. K+(mg/l) 3.43 16.7 0.241 10 -
8. Ca2+(mg/l) 15.18 33.4 1.6 75 75
9. Mg2+ (mg/l) 8.45 16.36 0.22 50 0.2
10. Cl-(mg/l) 18.0 31.3 1.5 250 250
11. HCO3-(mg/l) 21.93 55 4 - -
12. SO42- (mg/l) 9.35 20.9 0 250 100
13. NO3- (mg/l) 2.34 4.63 0.45 50 50
14. Fe (mg/l) 1.83 8.5 0.01 0.3 0.3
15. Mn2+ (mg/l) 4.69 99.8 0 0.1 0.2
16. T.Coliform
(cfu/ml)
0.17 3 0 - 10
Table 3: Statistical Analysis of Values of Analyzed Parameters Averaged Over the Study Locations.
Beka J.E et al., IJSIT, 2015, 4(2), 186-200
IJSIT (www.ijsit.com), Volume 4, Issue 2, March-April 2015
194
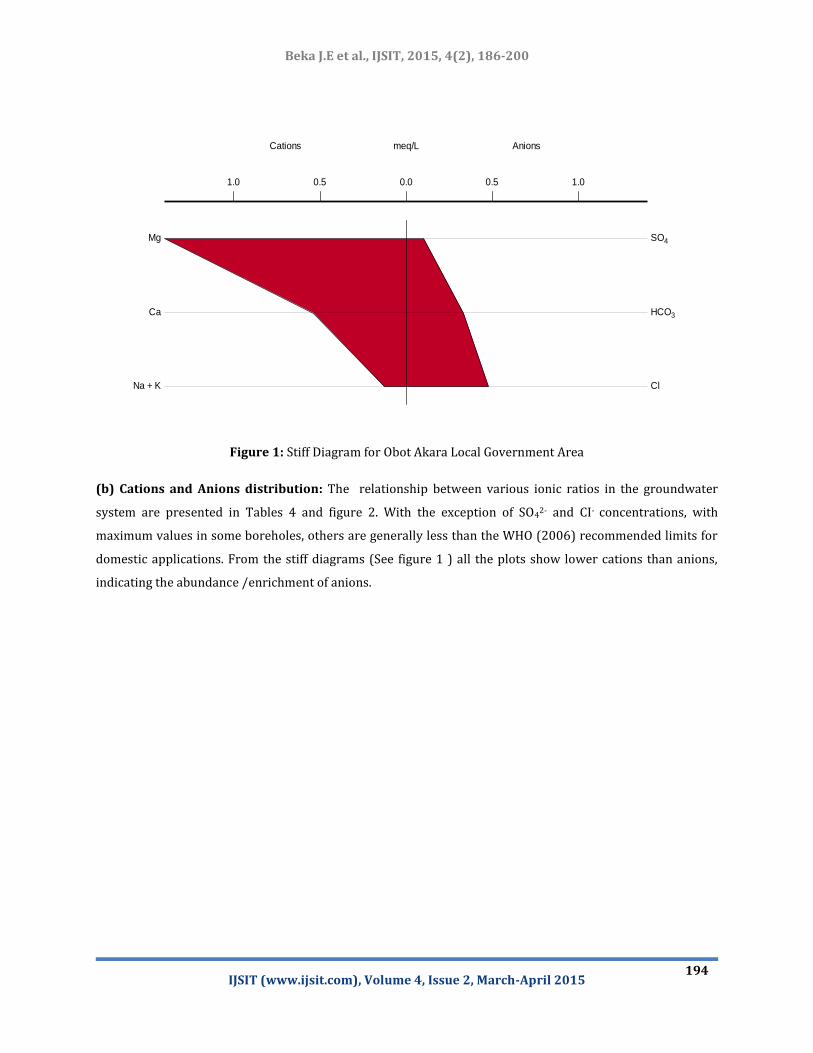
Figure 1: Stiff Diagram for Obot Akara Local Government Area
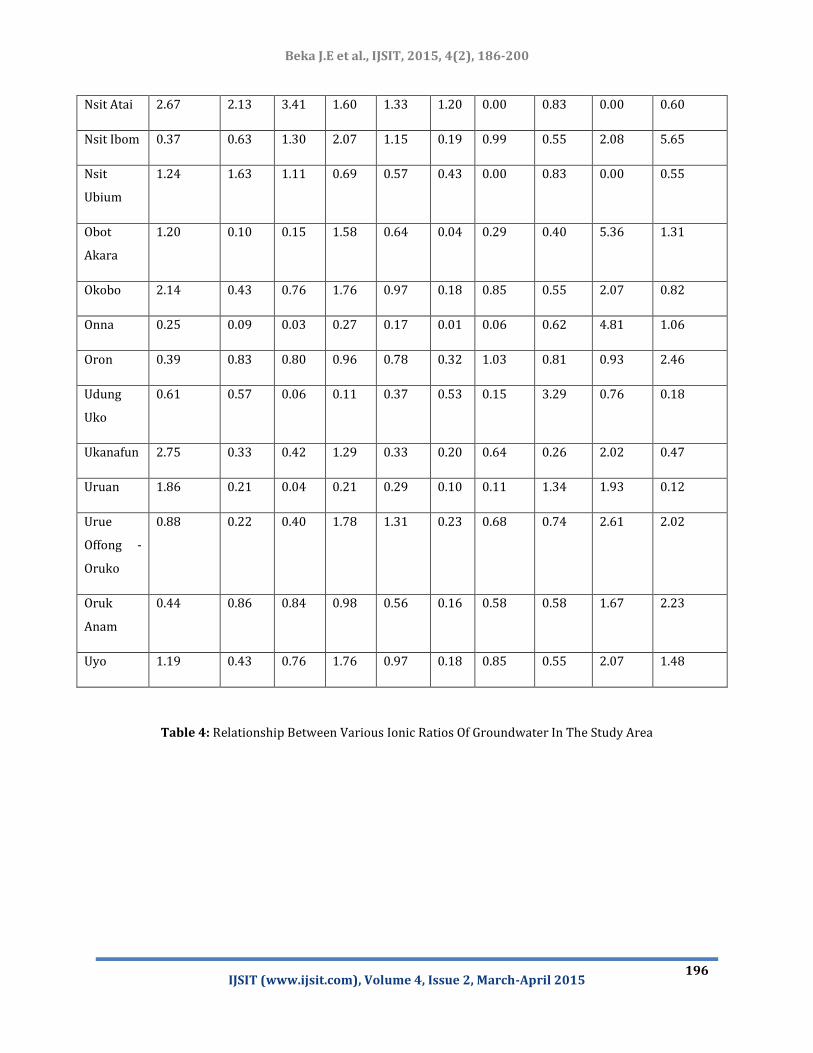
(b) Cations and Anions distribution: The relationship between various ionic ratios in the groundwater
system are presented in Tables 4 and figure 2. With the exception of SO42- and CI- concentrations, with
maximum values in some boreholes, others are generally less than the WHO (2006) recommended limits for
domestic applications. From the stiff diagrams (See figure 1 ) all the plots show lower cations than anions,
indicating the abundance /enrichment of anions.
Stiff Diagram
Cations Anionsmeq/L
0.0 0.5 1.00.51.0
Mg SO4
Ca HCO3
Na + K Cl

Beka J.E et al., IJSIT, 2015, 4(2), 186-200
IJSIT (www.ijsit.com), Volume 4, Issue 2, March-April 2015
195
LGA HCO3/Cl Na/Ca Na/Cl Ca/Cl Mg/Cl K/Cl SO4/Cl Mg/Ca Ca/SO4 Ca/HCO3
Abak 2.44 0.24 0.31 1.28 0.51 0.31 0.70 0.40 1.84 0.52
Eastern
Obolo
5.56 11.13 1.56 0.14 0.48 0.64 1.91 3.37 0.07 0.03
Eket 0.73 21.77 0.17 0.01 0.04 0.04 0.11 4.83 0.07 0.01
Esit Eket 3.00 1.91 1.53 0.80 1.00 0.85 0.00 1.25 0.00 0.27
Essien
Udim
1.63 0.79 0.57 0.72 0.53 0.28 0.73 0.73 0.99 0.44
Etinan 0.75 0.36 0.38 1.06 0.95 0.14 0.62 0.90 1.70 1.40
Etim
Ekpo
2.62 0.89 0.64 0.72 0.47 0.29 0.75 0.66 0.96 0.27
Ibeno 0.96 0.57 0.10 0.17 0.27 0.13 0.05 1.60 3.13 0.17
Ibesikpo
Asutan
0.68 0.10 0.09 0.89 0.30 0.13 0.55 0.34 1.61 1.32
Ibiono
Ibom
1.71 0.24 0.31 1.28 0.51 0.31 0.70 0.40 1.84 0.75
Ika 5.05 0.63 1.30 2.07 1.15 0.19 0.99 0.55 2.08 0.41
Ikono 1.19 0.10 0.09 0.89 0.30 0.13 0.55 0.34 1.61 0.55
Ikot Abasi 0.68 1.07 0.88 0.83 0.51 0.30 1.02 0.62 0.81 1.22
Ikot
Ekpene
0.76 0.07 0.07 1.06 0.45 0.02 0.86 0.43 1.22 1.40
Ini 0.47 0.39 0.35 0.90 0.54 0.20 0.69 0.60 1.30 1.91
Itu 2.07 0.04 0.33 7.42 0.16 1.07 1.09 0.02 6.82 3.59
Mbo 1.10 0.20 0.03 0.16 0.04 0.01 0.08 0.25 1.90 0.14
Mkpat
Enin
0.46 0.04 0.04 1.09 0.66 0.24 0.98 0.61 1.11 2.39
Beka J.E et al., IJSIT, 2015, 4(2), 186-200
IJSIT (www.ijsit.com), Volume 4, Issue 2, March-April 2015
196
Nsit Atai 2.67 2.13 3.41 1.60 1.33 1.20 0.00 0.83 0.00 0.60
Nsit Ibom 0.37 0.63 1.30 2.07 1.15 0.19 0.99 0.55 2.08 5.65
Nsit
Ubium
1.24 1.63 1.11 0.69 0.57 0.43 0.00 0.83 0.00 0.55
Obot
Akara
1.20 0.10 0.15 1.58 0.64 0.04 0.29 0.40 5.36 1.31
Okobo 2.14 0.43 0.76 1.76 0.97 0.18 0.85 0.55 2.07 0.82
Onna 0.25 0.09 0.03 0.27 0.17 0.01 0.06 0.62 4.81 1.06
Oron 0.39 0.83 0.80 0.96 0.78 0.32 1.03 0.81 0.93 2.46
Udung
Uko
0.61 0.57 0.06 0.11 0.37 0.53 0.15 3.29 0.76 0.18
Ukanafun 2.75 0.33 0.42 1.29 0.33 0.20 0.64 0.26 2.02 0.47
Uruan 1.86 0.21 0.04 0.21 0.29 0.10 0.11 1.34 1.93 0.12
Urue
Offong -
Oruko
0.88 0.22 0.40 1.78 1.31 0.23 0.68 0.74 2.61 2.02
Oruk
Anam
0.44 0.86 0.84 0.98 0.56 0.16 0.58 0.58 1.67 2.23
Uyo 1.19 0.43 0.76 1.76 0.97 0.18 0.85 0.55 2.07 1.48
Table 4: Relationship Between Various Ionic Ratios Of Groundwater In The Study Area
Beka J.E et al., IJSIT, 2015, 4(2), 186-200
IJSIT (www.ijsit.com), Volume 4, Issue 2, March-April 2015
197
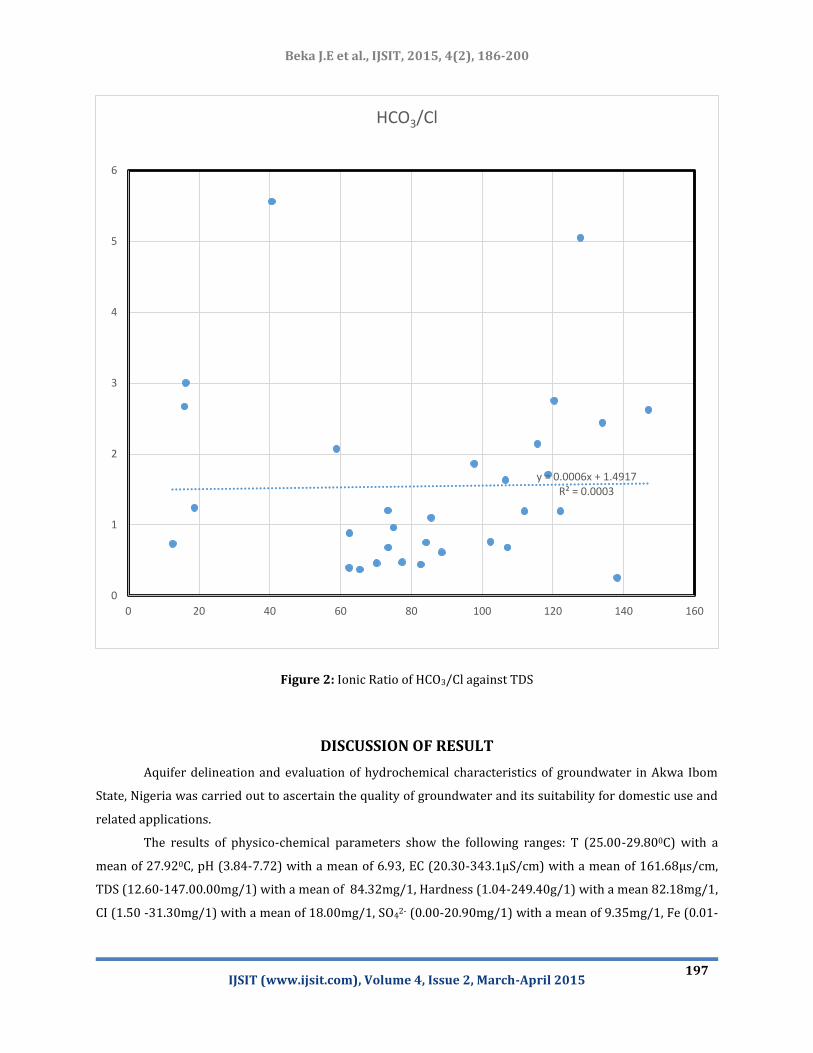
Figure 2: Ionic Ratio of HCO3/Cl against TDS
DISCUSSION OF RESULT
Aquifer delineation and evaluation of hydrochemical characteristics of groundwater in Akwa Ibom
State, Nigeria was carried out to ascertain the quality of groundwater and its suitability for domestic use and
related applications.
The results of physico-chemical parameters show the following ranges: T (25.00-29.800C) with a
mean of 27.920C, pH (3.84-7.72) with a mean of 6.93, EC (20.30-343.1µS/cm) with a mean of 161.68µs/cm,
TDS (12.60-147.00.00mg/1) with a mean of 84.32mg/1, Hardness (1.04-249.40g/1) with a mean 82.18mg/1,
CI (1.50 -31.30mg/1) with a mean of 18.00mg/1, SO42- (0.00-20.90mg/1) with a mean of 9.35mg/1, Fe (0.01-
y = 0.0006x + 1.4917 R² = 0.0003
0
1
2
3
4
5
6
0 20 40 60 80 100 120 140 160
HCO3/Cl

Beka J.E et al., IJSIT, 2015, 4(2), 186-200
IJSIT (www.ijsit.com), Volume 4, Issue 2, March-April 2015
198
8.50mg/1) with a mean of 1.83, NO3- (0.45-4.63mg/1) with a mean of 2.34mg/1, Ca2+ (1.60-33.40mg/1) with
a mean of 15.18mg/1, Na+(0.7-15.3mg/1) with a mean of 6.20mg/1,Mg2+ (0.22-16.36mg/1) with a mean of
8.45, K+ (0.24-16.70mg/1) with a mean of 3.43mg/1, Mn2+ (0.00-99.80mg/1) with a mean of 4.69mg/1, HCO3-
(4.00-55.00mg/1) with a mean of 21.93mg/1, and T. Coliform (0.00-3.00cfu/m1) with a mean value of
0.17cfu/ml.
The results show that the pH values of the groundwater in the study area ranges from slightly acidic
to slightly basic. At locations where pH values are less than 6.50, the water should be treated to raise the
value to the acceptable WHO standard of 6.50-8.50, the treatment may base on an exchange method with
dolomite which is suitable for treating the parameter. Acidic groundwaters are aggressive, hence boreholes in
the area should be constructed with PVC pipes and other non-corrosive materials. This is imperative because
if pH and iron are treated for at location where they exceed their limits, the water will be potable and suitable
for drinking and other domestic purposes. Regular flushing of boreholes and distribution systems can help
remove buildup of ferruginous material deposits. For agricultural purposes, the water is suitable in view of
the low Sodium Adsorption Ratio (SAR) values.
The study also reveals saltwater contamination in the area as chloride contents in some boreholes
are up to 40mg/l, (31.30mg/l) which also agrees with Amadi (2004) who reported a chloride concentration
of 72.306mg/1, using the specification of Tremblay et al., (1973). This shows saltwater encroachment at
those locations. This is probably due to the closeness of these location to the sea.
This study has shown that most of the area, including the reclaimed land with a large amount of
trapped old seawater and organic matter, indicates that the reclamation processes in essence impacts on the
groundwater quality in the coastal area, the groundwater in some of the areas affected by saline water
intrusion resulted from the present seawater but also the trapped old seawater, and reduction processes. The
effects of these factors may be different through its flow paths, due to residence time in the residual
environment and the vicinity of the coastline.
The study indicates that of the cations and anions analyzed for in the water, chloride (cl-) and
sulphate dominate. this agrees with the findings of Amadi (2004). However, the concentration levels of most
chemical parameters are below the stipulated standards (WHO, 2006), showing that the water is potable in
view of these parameters. Calcium concentration ranges from 33.4mg/l to 1.6mg/l. Calcium (Ca) in the water
probably owes its origin to silicates and feldspars which characterize the coastal plain sands where the
boreholes tap water from, while magnesium comes from ferromagnesian minerals in the adjourning Oban
Massif, or partly from the sea.
The concentration values of K+ ions are lower than Ca+ and Mg2+ in the water groundwater in te study
area. Sodium and Potassium ions could also emanate from the feldspars.
The study has shown that the local geology is the principal factor controlling the chemistry of
groundwater in term of the water types and the processes. The main processes include chloride solution and
ion exchange.
Beka J.E et al., IJSIT, 2015, 4(2), 186-200
IJSIT (www.ijsit.com), Volume 4, Issue 2, March-April 2015
199
Microbial studies show that groundwater samples from three (3) locations have detectable values of
coliform counts in them. Maximum coliform count (3.00Cfu/ml) is found at Esit Eket, followed by 2.10 Cfu/ml
at Orue Offong Oruko, then 0.10 Cfu/ml at Abak and Onna. The values of total coliform counts in groundwater
samples in the above named areas exceed the WHO and NSDWQ limits of 0.00 Cfu/ml for safe drinking water,
and are generally due to fecal contamination from nearby facilities like soak-away pits. This poses high risk of
cholera and stomach disorder upon consumption. This is enhanced by poor borehole constructions in the
study area.
REFERENCES
1. Akpokodje, E.G., Etu-Efeotor, J.O.,& Mbeledogu,I.U (1996)”A study of environmental effects of deep
subsurface injection of drilling waste on water resources of the Niger Delta” CORDEC, University of Port
Harcourt, Choba, Port Harcourt, Nigeria.
2. Alabo, D.M; Matsuo, G; Suchy, M; Abbey, D.G (2001) A multidisciplinary approach to studying the nature
and occurrence of saline groundwater in the gulf islands, british Columbia, Canada.
3. Amajor, L.C. (1991) Aquifer in the Benin Formation (Miocene-Recent), Eastern Niger Delta, Nigeria:
Lithostartigraphy, Hydraulics, and Water Quality. Environ. Geol. Water Sci., Vol.17, No. 2: 85-101.
4. American Society Testing Materials (1969) Manual on Water, 14th Edition. Hamilton D.E., Philadelphia,
Pp 171-227
5. Asseez, L. O. (1989). Review of the Stratigraphy, Sedimentation and Structure of the Niger Delta. In
Kogbe C. A. (Ed), Geology of Nigeria. Jos: Rockview (Nigeria) Limited.
6. Back W (1966) Hydrochemical Facies and Groundwater Flow Patterns in Northern Part of Atlantic
Coastal Plain: Us Geological Survey Professional Paper 498-A, 42pp
7. Beka, J. E. (2014). Assessment of Hydrocarbon Pollution Potential of Aquifers in Parts of Akwa Ibom
State, Nigeria. Paper Presented at 7th NAPE Mini – Conference for Tertiary Institutions, 5th – 8th June,
2014; University of Port Harcourt, Nigeria.
8. Bolaji, T.A. (2009). Hydrogeochemistry and quality index of groundwater in Port Harcourt, Nigeria. Msc
Thesis, University of Port Harcourt, Nigeria. Pp186..
9. Etu-Efeotor, J.O. (1981) Preliminary Hydro Chemical Investigations of Subsurface Water in Parts of the
Niger Delta. Jmg Vol. 18, No.1, 163-443.
10. Etu-Efeotor, J.O. and Akpokodje , E.G (1990) Aquifer Systems of Niger Delta. JMG Vol. 26 No 2, 279-284.

Beka J.E et al., IJSIT, 2015, 4(2), 186-200
IJSIT (www.ijsit.com), Volume 4, Issue 2, March-April 2015
200
11. Knuth, M; Jackson, J.L; And Whittemore, D.O (1989) An Integrated Approach To Identifying The Salinity
Source Contaminating A Groundwater Supply. Groundwater 28 (2): 207-214.
12. Omoboriowo, A.O et al (2012) Appraisal of the Groundwater Quality in Arochukwu Area, Afikpo Basin,
Nigeria . International Journal of Science and Technology ,Volume 2 (11): 788-793
13. Udom, G. J. (2004). Regional Hydrogeology of Akwa Ibom State, Nigeria Using Lithological, Pump Testing
and Resistivity Data. Unpolished PhD Thesis, University of Calabar.
14. Udom,G. J., Esu, E.O. and Ekwere, S. J. (1998).Quality status of groundwater in Calabar municipality,
southeastern Nigeria. Global Journal of pure and Applied Sciences. Vol.4 (2):163-169.
15. Udom, G. j.; Etu-Efeotor, J.O. and Esu, E.O. (1999). Hydro chemical evaluation of groundwater in parts of
Port Harcourt and Tai-Elemi Local Government Area, River., Global Journal of pure and Applied Sciences,
Vol.5,pp546-552.
16. Udom G..j.; Etu-Efeotor, J.O. and Ekere,S. J. (1998). Quality Status of Groundwater in Calabar
Municipality, Southeastern Nigeria. Global Journal of pure and Applied Sciences