portable x-ray fluorescence to determine the composition of household objects katherine spoth,...
Post on 20-Dec-2015
216 views
TRANSCRIPT

Portable X-Ray Fluorescence to Determine the Composition of
Household ObjectsKatherine Spoth, mentor Peter Revesz
August 13, 2010

The Project
• Learn the physics of XRF• Master the use of the XRF setup and related software• Collect samples• Run XRF measurements/collect spectra from each sample• Identify features in the spectrum• Determine which element produced each peak• Use software to carry out rough quantitative analysis

Review of XRF
• Incoming X-ray radiation excites an inner electron and causes it to be ejected from an atom.
• Outer electrons fall to fill this vacancy, releasing X-rays with energy equal to the difference between the two energy levels.

Review of XRF• Each element when excited emits a unique X-
ray spectrum.
• This is used to determine which elements are present in a spectrum from an unknown sample.
The characteristic spectrum of copper.

Setup
• Amptek Mini-X X-ray tube.
• Generates X-rays by using accelerated electrons to excite electrons in a silver target, which then emits X-rays at its characteristic energy 22.16 keV.
• Continuous Bremsstrahlung radiation also produced.

Setup
• Amptek XR-100SDD - silicon drift detector
• Amptek PX4 - digital pulse processor and multichannel analyzer
• X-rays create electron-hole pairs in silicon material in the detector, produces electrical pulse with height proportional to X-ray energy.
• PX4 measures pulse height and sorts into channels based on X-ray energy, producing a spectrum.

Setup
• The sample is placed on a joystick-controlled 2-axis table.
• Allows user to change locations or look at multiple samples without turning off the X-ray source and opening the enclosure.

Setup
• Setup also includes a camera that allows the user to see where the sample is located.
• Can use a fluorescent screen to determine the area that the X-ray beam impacts.
• This can be marked onto the camera and used to determine which part of the sample is receiving X-rays.
• Allows view of a sample to be shown on a projector for demonstrations.

Setup
• X-ray source, sample, and detector all are contained in a lead acrylic enclosure, ensuring no radiation can escape.
• Interlock system prevents door from being opened while X-ray source is powered on.

Spectrum Analysis
• The collected spectrum is displayed in Amptek’s ADMCA program.
• The program is also used to control the PX4, to start and stop data acquisition.

Spectrum Analysis
• Peaks can be selected and their centroid energy will be displayed
• Determine which element produces a peak at that energy, look for other peaks from the same element to be certain of its presence

Quantitative Analysis
• After it is determined which elements are present in a sample, XRS-FP can be used to give approximate concentrations
• This software processes the spectrum: removes background, smoothes the spectrum, removes artifacts from the source, subtracts a background spectrum, and deconvolves the spectrum to compute the intensity of each element peak
• Uses fundamental parameters to compute concentrations from these intensities
• This approach requires the user to input details about the geometry of the XRF setup and a list of the elements present

Quantitative Analysis
A spectrum before and after processing in XRS-FP.

Quantitative Analysis

Quantitative Analysis
• Method has several limitations:
• X-rays from light elements attenuate in air too much to be detected by this setup
• The mass fraction that is produced does not account for the possible presence of light elements
• Approximations in user inputs also decrease the accuracy of the concentrations given by the program
• These ideas need to be kept in mind when interpreting results from XRS-FP.

Results
• Around 100 different samples were tested - very few were found to contain anything harmful
• Samples that did contain elements like lead and cadmium tended to be older items
• None of the samples we purchased for the project contained dangerous materials (face paints, cosmetics, crayons)
• Some interesting samples are shown on the following slides.

Results
This is a children’s bracelet that I found in my house, probably from the late 1990s. The beads are colored made
of colored plastic so the lead found here is found in the beads, not just in a paint or surface coating.

Results
The spectrum created by one sample of the face paint that was purchased in June. The spectra shown have all been
processed in XRS-FP.
Results
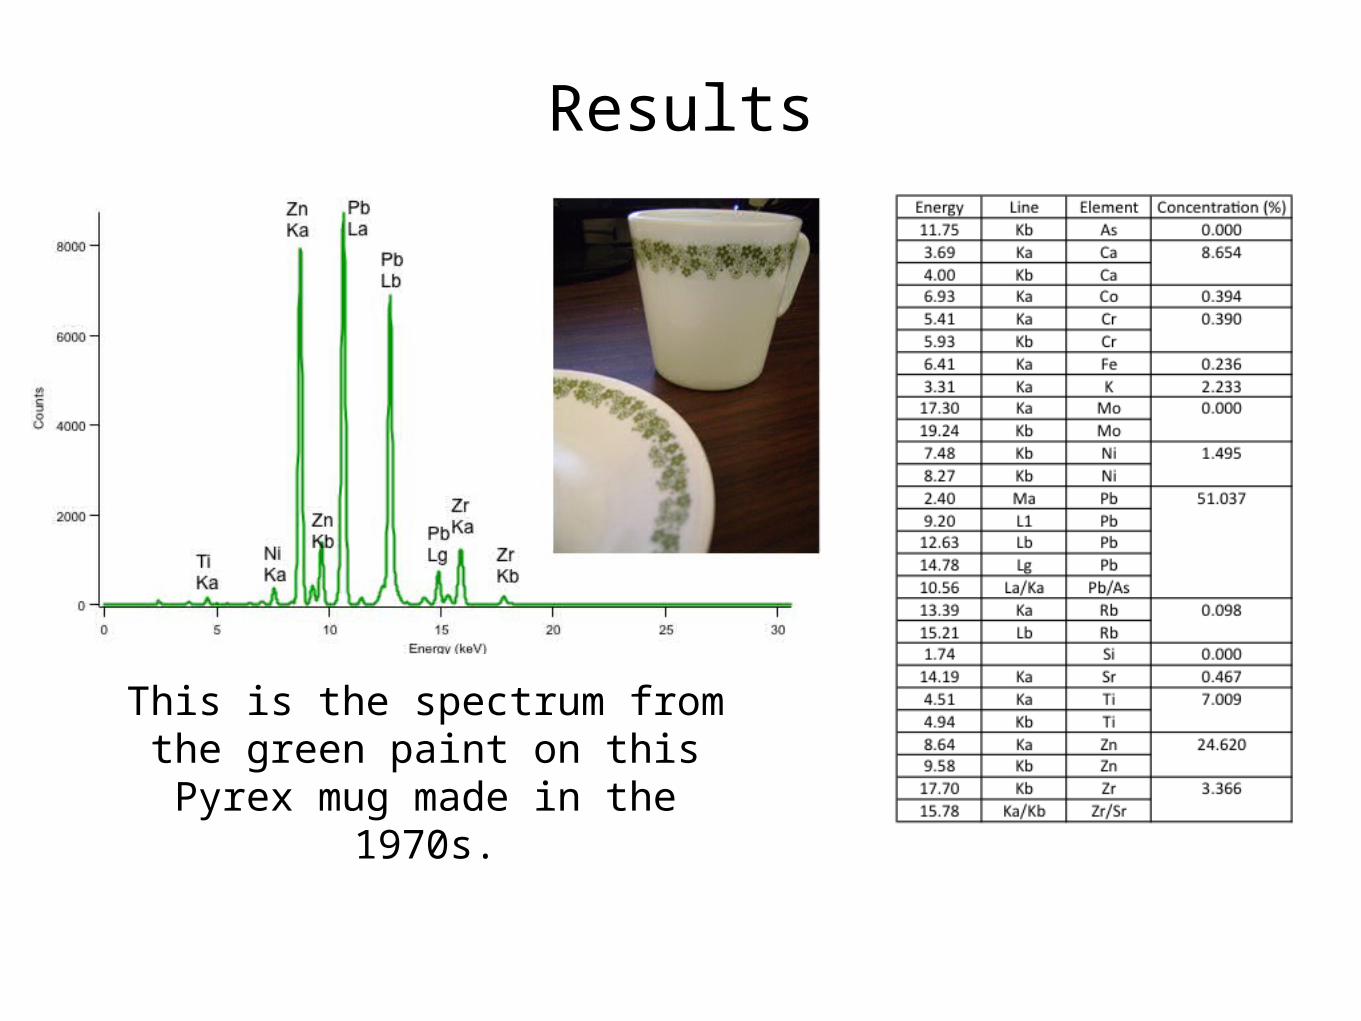
This is the spectrum from the green paint on this Pyrex mug
made in the 1970s.

Results
A soil sample collected near the lower Wilson ab parking
lot.

Outreach
• The portable XRF cart’s main purpose is outreach and teaching
• Presented the setup to several groups of visiting teachers
• Gave brief introduction to XRF
• Described the apparatus and setup
• Demonstrated the process using a sample provided from the audience
• Allowed visitors to use the chart to match a peak’s energy to the element

Outreach
• The XRF setup is a valuable teaching tool for several reasons:
• Its portability allows it to be used in any location.
• Spectra can be displayed on the monitor on the cart or the computer can be attached to a projector.
• XRF can be easily explained to groups with almost any amount of science background.
• The use of audience-contributed samples increases interest and participation.