portage lake watershed forever plan: description of...
TRANSCRIPT

Portage Lake Watershed Forever Plan 18
Description of Portage Lake Watershed This section provides a comprehensive description of the Portage Lake watershed, including its physical, political, and environmental setting.
PHYSICAL AND NATURAL FEATURES
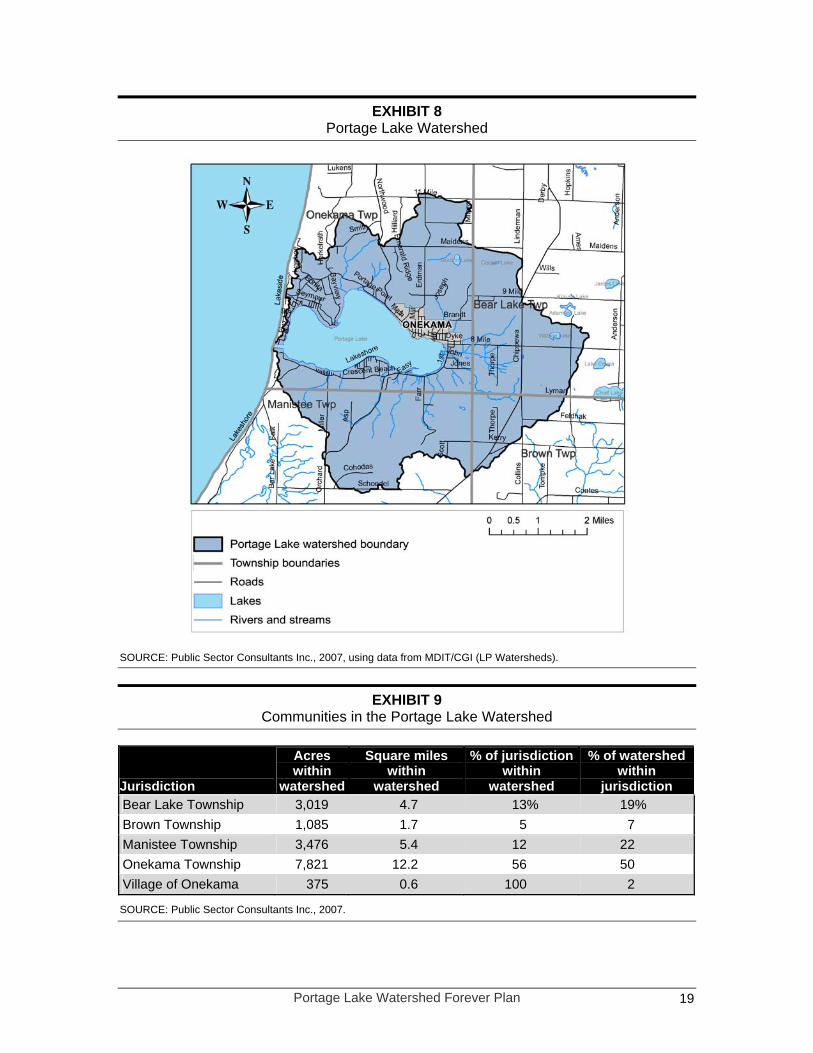
Location, Size, and Boundaries The Portage Lake watershed is located in the northwest portion of Michigan’s Lower Peninsula in Manistee County (see Exhibit 7). As shown in Exhibits 8 and 9, the boundaries of the Portage Lake watershed encompass portions of Bear Lake, Brown, Manistee, and Onekama Townships as well as the Village of Onekama. The watershed covers approximately 24.6 square miles, or 15,777 acres (MDIT/CGI LP Watersheds).
EXHIBIT 7 General Location, Portage Lake Watershed
SOURCE: Public Sector Consultants Inc., 2007, using data from MDIT/CGI, Map Michigan.
Portage Lake Watershed Forever Plan 19
EXHIBIT 8 Portage Lake Watershed
SOURCE: Public Sector Consultants Inc., 2007, using data from MDIT/CGI (LP Watersheds).
EXHIBIT 9 Communities in the Portage Lake Watershed
Jurisdiction
Acres within
watershed
Square miles within
watershed
% of jurisdiction within
watershed
% of watershed within
jurisdiction Bear Lake Township 3,019 4.7 13% 19% Brown Township 1,085 1.7 5 7 Manistee Township 3,476 5.4 12 22 Onekama Township 7,821 12.2 56 50 Village of Onekama 375 0.6 100 2
SOURCE: Public Sector Consultants Inc., 2007.

Portage Lake Watershed Forever Plan 20
In the Portage Lake EPA Phase I Diagnostic/Feasibility Study (Phase I Study), published in 1993 (SEG 1993), the major subwatersheds were established to include drainage areas for each of the lake’s named tributaries plus three areas that do not contain a named surface tributary (Red Park, East Village, and Sandy Point). Unfortunately, the 1993 study did not include a significant part of the area that now is recognized as within the watershed’s hydrologic boundary (see Exhibit 10).
EXHIBIT 10 Major Subwatersheds of Portage Lake
SOURCE: SEG, 1993.
Water Resources and Hydrology The largest surface water feature in the watershed is Portage Lake, whose area is 2,116 acres and comprises 13.4 percent of the total surface area of the watershed (MDIT/CGI LP Watersheds). It is a natural lake formed by glaciers with maximum depths in two areas of up to 60 feet (see Exhibit 11). The littoral zone (areas less than 15 feet in depth)

Portage Lake Watershed Forever Plan 21
makes up just over half the lake area, and the mean depth is approximately 19 feet. The total volume of the lake is estimated to be 39,449 acre-feet (48,706,500 cubic meters) with a projected water retention time (or residence time) of 3.5 years.
EXHIBIT 11 Portage Lake Map and Depth Contours
SOURCE: Public Sector Consultants Inc., 2007, using data from MDIT/CGI (Inland Lake Contours).
Surface water courses drain to Portage Lake and eventually to Lake Michigan through a manmade channel (Portage Lake Channel) on the west side of Portage Lake that, in 1871, replaced the natural outlet to Lake Michigan located north of the current channel. Prior to 1871, Portage Lake was connected to Lake Michigan by Portage Creek, described at the time as a “winding, fast-flowing stream” located approximately one mile north of the current Portage Lake Channel. A water-powered sawmill and associated dam structure was located on Portage Creek, which elevated Portage Lake up to an additional six feet above natural levels. This prompted local property owners faced with flooded shoreline property in 1871 to dig through the dunes to construct a permanent channel to Lake Michigan in order to lower the lake level. The channel eventually eroded to the point that the existing water level is more than ten feet below where it was prior to 1871 when the sawmill dam on Portage Creek was operating under peak head conditions.

Portage Lake Watershed Forever Plan 22
Exhibit 12 shows the original location of Portage Creek as depicted on the 1836 General Land Office Plat of Manistee County. The natural elevation of Portage Lake was four to five feet above that of Lake Michigan prior to the opening of the current channel. Now the level of Portage Lake is essentially determined by the level of Lake Michigan. The former Portage Creek outlet to Lake Michigan no longer exists. Since the early 1900s the Portage Lake Channel has been periodically dredged to maintain navigation between Portage Lake and Lake Michigan.
EXHIBIT 12 Portage Lake Portion of 1836 General Land Office Plat of Manistee County (Adapted)
SOURCE: Public Sector Consultants Inc., 2007, using Portage Lake portion of MDNR 1836 General Land Office Plat of Manistee County.
While Portage Lake is by far the largest lake in the watershed, there are three other named lakes: Watson Lake in the far eastern edge of the watershed and Gordon and Cooper Lakes in the northeastern portion of the watershed. The latter two lakes and their drainages were not included in the watershed boundary when the boundary was described as part of the Phase I Study, but these lakes were subsequently added as part of the watershed based upon a closer examination of the topography and hydrology. Gordon and Cooper Lakes lie in a shallow basin between two ridge lines and their surface water, and presumably the groundwater, moves in a generally southeast direction before moving south and west to enter Portage Lake.
Seven named tributaries feed Portage Lake—Dunham, Glen, Hansen, McCormick, McGowan’s, Onekama, and Schimke Creeks—along with several small unnamed creeks and drains. Schimke Creek is the largest tributary, with a base flow of 17 cubic feet per

Portage Lake Watershed Forever Plan 23
second (cfs.), followed by Hansen Creek (4 cfs.). All the remaining tributaries contribute less than 3 cfs. each during base flow conditions.
Residence time is an indication of how long it takes for all the water in a lake to be replaced and a measure of how long the lake needs to flush itself out. The shorter the residence time, the faster changes will occur in water quality when controlled sources of nutrient input are reduced. It is estimated that Portage Lake has a relatively fast residence time for a lake its size: 3.5 years (Phase I Study). However, the unknown influence of Lake Michigan, through the outlet channel, may be a source of variability that would significantly alter this estimate. A detailed water budget for Portage Lake has not been calculated and relative impacts from various influences, including precipitation, evaporation, surface inflow, outlet outflow, and groundwater input, are not known.
Groundwater Resources Groundwater is an important resource in the Portage Lake watershed. It is a major source of cool water to Portage Lake and most of the tributary streams. Numerous artesian wells are found throughout the watershed. There is no public water supply in the Portage Lake watershed and residents and businesses rely on groundwater from wells for drinking water and irrigation. Groundwater quality and quantity are particularly important to safeguard current human uses of surface water and groundwater as well as to protect fish and wildlife habitat in the watershed. It is estimated that influences from groundwater are much more significant to the water quality of Portage Lake than surface water or runoff, due to the low proportion of surface water area and volume (few small lakes, short length and low flow of tributary streams) and primarily well-drained soils in the watershed.
Unlike many watersheds in the northern Lower Peninsula, there is very little state or federal public land within the watershed. Private land practices associated with forestry, agricultural, recreational, commercial, industrial, and residential uses have been and will continue to be the major influence on the state of the watershed and the quality of its groundwater and surface water resources. Groundwater is highly susceptible to contamination from septic tanks, agricultural runoff, highway de-icing, landfills, and pipe leaks.
The Michigan Department of Environmental Quality (MDEQ), under state law and under federal law delegated to the state by the U.S. Environmental Protection Agency (USEPA), protects groundwater resources from pollution in a number of ways: it establishes and enforces groundwater discharge requirements; regulates the storage, transportation, treatment, and disposal of liquid and solid waste as well as other hazardous substances, offers guidance to owners of domestic wells, regulates underground storage tanks, and responds to accidental spills of hazardous materials or other losses of potential pollutants into or on the ground. The MDEQ Wellhead Protection Program, in coordination with local health departments, promotes management practices to protect potable groundwater supplies from contamination as provided under state and federal safe drinking water laws and regulations.
Portage Lake Watershed Forever Plan 24
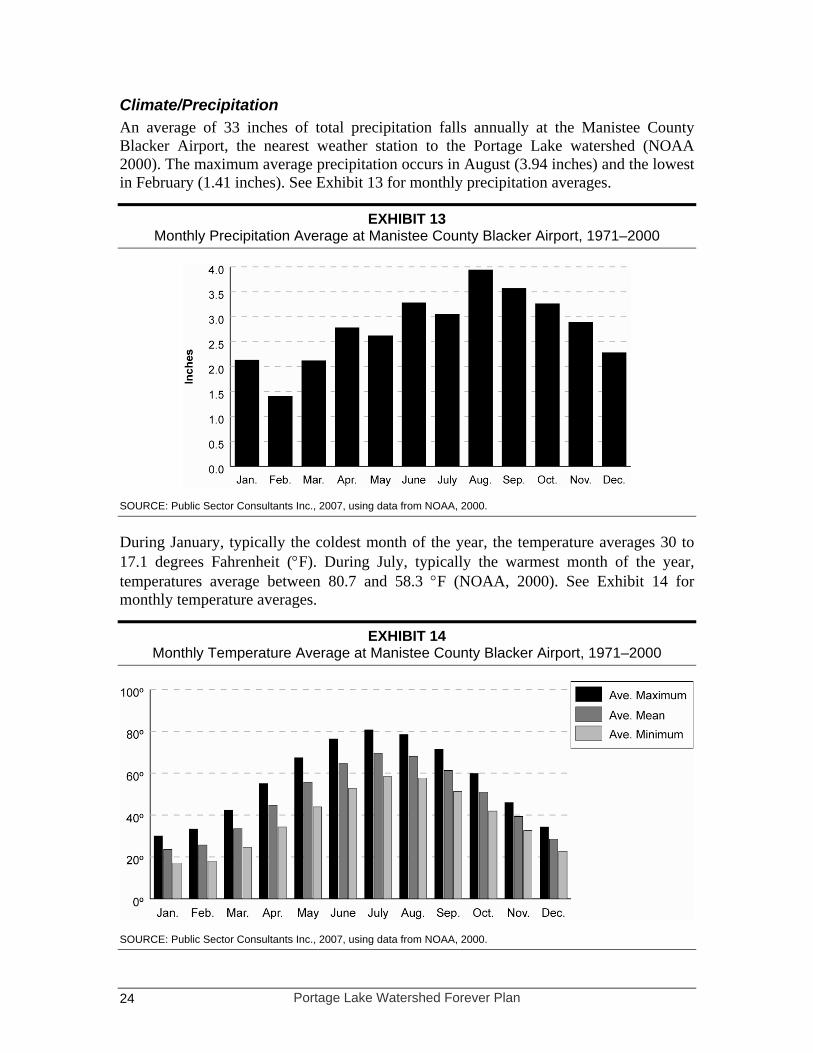
Climate/Precipitation An average of 33 inches of total precipitation falls annually at the Manistee County Blacker Airport, the nearest weather station to the Portage Lake watershed (NOAA 2000). The maximum average precipitation occurs in August (3.94 inches) and the lowest in February (1.41 inches). See Exhibit 13 for monthly precipitation averages.
EXHIBIT 13 Monthly Precipitation Average at Manistee County Blacker Airport, 1971–2000
SOURCE: Public Sector Consultants Inc., 2007, using data from NOAA, 2000.
During January, typically the coldest month of the year, the temperature averages 30 to 17.1 degrees Fahrenheit (°F). During July, typically the warmest month of the year, temperatures average between 80.7 and 58.3 °F (NOAA, 2000). See Exhibit 14 for monthly temperature averages.
EXHIBIT 14 Monthly Temperature Average at Manistee County Blacker Airport, 1971–2000
SOURCE: Public Sector Consultants Inc., 2007, using data from NOAA, 2000.

Portage Lake Watershed Forever Plan 25
Topography/Elevation The Portage Lake watershed is generally bowl shaped with elevations at the outer edges of the watershed reaching as high as 950 feet above sea level (289.6 meters) and sloping toward Portage Lake. The lowest point of land is approximately 580 feet (176.8 meters) above sea level. The eastern side of the watershed is relatively flat with grades less than 3 percent, while the area north of Portage Lake has steep slopes with grades as much as 20 percent. The northeast portion recently determined to be within the watershed boundary is a shallow basin surrounded on three sides by relatively high ridges that taper off to the south and west, eventually allowing groundwater to drain toward Portage Lake. The western portion of the watershed is bounded by coastal dunes that reach heights of over 80 feet (24.4 meters), with grades as great as 40 percent on the Lake Michigan side (see Exhibit 15).
EXHIBIT 15 Portage Lake Watershed Topography Shown in Feet above Sea Level
SOURCE: SEG, 1993.
Geology The bedrock beneath the glacial deposits in Manistee County consists predominantly of sandstones (i.e., Marshal Formation) and shale (i.e., Antrim, Coldwater, and Ellsworth formations). The Portage Lake watershed is underlain almost entirely by Ellsworth shale, with only a small portion underlain by Antrim shale (see Exhibit 16). The Portage Lake watershed is at the rim of the large geologic sedimentary rock feature covering most of the Lower Peninsula of Michigan (described as the Michigan Basin) that contains

Portage Lake Watershed Forever Plan 26
significant hydrocarbon deposits. Manistee County has had considerable oil and gas exploration and development activity, particularly since the 1970s. The county ranks second in the state in the total production of both oil and natural gas that began in Michigan in 1925 (see Exhibit 54).
EXHIBIT 16 Bedrock Geology of Portage Lake Watershed
SOURCE: Public Sector Consultants Inc., 2007, using data from MDIT/CGI (Bedrock Geology).
Glacial deposits (drift thickness) vary from 200 to 1,000 feet above the bedrock formations in Manistee County (see Exhibit 17).

Portage Lake Watershed Forever Plan 27
EXHIBIT 17 Thickness of Glacial Deposits (Drift) in Manistee County
SOURCE: U.S. Geological Survey, ND.
A mixture of lacustrine sand and gravels; glacial outwash sand and gravel, and post-glacial alluvium; as well as various coarse-, medium-, and fine-textured tills associated with moraines and other glacial features characterize the near-surface geologic conditions within the Portage Lake watershed (see Exhibit 18).

Portage Lake Watershed Forever Plan 28
EXHIBIT 18 Portage Lake Watershed Area Quaternary Geology (Recent Glacial Deposits)
SOURCE: Public Sector Consultants Inc., 2007, using data from MDIT/CGI (Quaternary Geology).
Soils The surface soils of the watershed reflect the glacial origins of this area of the Lake Michigan shoreline. In general the soils are well drained sand or sandy loam, with interspersed, smaller areas of less-well-drained mineral and organic soils (see Exhibit 19). In general, surface runoff is minimized by the permeability of the soils in the watershed and both Portage Lake and its tributaries have significant contributions of groundwater inputs.

Portage Lake Watershed Forever Plan 29
EXHIBIT 19 Portage Lake Watershed General Soils
SOURCE: USDA, Natural Resource Conservation Service, Grayling Area Office, 2007.

Portage Lake Watershed Forever Plan 30
Threatened, Endangered, and Species of Concern Michigan’s endangered and threatened species are protected under the Natural Resources and Environmental Protection Act, Public Act 451 of 1994. The Michigan Department of Natural Resources designates and maintains information on the status and location of threatened and endangered species. This work is coordinated by the Michigan Natural Features Inventory (MNFI), a part of Michigan State University Extension. Federally listed species are protected under the Endangered Species Act of 1973. The U.S. Fish and Wildlife Service (USFWS) is the federal agency responsible for federally listed species in Michigan.
Endangered species are those species near extinction throughout all or a significant portion of their range. Threatened species are those species likely to become classified as endangered within the foreseeable future throughout all or a significant portion of their range. Species of concern are species that are extremely uncommon or have a unique or highly specific habitat requirement, whose status deserves careful monitoring. A species on the edge or periphery of its range that is not listed as threatened may be included in this category along with any species that was once threatened or endangered but now has an increasing or protected, stable population.
Based on information from the MNFI, there are no state or federally listed endangered species in the Portage Lake watershed. There are three state-listed threatened species (T) within the watershed—the red-shouldered hawk, the pitcher’s thistle, and the Lake Huron locust—and one state-listed species of concern (SC), the brown walker snail. There is one federally listed threatened species in the watershed: the pitcher’s thistle. Exhibit 20 includes the species of plants and animals found in the watershed that are state and federally listed as threatened or of special concern.
EXHIBIT 20 Portage Lake Area Threatened Species and Species of Concern
Scientific name Common name Federal status State status Buteo lineatus Red-shouldered hawk — T Cirsium pitcheri Pitcher’s thistle T T Trimerotropis huroniana Lake Huron locust — T Pomatiopsis cincinnatiensis Brown walker — SC
SOURCE: MNFI-MSUE, Watershed Element Data for Watershed ID 4060104 20L 2.
While the specific locations of these species are not publicly disclosed in order to protect the species, the MDNR uses the information to evaluate state or federal permits required for land or water uses. The threatened species and species of concern in the Portage Lake watershed and their habitat requirements are described briefly in the following sections.

Portage Lake Watershed Forever Plan 31
Red-shouldered Hawk Adult red-shouldered hawks can be distinguished by the reddish coloration of their underparts and wing linings and their 5–6 narrow, white, tail bands. In flight, they show crescent-shaped translucent patches lining the bases of the long, outermost wing feathers (the “primaries”). The bird’s red shoulders are often not readily visible. Their call during the breeding season is distinctive: a loud, rapidly repeated “kee-yer,” though it is closely imitated by blue jays.
The primary threat to this species in Michigan is habitat alteration and destruction due to timber harvest, road construction, and residential development. Habitat manipulation impacts the species directly by alteration of suitable structure around the nest site and indirectly by influencing the abundance, distribution, and vulnerability of prey species. Fragmentation of forest stands and the creation of larger openings favor the immigration of nest competitors and predators such as the red-tailed hawk (Buteo jamaicensis) and great horned owl (Bubo virginianus). Currently, management has focused on maintaining the critical components of individual home ranges such as the nest area, post-fledgling area, and foraging area (Rabe 1999).
Pitcher’s Thistle Pitcher’s thistle is a perennial thistle of open Great Lakes dunes. This plant typically grows on open sand dunes and occasionally on lag gravel associated with shoreline dunes. Critical habitat for this species is along the Great Lakes shores, or in very close proximity.
Though Pitcher’s thistle can be locally extirpated by destruction or major disturbance of its habitat (e.g., by shoreline development or intensive recreation), it is somewhat tolerant of disturbance from pedestrians and limited off-road vehicle (ORV) traffic. However, vehicular traffic and regular foot traffic tend to unduly destabilize dune sands by mechanically destroying vegetation; this increases erosion and stresses Pitcher’s thistle plants. An indirect effect of artificial disturbance is that it enables non-native species such as the invasive spotted knapweed (Centaurea maculosa) to invade dune habitats and displace native vegetation, resulting in further habitat degradation.
Because of the extreme development pressure along the Great Lakes shoreline, the potential cumulative impact to Pitcher’s thistle populations is high. Two of the world’s largest populations of Cirsium pitcheri lie within Sleeping Bear Dunes National Lakeshore and Ludington State Park/Manistee National Forest (Nordhouse Dunes) (Higman 1999).
Red-Shouldered Hawk Photo by Michael R. Penskar MSU Extension http://web4.msue.msu.edu/mnfi/explorer/ species.cfm?id=10942
Pitcher’s Thistle Photo by Susan R. Crispin MSU Extension http://web4.msue.msu.edu/ mnfi/explorer/species.cfm?id=13485

Portage Lake Watershed Forever Plan 32
Lake Huron Locust The Lake Huron locust is a small, ash-gray grasshopper with darker brown and white markings and wings with a prominent dark band.
In Michigan, the Lake Huron locust is restricted to sparsely vegetated, high-quality coastal sand dunes. In these areas, it typically occurs in high numbers and is usually the dominant species. Unfortunately, significant parts of the locust’s high-quality dune habitat have been degraded or destroyed by shoreline home and recreational development throughout the Great Lakes region.
Although this species is dependant on the dune environment for survival, the Lake Huron locust apparently can persist with low to medium levels of human-related disturbance. Healthy locust populations have been maintained on private lands in several places on Lake Michigan and Lake Huron, as long as the basic dune system is kept intact (Cooper 1999).
Brown Walker The brown walker is a small freshwater snail with a broadly conic shell that is 4.5 mm in height and 3.5 mm wide with rounded whorls gradually increasing in size and a small rounded aperture (main opening) one-fourth the height of the shell. The brown walker inhabits the banks of medium to large rivers. It is thought to prefer clay river banks and may hibernate on moist banks above water, under leaf litter and dormant grassy vegetation. The brown walker likely depends on maintaining natural vegetative canopy cover along stream banks. The species also is likely susceptible to water pollution in the form of pesticides as well as urban runoff and municipal discharge (MNFI 2007a).
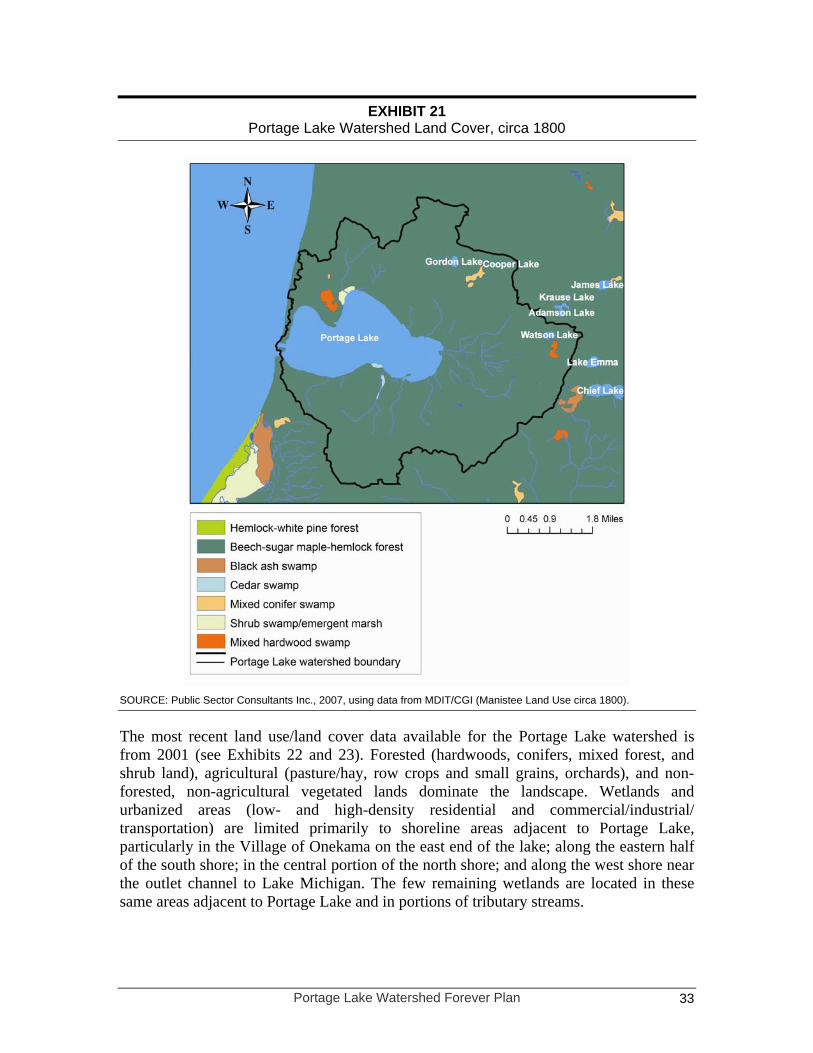
LAND USE AND LAND COVER Original land surveys in the 1800s show that the entire Portage Lake watershed was dominated by a beech-sugar maple-hemlock forest with conifers limited to a significant cedar swamp located on the south shore of Portage Lake and a few mixed conifer swamps in other isolated locations (see Exhibit 21).
Lake Huron Locust Photo by David Cuthrell MSU Extension http://web4.msue.msu.edu/ mnfi/explorer/species.cfm?id=12268
Portage Lake Watershed Forever Plan 33
EXHIBIT 21 Portage Lake Watershed Land Cover, circa 1800
SOURCE: Public Sector Consultants Inc., 2007, using data from MDIT/CGI (Manistee Land Use circa 1800).
The most recent land use/land cover data available for the Portage Lake watershed is from 2001 (see Exhibits 22 and 23). Forested (hardwoods, conifers, mixed forest, and shrub land), agricultural (pasture/hay, row crops and small grains, orchards), and non-forested, non-agricultural vegetated lands dominate the landscape. Wetlands and urbanized areas (low- and high-density residential and commercial/industrial/ transportation) are limited primarily to shoreline areas adjacent to Portage Lake, particularly in the Village of Onekama on the east end of the lake; along the eastern half of the south shore; in the central portion of the north shore; and along the west shore near the outlet channel to Lake Michigan. The few remaining wetlands are located in these same areas adjacent to Portage Lake and in portions of tributary streams.

Portage Lake Watershed Forever Plan 34
EXHIBIT 22 Portage Lake Watershed Land Use/Land Cover, 2001
Land use class Acres % of watershed Commercial/Industrial 59 0.4% High-density residential 672 4.3 Low-density residential 1,043 6.7 Forestland 5,494 35.1 Wetland 722 4.6 Grassland 1,946 12.4 Agriculture 3,593 22.9 Surface water 2,139 13.7
SOURCE: MSU CEVL and LPI, 2007, using data from MRLCC, 2001.
EXHIBIT 23 Portage Lake Watershed Land Use/Land Cover Map, 2001
SOURCE: MSU CEVL and LPI, 2007, using MRLCC data, 2001.
Current Wetlands of Potential Significance and Wetland Losses The MDEQ has recently completed maps of all Michigan counties that identify potential and approximate locations of wetlands, using overlays of data from the following sources:

Portage Lake Watershed Forever Plan 35
The National Wetland Inventory (NWI), conducted by the U.S. Fish and Wildlife Service through interpretation of topographic data and aerial photographs
Land cover, as mapped by the Michigan Department of Natural Resources Michigan Resource Inventory System (MIRIS), through interpretation of aerial photographs
Soils, as mapped by the U.S. Department of Agriculture (USDA), Natural Resource Conservation Service
The Portage Lake watershed wetland map identifies areas of potential significance on the northwest side and adjacent to the south shore of Portage Lake, where there are significant areas of palustrine (freshwater) wetlands (see Exhibit 24). The map also identifies wetland areas along the length of Schimke Creek and in the headwaters of several other tributaries to Portage Lake.
EXHIBIT 24 Potential and Approximate Location of Wetlands in Portage Lake Watershed
SOURCE: Public Sector Consultants, 2007, with data from MDIT/CGI (Manistee Final Wetland Inventory).
Based upon wetland maps developed by the Michigan Natural Features Inventory of land cover conditions in the 1800s, Exhibit 25 illustrates the areas of wetland loss in the

Portage Lake Watershed Forever Plan 36
watershed. Most of the losses have been associated with the shore areas of Portage Lake, where residential and commercial development and related transportation corridors have been most intense over the last 150 years. Nearly 15 percent of the shoreline of the lake has been modified by bulkheads or breakwalls, with less than 25 percent remaining in natural wetland habitat.
EXHIBIT 25 Portage Lake Area Wetland Loss since 1800s
SOURCE: Michigan Natural Features Inventory, MSU Extension, 1995.
Land Use Projections Researchers at Michigan State University have developed a spatialized trend model to project what Michigan’s landscape might look like in the future if present trends continue. The analysis was conducted on the Michigan base (1980), provided by the MIRIS, the projected land use in 2020, and the projected land use for 2040. The digital maps for these three time periods are shown in Exhibit 26.

Portage Lake Watershed Forever Plan 37
EXHIBIT 26 Portage Lake Basin Land Use in 1980 and Projections for 2020 and 2040
SOURCE: MSU CEVL and LPI, 2007.
By 2040, the built areas of the Portage Lake watershed are projected by the model to increase by 409 percent. The other vegetation, agriculture, forest, and wetland areas are expected to decline in acreage. Exhibit 27 summarizes the results from the analysis. This trend indicates that growth comes at the price of forestland, wetland, and agricultural land loss. Given past trends and future projections, the need for structured land use planning and protection becomes evident.
EXHIBIT 27 Land Use Changes, 1980–2040, Acres
Class 1980 2040 Change % Increase/
decrease Agriculture 4,043 2,701 –1,342 –33% Built 1,137 5,790 4,653 409 Forestland 5,508 3,408 –2,100 –38 Wetland 425 175 –250 –59 Other vegetation 2,493 1,532 –961 –39
SOURCE: MSU CEVL and LPI, 2007.
The State of Michigan owns approximately 1,700 acres of subsurface minerals within the Portage Lake watershed, mineral ownership retained by the state mostly from tax-reverted lands whose surface ownership was subsequently sold. The state holds title to fewer than 400 acres of surface land within the watershed. With the exception of small acreage owned by local government, more than 95 percent of the subsurface minerals and over 98 percent of the surface lands within the watershed are privately owned (see Exhibit 28). There is no or very limited federally owned property within the watershed.

Portage Lake Watershed Forever Plan 38
EXHIBIT 28 Portage Lake Watershed Area State Ownership of Surface and Minerals,
Minerals Only, and Mixed (State and Private) Ownership
SOURCE: Public Sector Consultants Inc., 2007, using data from MDIT/CGI (Manistee DNR Land and Mineral Ownership).
Recreation Portage Lake is very popular for fishing, sailing, cruising, water skiing, and swimming. Its Great Lakes access and protected harbor provide the opportunity for larger recreational boat owners to sail, cruise, or fish in the Great Lakes. Several Great Lakes salmon and trout charter-fishing businesses operate from a base on Portage Lake. There are two public boat launch sites on the lake: one is operated by the state and one by the Village of Onekama. During peak fishing periods in the fall, the launch facilities are used to capacity. A large number of permanent and seasonal residences on and near the lake dock or moor their fishing and recreation boats on the lake during the open water season. In the winter months the lake supports an intensive ice fishery for a variety of species.

Portage Lake Watershed Forever Plan 39
DEMOGRAPHICS Because the Portage Lake watershed boundary does not directly correspond to established census boundaries, it is difficult to analyze demographic characteristics of the population situated within the watershed boundary. Geographic Information System (GIS) software and data from the 2000 U.S. Census (U.S. Census Bureau 2000) were used to develop approximate boundaries to allow for estimated demographic information. This was done by inputting the watershed boundary into ArcMap GIS software and then comparing it to the Census 2000 block boundaries. Census blocks within the watershed boundary or immediately bordering the watershed boundary were isolated and demographic information was gathered based on this boundary.
Exhibit 29 reveals the demographic information for the watershed using this approach. The approximate population of the Portage Lake watershed is 2,059, with the most densely populated areas around Portage Lake (see Exhibit 30). Of this population, 449 people (22 percent) are over 65 years of age. There are approximately 1,351 housing units: 809 occupied housing units and 542 vacant units (among the vacant units, 474 were classified for occasional, seasonal, or recreational use). There are 809 households in the watershed.
EXHIBIT 29 2000 Demographic Information for the Portage Lake Watershed
Characteristic 2000 Census Population 2,059 Population over 65 years of age 449 Total housing units 1,351 Occupied housing units 809 Vacant housing units (not seasonal) 68 Seasonal housing units 474 Number of households 809
SOURCE: U.S. Census Bureau, 2000.

Portage Lake Watershed Forever Plan 40
EXHIBIT 30 Population Density (People per Census Block Group) for Portage Lake Watershed
and Surrounding Areas
SOURCE: Public Sector Consultants Inc., 2007, using data from U.S. Census Bureau, 2000 (TIGER/Line data (Manistee County, Michigan).
To get a sense for demographic trends in the watershed, the indicators mentioned above were compared from 1990 to 2000. Unfortunately, census block data was not available for certain demographic characteristics in the 2000 census, and was not available for any demographic characteristics in the 1990 census. Therefore, the census-friendly geographic boundary of Onekama Township (including the Village of Onekama) was used to determine trend information. This area comprises much of the most densely populated areas of the watershed (see Exhibit 30).
Between 1990 and 2000, the population in Manistee County increased by 3,262 to a total of 24,527 based upon U.S. Census information. This represents a growth rate of 15.3 percent during this ten-year period, more than double the state’s growth rate of 6.9 percent during the same period.

Portage Lake Watershed Forever Plan 41
Exhibit 31 illustrates the significant changes that occurred in Onekama Township during the same period. Total population increased by nearly 20 percent, and the number of residents 65 years of age and older increased by 25.3 percent. This population growth rate is slightly greater than growth in Manistee County and much greater than the state increase.
The total number of housing units in the township increased slightly, as did the number of seasonal housing units. Although this represents only a 2.9 percent increase in total housing units over the ten-year period, there was a 58.9 percent decrease over the ten years in the number of vacant housing units. The average household size for both owner-occupied and rental housing decreased slightly.
The proportion of seasonal housing units in the township is very high and in 2000 represented approximately 42 percent of all housing units. This is consistent with the outstanding quality of the area’s water and related outdoor summer activities. It is likely that in the period from Memorial Day through Labor Day of each year the number of people living in the township, and in the watershed, increases significantly. During peak summer weekends the overnight population in the watershed is likely to be two to three times that of the permanent winter population.
Economic indicators in the township are remarkable. Median and per capita income nearly doubled from 1990 to 2000 while the number of impoverished families decreased by 19.4 percent.
EXHIBIT 31 Demographic Information for Onekama Township (including the Village of Onekama),
Manistee County, 1990 and 2000
Characteristic 1990 Census 2000 Census % Increase/
decrease Population 1,266 1,514 19.60% Population over 65 years of age 292 366 25.3 Total housing units 1,086 1,117 2.9 Occupied housing units 519 603 16.2 Vacant housing units (not seasonal)
112 46 -58.9
Seasonal housing units 455 468 2.9 Average household size (owner occupied)
2.4 2.3 -4.2
Average household size (renters) 2.3 2.1 -8.7 Median family income $26,406 $51,042 93.3 Per capita income $10,601 $20,919 97.3 Families below poverty level 31 25 -19.4
SOURCE: U.S. Census Bureau, 1990 and 2000.

Portage Lake Watershed Forever Plan 42
WATERSHED CONDITIONS This section describes the current watershed conditions in terms of water quality, flow, and biology.
Available Monitoring/Resource Data What is known about the condition of the Portage Lake watershed is derived from the following studies and reports. Various water quality parameters were measured and are reported on in the following sections.
Michigan Department of Natural Resources Water Quality Data (MDNR, Michigan/USEPA 1974 and 1985 STORET Water Quality Data) As part of the then-routine monitoring program of Great Lakes tributaries by the MDNR, water quality samples were collected at various depths at the two deepest locations (60 feet) in the central and western basins of Portage Lake in July and again in September of both 1974 and 1985. At the time the MDNR included water quality monitoring that is now the responsibility of the MDEQ.
A Shoreline Algal Survey, NW Michigan Regional Planning and Development Commission (Northwest Michigan Regional Planning and Development Commission, 1983) This is a USEPA-supported project to evaluate the need for sanitary sewers completely around Portage Lake originally proposed in a 1976 plan. The survey encompassed all shoreline areas of the lake and focused on the use of Cladophora as an indicator algal species in combination with models to evaluate phosphorus loadings and sources.
Portage Lake EPA Phase I Diagnostic/Feasibility Study 1991 (SEG, 1993) The most recent comprehensive water quality study of Portage Lake and its watershed is the Portage Lake EPA Phase I Diagnostic/Feasibility Study (Phase I Study), prepared by the Snell Environmental Group Inc. It was completed in 1993 with funding support from Onekama Township and a 50 percent matching grant from the USEPA, Region V, through the then MDNR Clean Lakes Program. The study describes the physical properties of the lake and watershed and its historic and present uses, and summarizes previous information collected on the status of the lake and the watershed. SEG collected water samples beginning in January 1991 and continuing through February 1992. Samples were collected monthly at three lake locations at multiple depths for the periods March through April and September through February. The same locations were sampled twice a month from May through August. Six additional lake littoral zone areas were also sampled at the surface each month from May through October.
A variety of parameters were measured for water samples collected from Portage Lake including temperature, pH, conductivity, dissolved oxygen (DO), nitrate and nitrite nitrogen, ammonia, Kjeldahl nitrogen, orthophosphate, total phosphorus, suspended solids, chlorophyll a, and Secchi disk transparency. The analyses of the data collected focused on four primary parameters: total phosphorus; chlorophyll a; Secchi disk

Portage Lake Watershed Forever Plan 43
transparency; and DO. These parameters are typically used to evaluate the trophic status2 of lakes and in combination can be used to detect significant changes that may be occurring due to human activity.
Four streams (Dunham, Glen, Schimke, and Onekama Creeks) were sampled at their lake outlets twice a month during April and May and once a month during the 12-month study period. Eleven smaller streams and drain outlets were sampled at their lake outlets in May, August, and November. Parameters measured on tributaries included flow, temperature, pH, conductivity, DO, nitrite, orthophosphate, total phosphorus, and suspended solids. The analysis of stream data collected focused on three primary parameters: flow, total phosphorus, and suspended solids.
Michigan Department of Natural Resources Fish Contaminant Monitoring 1991 (as cited in SEG, 1993) The MDNR reported on various heavy metals and organic compounds measured in fish taken from Portage Lake in 1991 and the results were reported in the 1993 Phase1 Study.
Onekama Township Bacteriological Sampling 1985–1990 (as cited in SEG, 1993) From 1985 through 1990, representatives of Onekama Township collected lake water samples for fecal coliform analyses to determine compliance with then State Health Department standards for safe total body contact.
Onekama High School Water Quality Monitoring 1993–2007 (Onekama High School, 2007) Onekama High School students have tracked water quality in Portage Lake from 1993 through the present including monitoring temperature, pH, DO near the surface, Secchi disk transparency, chlorophyll a, and total phosphorus at three lake locations (same locations sampled during Phase I Study) in both the spring and the fall of each year.
Department of Natural Resources Water Quality Monitoring 1999 and 2007 (MDNR, 1999 and 2007) The Fisheries Division of the MDNR collected water quality samples and determined the dissolved oxygen concentration at various depths in one-day sampling events during 1999 and 2007.
Status of the Fishery Resource Report 2000 (MDNR, 2000) The last intensive survey of the fisheries of Portage Lake was completed in June of 1999 and reported in the MDNR Status of the Fishery Resource Report 2000-9. The Fishery Resource Report outlined the history of the lake, land use in the watershed, development along the shoreline, basic water chemistry, and the status of the fish population.
2 Classification of the condition of a water body is based on the degree to which sun energy is converted to aquatic plant and algal growth (i.e., productivity). Generally, lakes are classified as oligotrophic (unproductive) or eutrophic (very productive), and those in-between are called mesotrophic.

Portage Lake Watershed Forever Plan 44
Little River Band of Ottawa Indians (LRBOI) Walleye Recruitment Assessments of Portage Lake (LRBOI, 2005 and 2006) The Little River Band of Ottawa Indians, as part of a larger study of fish populations in their tribal area of interest, conducted field investigations during 2005 and 2006 to determine the status of walleye recruitment and growth in Portage Lake.
A Biological Survey of McGowan’s and Schimke Creeks, Manistee County (MDEQ, 2007d) During August of 2003, the MDEQ Water Bureau, Surface Water Quality Assessment Section conducted field investigations on McGowan’s and Schimke Creeks. The focus of the studies was to determine the biological integrity and physical habitat in these two largest tributaries to Portage Lake.
Onekama Township Bacteriological Sampling 2007 (Onekama Township, 2007) Five popular swimming beaches were sampled during July and August 2007 for E. coli bacteria to determine compliance with state water quality standards for total body contact.
Surface Water Quality
Water Quality Data for Many Parameters As part of the same MDNR monitoring program mentioned above, samples were collected at various depths at the two deepest locations (60 feet) in the central and western basins of Portage Lake in July and again in September of both 1974 and 1985. Exhibit 32 compares the sample results for the major parameters measured. No significant differences occurred in the range of water quality parameters measured in Portage Lake over the 11-year period between 1974 and 1985. In general, the results were consistent with what was expected in a hard water lake in this area of the state. No major water quality issues were apparent with the exception of the low dissolved oxygen levels at depths greater than 20 feet during summer stratification.

Portage Lake Watershed Forever Plan 45
EXHIBIT 32 Water Quality Sampling Results at Various Depths from Central and Western Basins of
Portage Lake, 1974 and 1985
Parameter
Western basin September 1974
0–60 feet
Central basin Sep-74
0–60 feet
Western basin Jul-85
0–60 feet
Central basin Jul-85
0–60 feet Dissolved oxygen (mg/L)
9.4–8.2 8.2–2.3 9.0–< 0.1 9.2–0.4
pH 8.7 8.7–7.7 8.2–7.9 8.0–8.0 Total alkalinity mg/L 110 110–138 105–125 101–121
10.1 ft. 12.5 ft. 13.0 ft. 12.5 ft. Secchi disk in feet and meters from surface (3.08 m) (3.81 m) (3.96 m) (3.81 m) Chlorophyll a micrograms/L
4.6 4.6 2.2 2.6
Total phosphorus mg/L 0.03–0.01 0.02–0.04 0.01–0.02 <0.01–0.01 Total phosphorus micrograms/L
30–10 20–10 10–20 <10–10
Total N02&NO3 mg/L 0.02–0.09 0.02–<0.02 0.02–0.09 0.02–0.65 Total NH3&NH4 mg/L 0.02–0.01 0.02–0.31 0.01–0.69 0.14–0.27
SOURCE: MDNR, Michigan/USEPA STORET Water Quality Data, Manistee County, Site Numbers 510123 and 510090, 1974 and 1985.
Total Phosphorus, Chlorophyll a, and Secchi Transparency Phosphorus is often the primary factor limiting the productivity of lakes in Michigan. Total phosphorus measurements can be used to evaluate the potential impacts of increased phosphorus loadings from septic tanks, and runoff from various land uses and from atmospheric deposition. Sampling conducted for the Phase I Study during the first four months of 1991 indicated a total nitrogen-to-phosphorus ratio in the range of 22:1, confirming that phosphorus is most likely the limiting nutrient in Portage Lake.
Chlorophyll a measurements provide an index of algal growth, and high levels, particularly in shallow areas, can indicate significant nutrient loadings from riparian properties. Secchi disk transparency readings indicate the depth of light penetration from the surface and in many instances can be used to indirectly measure algae growth, which decreases the depth of light penetration (i.e., lower Secchi readings may indicate higher productivity). In addition to algal growth, Secchi disk transparency can be decreased by wind turbulence that resuspends sediments, by suspended solids from lake tributaries and, in some cases, by high levels of dissolved solids in the form of calcium carbonate.
All three parameters vary depending upon time of year, location in the lake, weather conditions, and the depth of the water sample. Comparisons of these three parameters from one year to the next or over a longer period can be difficult unless samples are collected under similar conditions, at the same time of year, and at the same depth. To assess the water quality for these parameters, the MDNR and Phase I Study results were used. Exhibits 33, 34, and 35 provide a comparison of these selected parameters in 1974, 1985, and 1991 at the western and central basins where water depths reach 60 feet. The

Portage Lake Watershed Forever Plan 46
MDNR sampling occurred only at these two stations for one day in September of 1974 and July of 1985, while the Phase I Study sampled both locations throughout 1991.
EXHIBIT 33 Secchi Transparency Measured in Portage Lake at the Western and Central Basin Sampling Locations in September 1974, July 1985, and July and September 1991
SOURCE: Public Sector Consultants Inc., 2007, using data from MDNR, Michigan/USEPA 1974 and 1985 STORET Data Files 1975 and 1985 and SEG, 1993.
EXHIBIT 34 Chlorophyll a in Portage Lake at the Western and Central Basin Sampling Locations in
September 1974, July 1985, and July and September 1991
SOURCE: Public Sector Consultants Inc., 2007, using data from MDNR, Michigan/USEPA STORET Data Files, 1974 and 1985, and SEG, 1993.

Portage Lake Watershed Forever Plan 47
EXHIBIT 35 Range of Total Phosphorus at Various Depths in Portage Lake at the Western and
Central Basin Sampling Locations in September 1974, July 1985, and July and September 1991
SOURCE: Public Sector Consultants Inc., 2007, using data from MDNR, Michigan/USEPA STORET Data Files, 1974 and 1985, and SEG, 1993.
Exhibit 35 shows the range of total phosphorus recorded in samples taken at various depths at the same two locations during the same three years. Total phosphorus results ranged between approximately 10 and 20 micrograms per liter (ug/L) at both locations during both months with the exception of the reading in September 1974 in the western basin that was approximately 30 ug/L and the level in the central basin in July 1985 that was close to 5 ug/L.
The Phase I Study reported annual mean water quality values for Secchi disk transparency of 2.44 meters, 4.6 ug/L for chlorophyll a, and 14.0 ug/L for total phosphorus. Based on mean water quality values, Portage Lake’s trophic level fell within the ranges for a mesotrophic lake3 classification (i.e., 2.29 to 4.57 meters Secchi disk transparency, 2.2 to 6 ug/L chlorophyll a, and 10–20 ug/L total phosphorus). With minor exceptions, the levels recorded in September 1974, July 1985, and July and September 1991, shown in Exhibits 33, 34, and 35, fall within the ranges normally associated with mesotrophic lakes.
Trophic Status Index Exhibit 36 illustrates how the annual mean values from 1991, and the range of values from the central basin of Portage Lake in September 1974, July 1985, and July/September 1991 for these three parameters, compare to the Trophic Status Index (TSI) (Carlson 1977) as adapted by the Minnesota Pollution Control Agency (MPCA, 1991) and used by the MDEQ to guide interpretation of data collected under its Cooperative Lakes Monitoring Program (MDEQ 2003).The TSI is a good measurement for phosphorus-limited water bodies such as Portage Lake; this index was developed for lakes in the Great Lakes region and uses a combination of transparency (Secchi disk readings), chlorophyll a measurements, and phosphorus concentrations to classify lakes

Portage Lake Watershed Forever Plan 48
with respect to their trophic or productivity levels3. The Phase I study established mean values for these three parameters using measurements over the entire open water season. The results indicated that Portage Lake was within the range of a mesotrophic lake3—between a eutrophic lake3 and an oligotrophic lake.3 Limited data from studies before 1991 and data collected in 2001, 2004, 2005, 2006, and 2007 indicate that the trophic status of Portage Lake, based upon these three parameters, has not changed significantly since 1974.
EXHIBIT 36 TSI of Portage Lake in Central Basin
SOURCE: Public Sector Consultants Inc., 2007, using data from MDNR, Michigan/USEPA STORET Data Files, 1974 and 1985, and SEG, 1993
Exhibit 37 summarizes the Onekama High School Portage Lake monitoring program for 1993–2007 as it relates to the three parameters.
EXHIBIT 37 Portage Lake Water Quality Monitoring Data, 1993–2007
Year
Range of Secchi disk transparency
(meters)
Range of Chlorophyll a
(ug/L) Range of total
phosphorus (ug/L)1993 4.27–2.74 6.1–3.4 9.5–6.1 1994 7.62–1.83 9.8–2.5 12.9–6.3 1995 9.45–3.05 2.8–0.9 10.2–5.7
3 The biological productivity of a lake is based on the availability of plant nutrients and is referred to as the lake’s “trophic” condition. Extremely high or low productivity usually limits aquatic life. High productivity leads to a lot of algae and other aquatic plants. Low productivity leads to very little aquatic life. The trophic condition of lakes ranges from the least productive (oligotrophic) to moderately productive (mesotrophic) to highly productive (eutrophic). Hypereutrophic lakes are the most productive of all.

Portage Lake Watershed Forever Plan 49
Year
Range of Secchi disk transparency
(meters)
Range of Chlorophyll a
(ug/L) Range of total
phosphorus (ug/L)1996 7.62–3.35 13.3–1.2 8.8–4.6 1997 8.53–3.66 3.3–1.0 6.7–5.1 1998 5.79–3.66 4.4–1.6 7.2–5.4 1999 6.71–3.66 21.4–1.2 11.4–5.3 2000 6.71–3.66 4.9–1.1 10.1–5.7 2001 6.40–3.05 8.1–0.9 13.0–5.8 2002 7.93–3.05 3.1–2.3 6.8–5.6 2003 10.67–3.05 2.3–1.7 8.3–3.5 2004 8.53–3.05 4.2–1.0 10.6–8.0 2005 8.53–3.66 4.2–0.8 10.2–4.9 2006 8.23–3.66 4.3–1.7 9.3–3.7 2007 (Spring data only) 8.23–3.96 1.7–1.1 4.1–3.9
SOURCE: Onekama High School, 2007
The range of values for transparency, chlorophyll a, and total phosphorus overlap the range of data for the same parameters measured in earlier studies. The measurements recorded in the Onekama High School 1993–2007 monitoring tend to indicate that the lake is somewhat less productive than estimated in the previous studies (i.e., greater transparency, less chlorophyll a, and less total phosphorus). The mean values from the earlier Phase I Study, shown in Exhibit 36, were based upon measurements collected monthly from several locations in the lake and may not be directly comparable to the 2004–2006 monitoring data collected and reported by Onekama High School from one sample period in the spring and one in the fall. Nonetheless, annual monitoring of the type performed by Onekama High School students can provide a baseline upon which long-term trends in Portage Lake productivity can be measured.
Dissolved Oxygen Another measure of lake productivity is the variation in dissolved oxygen (DO). The level of DO in natural water bodies is determined by a number of factors. In lakes, DO concentrations can vary depending upon time of year, depth, level of plant productivity, time of day, water temperature, weather conditions, oxygen demand from organisms, decomposition of organic matter, and/or oxidation of chemicals in the water or sediments. Temperature determines the amount of DO that water will contain at 100 percent saturation—the lower the water temperature the higher the dissolved oxygen at saturation levels. During daylight periods in the growing season, rooted aquatic plants and algae produce oxygen through photosynthesis and at the same time use oxygen for respiration; DO levels in the photosynthetic zone vary from daylight to nighttime (this is called diurnal variation).
Michigan lakes typically stratify by temperature beginning in the spring when warmer, less dense water on the surface isolates cooler and denser water in the deeper portions of the lake from oxygen-producing rooted plants and algae. In the fall, colder air temperatures cool the surface water and lakes typically “turn over” (invert from top to

Portage Lake Watershed Forever Plan 50
bottom); eventually temperatures at the bottom of a lake are warmer than near the surface. Thus, DO can vary both seasonally and by depth.
DO is essential to the survival and growth of aquatic organisms, and water quality standards for minimum DO levels have been established to protect certain groupings of fish species. For coldwater species4 such as trout and salmon, the minimum DO level is 7.0 milligrams per liter (mg/L) in any 24-hour period. For warmwater5 species such as largemouth bass and sunfish, the minimum DO level is 5.0 mg/L in any 24-hour period.
Beginning with DO samples taken in 1976 and again in 1985, and through extensive monitoring of DO in 1991 and confirmed again in fisheries surveys in 2001 and 2007, DO levels in Portage Lake at depths of 25 feet and below began to decrease in June of each year. In all four sampling years DO concentrations were 2.0 mg/L or less at 40 feet in the two deepest basins of Portage Lake, reaching near zero at 60 foot depths in the two basins during the June through August period.
The implications of and reasons for this reduced DO concentration at depths below the thermocline (the depth of rapid change in temperature) during the spring through fall period are not clearly understood. Data are not readily available for hard water lakes similar in size and configuration to Portage Lake. However, in nearby Platte Lake, where a discharge from a state-operated trout and salmon hatchery has been the subject of legal battles for the last 25 years, the decrease in dissolved oxygen below the thermocline has been attributed to the addition of phosphorus from the state hatchery. The total number of days and the severity of DO depletion measured in Platte Lake have decreased since phosphorus discharge controls were placed on the hatchery.
There is not sufficient data from Portage Lake to determine whether the severity of DO depletions observed is getting worse or extending over a longer period of time. When concerns related to over-enrichment in Platte Lake were first expressed in the late 1970s and early 1980s, the mean annual total phosphorus was between 9 and 12 ug/L and the Secchi transparencies were 2 meters or less. In comparison, Portage Lake mean total phosphorus levels in 1991 were over 12 ug/L and the average Secchi transparencies were just over 2 meters in depth. While the other problems identified in Platte Lake attributed to over-enrichment have not been documented in Portage Lake, the depletion during summer stratification below the thermocline needs to be further evaluated as a potential indicator that over-enrichment is occurring in Portage Lake. The data upon which the above DO analysis is based are presented below in chronological order.
Water Quality Data, MDNR (1974 and 1985) Exhibit 38 compares the results for DO concentrations at various depths during the periods in 1974 and 1985. During the months of July and September, Portage Lake in both locations for both years showed reduced oxygen levels in and below the thermocline, and for the July period DO was nearly absent in the deepest areas of the lake. The lack of adequate DO limits the habitat available to aquatic organisms,
4 Fish that prefer clear waters; are not tolerant of extreme temperature changes; and thrive in temperatures that range from 50–65 F. 5 Fish that have low oxygen requirements and thrive in temperatures 76 F and higher.

Portage Lake Watershed Forever Plan 51
particularly fish, and can be a factor under anoxic conditions (zero oxygen) freeing bound phosphorus from bottom sediments.
EXHIBIT 38 Dissolved Oxygen Levels by Depth in Portage Lake Central Basin (CB) and
Western Basin (WB), 1974 and 1985
SOURCE: Public Sector Consultants Inc., 2007, using data from MDNR, Michigan/USEPA STORET Water Quality Data 1974 and 1985, Manistee County, Site Numbers 510123 and 510090.
Phase I Study (1993) According to the Phase I Study results, Portage Lake begins to stratify in May of each year. In 1991 a temperature of 19 degrees Celsius (°C) was measured in May at the surface down to approximately 10 feet of depth. From 10 feet to 55 feet the temperature decreased to approximately 9 °C. DO concentrations during May in the study samplings range from as high as 11.0 mg/L near the surface to as low as 5.0 mg/L at 55 feet. In June the temperature variance from top to bottom increased, and DO concentrations at 40 feet and below decreased to less than 4.0 mg/L. In July the DO concentrations at 35 feet and below were less than 5.0 mg/L, and at 55 feet and below the DO level was less than 1 mg/L. Portage Lake remained stratified by temperature through August until late September when fall turnover began and DO concentration from top to bottom ranged between 8.0 and 10.0 mg/L and temperatures ranged between 11 °C and 14 °C.
Exhibit 39 illustrates the DO levels in Portage Lake at the central basin sampling locations during the period from May through September 1991. Similar DO concentrations were observed at the western basin sampling location.

Portage Lake Watershed Forever Plan 52
EXHIBIT 39 Dissolved Oxygen Concentration by Depth at Portage Lake Central Basin
Sampling Location, May–September 1991
SOURCE: Public Sector Consultants Inc., 2007, using data from SEG, 1993.
The number of days that the DO levels below the thermocline are less than 5.0 mg/L, and the depth at which the DO levels begin to decrease, may be effective measures for detecting any changes in the productivity of Portage Lake. Unfortunately, there is only 1991 data upon which to evaluate this period of DO depletion in the deeper portions of the lake. It would also be valuable to have comparable data on the daily fluctuation of DO within the photosynthetic zone (the top three meters) to determine whether the DO levels reported in 1991 are representative of daily minimums. Based upon normal sampling times during daylight periods, the surface DO levels reported in 1991 likely represent midday, high DO levels. Minimum DO concentrations could be much lower than those reported in the Phase I Study.
MDNR Status of the Fishery Resource (2000) and Water Quality Data (1997) Water quality sampling of Portage Lake since 1991 has been limited. The MDNR fishery report included limited Portage Lake water quality data from samples collected on a single day in July of 1999. These samples in 1999 and additional samples collected by the MDNR in July 2007 confirmed earlier water quality sampling that DO concentrations during the summer period below the thermocline were less than 5.0 mg/L. At depths greater than 35 feet, the July 1999 samples indicated that DO concentrations were 3.4 mg/L and less, and July 2007 samples indicated DO concentration were 3.3 mg/L and less.
Bacteriologic Analysis In a five-year period from 1985 through 1990, representatives of Onekama Township collected lake water samples for fecal coliform analyses. At that time, the State of Michigan used fecal coliform bacteria as the standard indicator bacteria group of potential sources of human waste. During this five-year period, only five of the 144 samples from two sites in Portage Lake exceeded the state standard for total body contact

Portage Lake Watershed Forever Plan 53
at that time, 100 fecal coliform bacteria per 100 ml. Four of the high levels were located off the shoreline of the Village of Onekama and one was located near Sandy Point, on the south side of the lake.
In the months from May through September of 1991 the Phase I Study again sampled fecal coliform bacteria at 12 locations around the perimeter of Portage Lake. By 1991, the Village of Onekama had sanitary sewers serving its residents adjacent to the lake while the remainder of homes around the lake operated on septic systems. In 1991, the state standard for total body contact (still 100 fecal coliform bacteria counts per 100 ml) was exceeded only once at one sampling site. This site, located near Eagle Point on the south side of Portage Lake adjacent to residential development, had 200 counts per 100 ml. The Phase I Study attributed the high level to potential septic tile field sources associated with the residential development.
The 1991 one one-time tributary surveys indicated elevated levels of fecal coliform in Schimke Creek and an unnamed small tributary; the bacteria were potentially attributed to cattle raised in the upper portions of both tributaries. Onekama Creek and another small unnamed tributary also had elevated levels that were attributed to potential residential septic tile field drainage in the relatively high-density residential areas upstream of the sampling locations.
Five popular swimming beaches were sampled during July and August 2007 for Escherichia coli (E. coli)6. All samples met the current Michigan water quality standards for total body contact of 130 or fewer counts of E. coli per 100 ml of water monthly average and 300 E. coli counts or less at any time (Exhibit 40).
EXHIBIT 40 Portage Lake E. coli Bacteria, 2007
Site Sample number July 26, 2007
E. coli colonies/100 ml August 24, 2007
E. coli colonies/100 ml
Portage Point Inn 1 2 3
2 0 1
12 2 0
Little Eden Camp 1 2 3
17 15 18
18 29 20
Onekama Village Beach 1 2 3
7 5 5
8 7 6
Covenant Lake Bible Camp
1 2 3
29 18 23
1 0 3
Wik-A-Te-Wak 1 2 3
2 3 14
3 3 0
SOURCE: Onekama Township, 2007.
6 In 1995, the indicator of potential sources of human waste was changed from fecal coliform to a more specific organism, Escherichia coli (E. coli).
Portage Lake Watershed Forever Plan 54
Drinking Water Quality The MDEQ reports levels of nitrate, arsenic, and volatile organic compounds in drinking water (MDEQ 1983–2003). Between 1983 and 2003 no drinking water samples from within the Portage Lake watershed were reported with arsenic levels above the maximum contaminant level (MCL) of 0.010 mg/L (10 parts per billion). During the same period two samples out of approximately 100 samples had nitrate levels above the MCL of 10 mg/L (10 parts per million). Maps available from the MDEQ indicate that those samples were from agricultural areas that may experience fertilizer applications. Samples from three sites within the northern and northwestern portions of the watershed were positive for volatile organic compounds between 1983 and 2002.
Tributary Flow, Total Phosphorus, and Suspended Solids The streams monitored on a monthly basis in the Phase I Study included Glen, Dunham, Onekama, and Schimke Creeks, which had respective average flows of 1.2, 1.6, 3.2, and 17.8 cubic feet per second (cfs.) at the outlet. Eleven additional streams, monitored at three separate times during the Phase I Study, had flows ranging from 1 to 3 cfs. All streams were considered relatively high quality with steady base flow throughout the year.
Stream flow, total phosphorus, and suspended solids were measured in Glen, Dunham, Onekama, and Schimke creeks during base flow and following wet weather events to determine annual variations. Glen and Dunham Creeks show similar patterns throughout the year as well as during storm flow conditions. Both have forested or vegetated watersheds that reduce erosion and surface runoff, especially during storm events. Although both showed normal increases in flow, suspended solids, and total phosphorus during spring and fall, the increases were relatively small. Even during storm events these two streams showed little increase in suspended solids or flow, but total phosphorus did increase. The increase in total phosphorus was believed to be primarily the result of direct input of phosphorus from precipitation.
Onekama and Schimke Creeks exhibited different patterns. The Onekama Creek watershed consists of a residential area within the Village of Onekama and has the next highest discharge after Schimke and Hansen Creeks (3.2 cfs.). The relationship between suspended solids and total phosphorus was strongly associated in Onekama Creek. Every time suspended solids increased, so did total phosphorus, but this was not always associated with an increase in flow. This implies that loading of phosphorus was coming from surface runoff from residential lawns and streets and is carried with sediment load. Other than during storm events, Onekama Creek exhibited relatively low concentrations of phosphorus and suspended solids for a stream that flows through a residential area.
Schimke Creek and its subwatershed are unique in the larger Portage Lake watershed because this subwatershed is by far the largest and the least vegetated/forested with the most agricultural activities. The creek itself has the highest flow (average 17.8 cfs.). However, excluding the spring high runoff period and storm events, this creek still maintained relatively low concentrations of phosphorus and suspended solids. During storm events phosphorus, suspended solids, and flow significantly increased.

Portage Lake Watershed Forever Plan 55
A summary of annual average total phosphorus, suspended solids, and flow for Dunham, Glen, Onekama, and Schimke Creeks can be found in Exhibit 41.
EXHIBIT 41 Portage Lake Tributary Water Quality Monitoring Data, 1991–1992
Tributary Average total
phosphorus (ug/L) Average suspended
solids (mg/L) Average flow
(cfs.) Dunham Creek 17.8 6.7 1.6 Glen Creek 20.0 6.7 1.2 Onekama Creek 25.3 10.8 3.2 Schimke Creek 37.5 37.0 17.8
SOURCE: SEG, 1993.
Biological Data
Fish Based upon fisheries surveys conducted periodically over the last 30 years, Portage Lake supports a wide range of naturally reproducing, resident coolwater7 and warmwater fish populations, including largemouth and smallmouth bass, northern pike, yellow perch, black crappie, rock bass, hybrid sunfish, bluegill, and pumpkinseed. With the support of an annual stocking program, Portage Lake also has a popular year-round walleye fishery and a seasonally important brown trout, coho, and Chinook fishery. Many of the tributary streams support naturally reproducing brook trout populations and at least one supports a naturally reproducing brown trout population.
The fish survey data from 1999 indicate that resident fish populations are generally in good condition with growth rates that approximate or exceed statewide averages for the same species. The MDNR fishery management objectives emphasize the need to protect the remaining undisturbed shoreline areas as spawning, nursery, and foraging areas for currently naturally reproducing game and forage fish populations. They also emphasize the need to protect the coldwater fishery habitat of tributary streams, citing past developments that have destroyed spawning habitat for trout and salmon.
Portage Lake Fish Populations and Management The last intensive survey of the fisheries of Portage Lake was completed in June of 1999 and reported in the MDNR Status of the Fishery Resource report (2000). The following summary was prepared using information excerpted from this report.
Very little fisheries management occurred on Portage Lake prior to the 1970s. MDNR records indicate that smallmouth bass, bluegill, and rainbow trout were stocked in the lake in the late 1920s and early 1930s, with little evidence of an enhanced fishery. In the 1950s, 70 brush shelters were placed in the lake in a then-popular effort designed to enhance fishery habitat and concentrate fish to improve angling success.
7 Walleye, northern pike, muskellunge, yellow perch, white suckers, crappie and other fish species that thrive in temperatures that range from 65–70oF.

Portage Lake Watershed Forever Plan 56
Because of its open connection to Lake Michigan through the 400-foot-wide, 12-foot- deep Portage Lake Channel, Great Lakes fish populations of yellow perch, cisco, rainbow smelt, round whitefish (menominee), lake whitefish, lake trout, and other Great Lakes species may, under certain wind and temperature conditions, be present in Portage Lake supplementing resident populations. In addition to the resident coolwater and warmwater game fish species, non-game and forage species are also common in Portage Lake. These include bowfin, common carp, yellow and brown bullhead, several species of suckers, alewife, and banded killifish, as well as a variety of other small forage species such as shiners. The fish survey data from 1999 indicated that resident fish populations were generally in good condition with growth rates that approximated or exceeded statewide averages for the same species. Fall walleye recruitment assessments conducted by the Little River Band of Ottawa Indians in 2005 and 2006 indicated average walleye growth rates similar to state averages (LRBOI 2005 and 2006).
Beginning in 1971, Portage Lake has been intensively managed with the annual stocking of trout and salmon, primarily intended to support a Great Lakes fishery in Lake Michigan in the proximity of the Portage Lake Channel. Stocking rates were as high as 300,000 coho (yearlings) and Chinook (fingerlings) in 1974. However, consistent with the overall management goal of reducing stocked predators in Lake Michigan to match available forage, the number of stocked fish was reduced to a total of 100,000 to 200,000 each year between 1980 and 2000; the stocked species during this period included a combination of coho, Chinook, and brown trout (fingerlings and yearlings), as shown in Exhibit 42. Since 1987 fingerling walleye have been stocked annually to support a resident fishery in Portage Lake.
EXHIBIT 42 Portage Lake Trout and Salmon Stocking 1971–2000
SOURCE: Public Sector Consultants Inc., 2007, using data from MDNR, 2000.
The fishery management target established in 2000 called for an annual stocking of Portage Lake with 50,000 coho, 50,000 Chinook, and 15,000 brown trout to maintain a Lake Michigan fishery near the Portage Lake Channel as well as provide a seasonal salmon and trout fishery in Portage Lake itself. In addition, the target included the

Portage Lake Watershed Forever Plan 57
stocking of approximately 15,000 walleye fingerlings each year. Lake trout were stocked in Portage Lake once in 1989 (157,000), but have not been planted since.
It should be noted that statewide, Great Lakes trout and salmon stocking rates have been significantly reduced since 2000 because of food web disruptions involving benthic (bottom-dwelling) organisms and an associated decrease in available forage fish in Lake Michigan and Lake Huron. The mix of species and number of trout and salmon stocked in Portage Lake have been adjusted accordingly. Since 2000 approximately 100,000 brown trout have been stocked in Portage Lake through 2007, or an average 16,000 per year. The last Chinook salmon stocking in Portage Lake was in 2005 and from 2001 through 2005 approximately 50,000 Chinook were planted in the lake each year. Coho were stocked from 2001 through 2006 at an annual rate of approximately 50,000 per year. In addition to efforts to reduce the number of predator fish planted to recognize the declining forage base in Lake Michigan, Coho plants in Portage Lake were further reduced due to MDNR budget reductions. Walleye stocking has continued since 2000 with plants of over 50,000 spring fingerlings in 2001, 2002, and 2003. The last stocking of walleye in Portage Lake occurred in 2006, when approximately 58,000 were planted.
In 2007, the MDNR temporarily suspended stocking certain warmwater and coolwater fish species produced from eggs taken from wild fish as a precautionary measure to control the spread of viral hemorrhagic septicemia (VHS), a recently discovered viral disease found in several of the Great Lakes and some inland lakes that has caused massive die-offs of various species The MDNR’s decision to resume planting of walleye in Portage Lake will depend upon research now under way to determine the location of species infected with VHS, transmission mechanisms, and potential methods for disinfection at rearing facilities. The implications of VHS for the future of the fisheries of Portage Lake are discussed further in the Invasive Species section of this report.
The overall fisheries management objectives for Portage Lake currently are to maintain a mixed coolwater/warmwater resident fishery supplemented by the stocking of walleye fingerlings. The MDNR has indicated that salmon plants and natural reproduction in other locations are expected to support the Lake Michigan fishery near the Portage Lake Channel and that no future salmon plants are planned for Portage Lake. Limited natural reproduction in tributaries and straying from other planting sites are expected to continue to provide a limited fall salmon fishery in Portage Lake. The MDNR’s future fisheries management plans still include annual stocking of brown trout in Portage Lake. The objectives assume that the intact littoral zone and shoreline habitat as well as remaining contiguous wetlands in Portage Lake will be protected, and that natural reproduction and recruitment of other resident game and forage species will be adequate to sustain fishable populations.
Tributary Fisheries and Habitat The MDNR fishery report also discussed a 1966 fish eletroshocking survey of tributary streams conducted by the Fisheries Division of the Michigan Department of Conservation (now the MDNR) and a 1987 survey by W. Creel of the MDNR Surface Water Quality Division (now housed in the MDEQ). The 1966 study indicated that the Dare, Glen, Hansen, McCormick, McGowan’s, and Schimke tributaries to Portage Lake were

Portage Lake Watershed Forever Plan 58
coldwater trout streams with brook trout and that brown trout were also present in Schimke Creek. Evidence in the 1987 survey of fish populations indicated that some limited coho reproduction was occurring in McGowan’s Creek. Based upon the presence of brook trout, it is expected that limited salmon and steelhead reproduction may occur in most of the larger tributaries to Portage Lake. Another study mentioned in the report, conducted in 1988 by B. Sayles of the MDNR Surface Water Quality Division, indicated that alterations associated with the development of the Links of Portage Golf Course may have eliminated habitat that supported trout and salmon reproduction and recruitment in McGowan’s Creek.
Biological integrity and physical habitat conditions of selected sections of McGowan’s and Schimke Creeks were assessed by staff of the Surface Water Assessment Section of the MDEQ Water Bureau in 2003 (MDEQ 2007d). The macroinvertebrate community was sampled at two sites including Station 1 (McGowan’s Creek and Portage Point Road), which was rated as “excellent,” and Station 4 (Schimke Creek and M-22), rated as “acceptable.” Habitat quality was assessed at four locations. Habitat quality for Station 1 (McGowan’s Creek) scored in the “excellent” range while the three stations on Schimke Creek scored “good.” Water chemistry samples were collected at five stations. Concentrations of ions and metals in McGowan’s and Schimke Creeks typically varied from less than quantifiable levels to low concentrations. Low concentrations of nutrients were also present, with the exception of elevated concentrations of nitrate/nitrite-nitrogen, suggesting land use influences on water chemistry. According to the macroinvertebrate, habitat, and water chemistry results, water quality standards were being met at all stations sampled in both McGowan’s and Schimke Creeks.
Surveys conducted periodically between 1967 and 2007 by the U.S. Fish and Wildlife Service for sea lamprey were consistent with the MDNR fishery resource report (2000) findings of brook and brown trout in Portage Lake tributaries, and neither adult nor larval sea lamprey were ever documented. Various U.S. Fish and Wildlife Service (USFWS) surveys note that good spawning gravel is present in Dare, Dunham, Hansen, McCormick, McGowan’s, and Schimke Creeks and that some spawning gravel is present in Erikson Creek (USFWS 2007).
Smelt and many other non-salmonid8 species from Lake Michigan and Portage Lake use the tributaries as spawning and nursery areas. The MDNR fishery resource report (2000) emphasizes that the protection of the aquatic habitats in Portage Lake tributaries is critical to (1) maintaining stream populations of brook trout, (2) the general health of the Portage Lake fisheries, and (3) the stability of the nearby Lake Michigan ecosystem. The report also expresses concern that efforts to chemically treat aquatic weeds in Portage Lake and to “stabilize shorelines” could further limit littoral zone habitat essential to natural reproduction, growth, and survival of existing fish populations.
Fish and Sediment Contaminant Monitoring Portage Lake fish were tested by the state for a wide range of organic chemical and heavy metal contaminants in 1990 and again in 2004. Only polychlorinated biphenyls (PCBs) and mercury (Hg) were detected at levels of concern to human consumption of fish from 8 A family of soft-rayed fishes including the trouts, salmons, whitefishes, and graylings.

Portage Lake Watershed Forever Plan 59
the lake. Between 1990 and 2004, PCB levels in fish from Portage Lake declined consistent with similar trends elsewhere in the state following controls on the use and disposal of this chlorinated hydrocarbon.
Based upon the most recent information, recommended consumption warnings related to mercury in fish from Portage Lake are limited to bass over 18 inches. In general, mercury levels in Portage Lake fish are lower than those commonly found in inland lakes within Michigan. While PCB levels in fish are expected to continue to decline, consumption warnings for northern pike over 30 inches, smallmouth bass over 18 inches, and carp over 26 inches are still recommended for persons consuming these species from Portage Lake, particularly for children and women of childbearing age.
The current publication (2007) from the state on fish consumption advisories for Portage Lake does not reflect the most recent testing results and recommendations from the 2004 fish contaminant monitoring. In general, except for carp, the fish consumption advisories for Portage Lake fish based upon 2004 testing are less restrictive than those in the current published advisory. A copy of the Michigan Department of Community Health (MDCH) Fish Consumption Advisory for 2007 is available online at: http://www.michigan.gov/documents/FishAdvisory03_67354_7.pdf. For fish species not listed and for Lake Michigan species the MDCH publication provides statewide consumption advisories.
Following the analyses of the 2004 fish contaminant monitoring results, the MDEQ concluded that the sources of mercury and PCB contamination were due to either atmospheric deposition from sources outside of the watershed or the result of Lake Michigan fish entering Portage Lake from other locations. The MDEQ report recommended no further testing of contaminants in Portage Lake fish (MDEQ 2007e).
Plant and Algal Inventories An increase in the abundance of rooted aquatic plants and algal blooms that interfere with water uses is often the first sign observed by boaters, anglers, and swimmers that a problem with over-enrichment may be occurring. In 1991, both algal and rooted aquatic plant growth were measured.
Cladophora In response to local concerns about potential water quality degradation in Portage Lake due to the increased use of septic systems around the lake, a preliminary plan was developed in 1976 to provide sanitary sewers in all or a portion of the area surrounding the lake. After reviewing the plan and its updates in 1981, the Northwest Regional Planning Commission expressed concerns echoed by local residents that the plan lacked documentation of pollution problems that would necessitate a perimeter sanitary sewer system and proposed a study subsequently implemented in 1983 with support from the USEPA.
The 1983 Water Quality of Portage Lake, A Shoreline Algal Survey (NWMRPDC 1983) focused on the use of Cladophora, filamentous green algae, as an indicator algal species in combination with models to evaluate phosphorus loadings and sources. Phosphorus was determined to be a limiting factor in the productivity of lakes in the area and

Portage Lake Watershed Forever Plan 60
excessive phosphorus loadings from septic systems or other sources could lead to eutrophication (an abundant accumulation of nutrients that support dense growth of algae and other organisms, the decay of which depletes waters of oxygen), and associated water quality problems. Based on work in other areas, Cladophora abundance in shoreline areas was used as an indicator of excessive phosphorus loading and potential pollution from shoreline septic systems.
The 1983 report concluded that sources of phosphorus related to septic tank/tile fields represented less than 4 percent of the total phosphorus loading to Portage Lake and that the total loading for the lake at the time of the study was below critical levels. Only one area on the shoreline was found to have excessive Cladophora growths attributable to the presence of septic leaching—the shoreline area adjacent to the Portage Point Inn. Phosphorus loading from runoff and atmospheric deposition were estimated to contribute more than 96 percent of the total phosphorus inputs to the lake. The report recommended periodic sampling to detect any changes that might occur in Portage Lake related to pollution from septic tank/tile field failures.
The Phase I study reported visual observations made of Cladophora in August of 1991. The length of filament growth within one square foot was used to create a Cladophora Status Index (CSI). Of the 47 observations of Cladophora growth, 22 were attributed to possible human uses associated with lawn fertilization and septic systems. Seven of the observed sites with the highest CSI were clustered on the south side of the lake adjacent to high residential development and attributed to possible septic system drainage, the highest of which was in the lake at the Portage Point Inn site. The other 15 CSI sites associated with human activity were attributed to fertilizer use on riparian lawns and lakeshore disposal of lawn waste. All sites with a suspiciously high CSI were located on the south side and west end of Portage Lake where sanitary sewers were not available.
Rooted Aquatic Plant Survey The Phase I Study of rooted aquatic plants (macrophytes) in Portage Lake identified six major zones where macrophyte growth was most extensive. The areas were mapped and correlated to a large extent to lake contour levels between 10 and 15 feet. Macrophyte growth was highest in areas protected from wind and wave action with suitable organic, bottom substrate. The dominant species in each zone were identified and Eurasian watermilfoil and water celery were cited as dominant in certain zones during the months of August and September. The Phase I Study indicated that while the growth of these two species was widespread, their abundance in 1991 did not appear to be impairing human activities on the lake (see below).

Portage Lake Watershed Forever Plan 61
Aquatic Nuisance Organisms Portage Lake is particularly vulnerable to the introduction of exotic species. The open channel to Lake Michigan allows any exotic species in the Great Lakes to eventually find its way into Portage Lake and establish a population if appropriate habitat exists. Because it is a destination harbor for many Great Lakes anglers, boats from throughout Michigan, and even nearby states, routinely launch in Portage Lake and, as a result, potentially transport to Portage Lake exotic species that have attached to their boats or trailers.
Four exotic species are of particular concern in Portage Lake due to their known presence and their potential impact on existing uses. All four—zebra mussels (Dreissena polymorpha), Eurasian milfoil (Myriophyllum spicatum L.), purple loosestrife (Lythrum salicaria L.) and non-native varieties of the common reed (Phragmites australis)—are highly invasive and in other lakes have caused significant changes in fish and wildlife populations and other surface water uses. An exotic virus that causes viral hemorrhagic septicemia (VHS), a viral fish disease, has also had an indirect impact on the fisheries of Portage Lake and deserves special note. A brief overview of these invaders is provided below.
Because of its direct access to the Great Lakes, Portage Lake is also vulnerable to other exotic, invasive species like quagga mussels (Dreissena rostriformis bugensis, similar to the zebra mussel) and round gobies (Neogobius melanostomus), along with several other exotic plant and animal species now found in Lake Michigan. However, the presence and abundance of these species in Portage Lake has not been documented, nor are their potential effects on inland lakes well understood.
Eurasian Watermilfoil Eurasian watermilfoil (Myriophyllum spicatum) was accidentally introduced to North America from Europe. Spread westward into inland lakes primarily by boats and also by water birds, it reached Midwestern states between the 1950s and 1980s. In nutrient-rich lakes it can form thick underwater stands of tangled stems and vast mats of vegetation at the water’s surface. In shallow areas the plant can interfere with water recreation such as boating, fishing, and swimming. The plant’s floating canopy can also crowd out important native water plants.
A key factor in the plant’s success is its ability to reproduce through stem fragmentation and underground runners. A single segment of stem and leaves can take root and form a new colony. Milfoil may become entangled in boat propellers and may wrap around other external parts of the boat. Stems can become lodged among any watercraft apparatus or sports equipment that moves through the water, including boat trailers. Fragments clinging to boats and trailers can spread the plant from lake to lake. The mechanical clearing of weed beds for beaches, docks, and landings creates thousands of new stem fragments. Removing native vegetation creates perfect habitat for invading Eurasian watermilfoil.
Eurasian Watermilfoil Photo from Wisconsin DNR http://dnr.wi.gov/invasives/pubs/ EWMCard pdf

Portage Lake Watershed Forever Plan 62
This plant has difficulty becoming established in lakes with healthy populations of native plants. In some lakes it appears to coexist with native flora and has little impact on fish and other aquatic animals. In some situations, physical removal of small areas of milfoil has been effective. Once it becomes well established, however, more aggressive chemical or biological controls may be the only effective means to reduce its abundance in order to restore impaired surface uses.
Chemical control through the use of selective herbicides has been used in many Michigan lakes under permits from the MDEQ. Concerns with the application of chemicals and the potential impacts on other aquatic organisms have pushed research into the use of a small aquatic weevil (Euhrychiopsis lecontei) that feeds directly on milfoil, causing subsequent bacterial infection that can kill the plant. The effectiveness of this type of biological control is still undergoing investigation (Minnesota Sea Grant 2006).
Purple Loosestrife Purple loosestrife (Lythrum salicaria L.) is a plant native to Europe and was most likely introduced in North America from ballast materials used in ships during the early1800s. Viable seeds in the ballast deposited on the shoreline of eastern North America established the species on the Eastern Seaboard of the United States, where enterprising horticulturalists began distributing the plant for its flowers in perennial gardens. It eventually spread to 34 states by 1985 and is found throughout Michigan.
Due to its aggressive growth in wetland ecosystems, purple loosestrife can quickly convert areas to virtual monocultures displacing native plant species and associated wildlife populations that depend upon diverse wetlands habitats. Because of the concerns related to this exotic species and its apparent increasing abundance throughout the state, Michigan has passed laws that prohibit the sale and distribution of this species.
Various means have been attempted to control the abundance of purple loosestrife, including hand pulling, periodic flooding, fire, chemical treatment, and biological controls. Because of the expense and habitat disruption associated with other control mechanisms, biological controls were researched resulting in USDA approval of three insects for introduction to control purple loosestrife. The MDNR began the first releases of leaf beetles and root weevils to control purple loosestrife in 1994 in Saginaw Bay. Since that time numerous locations in the state have received similar introductions and evaluations are under way to determine the effectiveness of biological controls of purple loosestrife (Michigan Sea Grant 1997).
Purple Loosestrife Photo from USEPA Great Lakes National Program Office http://www.epa.gov/glnpo/image/ viz_iss4.html

Portage Lake Watershed Forever Plan 63
The Common Reed While the common reed, phragmites, is a plant native to Michigan, it is relatively uncommon. A European variant of this species, though, has become established in Michigan and elsewhere in the United States. This variety of reed is very aggressive and, like purple loosestrife, has spread to many wetlands in the Great Lakes and inland waters. The native and non-native variants are difficult to distinguish from one another. A key to identifying the European plant can be found at: http://www.invasiveplants.net /phragmites/phrag/morph.htm.
Phragmites plants range from 6 to 15 feet in height with nearly 80 percent of the plant mass contained in the root mass below ground up to six feet in depth. In the summer its flat gray-green leaves are 2.0 to 2.5 inches wide and 8 to 15 inches long in an alternate pattern on the stem. It has distinctive purple-brown seed heads that appear in late July. These feathery plumes form at the end of the stalks and are up to 20 inches long. While each plant can produce up to 2,000 seeds each year, it normally spreads by rhizome fragments. Left unchecked, the aggressive variant of phragmites can spread rapidly, pushing out native wetlands species and reducing available fish and wildlife habitat in nearshore wetlands.
The deep root system makes control of phragmites difficult. Only chemical control has been successful, followed by cutting, mowing, and/or controlled burning. No biological control is currently available. The application of chemical control agents requires a state permit. Mowing and burning are likely to require state and/or local permits as well (MDEQ 2007c).
Zebra Mussels Zebra mussels were introduced to the Great Lakes and first observed in the mid-1980s in Lake St. Clair. They are a European mollusk most likely transported to North America in ballast water from transoceanic ships. By 2000, zebra mussels had spread throughout the Great Lakes basin, the Mississippi drainage, and many of the lakes and streams in the eastern United States. This species continues to move south and westward; it is now found in 20 states and two Canadian provinces, as it is easily transported on recreational boats and trailers that have been largely responsible for its wide distribution since the species was first observed in the Great Lakes. In addition to serious water intake fouling, zebra mussels have caused
Phragmites Photo from MDEQ, http://michigan.gov/documents/deq/deq-ogl-Guide-Phragmites_204659_7.pdf
Zebra Mussels Photo from Minnesota DNR, http://www.dnr.state.mn.us/invasives/aquaticanimals/ zebramussel/index.html

Portage Lake Watershed Forever Plan 64
significant ecosystem changes in the Great Lakes and in inland lakes where they have become abundant.
Zebra mussels feed on phytoplankton (free-floating algae), and in massive numbers deplete this important food source of native invertebrate species, disrupting the flow of nutrient energy required to support forage and predator fish species higher in the food chain. Zebra mussel abundance has been so great in many areas that the clarity of the water has been noticeably increased by their removal of phytoplankton, and rooted aquatic plant species have increased in abundance due to increased light penetration. Some of the increased clarity measured in Portage Lake beginning in 2003 may in fact be due to the invasion and colonization of this species.
While zebra mussels are present in large number in Portage Lake, the impact of this species on resident fish populations is not known. Although some native species, and some exotic fish species introduced into the Great Lakes, have been found to feed on zebra mussels, the abundance of zebra mussels does not appear to be controlled by this predation. There are no effective means to control the abundance of zebra mussels once they become established in a lake system. Strategies to prevent their transport from one lake to another on boats and trailers have had only limited success. Recent information collected in Lake Michigan and elsewhere in the Great Lakes indicates that zebra mussels are being replaced in some areas by another invasive aquatic mollusk, the quagga mussel, which is similar in size and shape to the zebra mussel. Adults of both species are between one quarter and one half inch long and have D-shaped shells. These are the only freshwater mussels that can attach to objects (Wisconsin Sea Grant 2005).
Viral Hemorrhagic Septicemia (VHS) A recent exotic organism, viral hemorrhagic septicemia virus (VHSv), has already had an indirect impact on the fisheries of Portage Lake and deserves special note. VHSv. causes viral hemorrhagic septicemia (VHS); this disease was confirmed in 2003 in muskellunge taken in Lake St. Clair. Since that time it has been observed in coolwater and warmwater species in Lakes Ontario, Huron, Michigan, and Erie and in connecting Great Lakes waters. VHS has also been documented in a few inland lakes in Michigan, New York, and Wisconsin. While not a human pathogen, VHS has been associated with significant massive fish die-offs for a number of species in the Great Lakes region and elsewhere. Infected fish often exhibit hemorrhaging in the skin in large red patches, particularly on the sides and anterior portion of the head. The genetic fingerprint of the virus in the Great Lakes linked it to a variant previously seen in salmon in the Canadian Maritime provinces. It is believed that this virus was brought into the Great Lakes region through the discharge of ballast water from oceangoing freighters using the Great Lakes.
VHS Clinical Signs Photo by Mohamed Faisal, Michigan State University, 2007

Portage Lake Watershed Forever Plan 65
Because the presence of VHS is relatively new, very little information is available on species potentially affected, species that may serve as carries of the disease, and how infections spread from one area to another. While extensive research is under way to answer questions about this new virus, the MDNR, along with similar fish management agencies in the Great Lakes, has adopted a precautionary approach to taking certain species from the wild for reproduction and hatchery facilities. Conversely, walleye stocking in Portage Lake has been temporarily suspended pending the results of investigations of the presence of VHS to determine how the virus is transmitted and what steps can be taken in hatchery operations to prevent transmission (Whelan 2007).