portfolio committee on economic development the dti’s ... · portfolio committee on economic...
TRANSCRIPT

Portfolio Committee on Economic Development the dti’s involvement in the State’s procurement of
ARV’s
Directorate: Pharmaceuticals and Medical Devices
NATIONAL DEPARTMENT OF TRADE AND
INDUSTRY
28 June 2017
1

Overview of the South African
Pharmaceuticals Industry
2

Key Statistics: Pharmaceuticals Variable
Contribution in 2014/15
Global market Estimated to reach $400 mil per annum – 2019
SA market Approximately ZAR 45 bn
Contribution to GDP Approximately <1%
SA share of global market 0.4% (value) and 1.0% (volume) - Deloitte, 2016
CAGR (SA)
4.5% from 2015 TO 2020
Employment 9,500 in the industry
25,000 downstream (specialized logistics, retail and hospital pharmacies)
Trade balance ZAR 1.5 billion (Chapter 30 - Pharmaceuticals)
Active pharm. ingredients (APIs) est. - R 4.9 billion Biologics – SA market
Estimated ZAR 4 bn (biologics and vaccines)
Estimated multiplier 1.35 (Deloitte, 2016)
3

4

• The pharmaceutical market in SA was valued at approximately R45 billion in 2015. The private sector accounted for 84% of the market. The public sector accounted for 16% of the market.
• Approximately 276 companies are licensed by the DoH and the MCC to import, manufacture, distribute or export pharmaceuticals.
• Domestic manufacturing pharmaceutical companies almost exclusively produce generic products. SA pharmaceutical manufacturing companies are import dependent. In 2013, generics accounted for 63% of the private pharmaceutical market and 80% market share in government’s pharmaceutical use.
• The value of locally manufactured pharmaceuticals exported in 2015 was R4.9billion.
• Two local pharmaceutical multinational companies dominate the pharmaceutical manufacturing industry.
- As of 2013, Aspen market share = 16,2%; Adcock Ingram market share =8,9%
Broad profile of the SA pharmaceutical
manufacturing industry
5

• Key players: Dominant Multinational companies are Local. Aspen Pharmacare, Adcock Ingram, Cipla, Sanofi
• Key Input: Active Pharmaceutical Ingredients
• Market structure: Few dominant multinational companies that are vertical integrated across the pharmaceutical supply chain but vertical integration not located in SA
• Key Influencing factors: Intellectual Property (IP), Single Exit Price (SEP), Medicine selection by patients, registration process for new pharmaceuticals
• Regulatory bodies governing the industry
The Medicines Control Council (MCC)/SAHPRA, The South African National Accreditation System (SANAS), South African Bureau of Standards (SABS), Medicines Pricing Committee
- The South African National Policy on Intellectual property (in process of be revised)
- Technical standards: Trade-related Aspects of TRIPS agreement (e.g. EU Good distribution practices), WTO standards/accreditation
- Section 15 of the Medicines and Related Substances Amendment Act – enables DOH minister to prescribe the registration period for complementary medicines (imported without consent of the patent holder)
- Department of Health via SEP legislation and Local Procurement framework
- Although, the industry is subject to the dti BBBEE codes the draft charter for the health industry (released in 2005) has yet to materialise.
Summary of SA Pharmaceutical
manufacturing industry
6

Key Players (Performance):
Source: Utipharma
7

Top 10 Global Exporters of Pharmaceutical Products
Rank Exporters Value 2014 (ZAR
million)
% Growth 2014 %
Share 2014
1 Germany 862 869 20,1% 15,6%
2 Switzerland 677 686 22,7% 12,3%
3 Belgium 539 656 11,6% 9,8%
4 United States 476 320 24,9% 8,6%
5 France 380 670 7,0% 6,9%
6 United Kingdom 363 419 17,9% 6,6%
7 Ireland 294 806 17,5% 5,3%
8 Netherlands 278 728 28,9% 5,0%
9 Italy 273 553 20,8% 5,0%
10 Spain 137 305 9,7% 2,5%
46 South Africa 4 642 11,7% 0,1%
TOTAL EXPORTS 5 524 474 18,3% 100,0%
Data Extracted from: Trade Map, 2016
8

Top 10 Global importers of pharmaceutical
products
Rank Importers Value 2014 ZAR
million
%
Growth 2014
%
Share 2014
1 United States 786 012 30,1% 13,8%
2 Germany 533 684 22,9% 9,4%
3 Belgium 426 739 8,5% 7,5%
4 United Kingdom 365 155 37,1% 6,4%
5 France 301 540 20,5% 5,3%
6 Switzerland 254 716 20,0% 4,5%
7 Italy 233 244 14,3% 4,1%
8 Japan 215 438 7,5% 3,8%
9 Netherlands 209 166 28,6% 3,7%
10 China 192 198 32,6% 3,4%
42 South Africa 22 407 2,6% 0,4%
TOTAL IMPORTS 5 698 997 19,0% 100,0%
Data Extracted from: Trade Map, 2016
9

South Africa’s Trade in Pharmaceutical Products
• Note: *BMI Forecasted Values
• ^ Quantec values
• It is evident that imports are five times more than exports, thus the huge deficit in the pharmaceutical trade
Data Extracted from: Trade Map, 2016; Quantec, 2016; BMI 2016a & BMI 2016b
10

Pharma trade 2016
-20,000,000,000
-15,000,000,000
-10,000,000,000
-5,000,000,000
-
5,000,000,000
10,000,000,000
15,000,000,000
20,000,000,000
25,000,000,000
14 15 16
Exports 3,180,009,886 3,373,809,376 4,287,432,869
Imports 17,031,750,795 21,150,305,771 20,865,640,666
Trade Balance -13,851,740,909 -17,776,496,395 -16,578,207,797
Axi
s Ti
tle
Finished dosage form (H3004) trade balance
11

South Africa pharmaceutical imports
source countries
Rank
2015
Country Value 2014
ZAR million
Value 2015
ZAR million
% share
2015
% Growth
2015
AAGR
(2010-2015)
1 India 3 626 5 895 21,3% 62,6% 29,0%
2 United States 2 629 3 817 13,8% 45,2% 14,6%
3 Germany 2 826 3 321 12,0% 17,5% 11,8%
4 France 2 392 2 495 9,0% 4,3% 8,3%
5 United Kingdom 1 841 1 629 5,9% -11,5% 6,6%
6 Italy 1 502 1 348 4,9% -10,2% 3,7%
7 Ireland 772 1 254 4,5% 62,4% 4,4%
8 Belgium 807 995 3,6% 23,3% 11,2%
9 Switzerland 869 781 2,8% -10,1% 1,4%
10 Spain 537 759 2,7% 41,3% 14,2%
Total Imports 22 446 27 615 100,0% 23,0% 12,6%
Data Extracted from: Quantec, 2016
12

Top 10 South Africa’s Pharmaceutical
Exports Destination Countries
Rank
2015
Country
Value 2014
ZAR million
Value 2015
ZAR million
% Share
2015
% Growth
2015
AAGR
(2010-
2015)
1 Namibia 1 293 1 371 28,4% 6,1% 9,2%
2 Botswana 584 675 14,0% 15,7% 3,0%
3 U.S 282 358 7,4% 26,7% 24,1%
4 Hong Kong 234 318 6,6% 35,7% 78,3%
5 Zimbabwe 230 229 4,7% -0,6% 26,7%
6 Swaziland 238 220 4,5% -7,9% -1,4%
7 Zambia 155 196 4,1% 26,5% 30,9%
8 Kenya 169 153 3,2% -9,3% 16,5%
9 Australia 144 143 3,0% -0,7% 25,9%
10 Lesotho 109 138 2,9% 26,9% 6,5%
Total Exports 4 474 4 827 100,0% 7,9% 12,8%
Data Extracted from: Quantec, 2016
13
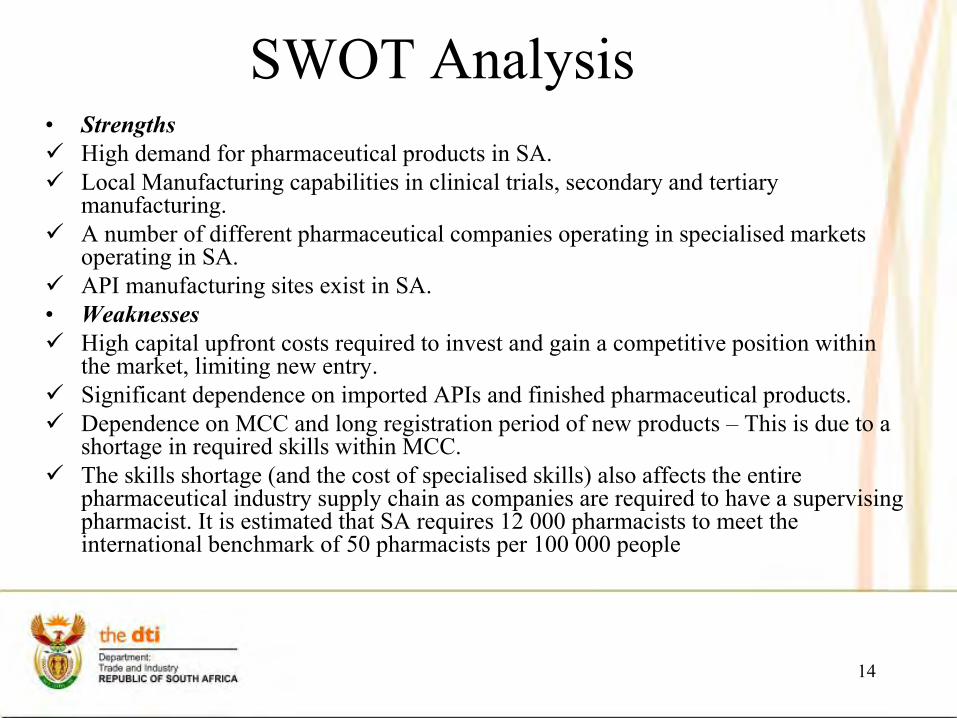
• Strengths
High demand for pharmaceutical products in SA.
Local Manufacturing capabilities in clinical trials, secondary and tertiary manufacturing.
A number of different pharmaceutical companies operating in specialised markets operating in SA.
API manufacturing sites exist in SA.
• Weaknesses
High capital upfront costs required to invest and gain a competitive position within the market, limiting new entry.
Significant dependence on imported APIs and finished pharmaceutical products.
Dependence on MCC and long registration period of new products – This is due to a shortage in required skills within MCC.
The skills shortage (and the cost of specialised skills) also affects the entire pharmaceutical industry supply chain as companies are required to have a supervising pharmacist. It is estimated that SA requires 12 000 pharmacists to meet the international benchmark of 50 pharmacists per 100 000 people
SWOT Analysis
14

• Weaknesses
The fragmented nature of the industry, across the private and public sectors has lead to difficulties in setting targets for each sub-sector. Incentivising transformation is limited as particular sub-sectors do not rely on government contracts. The fragmented approach to transformation in the industry has entrenched limited transformation of the supply chain.
Lack of cohesive policy approach targeting the industry. Legislation governing and influencing the industry is spread across the DoH, NT and the dti
• Opportunities
Local manufacturing capabilities in niche pharmaceutical sectors can be leveraged to serve growing market demand in the rest of Africa and globally.
• Threats
Economic conditions: the volatility of the rand and the relative weakness of the rand means that APIs are more expensive and given the SEP, companies are dis-incentivised to invest in local production facilities as predicting future profit margins is difficult.
SWOT Analysis cont…
15
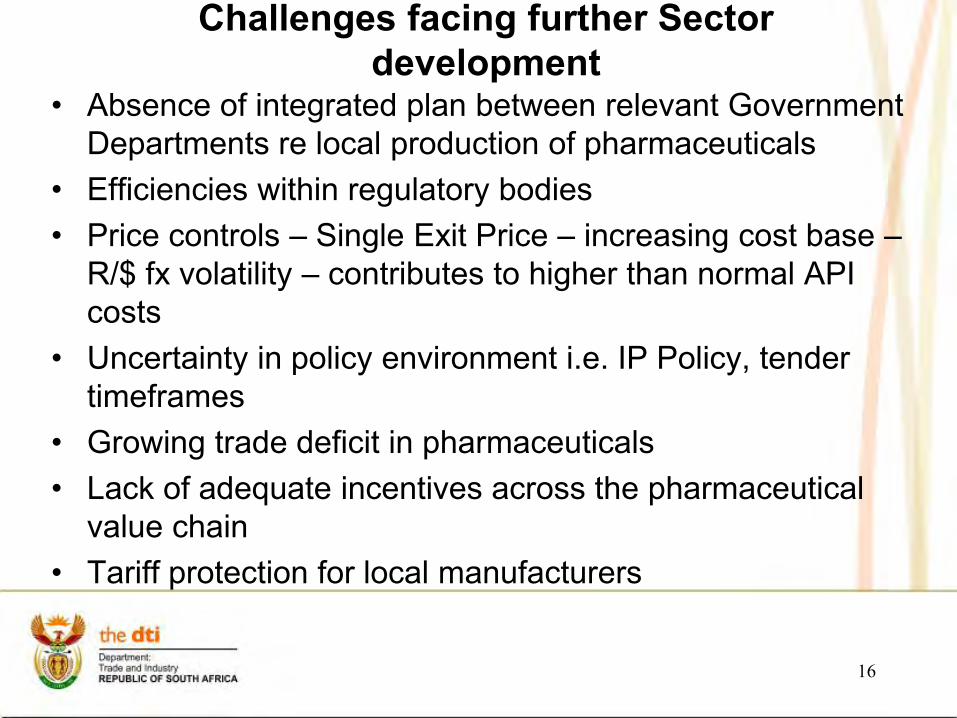
Challenges facing further Sector development
• Absence of integrated plan between relevant Government Departments re local production of pharmaceuticals
• Efficiencies within regulatory bodies • Price controls – Single Exit Price – increasing cost base –
R/$ fx volatility – contributes to higher than normal API costs
• Uncertainty in policy environment i.e. IP Policy, tender timeframes
• Growing trade deficit in pharmaceuticals • Lack of adequate incentives across the pharmaceutical
value chain • Tariff protection for local manufacturers
16

R1 invested in production = R 0.35 in Fiscal Revenue = R 1.13 in Value Created R1 M invested in production = 3 sustained jobs
o Knowledge economy o Skills development o Job creation o Broader tax base Reference: Deloitte 2016
Key Multipliers Impact on the Economy
Business Case for Local Manufacture of Pharmaceuticals
17

CONSIDERATIONS - Formulating industrial policy, a turn-around strategy for the SA pharmaceutical industry
Major problem areas (i) Divestment by MNC’s (37 plants closed down in South Africa
over the past 15 years); Low level of domestic investment; (ii) Growing reliance on imports - Economic burden (medical products are the 5th largest
contributor to South Africa’s trade deficit); - Potential risk to security of supply; - Stagnant (declining) exports. (iii) Structural imbalances (no API production) (iv) Widening production capacity and technology gap. Responding to national healthcare / public health needs: (i) AIDS and TB epidemics (ii) Growing burden of non-communicable diseases
18

Projects in SA pharmaceutical industry included in Government’s Industrial Policy (IPAP)
Strategic projects: Pharmaceutical Industry Development Plan
Roadmap for API production “Biovac” –vaccine manufacturing project, a 48%-52% jv SA Govt -
private consortium, pursued since 2003 Support for Biotech projects in SA e.g. Sabi Pharm etc. Various private sector projects in pharmaceutical formulation
Aurobindo, Mylan, Cipla etc.
19

KEY POINTS in DTI’s Industrial Policy for Pharmaceutical industry
1. Building investors’ confidence: I. Using Government procurement to leverage local manufacture. II. Exploring the means (also political) to boost exports (to Africa,
to the Least Developed Countries etc.), to the Global fund and the UN procurement agencies such as Unicef, UNDP, UNAIDS
III. Reasonable approach to the medicines pricing policy. 2. Growing domestic capacity in the manufacture of key APIs (ARVs,
anti-TB, biologics, reagents for in vitro diagnostics etc.) via technology transfer arrangements, investment incentives, tariff protection, expedited regulatory approval processes, NIPP etc.
3. Looking beyond simple manufacturing; Establishing alliances in R&D, Promoting clinical R&D, Preparing foundations for the upcoming revolution in pharmaceutical technologies and treatment (biologics, individual therapies).
20
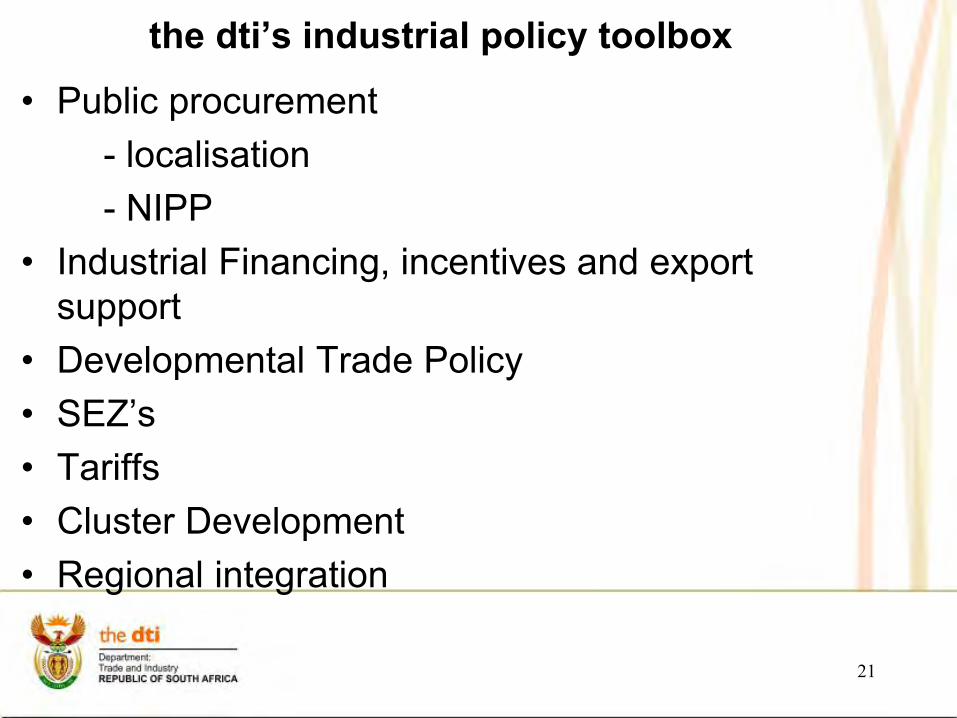
the dti’s industrial policy toolbox
• Public procurement - localisation - NIPP • Industrial Financing, incentives and export
support • Developmental Trade Policy • SEZ’s • Tariffs • Cluster Development • Regional integration
21

Local ARV production capabilities
• Adcock, Aspen, Cipla, Sonke/Sun Pharma,
Specpharm
• Systematic understanding of local production
capability for all molecules manufactured in SA
• Approximately 40% progress made, and about
30% completion on database
• Preparation for upcoming ARV tender in 2019
22

Collaboration with the dti re Designation of
HP13 2015
• Local manufacturing info provided to NDoH in lieu of
Designating the tender.
• Points allocation: 90/10 rule as per PPPFA
• Preference for local manufacturers
• Pricing – no price premium in place however the PPPFA
allowed for negotiations with local manufacturers for those
whose bids were within 10% of the price of the highest points
scorer
• Local manufacturers awarded approximately 62% by value at
the time of contract award i.e. est. R8.7 bn of total award
23

HP13 ARV allocation by volume
12%
17%
1%
8%
13%
0%
27%
0%
22%
Volume
Adcock
Aspen
Aurobindo
Abbot/Abvie
Cipla
MSD
Mylan
Mylan (via GFF)
Sonke (Ranbaxy)
24

HP13 ARV allocation by value
5%
19%
0%
9%
14%
0%
30%
0%
23%
Value
Adcock
Aspen
Aurobindo
Abbot/Abvie
Cipla
MSD
Mylan
Mylan (via GFF)
Sonke (Ranbaxy)
25
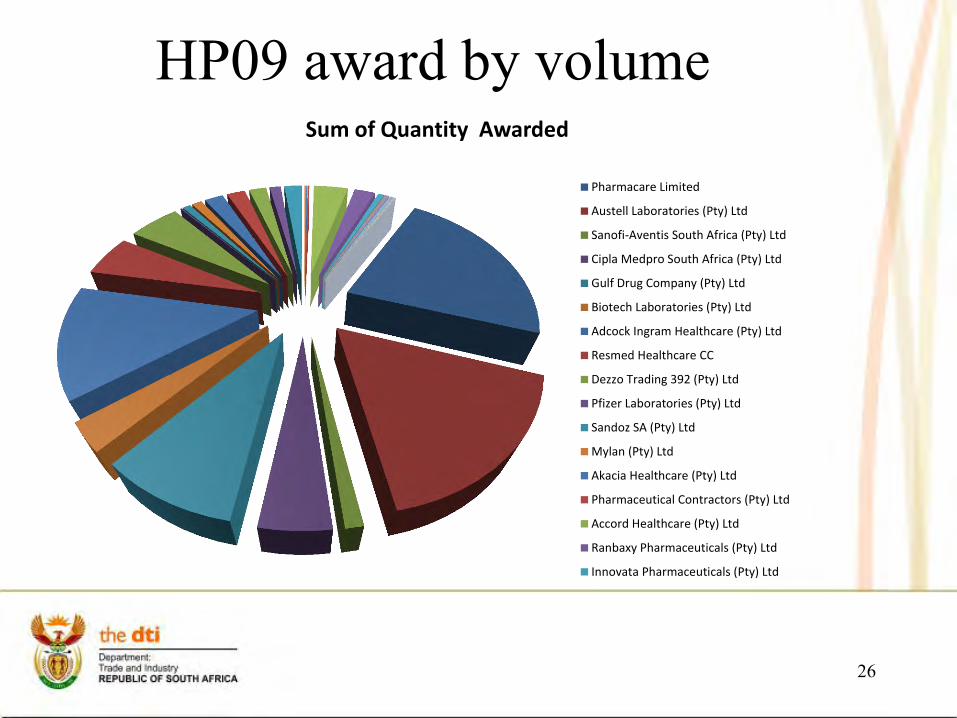
HP09 award by volume Sum of Quantity Awarded
Pharmacare Limited
Austell Laboratories (Pty) Ltd
Sanofi-Aventis South Africa (Pty) Ltd
Cipla Medpro South Africa (Pty) Ltd
Gulf Drug Company (Pty) Ltd
Biotech Laboratories (Pty) Ltd
Adcock Ingram Healthcare (Pty) Ltd
Resmed Healthcare CC
Dezzo Trading 392 (Pty) Ltd
Pfizer Laboratories (Pty) Ltd
Sandoz SA (Pty) Ltd
Mylan (Pty) Ltd
Akacia Healthcare (Pty) Ltd
Pharmaceutical Contractors (Pty) Ltd
Accord Healthcare (Pty) Ltd
Ranbaxy Pharmaceuticals (Pty) Ltd
Innovata Pharmaceuticals (Pty) Ltd
26

HP09 award by value
Sum of Value
Pharmacare Limited
Austell Laboratories (Pty) Ltd
Sanofi-Aventis South Africa (Pty) Ltd
Cipla Medpro South Africa (Pty) Ltd
Gulf Drug Company (Pty) Ltd
Biotech Laboratories (Pty) Ltd
Adcock Ingram Healthcare (Pty) Ltd
Resmed Healthcare CC
Dezzo Trading 392 (Pty) Ltd
Pfizer Laboratories (Pty) Ltd
Sandoz SA (Pty) Ltd
Mylan (Pty) Ltd
Akacia Healthcare (Pty) Ltd
Pharmaceutical Contractors (Pty) Ltd
Accord Healthcare (Pty) Ltd
Ranbaxy Pharmaceuticals (Pty) Ltd
Innovata Pharmaceuticals (Pty) Ltd
27

Condom manufacturing industry • 2018 tender estimated to be valued at ?
• Collaboration with NT to understand local
manufacturing capacity and phase in a preferential
procurement mechanism
• Current 2 bona fide local manufacturers, 2
additional to come on-line by 2018, the dti and DFI
support – local industry creation
• Collaboration with NT around possible tech transfer
for local manufacture of female condoms
28
Thank You!! Swasthi Soomaroo
Director: Pharmaceuticals and
Medical Devices
Tel: 082 944 0027
Email: [email protected]
29