portfolio of investments quarter - usaa · portfolio of investments (continued) usaa s&p 500...
TRANSCRIPT
PORTFOLIO OF INVESTMENTS 3RD QUARTER USAA S&P 500 INDEX FUND SEPTEMBER 30, 2017
(Form N-Q) 48414 -1117 ©2017, USAA. All rights reserved.

PORTFOLIO OF INVESTMENTSUSAA S&P 500 INDEX FUNDSeptember 30, 2017 (unaudited)
Number of SharesSecurity
1
Market Value (000) .
COMMON STOCKS (98.5%)
Consumer Discretionary (11.7%)Advertising (0.1%)
118,223 Interpublic Group of Companies, Inc. $ 2,458 69,264 Omnicom Group, Inc. 5,130
7,588
Apparel & Accessories & Luxury Goods (0.3%) 84,878 Coach, Inc. 3,419
109,931 Hanesbrands, Inc. 2,709 46,072 Michael Kors Holdings Ltd. * 2,204 23,101 PVH Corp. 2,912 16,467 Ralph Lauren Corp. 1,454 54,473 Under Armour, Inc. ''A'' (h)* 898 55,116 Under Armour, Inc. ''C'' (h)* 828 98,090 V.F. Corp. 6,235
20,659
Apparel Retail (0.4%) 39,699 Foot Locker, Inc. 1,398 66,401 Gap, Inc. 1,961 74,902 L Brands, Inc. 3,117
116,890 Ross Stores, Inc. 7,548 190,838 TJX Companies, Inc. 14,070
28,094
Auto Parts & Equipment (0.2%) 59,700 BorgWarner, Inc. 3,058 80,068 Delphi Automotive plc 7,879
10,937
Automobile Manufacturers (0.5%) 1,171,862 Ford Motor Co. 14,027
393,586 General Motors Co. 15,893 29,920
Automotive Retail (0.3%) 22,114 Advance Auto Parts, Inc. 2,194
8,379 AutoZone, Inc. * 4,986 54,986 CarMax, Inc. * 4,169 26,410 O'Reilly Automotive, Inc. * 5,688
17,037
Broadcasting (0.2%) 109,255 CBS Corp. ''B'' 6,337
46,099 Discovery Communications, Inc. ''A'' * 981 61,069 Discovery Communications, Inc. ''C'' * 1,237 29,081 Scripps Networks Interactive, Inc. ''A'' 2,498
11,053
Cable & Satellite (1.2%) 60,355 Charter Communications, Inc. ''A'' * 21,934
1,411,356 Comcast Corp. ''A'' 54,309 68,736 DISH Network Corp.''A'' * 3,728
79,971
Casinos & Gaming (0.1%)155358 MGM Resorts International 5,063 24,072 Wynn Resorts Ltd. 3,585
8,648
Computer & Electronic Retail (0.1%) 79,271 Best Buy Co., Inc. 4,515
Consumer Electronics (0.0%) 33,326 Garmin Ltd. 1,799
Department Stores (0.1%) 51,114 Kohl's Corp. 2,333 91,376 Macy's, Inc. 1,994 35,189 Nordstrom, Inc. 1,659
5,986
Distributors (0.2%) 44,072 Genuine Parts Co. 4,215 92,131 LKQ Corp. * 3,316
7,531

PORTFOLIO OF INVESTMENTS (continued)USAA S&P 500 INDEX FUNDSeptember 30, 2017 (unaudited)
Number of SharesSecurity
2
Market Value (000) .
Footwear (0.3%) 394,283 NIKE, Inc. ''B'' $ 20,444
General Merchandise Stores (0.3%) 78,057 Dollar General Corp. 6,327 71,060 Dollar Tree, Inc. * 6,169
163,728 Target Corp. 9,662 22,158
Home Furnishings (0.1%) 39,706 Leggett & Platt, Inc. 1,895 18,951 Mohawk Industries, Inc. * 4,691
6,586
Home Improvement Retail (1.2%) 353,652 Home Depot, Inc. 57,843 253,276 Lowe's Companies, Inc. 20,247
78,090
Homebuilding (0.1%) 102,002 D.R. Horton, Inc. 4,073
60,978 Lennar Corp. ''A'' 3,219 83,413 PulteGroup, Inc. 2,280
9,572
Hotels, Resorts & Cruise Lines (0.5%) 122,327 Carnival Corp. 7,899
61,565 Hilton Worldwide Holdings, Inc. 4,276 93,853 Marriott International, Inc. ''A'' 10,348 51,614 Royal Caribbean Cruises Ltd. 6,118 30,845 Wyndham Worldwide Corp. 3,251
31,892
Household Appliances (0.1%) 21,909 Whirlpool Corp. 4,041
Housewares & Specialties (0.1%) 147,098 Newell Brands, Inc. 6,277
Internet & Direct Marketing Retail (2.6%) 119,634 Amazon.com, Inc. * 115,010 36,687 Expedia, Inc. 5,281
129,555 Netflix, Inc. * 23,495 14,721 Priceline Group, Inc. * 26,951 32,187 TripAdvisor, Inc. * 1,305
172,042
Leisure Products (0.1%) 34,213 Hasbro, Inc. 3,341
102,301 Mattel, Inc. (h) 1,584 4,925
Motorcycle Manufacturers (0.0%) 51,264 Harley-Davidson, Inc. (h) 2,471
Movies & Entertainment (1.3%) 233,337 Time Warner, Inc. 23,905 315,178 Twenty-First Century Fox, Inc. ''A'' 8,314 131,863 Twenty-First Century Fox, Inc. ''B'' 3,401 106,354 Viacom, Inc. ''B'' 2,961 463,090 Walt Disney Co. 45,647
84,228
Publishing (0.0%) 113,042 News Corp. ''A'' 1,499
36,078 News Corp. ''B'' 492 1,991
Restaurants (1.1%) 7,534 Chipotle Mexican Grill, Inc. * 2,319
37,556 Darden Restaurants, Inc. 2,959 243,018 McDonald's Corp. 38,076 433,210 Starbucks Corp. 23,268 103,466 Yum! Brands, Inc. 7,616
74,238
PORTFOLIO OF INVESTMENTS (continued)USAA S&P 500 INDEX FUNDSeptember 30, 2017 (unaudited)
Number of SharesSecurity
3
Market Value (000) .
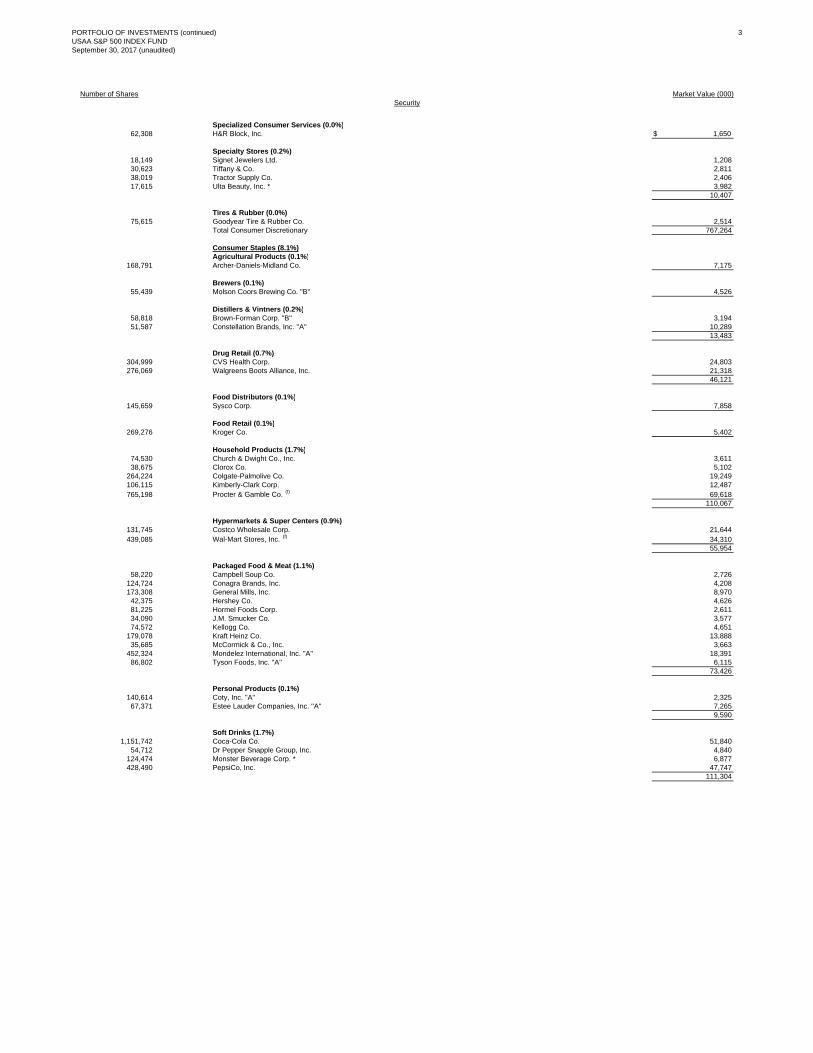
Specialized Consumer Services (0.0%) 62,308 H&R Block, Inc. $ 1,650
Specialty Stores (0.2%) 18,149 Signet Jewelers Ltd. 1,208 30,623 Tiffany & Co. 2,811 38,019 Tractor Supply Co. 2,406 17,615 Ulta Beauty, Inc. * 3,982
10,407
Tires & Rubber (0.0%) 75,615 Goodyear Tire & Rubber Co. 2,514
Total Consumer Discretionary 767,264
Consumer Staples (8.1%)Agricultural Products (0.1%)
168,791 Archer-Daniels-Midland Co. 7,175
Brewers (0.1%) 55,439 Molson Coors Brewing Co. ''B'' 4,526
Distillers & Vintners (0.2%) 58,818 Brown-Forman Corp. ''B'' 3,194 51,587 Constellation Brands, Inc. ''A'' 10,289
13,483
Drug Retail (0.7%) 304,999 CVS Health Corp. 24,803 276,069 Walgreens Boots Alliance, Inc. 21,318
46,121
Food Distributors (0.1%) 145,659 Sysco Corp. 7,858
Food Retail (0.1%) 269,276 Kroger Co. 5,402
Household Products (1.7%) 74,530 Church & Dwight Co., Inc. 3,611 38,675 Clorox Co. 5,102
264,224 Colgate-Palmolive Co. 19,249 106,115 Kimberly-Clark Corp. 12,487 765,198 Procter & Gamble Co. (f) 69,618
110,067
Hypermarkets & Super Centers (0.9%) 131,745 Costco Wholesale Corp. 21,644 439,085 Wal-Mart Stores, Inc. (f) 34,310
55,954
Packaged Food & Meat (1.1%) 58,220 Campbell Soup Co. 2,726
124,724 Conagra Brands, Inc. 4,208 173,308 General Mills, Inc. 8,970
42,375 Hershey Co. 4,626 81,225 Hormel Foods Corp. 2,611 34,090 J.M. Smucker Co. 3,577 74,572 Kellogg Co. 4,651
179,078 Kraft Heinz Co. 13,888 35,685 McCormick & Co., Inc. 3,663
452,324 Mondelez International, Inc. ''A'' 18,391 86,802 Tyson Foods, Inc. ''A'' 6,115
73,426
Personal Products (0.1%) 140,614 Coty, Inc. ''A'' 2,325
67,371 Estee Lauder Companies, Inc. ''A'' 7,265 9,590
Soft Drinks (1.7%) 1,151,742 Coca-Cola Co. 51,840
54,712 Dr Pepper Snapple Group, Inc. 4,840 124,474 Monster Beverage Corp. * 6,877 428,490 PepsiCo, Inc. 47,747
111,304

PORTFOLIO OF INVESTMENTS (continued)USAA S&P 500 INDEX FUNDSeptember 30, 2017 (unaudited)
Number of SharesSecurity
4
Market Value (000) .
Tobacco (1.3%) 575,567 Altria Group, Inc. $ 36,503 465,989 Philip Morris International, Inc. 51,729
88,232Total Consumer Staples 533,138
Energy (6.0%)Integrated Oil & Gas (2.9%)
568,608 Chevron Corp. 66,811 1,271,403 Exxon Mobil Corp. 104,230
229,553 Occidental Petroleum Corp. 14,740 185,781
Oil & Gas Drilling (0.0%) 32,537 Helmerich & Payne, Inc. 1,695
Oil & Gas Equipment & Services (0.8%) 129,054 Baker Hughes, a GE Co. 4,726 260,142 Halliburton Co. 11,974 113,362 National Oilwell Varco, Inc. 4,051 417,026 Schlumberger Ltd. 29,092 131,995 TechnipFMC plc * 3,685
53,528
Oil & Gas Exploration & Production (1.4%) 168,144 Anadarko Petroleum Corp. 8,214 114,227 Apache Corp. 5,232 138,195 Cabot Oil & Gas Corp. 3,697 273,472 Chesapeake Energy Corp. (h)* 1,176 28,542 Cimarex Energy Co. 3,244 44,417 Concho Resources, Inc. * 5,851
365,286 ConocoPhillips 18,282 157,590 Devon Energy Corp. 5,785 173,156 EOG Resources, Inc. 16,751
51,957 EQT Corp. 3,390 81,210 Hess Corp. 3,808
254,825 Marathon Oil Corp. 3,455 59,982 Newfield Exploration Co. * 1,780
146,274 Noble Energy, Inc. 4,148 51,032 Pioneer Natural Resources Co. 7,529 67,916 Range Resources Corp. 1,329
93,671
Oil & Gas Refining & Marketing (0.5%) 43,332 Andeavor 4,470
151,938 Marathon Petroleum Corp. 8,520 128,958 Phillips 66 11,814 132,535 Valero Energy Corp. 10,196
35,000
Oil & Gas Storage & Transportation (0.4%) 577,219 Kinder Morgan, Inc. 11,071 114,018 ONEOK, Inc. 6,318 247,728 Williams Companies, Inc. 7,434
24,823Total Energy 394,498
Financials (14.4%)Asset Management & Custody Banks (1.2%)
16,761 Affiliated Managers Group, Inc. 3,182 44,994 Ameriprise Financial, Inc. 6,682
310,036 Bank of New York Mellon Corp. 16,438 37,201 BlackRock, Inc. 16,632 98,776 Franklin Resources, Inc. 4,397
122,281 Invesco Ltd. 4,285 63,759 Northern Trust Corp. (c) 5,861
112,229 State Street Corp. 10,722 71,847 T. Rowe Price Group, Inc. 6,513
74,712
PORTFOLIO OF INVESTMENTS (continued)USAA S&P 500 INDEX FUNDSeptember 30, 2017 (unaudited)
Number of SharesSecurity
5
Market Value (000) .
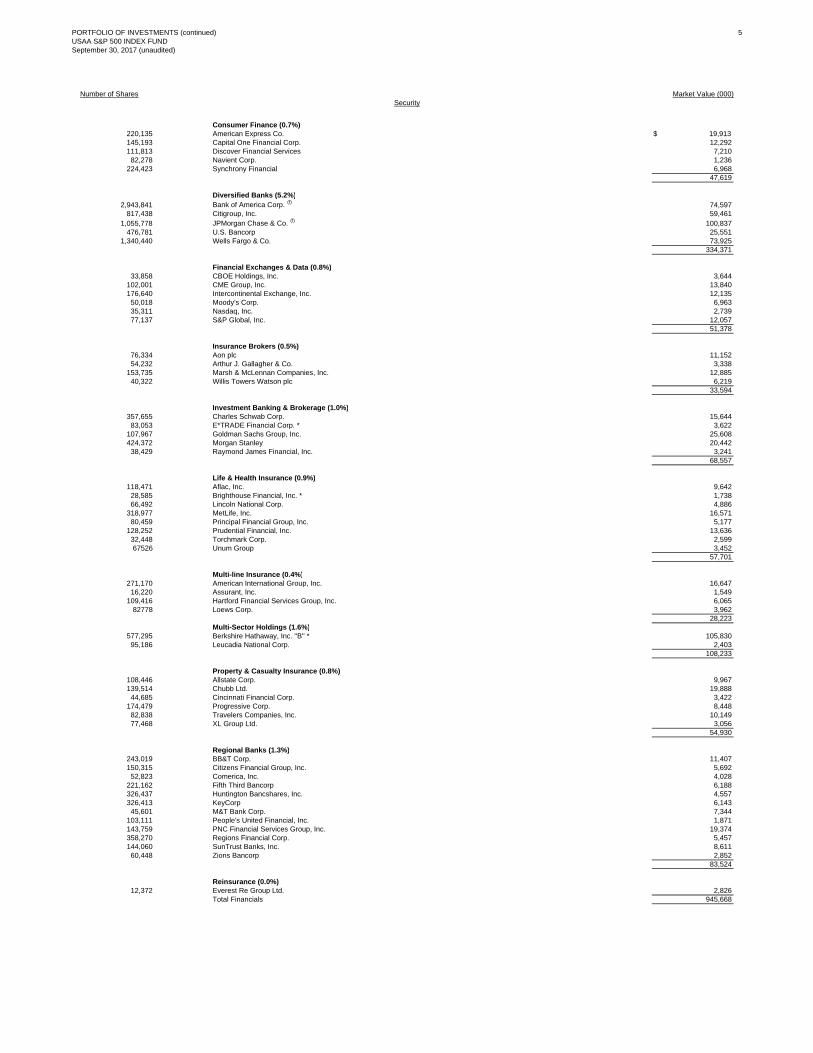
Consumer Finance (0.7%) 220,135 American Express Co. $ 19,913 145,193 Capital One Financial Corp. 12,292 111,813 Discover Financial Services 7,210
82,278 Navient Corp. 1,236 224,423 Synchrony Financial 6,968
47,619
Diversified Banks (5.2%) 2,943,841 Bank of America Corp. (f) 74,597
817,438 Citigroup, Inc. 59,461 1,055,778 JPMorgan Chase & Co. (f) 100,837
476,781 U.S. Bancorp 25,551 1,340,440 Wells Fargo & Co. 73,925
334,371
Financial Exchanges & Data (0.8%) 33,858 CBOE Holdings, Inc. 3,644
102,001 CME Group, Inc. 13,840 176,640 Intercontinental Exchange, Inc. 12,135
50,018 Moody's Corp. 6,963 35,311 Nasdaq, Inc. 2,739 77,137 S&P Global, Inc. 12,057
51,378
Insurance Brokers (0.5%) 76,334 Aon plc 11,152 54,232 Arthur J. Gallagher & Co. 3,338
153,735 Marsh & McLennan Companies, Inc. 12,885 40,322 Willis Towers Watson plc 6,219
33,594
Investment Banking & Brokerage (1.0%) 357,655 Charles Schwab Corp. 15,644
83,053 E*TRADE Financial Corp. * 3,622 107,967 Goldman Sachs Group, Inc. 25,608 424,372 Morgan Stanley 20,442
38,429 Raymond James Financial, Inc. 3,241 68,557
Life & Health Insurance (0.9%) 118,471 Aflac, Inc. 9,642
28,585 Brighthouse Financial, Inc. * 1,738 66,492 Lincoln National Corp. 4,886
318,977 MetLife, Inc. 16,571 80,459 Principal Financial Group, Inc. 5,177
128,252 Prudential Financial, Inc. 13,636 32,448 Torchmark Corp. 2,599
67526 Unum Group 3,452 57,701
Multi-line Insurance (0.4%) 271,170 American International Group, Inc. 16,647
16,220 Assurant, Inc. 1,549 109,416 Hartford Financial Services Group, Inc. 6,065
82778 Loews Corp. 3,962 28,223
Multi-Sector Holdings (1.6%) 577,295 Berkshire Hathaway, Inc. ''B'' * 105,830 95,186 Leucadia National Corp. 2,403
108,233
Property & Casualty Insurance (0.8%) 108,446 Allstate Corp. 9,967 139,514 Chubb Ltd. 19,888
44,685 Cincinnati Financial Corp. 3,422 174,479 Progressive Corp. 8,448
82,838 Travelers Companies, Inc. 10,149 77,468 XL Group Ltd. 3,056
54,930
Regional Banks (1.3%) 243,019 BB&T Corp. 11,407 150,315 Citizens Financial Group, Inc. 5,692
52,823 Comerica, Inc. 4,028 221,162 Fifth Third Bancorp 6,188 326,437 Huntington Bancshares, Inc. 4,557 326,413 KeyCorp 6,143
45,601 M&T Bank Corp. 7,344 103,111 People's United Financial, Inc. 1,871 143,759 PNC Financial Services Group, Inc. 19,374 358,270 Regions Financial Corp. 5,457 144,060 SunTrust Banks, Inc. 8,611
60,448 Zions Bancorp 2,852 83,524
Reinsurance (0.0%) 12,372 Everest Re Group Ltd. 2,826
Total Financials 945,668
PORTFOLIO OF INVESTMENTS (continued)USAA S&P 500 INDEX FUNDSeptember 30, 2017 (unaudited)
Number of SharesSecurity
6
Market Value (000) .
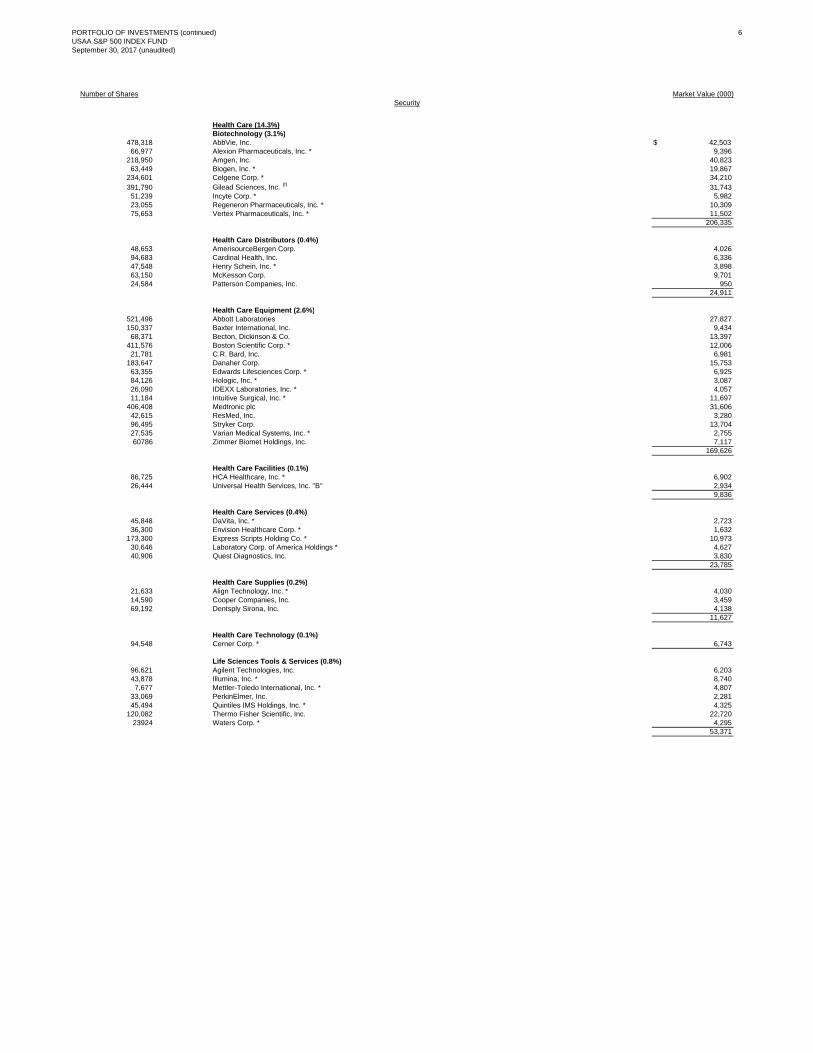
Health Care (14.3%)Biotechnology (3.1%)
478,318 AbbVie, Inc. $ 42,503 66,977 Alexion Pharmaceuticals, Inc. * 9,396
218,950 Amgen, Inc. 40,823 63,449 Biogen, Inc. * 19,867
234,601 Celgene Corp. * 34,210 391,790 Gilead Sciences, Inc. (f) 31,743 51,239 Incyte Corp. * 5,982 23,055 Regeneron Pharmaceuticals, Inc. * 10,309 75,653 Vertex Pharmaceuticals, Inc. * 11,502
206,335
Health Care Distributors (0.4%) 48,653 AmerisourceBergen Corp. 4,026 94,683 Cardinal Health, Inc. 6,336 47,548 Henry Schein, Inc. * 3,898 63,150 McKesson Corp. 9,701 24,584 Patterson Companies, Inc. 950
24,911
Health Care Equipment (2.6%) 521,496 Abbott Laboratories 27,827 150,337 Baxter International, Inc. 9,434
68,371 Becton, Dickinson & Co. 13,397 411,576 Boston Scientific Corp. * 12,006
21,781 C.R. Bard, Inc. 6,981 183,647 Danaher Corp. 15,753
63,355 Edwards Lifesciences Corp. * 6,925 84,126 Hologic, Inc. * 3,087 26,090 IDEXX Laboratories, Inc. * 4,057 11,184 Intuitive Surgical, Inc. * 11,697
406,408 Medtronic plc 31,606 42,615 ResMed, Inc. 3,280 96,495 Stryker Corp. 13,704 27,535 Varian Medical Systems, Inc. * 2,755
60786 Zimmer Biomet Holdings, Inc. 7,117 169,626
Health Care Facilities (0.1%) 86,725 HCA Healthcare, Inc. * 6,902 26,444 Universal Health Services, Inc. ''B'' 2,934
9,836
Health Care Services (0.4%) 45,848 DaVita, Inc. * 2,723 36,300 Envision Healthcare Corp. * 1,632
173,300 Express Scripts Holding Co. * 10,973 30,646 Laboratory Corp. of America Holdings * 4,627 40,906 Quest Diagnostics, Inc. 3,830
23,785
Health Care Supplies (0.2%) 21,633 Align Technology, Inc. * 4,030 14,590 Cooper Companies, Inc. 3,459 69,192 Dentsply Sirona, Inc. 4,138
11,627
Health Care Technology (0.1%) 94,548 Cerner Corp. * 6,743
Life Sciences Tools & Services (0.8%) 96,621 Agilent Technologies, Inc. 6,203 43,878 Illumina, Inc. * 8,740
7,677 Mettler-Toledo International, Inc. * 4,807 33,069 PerkinElmer, Inc. 2,281 45,494 Quintiles IMS Holdings, Inc. * 4,325
120,082 Thermo Fisher Scientific, Inc. 22,72023924 Waters Corp. * 4,295
53,371

PORTFOLIO OF INVESTMENTS (continued)USAA S&P 500 INDEX FUNDSeptember 30, 2017 (unaudited)
Number of SharesSecurity
7
Market Value (000) .
Managed Health Care (1.8%) 99,584 Aetna, Inc. $ 15,835 78,766 Anthem, Inc. 14,956 51,895 Centene Corp. * 5,022 75,527 Cigna Corp. 14,119 43,436 Humana, Inc. 10,582
290,069 UnitedHealth Group, Inc. 56,810 117,324
Pharmaceuticals (4.8%) 100,325 Allergan plc 20,562 492,104 Bristol-Myers Squibb Co. 31,367 290,771 Eli Lilly & Co. 24,873 805,345 Johnson & Johnson (f) 104,703 820,358 Merck & Co., Inc. (f) 52,527 160,986 Mylan N.V. * 5,050
39,829 Perrigo Co. plc 3,372 1,790,741 Pfizer, Inc. (f) 63,929
146,896 Zoetis, Inc. 9,366 315,749
Total Health Care 939,307
Industrials (10.1%)Aerospace & Defense (2.5%)
116,538 Arconic, Inc. 2,900 166,713 Boeing Co. 42,380
83,617 General Dynamics Corp. 17,190 23,456 L3 Technologies, Inc. 4,420 75,221 Lockheed Martin Corp. 23,341 52,220 Northrop Grumman Corp. 15,025 86,999 Raytheon Co. 16,232 48,720 Rockwell Collins, Inc. 6,368 79,551 Textron, Inc. 4,286 14,435 TransDigm Group, Inc. 3,690
222,951 United Technologies Corp. 25,880 161,712
Agriculture & Farm Machinery (0.2%) 96,017 Deere & Co. 12,059
Air Freight & Logistics (0.7%) 42,381 C.H. Robinson Worldwide, Inc. 3,225 53,991 Expeditors International of Washington, Inc. 3,232 74,054 FedEx Corp. 16,705
206,491 United Parcel Service, Inc. ''B'' 24,798 47,960
Airlines (0.5%) 37,046 Alaska Air Group, Inc. 2,825
130,087 American Airlines Group, Inc. 6,178 199,828 Delta Air Lines, Inc. 9,636 165,201 Southwest Airlines Co. 9,248
77,602 United Continental Holdings, Inc. * 4,724 32,611
Building Products (0.4%) 44,236 A.O. Smith Corp. 2,629 28,345 Allegion plc 2,451 46,356 Fortune Brands Home & Security, Inc. 3,116
279,751 Johnson Controls International plc 11,27196076 Masco Corp. 3,748
23,215
Construction & Engineering (0.1%) 42,100 Fluor Corp. 1,773 36,062 Jacobs Engineering Group, Inc. 2,101 45,493 Quanta Services, Inc. * 1,700
5,574
Construction Machinery & Heavy Trucks (0.6%) 177,449 Caterpillar, Inc. 22,130
47,313 Cummins, Inc. 7,950 105,462 PACCAR, Inc. 7,629
37,709

PORTFOLIO OF INVESTMENTS (continued)USAA S&P 500 INDEX FUNDSeptember 30, 2017 (unaudited)
Number of SharesSecurity
8
Market Value (000) .
Diversified Support Services (0.0%) 25,473 Cintas Corp. $ 3,675
Electrical Components & Equipment (0.5%) 12,645 Acuity Brands, Inc. 2,166 69,319 AMETEK, Inc. 4,578
133,227 Eaton Corp. plc 10,230 192,118 Emerson Electric Co. 12,073
38,589 Rockwell Automation, Inc. 6,877 35,924
Environmental & Facilities Services (0.2%) 68,760 Republic Services, Inc. 4,542 25,602 Stericycle, Inc. * 1,834
121,643 Waste Management, Inc. 9,521 15,897
Human Resource & Employment Services (0.0%) 37,702 Robert Half International, Inc. 1,898
Industrial Conglomerates (2.1%) 179,071 3M Co. 37,587
2,597,972 General Electric Co. 62,819 228,891 Honeywell International, Inc. 32,443
30,576 Roper Technologies, Inc. 7,442 140,291
Industrial Machinery (0.9%) 46,723 Dover Corp. 4,270 38,658 Flowserve Corp. 1,646 91,622 Fortive Corp. 6,486 92,944 Illinois Tool Works, Inc. 13,752 76,194 Ingersoll-Rand plc 6,794 39,810 Parker-Hannifin Corp. 6,968 49,556 Pentair plc 3,368 17,125 Snap-on, Inc. 2,552 45,792 Stanley Black & Decker, Inc. 6,913 53,669 Xylem, Inc. 3,361
56,110
Railroads (0.9%) 273,945 CSX Corp. 14,864
31,738 Kansas City Southern 3,449 86,558 Norfolk Southern Corp. 11,447
240,091 Union Pacific Corp. 27,843 57,603
Research & Consulting Services (0.3%) 35,998 Equifax, Inc. 3,816
109,059 IHS Markit Ltd. * 4,807 100,682 Nielsen Holdings plc 4,173
46,856 Verisk Analytics, Inc. * 3,898 16,694
Trading Companies & Distributors (0.2%) 85,823 Fastenal Co. 3,912 25,496 United Rentals, Inc. * 3,537 15,783 W.W. Grainger, Inc. 2,837
10,286
Trucking (0.0%) 25,576 J.B. Hunt Transport Services, Inc. 2,841
Total Industrials 662,059
Information Technology (22.9%)Application Software (1.1%)
148,166 Adobe Systems, Inc. * 22,103 25,423 ANSYS, Inc. * 3,120 65,771 Autodesk, Inc. * 7,383 84,052 Cadence Design Systems, Inc. * 3,317 43,203 Citrix Systems, Inc. * 3,319 72,919 Intuit, Inc. 10,365
204,845 salesforce.com, Inc. * 19,13745295 Synopsys, Inc. * 3,648
72,392
Communications Equipment (1.0%) 1,500,576 Cisco Systems, Inc. 50,464
18,882 F5 Networks, Inc. * 2,277 35,878 Harris Corp. 4,725
114,451 Juniper Networks, Inc. 3,185 48,773 Motorola Solutions, Inc. 4,139
64,790

PORTFOLIO OF INVESTMENTS (continued)USAA S&P 500 INDEX FUNDSeptember 30, 2017 (unaudited)
Number of SharesSecurity
9
Market Value (000) .
Data Processing & Outsourced Services (2.6%) 14,501 Alliance Data Systems Corp. $ 3,213
133,362 Automatic Data Processing, Inc. 14,579 99,853 Fidelity National Information Services, Inc. 9,325 63,173 Fiserv, Inc. * 8,147 45,594 Global Payments, Inc. 4,333
280,186 Mastercard, Inc. ''A'' 39,562 95,923 Paychex, Inc. 5,751
339,171 PayPal Holdings, Inc. * 21,717 50,365 Total System Services, Inc. 3,299
548,925 Visa, Inc. ''A'' 57,769 139,620 Western Union Co. 2,681
170,376
Electronic Components (0.2%) 91,447 Amphenol Corp. ''A'' 7,740
271,100 Corning, Inc. 8,111 15,851
Electronic Equipment & Instruments (0.0%) 40,965 FLIR Systems, Inc. 1,594
Electronic Manufacturing Services (0.1%) 106,091 TE Connectivity Ltd. 8,812
Home Entertainment Software (0.4%) 226,517 Activision Blizzard, Inc. 14,613
92,629 Electronic Arts, Inc. * 10,936 25,549
Internet Software & Services (4.8%) 51,056 Akamai Technologies, Inc. * 2,487 89,427 Alphabet, Inc. ''A'' * 87,077 90,572 Alphabet, Inc. ''C'' * 86,869
298,693 eBay, Inc. * 11,488 711,196 Facebook, Inc. ''A'' * 121,522 25,824 VeriSign, Inc. * 2,747
312,190
IT Consulting & Other Services (1.4%) 185,444 Accenture plc ''A'' 25,048 176,906 Cognizant Technology Solutions Corp. ''A'' 12,833
49,176 CSRA, Inc. 1,587 85,223 DXC Technology Co. 7,319 27,025 Gartner, Inc. * 3,362
260,074 International Business Machines Corp. 37,731 87,880
Semiconductor Equipment (0.5%) 320,038 Applied Materials, Inc. 16,671
46,985 KLA-Tencor Corp. 4,980 48,746 Lam Research Corp. 9,020
30,671
Semiconductors (3.2%) 241,508 Advanced Micro Devices, Inc. * 3,079 110,038 Analog Devices, Inc. 9,482 122,002 Broadcom Ltd. 29,590
1,409,929 Intel Corp. 53,690 69,865 Microchip Technology, Inc. 6,273
334,277 Micron Technology, Inc. * 13,147 180,020 NVIDIA Corp. 32,182
37,927 Qorvo, Inc. * 2,681 443,426 QUALCOMM, Inc. 22,987
55,348 Skyworks Solutions, Inc. 5,640 297,052 Texas Instruments, Inc. 26,628
74,817 Xilinx, Inc. 5,299 210,678
Systems Software (3.5%) 95,377 CA, Inc. 3,184
2,310,919 Microsoft Corp. (f) 172,140 905,988 Oracle Corp. 43,805
53,277 Red Hat, Inc. * 5,906 184,448 Symantec Corp. 6,052
231,087

PORTFOLIO OF INVESTMENTS (continued)USAA S&P 500 INDEX FUNDSeptember 30, 2017 (unaudited)
Number of SharesSecurity
10
Market Value (000) .
Technology Hardware, Storage & Peripherals (4.1%) 1,549,773 Apple, Inc. (f) $ 238,851
493,143 Hewlett Packard Enterprise Co. 7,254 499,939 HP, Inc. 9,979
81,320 NetApp, Inc. 3,559 86,411 Seagate Technology plc 2,866 88,485 Western Digital Corp. 7,645 64,577 Xerox Corp. 2,150
272,304Total Information Technology 1,504,174
Materials (2.9%)Commodity Chemicals (0.1%)
97,429 LyondellBasell Industries N.V. ''A'' 9,650
Construction Materials (0.1%) 18,847 Martin Marietta Materials, Inc. 3,887 39,827 Vulcan Materials Co. 4,763
8,650
Copper (0.1%) 403,922 Freeport-McMoRan, Inc. * 5,671
Diversified Chemicals (0.8%) 700,187 DowDuPont, Inc. 48,474
43,332 Eastman Chemical Co. 3,921 52,395
Fertilizers & Agricultural Chemicals (0.4%) 69,462 CF Industries Holdings, Inc. 2,442 40,191 FMC Corp. 3,590
131,661 Monsanto Co. 15,776 104,606 Mosaic Co. 2,258
24,066
Gold (0.1%) 159,873 Newmont Mining Corp. 5,997
Industrial Gases (0.3%) 65,426 Air Products & Chemicals, Inc. 9,894 85,934 Praxair, Inc. 12,008
21,902
Metal & Glass Containers (0.1%) 105,224 Ball Corp. 4,346
Paper Packaging (0.3%) 26,613 Avery Dennison Corp. 2,617
123,809 International Paper Co. 7,035 28,289 Packaging Corp. of America 3,244 56,669 Sealed Air Corp. 2,421
76458 WestRock Co. 4,337 19,654
Specialty Chemicals (0.5%) 33,320 Albemarle Corp. 4,542 78,208 Ecolab, Inc. 10,058 23,604 International Flavors & Fragrances, Inc. 3,373 76,727 PPG Industries, Inc. 8,337
24683 Sherwin-Williams Co. 8,838 35,148
Steel (0.1%) 95,781 Nucor Corp. 5,368
Total Materials 192,847
Real Estate (2.9%)Real Estate Services (0.1%)
90,305 CBRE Group, Inc. ''A'' * 3,421
REITs - Health Care (0.3%) 140,681 HCP, Inc. 3,915 106,564 Ventas, Inc. 6,941 110,430 Welltower, Inc. 7,761
18,617
REITs - Hotel & Resort (0.1%) 222,563 Host Hotels & Resorts, Inc. 4,115
REITs - Industrial (0.2%) 106,767 Duke Realty Corp. 3,077
159793 Prologis, Inc. 10,140 13,217

PORTFOLIO OF INVESTMENTS (continued)USAA S&P 500 INDEX FUNDSeptember 30, 2017 (unaudited)
Number of SharesSecurity
11
Market Value (000) .
REITs - Office (0.2%) 28,199 Alexandria Real Estate Equities, Inc. $ 3,355 46,267 Boston Properties, Inc. 5,685 29,853 SL Green Realty Corp. 3,025 51,748 Vornado Realty Trust 3,978
16,043
REITs - Residential (0.4%) 46,832 Apartment Investment & Management Co. ''A'' 2,054 41,309 AvalonBay Communities, Inc. 7,370
110,063 Equity Residential 7,256 19,713 Essex Property Trust, Inc. 5,008 33,952 Mid-America Apartment Communities, Inc. 3,629 80,437 UDR, Inc. 3,059
28,376
REITs - Retail (0.4%) 21,552 Federal Realty Investment Trust 2,677
188,295 GGP, Inc. 3,911 127,525 Kimco Realty Corp. 2,493
32,846 Macerich Co. 1,806 82,156 Realty Income Corp. 4,698 44,617 Regency Centers Corp. 2,768 93,339 Simon Property Group, Inc. 15,029
33,382
REITs - Specialized (1.2%) 128,832 American Tower Corp. 17,609 121,982 Crown Castle International Corp. 12,196
61,451 Digital Realty Trust, Inc. 7,271 23,327 Equinix, Inc. 10,411 37,661 Extra Space Storage, Inc. 3,010 79,528 Iron Mountain, Inc. 3,094 44,861 Public Storage 9,600 36,071 SBA Communications Corp. * 5,196226433 Weyerhaeuser Co. 7,705
76,092Total Real Estate 193,263
Telecommunication Services (2.1%)Alternative Carriers (0.1%)
87,743 Level 3 Communications, Inc. * 4,676
Integrated Telecommunication Services (2.0%) 1,842,912 AT&T, Inc. (f) 72,187
163,841 CenturyLink, Inc. (h) 3,097 1,223,706 Verizon Communications, Inc. (f) 60,561
135,845Total Telecommunication Services 140,521
Utilities (3.1%)Electric Utilities (1.9%)
69,889 Alliant Energy Corp. 2,905 147,254 American Electric Power Co., Inc. 10,343 210,207 Duke Energy Corp. 17,641
97,950 Edison International 7,559 53,993 Entergy Corp. 4,123 95,411 Eversource Energy 5,767
287,963 Exelon Corp. 10,847 132,652 FirstEnergy Corp. 4,090 140,336 NextEra Energy, Inc. 20,566 153,777 PG&E Corp. 10,471
33,260 Pinnacle West Capital Corp. 2,812 204,454 PPL Corp. 7,759 300,131 Southern Co. 14,748 152,742 Xcel Energy, Inc. 7,228
126,859
Independent Power Producers & Energy Traders (0.1%) 197,878 AES Corp. 2,181
90,240 NRG Energy, Inc. 2,309 4,490

PORTFOLIO OF INVESTMENTS (continued)USAA S&P 500 INDEX FUNDSeptember 30, 2017 (unaudited)
Number of SharesSecurity
12
Market Value (000) .
Multi-Utilities (1.0%) 73,046 Ameren Corp. $ 4,225
130,132 CenterPoint Energy, Inc. 3,801 84,868 CMS Energy Corp. 3,931 92,592 Consolidated Edison, Inc. 7,470
192,537 Dominion Energy, Inc. 14,812 53,980 DTE Energy Co. 5,795 98,409 NiSource, Inc. 2,518
152,178 Public Service Enterprise Group, Inc. 7,038 42,785 SCANA Corp. 2,075 75,181 Sempra Energy 8,581 94,962 WEC Energy Group, Inc. 5,962
66,208
Water Utilities (0.1%) 53,572 American Water Works Co., Inc. 4,335
Total Utilities 201,892Total Common Stock (Cost: $3,125,912) 6,474,631
MONEY MARKET INSTRUMENTS (1.5%)GOVERNMENT & U.S. TREASURY MONEY MARKET FUNDS (1.3%)
86,668,086 Northern Institutional Funds - Government Assets Portfolio, 0.83% (a),(d) 86,668
PrincipalAmount
(000)U.S. TREASURY BILLS (0.2%)
12,995$ 1.09%, 2/01/2018 (b),(e) 12,908 Total Money Market Instruments (Cost: $99,576) 99,576
Number of SharesSHORT-TERM INVESTMENTS PURCHASED WITH CASH COLLATERAL FROM SECURITIES LOANED (0.1%)GOVERNMENT & U.S. TREASURY MONEY MARKET FUNDS (0.1%)
986,625 Federated Government Obligations Fund Institutional Class, 0.89% (a) 987 231,875 Goldman Sachs Financial Square Government Fund Institutional Class, 0.91% (a) 232
6,564,525 Invesco Government & Agency Portfolio Institutional Class, 0.93% (a) 6,564 Total Short-Term Investments Purchased with Cash Collateral from Securities Loaned (Cost: $7,783) 7,783
Total Investments (Cost: $3,233,271) 6,581,990$
UnrealizedAppreciation/
Number of Expiration Notional Contract (Depreciation)Contracts Date Amount (000) Value (000) (000)
FUTURES (g)
LONG FUTURES
Equity Contracts834 E-mini S&P 500 Index Futures 12/15/2017 102,942 USD 104,917$ 1,975$
Total Futures 104,917$ 1,975$
13
PORTFOLIO OF INVESTMENTS (continued)USAA S&P 500 INDEX FUND
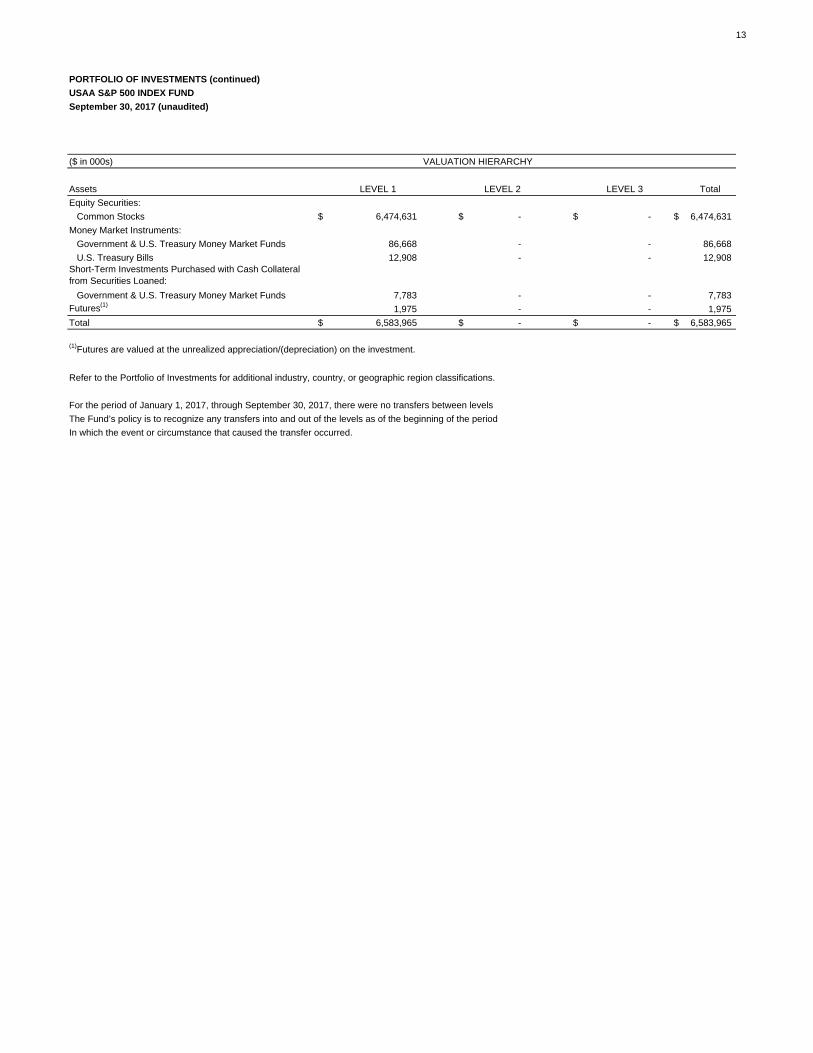
($ in 000s) VALUATION HIERARCHY
Assets LEVEL 1 LEVEL 2 LEVEL 3 TotalEquity Securities:
Common Stocks $ 6,474,631 $ - $ - $ 6,474,631 Money Market Instruments:
Government & U.S. Treasury Money Market Funds 86,668 - - 86,668 U.S. Treasury Bills 12,908 - - 12,908
Short-Term Investments Purchased with Cash Collateral from Securities Loaned:
Government & U.S. Treasury Money Market Funds 7,783 - - 7,783 Futures(1) 1,975 - - 1,975 Total $ 6,583,965 $ - $ - $ 6,583,965
(1)Futures are valued at the unrealized appreciation/(depreciation) on the investment.
Refer to the Portfolio of Investments for additional industry, country, or geographic region classifications.
For the period of January 1, 2017, through September 30, 2017, there were no transfers between levelsThe Fund’s policy is to recognize any transfers into and out of the levels as of the beginning of the periodIn which the event or circumstance that caused the transfer occurred.
September 30, 2017 (unaudited)

NOTES TO PORTFOLIO OF INVESTMENTS September 30, 2017 (unaudited)
14 | USAA S&P 500 Index Fund
GENERAL NOTES USAA MUTUAL FUNDS TRUST (the Trust), registered under the Investment Company Act of 1940, as amended (the 1940 Act), is an open-end management investment company organized as a Delaware statutory trust consisting of 51 separate funds. Additionally, USAA S&P 500 Index Fund (the Fund) qualifies as a registered investment company under Accounting Standards Codification Topic 946. The information presented in this quarterly report pertains only to the Fund, which is classified as diversified under the 1940 Act. The Fund consists of two classes of shares: Member Shares and Reward Shares. Each class of shares has equal rights to assets and earnings, except that each class bears certain class-related expenses specific to the particular class. These expenses include administration and servicing fees, transfer agency fees, postage, shareholder reporting fees, and certain registration and custodian fees. Expenses not attributable to a specific class, income, and realized gains or losses on investments are allocated to each class of shares based on each class’s relative net assets. Each class has exclusive voting rights on matters related solely to that class and separate voting rights on matters that relate to both classes. A. Security valuation – The Trust’s Board of Trustees (the Board) has established the Valuation Committee (the Committee), and subject to Board oversight, the Committee administers and oversees the Fund’s valuation policies and procedures, which are approved by the Board. Among other things, these policies and procedures allow the Fund to utilize independent pricing services, quotations from securities dealers, and a wide variety of sources and information to establish and adjust the fair value of securities as events occur and circumstances warrant. The Committee reports to the Board on a quarterly basis and makes recommendations to the Board as to pricing methodologies and services used by the Fund and presents additional information to the Board regarding application of the pricing and fair valuation policies and procedures during the preceding quarter. The Committee meets as often as necessary to make pricing and fair value determinations. In addition, the Committee holds regular monthly meetings to review prior actions taken by the Committee and USAA Asset Management Company (the Manager), an affiliate of the Fund. Among other things, these monthly meetings include a review and analysis of backtesting reports, pricing service quotation comparisons, illiquid securities and fair value determinations, pricing movements, and daily stale price monitoring. The value of each security is determined (as of the close of trading on the New York Stock Exchange (NYSE) on each business day the NYSE is open) as set forth below:
15 | USAA S&P 500 Index Fund
1. Equity securities, including exchange-traded funds (ETFs), except as otherwise noted, traded primarily on a domestic securities exchange or the over-the-counter markets, are valued at the last sales price or official closing price on the exchange or primary market on which they trade. Securities traded primarily on foreign securities exchanges or markets are valued at the last quoted sale price, or the most recently determined official closing price calculated according to local market convention, available at the time the Fund is valued. If no last sale or official closing price is reported or available, the average of the bid and ask prices generally is used. Actively traded equity securities listed on a domestic exchange generally are categorized in Level 1 of the fair value hierarchy. Certain preferred and equity securities traded in inactive markets generally are categorized in Level 2 of the fair value hierarchy. 2. Investments in open-end investment companies, commingled, or other funds, other than ETFs, are valued at their net asset value (NAV) at the end of each business day and are categorized in Level 1 of the fair value hierarchy. 3. Futures are valued at the settlement price at the close of market on the principal exchange on which they are traded or, in the absence of any transactions that day, the settlement price on the prior trading date if it is within the spread between the closing bid and ask price closest to the last reported sale price. 4. Short-term debt securities with original or remaining maturities of 60 days or less may be valued at amortized cost, provided that amortized cost represents the fair value of such securities. 5. Debt securities with maturities greater than 60 days are valued each business day by a pricing service (the Service) approved by the Board. The Service uses an evaluated mean between quoted bid and ask prices or the last sales price to value a security when, in the Service’s judgment, these prices are readily available and are representative of the security's market value. For many securities, such prices are not readily available. The Service generally prices those securities based on methods which include consideration of yields or prices of securities of comparable quality, coupon, maturity, and type; indications as to values from dealers in securities; and general market conditions. Generally, debt securities are categorized in Level 2 of the fair value hierarchy; however, to the extent the valuations include significant unobservable inputs, the securities would be categorized in Level 3. 6. Repurchase agreements are valued at cost. 7. In the event that price quotations or valuations are not readily available, are not reflective of market value, or a significant event has been recognized in relation to a security or class of securities, the securities are valued in good faith by the Committee in accordance with valuation procedures approved by the Board. The effect of fair value pricing is that securities may not be priced on the basis of quotations from the primary market in which they are traded and the actual price realized from the sale of a security may differ materially from the fair value price. Valuing these securities at fair value is intended to cause the Fund’s NAV to be more reliable than it otherwise would be.

Notes to Portfolio of Investments | 16
Fair value methods used by the Manager include, but are not limited to, obtaining market quotations from secondary pricing services, broker-dealers, other pricing services, or widely used quotation systems. General factors considered in determining the fair value of securities include fundamental analytical data, the nature and duration of any restrictions on disposition of the securities, evaluation of credit quality, and an evaluation of the forces that influenced the market in which the securities are purchased and sold. B. Fair value measurements – Fair value is defined as the price that would be received to sell an asset or paid to transfer a liability in an orderly transaction between market participants at the measurement date. The three-level valuation hierarchy disclosed in the Portfolio of Investments is based upon the transparency of inputs to the valuation of an asset or liability as of the measurement date. The three levels are defined as follows: Level 1 – inputs to the valuation methodology are quoted prices (unadjusted) in active markets for identical securities. Level 2 – inputs to the valuation methodology are other significant observable inputs, including quoted prices for similar securities, inputs that are observable for the securities, either directly or indirectly, and market-corroborated inputs such as market indexes. Level 3 – inputs to the valuation methodology are unobservable and significant to the fair value measurement, including the Manager’s own assumptions in determining the fair value. The inputs or methodologies used for valuing securities are not necessarily an indication of the risks associated with investing in those securities. C. Securities lending - The Fund, through its securities lending agreement with Citibank, N.A. (Citibank), may lend its securities to qualified financial institutions, such as certain broker-dealers, to earn additional income. The borrowers are required to secure their loans continuously with collateral in an amount at least equal to 102% of the fair value of domestic securities and foreign government securities loaned and 105% of the fair value of foreign securities and all other securities loaned. Collateral may be cash, U.S. government securities, or other securities as permitted by SEC guidelines. Cash collateral is invested in high-quality short-term investments. Collateral requirements are determined daily based on the prior business day’s ending value of securities loaned. Risks to the Fund in securities-lending transactions are that the borrower may not provide additional collateral when required or return the securities when due, and that the value of the short-term investments will be less than the amount of cash collateral required to be returned to the borrower. The Fund's agreement with Citibank does not include master netting provisions. Non-cash collateral received by the Fund may not be sold or re-pledged except to satisfy borrower default. Cash collateral is listed in the Fund’s Portfolio of Investments while non-cash collateral is not included.

17 | USAA S&P 500 Index Fund
D. Derivative instruments and hedging activities – The Fund may buy, sell, and enter into certain types of derivatives, including, but not limited to, futures contracts, options, and options on futures contracts, under circumstances in which such instruments are expected by the portfolio manager to aid in achieving the Fund’s investment objective. The Fund also may use derivatives in circumstances where the portfolio manager believes they offer an economical means of gaining exposure to a particular asset class or securities market or to keep cash on hand to meet shareholder redemptions or other needs while maintaining exposure to the market. With exchange-listed futures contracts and options, counterparty credit risk to the Fund is limited to the exchange's clearinghouse which, as counterparty to all exchange-traded futures contracts and options, guarantees the transactions against default from the actual counterparty to the transaction. The Fund’s derivative agreements held at September 30, 2017, did not include master netting provisions. Futures contracts – The Fund is subject to cash flow and tracking error risk in the normal course of pursuing its investment objectives. The Fund may use stock index futures contracts in an attempt to reduce any performance discrepancies between the Fund and the S&P 500 Index. A futures contract represents a commitment for the future purchase or sale of an asset at a specified price on a specified date. Upon entering into such contracts, the Fund is required to deposit with the broker in either cash or securities an initial margin in an amount equal to a certain percentage of the contract amount. Subsequent payments (variation margin) are made or received by the Fund each day, depending on the daily fluctuations in the value of the contract, and are recorded for financial statement purposes as unrealized gains or losses. When the contract is closed, the Fund records a realized gain or loss equal to the difference between the value of the contract at the time it was opened and the value at the time it was closed. Upon entering into such contracts, the Fund bears the risk of interest or exchange rates or securities prices moving unexpectedly in an unfavorable direction, in which case, the Fund may not achieve the anticipated benefits of the futures contracts. E. As of September 30, 2017, the cost of securities, for federal income tax purposes, was approximately the same as the cost reported in the Portfolio of Investments. Gross unrealized appreciation and depreciation of investments as of September 30, 2017, were $3,439,959,000 and $91,240,000 respectively, resulting in net unrealized appreciation of $3,348,719,000. F. The Portfolio of Investments category percentages shown represent the percentages of the investments to net assets, which were $6,575,051,000 at September 30, 2017, and, in total, may not equal 100%. A category percentage of 0.0% represents less than 0.1% of net assets. G. Upcoming Regulatory Matters – In October 2016, the U.S. Securities and Exchange Commission (SEC) issued Final Rule Release No. 33-10231, Investment Company Reporting Modernization. In part, the rules require the filing of new forms N-PORT and N-CEN, and amend Regulation S-X to require standardized, enhanced disclosure about derivatives in investment company financial statements, as well as other amendments.
Notes to Portfolio of Investments | 18
In October 2016, the SEC issued Final Rule Release No. 33-10233, Investment Company Liquidity Risk Management Programs. This rule requires funds to establish a liquidity risk management program and enhances disclosures regarding funds' liquidity. In October 2016, the SEC issued Final Rule Release No. 33-10234, Investment Company Swing Pricing. This rule permits certain funds to use swing pricing during periods of heavy redemptions and requires certain disclosures regarding the use of swing pricing in forms filed with the SEC. The Manager continues to evaluate the impact these rules will have on the financial statements and other disclosures. The compliance date for forms N-PORT and N-CEN is June 1, 2018, with other staggered compliance dates extending through December 2018. The Fund is expected to comply with the June 1, 2018 compliance date for new forms N-PORT and N-CEN.
PORTFOLIO ABBREVIATIONS AND DESCRIPTIONS REIT Real estate investment trust - Dividend distributions from REITs may be recorded as
income and later characterized by the REIT at the end of the fiscal year as capital gains or a return of capital. Thus, the fund will estimate the components of distributions from these securities and revise when actual distributions are known.
SPECIFIC NOTES (a) Rate represents the money market fund annualized seven-day yield at September 30, 2017.
(b) Rate represents an annualized yield at time of purchase, not a coupon rate.
(c) Northern Trust Corp. is the parent to Northern Trust Investments, Inc. (NTI), which is the subadviser of the Fund.
(d) NTI is both the subadviser of the Fund and the adviser of the Northern Institutional Funds - Government Assets Portfolio.
(e) Security with a value of $12,908,000 is segregated as collateral for initial margin requirements on open futures contracts.
(f) Security, or a portion thereof, is segregated to cover the value of open futures contracts at September 30, 2017.
(g) The contract value of the futures purchased and/or sold as a percentage of net assets is 1.6%.
(h) The security, or a portion thereof, was out on loan as of September 30, 2017.
* Non-income-producing security.