portfolio review 4th quarter 2014
TRANSCRIPT
Wendy J. Dominguez, MBAJerry Huggins, MBA, CFP®
PORTFOLIO REVIEW4th Quarter 2014
Rick Rodgers, AIFA®
Prepared by: Josh Bond
—
———
—
—
——
——
—
—
——
————
—
—
—
—
—
—
—
—
—
—
—
—
—
*As of January 2015
Privileged and Confidential
2INTEGRITY. BALANCE. OBJECTIVITY.
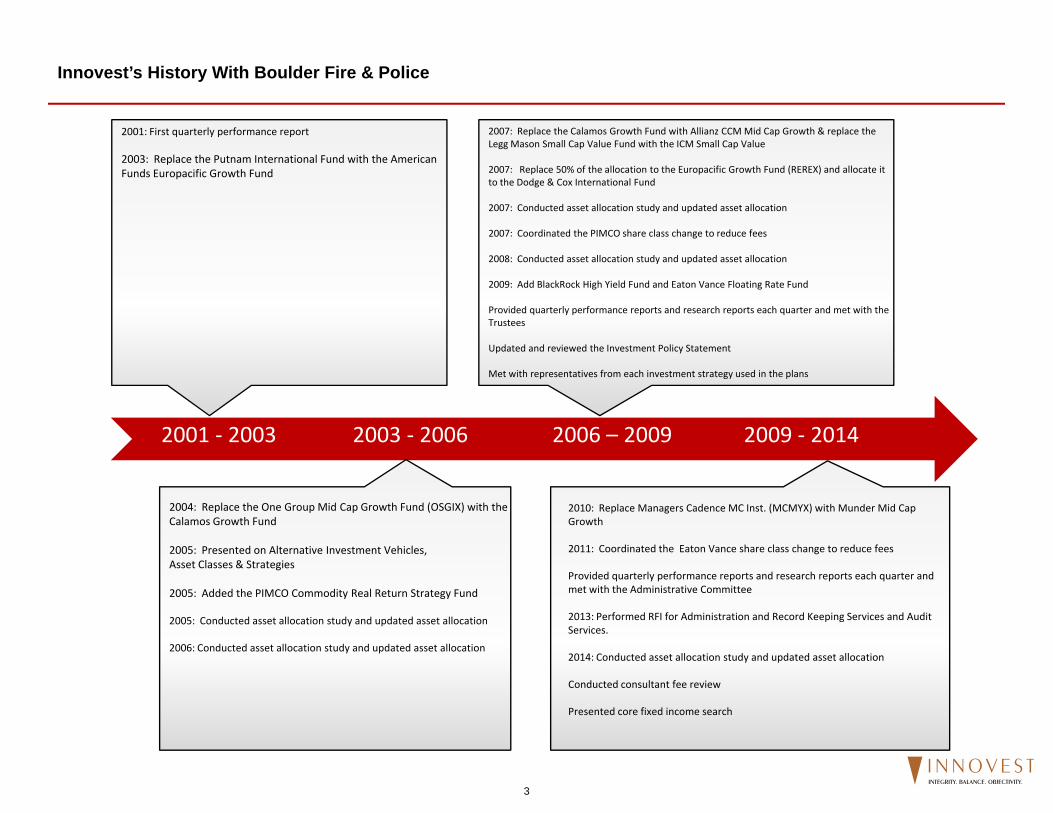
Innovest’s History With Boulder Fire & Police
2001: First quarterly performance report 2007: Replace the Calamos Growth Fund with Allianz CCM Mid Cap Growth & replace the Legg Mason Small Cap Value Fund with the ICM Small Cap Value
2003: Replace the Putnam International Fund with the American Funds Europacific Growth Fund 2007: Replace 50% of the allocation to the Europacific Growth Fund (REREX) and allocate it
to the Dodge & Cox International Fund
2007: Conducted asset allocation study and updated asset allocation
2007: Coordinated the PIMCO share class change to reduce fees
2008: Conducted asset allocation study and updated asset allocation
2009: Add BlackRock High Yield Fund and Eaton Vance Floating Rate Fund
Provided quarterly performance reports and research reports each quarter and met with the Trustees
Updated and reviewed the Investment Policy Statement
2001 ‐ 2003
Met with representatives from each investment strategy used in the plans
2003 ‐ 2006 2006 – 2009 2009 ‐ 2014
2004: Replace the One Group Mid Cap Growth Fund (OSGIX) with the Calamos Growth Fund
2005: Presented on Alternative Investment Vehicles,A Cl & S i
2010: Replace Managers Cadence MC Inst. (MCMYX) with Munder Mid Cap Growth
2011: Coordinated the Eaton Vance share class change to reduce feesAsset Classes & Strategies
2005: Added the PIMCO Commodity Real Return Strategy Fund
2005: Conducted asset allocation study and updated asset allocation
2006: Conducted asset allocation study and updated asset allocation
Provided quarterly performance reports and research reports each quarter and met with the Administrative Committee
2013: Performed RFI for Administration and Record Keeping Services and Audit Services.
2014: Conducted asset allocation study and updated asset allocation
Conducted consultant fee review
Presented core fixed income search
3INTEGRITY. BALANCE. OBJECTIVITY.

Performance Over Time
Risk and Return (Since Inception) Asset Allocation
Cumulative Performance over Time
Change in Account ValueMarket Value
As of10/01/2014
Market ValueAs of
12/31/2014Change
$
Boulder F & P Total Fund 121,276,831 124,267,664 2,990,833
LastQuarter
YearTo Date
1Year
3Years
5Years
7Years
SinceInception
InceptionDate
Boulder F & P Total Fund 2.56 5.50 5.50 12.18 10.16 5.98 8.72 07/01/1990Boulder F & P Custom BM 1.54 5.38 5.38 12.38 10.03 5.29 8.28Difference 1.02 0.12 0.12 -0.20 0.13 0.69 0.44
$0 $12,389,241 $24,778,482 $37,167,723 $49,556,964 $61,946,205
VT Retirement Income Advantage
JPMorgan High Yield Select
PIMCO Total Return; Inst
PIMCO Commodity Real Return
Victory Munder Mid Cap Core Growth
Eaton Vance Floating Rate; I
ICM Small Company
Vantage Trust Plus
Dodge & Cox Int'l
American Funds EuroPacific Gr
Boston Trust Fixed Income - Boulder F&P
Boston Trust Equity - Boulder F&P
$771,943
$2,257,480
$4,586,674
$4,782,424
$7,697,806
$7,905,261
$7,908,651
$8,032,773
$10,203,183
$10,522,108
$12,329,305
$47,270,058
8.7
9.0
9.3
9.6
9.9
Ret
urn
(%)
10.0 11.0 12.0 13.0 14.0 15.0 16.0 17.0Risk (Standard Deviation %)
S&P 500 Index
Boulder F & P Total Fund
Boulder F & P Total Fund Boulder F & P Custom BM
-250 %
0%
250%
500%
750%
1,000%
9/90 12/91 3/93 6/94 9/95 12/96 3/98 6/99 9/00 12/01 3/03 6/04 9/05 12/06 3/08 6/09 9/10 12/11 3/13 12/14
Executive SummaryDecember 31, 2014
4INTEGRITY. BALANCE. OBJECTIVITY.

December 31, 2014
20 00%
THE MARKETS
Investment Returns 2014
15.00%
20.00%S&P 500
Russell 2000Year 4Q14
13.69%
10.00%
MSCI EAFE
MSCI EM
Barclays US Agg Bond
13.69% 4.93%
4.89%5.97%
5.00%
y gg
9.73%
5.97% 1.79%
4.89%
-4.90%
-2.19%
-5.00%
0.00%
-2.19% -3.57%
-4.90% -4.50%
-10.00%
% %
-15.00%1st Quarter 2nd Quarter 3rd Quarter 4th Quarter
5INTEGRITY. BALANCE. OBJECTIVITY.

December 31, 2014
CONTINUED CONCERNS FOR THE GLOBAL ECONOMY• China’s economy slowed in 2014 to the lowest growth rate
Fourth Quarter 2014 Capital Markets: HEADWINDS
China’s Recent Slowdown is Noteworthy• China s economy slowed in 2014 to the lowest growth rate
since Q1 2009, despite an equity market rally.• The Eurozone economy worsened in Q4 2014, while the
European inflation rate approached 0% at year-end.• Japan’s economy contracted unexpectedly in Q3 by 1.6%
annualized, as the country slipped into recession.• Weak demographic trends remain a headwind for the
Eurozone, Japan, Russia and China.
THE QUANDARY OF MONETARY STIMULUS Diverging Monetary Policy in 2014
Sources: J.P. Morgan and China National Bureau of Statistics. December 2014.
• Facing dire economic data, the European Central Bank is forced to reconsider quantitative easing.
• After massive stimulus measures, the Bank of Japan is left with fewer policy options in 2015.
• The U S Federal Reserve will consider raising short-termThe U.S. Federal Reserve will consider raising short term interest rates in 2015.
• Is bad news good news yet again for financial markets? Predicting the impact of future government policy is difficult.
6INTEGRITY. BALANCE. OBJECTIVITY.
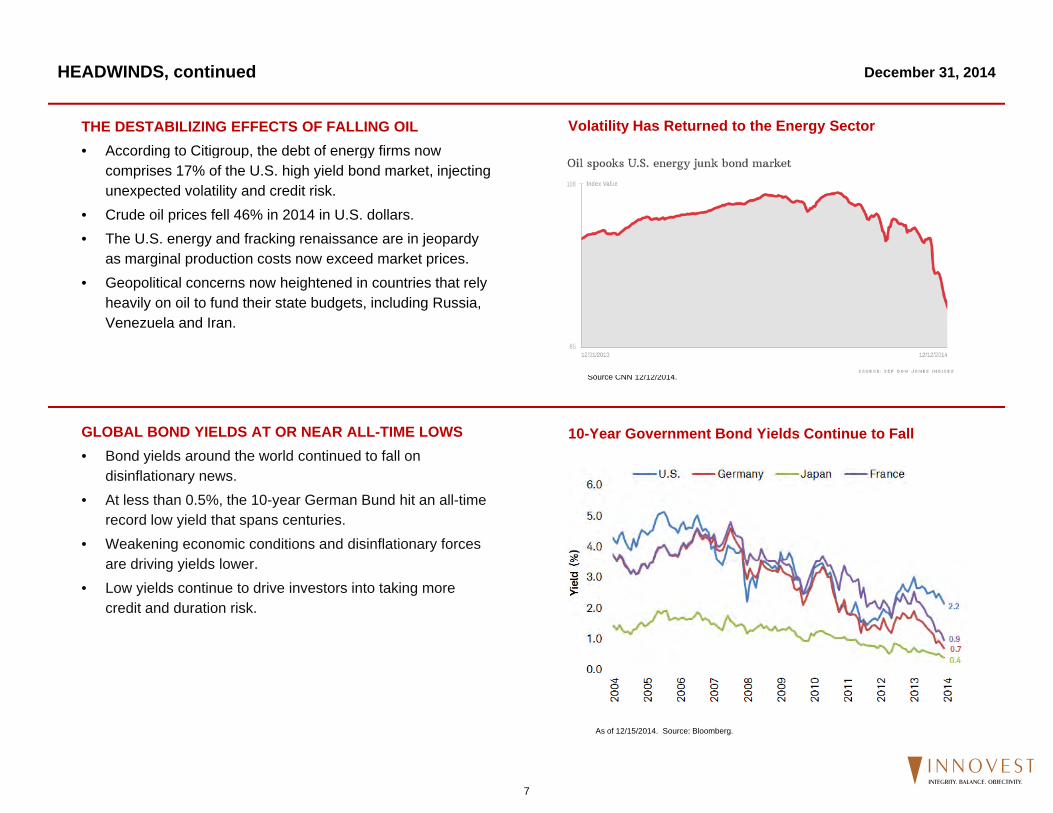
December 31, 2014HEADWINDS, continued
THE DESTABILIZING EFFECTS OF FALLING OIL• According to Citigroup the debt of energy firms now
Volatility Has Returned to the Energy Sector• According to Citigroup, the debt of energy firms now
comprises 17% of the U.S. high yield bond market, injecting unexpected volatility and credit risk.
• Crude oil prices fell 46% in 2014 in U.S. dollars.• The U.S. energy and fracking renaissance are in jeopardy
as marginal production costs now exceed market prices. • Geopolitical concerns now heightened in countries that rely
heavily on oil to fund their state budgets, including Russia, Venezuela and Iran.
GLOBAL BOND YIELDS AT OR NEAR ALL-TIME LOWS• Bond yields around the world continued to fall on
10-Year Government Bond Yields Continue to Fall
Source CNN 12/12/2014.
Bond yields around the world continued to fall on disinflationary news.
• At less than 0.5%, the 10-year German Bund hit an all-time record low yield that spans centuries.
• Weakening economic conditions and disinflationary forces d i i i ld lare driving yields lower.
• Low yields continue to drive investors into taking more credit and duration risk.
As of 12/15/2014. Source: Bloomberg.
7INTEGRITY. BALANCE. OBJECTIVITY.

December 31, 2014
A LONE BRIGHT SPOT: U.S. CONDITIONS IMPROVE• U S consumer confidence reached its highest level in
Fourth Quarter 2014 Capital Markets: TAILWINDS
U.S. Economic Confidence Index Highest Since 2007
• U.S. consumer confidence reached its highest level in seven years at year end.
• Revised U.S. GDP growth hit 5.0% in Q3, the fastest pace since 2003.
• Real personal consumption is up 2.8% in the last year, reflecting rising incomes.
• Unemployment is now at its lowest level since 2008.• The health of U.S. corporations remains very strong.
U.S. HOUSEHOLDS IN BETTER FINANCIAL SHAPE Massive Cost Savings for the Average FamilyU.S. HOUSEHOLDS IN BETTER FINANCIAL SHAPE• U.S. gasoline prices hit six-year lows, with the average
household expected to save $700 annually.• U.S. household debt service is at 9.9% of disposable
income, the lowest since the Fed began measuring in 1980
Massive Cost Savings for the Average Family
1980.• Improving trends in wage growth and employment
continued in 2014.• A rising U.S. dollar has improved consumer buying
power for foreign goods.
Sources: U.S. EIA as of 12/16/2014.
8INTEGRITY. BALANCE. OBJECTIVITY.

December 31, 2014TAILWINDS, continued
CONSUMER SPENDING REMAINS POSITIVEM th t thi d f th U S i d i b
Real U.S. Personal Consumption Still Rising
• More than two-thirds of the U.S. economy is driven by consumer spending.
• According to ShopperTrak and Bloomberg, 2014 U.S. holiday sales grew at the fastest pace since 2005.
• Improving labor market and consumer confidence have been a tailwind for consumer spending.
• 2014 U.S. vehicle sales hit their highest number since 2006.
COMPELLING NON-US EQUITY VALUATIONSE i k t iti i tt ti l i d l ith
International Stock Markets Remain Cheap• Emerging market equities remain attractively priced, along with
a superior growth and debt profile.• Developed international stock markets in Europe and Japan
have lagged the U.S. significantly coming out of the recession.• With dramatic sell-off in energy, new opportunities exist in
commodities and MLPs.
MSCI trailing price-to-book ratios as of 11/28/2014. Sources: Barclays and FactSet.
9INTEGRITY. BALANCE. OBJECTIVITY.
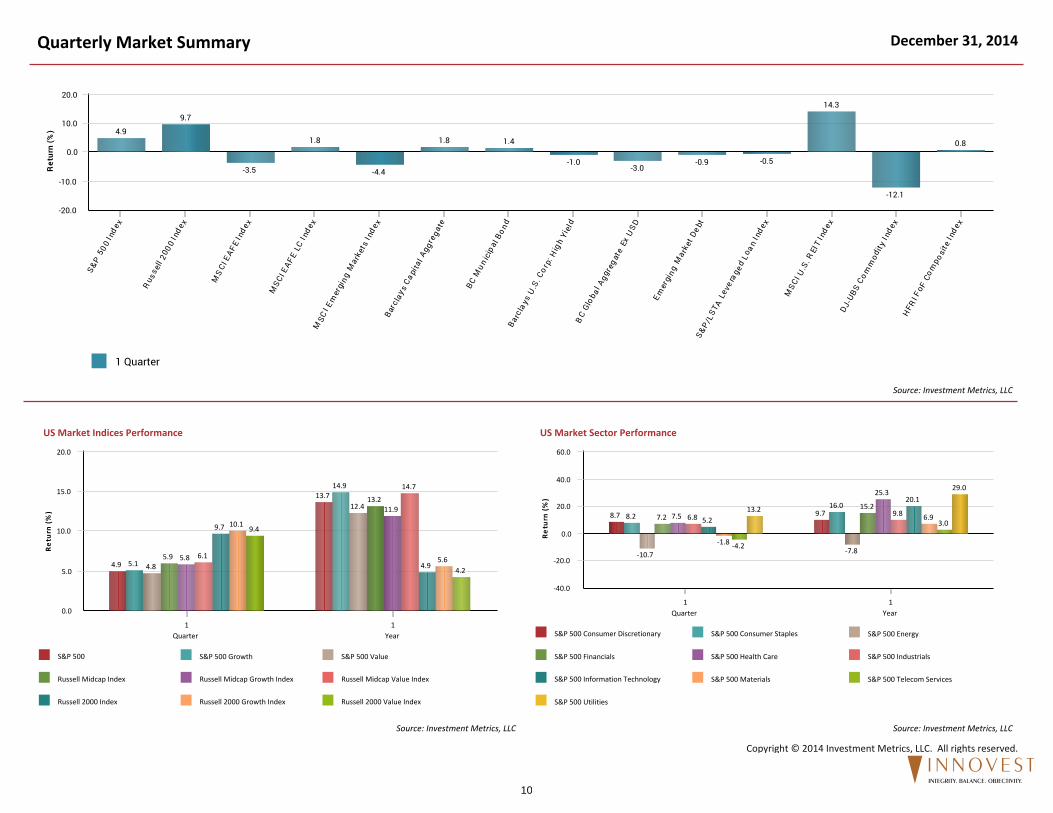
US Market Indices Performance US Market Sector Performance
Source: Investment Metrics, LLC
Source: Investment Metrics, LLCSource: Investment Metrics, LLC
1 Quarter
0.0
10.0
20.0
-10.0
-20.0
Re
turn
(%)
S&
P 5 0
0
I nd
e x
Ru s
s ell
2
0 00
I n
de x
MS
CI
E
AF
E
I nd
e x
MS
CI
E
AF
E LC
I nd
e xM
SC
I
Em
ergi
ng
Ma rk
ets
I n
de x
Bar
c lay s
Ca
pita
l
Ag g
r eg
a te
BC
Mu
nic
ipa l
B
on
dB
a rcla
ys U
.S.
C
or p
:
Hig
h
Yi e
ldB
C G
lob a
l
Ag
g r eg
ate
Ex U
SD
Em
ergi
ng
Ma rk
et D
ebt
S&
P/L
STA
Leve
rag e
d
Lo a
n
I nd
e x
MS
CI
U
.S.
R
EIT
I n
de x
DJ -U
BS
Co
mm
od it
y
I nd
e x
HFR
I
Fo F
Co
mpo
sit e
I nd
e x
4.9
9.7
-3.5
1.8
-4.4
1.8 1.4
-1.0-3.0
-0.9 -0.5
14.3
-12.1
0.8
S&P 500 Consumer Discretionary S&P 500 Consumer Staples S&P 500 Energy
S&P 500 Financials S&P 500 Health Care S&P 500 Industrials
S&P 500 Information Technology S&P 500 Materials S&P 500 Telecom Services
S&P 500 Utilities
0.0
20.0
40.0
60.0
-20.0
-40.0
Re
turn
(%)
1
Quarter
1
Year
13.2
29.0
-4.2
3.0
-1.8
6.95.2
20.1
6.8 9.87.5
25.3
7.2
15.2
-10.7 -7.8
8.2
16.08.7 9.7
S&P 500 S&P 500 Growth S&P 500 Value
Russell Midcap Index Russell Midcap Growth Index Russell Midcap Value Index
Russell 2000 Index Russell 2000 Growth Index Russell 2000 Value Index
0.0
5.0
10.0
15.0
20.0
Re
turn
(%)
1
Quarter
1
Year
9.4
4.2
10.1
5.6
9.7
4.96.1
14.7
5.8
11.9
5.9
13.2
4.8
12.4
5.1
14.9
4.9
13.7
Quarterly Market Summary December 31, 2014
Copyright © 2014 Investment Metrics, LLC. All rights reserved.
10INTEGRITY. BALANCE. OBJECTIVITY.

Intl Equity Region PerformanceIntl Equity Indices Performance
Fixed Income Market Sector Performance
Source: Investment Metrics, LLC
Source: Investment Metrics, LLCSource: Investment Metrics, LLC
Barclays U.S. Aggregate Barclays U.S. Treasury Barclays U.S. Agency Barclays U.S. Credit Index Barclays U.S. MBS
Barclays U.S. ABS Barclays U.S. Corp: High Yield Barclays Global Aggregate JPM EMBI Global (USD)
0.0
4.0
8.0
12.0
-4.0
Re
turn
(%)
1
Quarter
1
Year
-1.6
5.5
-1.0
0.6
-1.0
2.5
0.5
1.91.8
6.1
1.8
7.5
1.2
3.6
1.9
5.1
1.8
6.0
MSCI Japan MSCI Pacific ex Japan MSCI United Kingdom MSCI Europe ex U.K.
-8.0
-6.0
-4.0
-2.0
0.0
Re
turn
(%)
1
Quarter
1
Year
-4.3
-5.8
-4.2
-5.4
-1.5
-0.3
-2.4
-3.7
MSCI EAFE Index MSCI EAFE Small Cap MSCI EAFE Growth Index
MSCI EAFE Value MSCI Emerging Markets
-8.0
-6.0
-4.0
-2.0
0.0
Re
turn
(%)
1
Quarter
1
Year
-4.4
-1.8
-4.8 -4.9
-2.3
-4.1
-2.2
-4.6
-3.5
-4.5
Quarterly Market Summary December 31, 2014
Copyright © 2014 Investment Metrics, LLC. All rights reserved.
11INTEGRITY. BALANCE. OBJECTIVITY.

Alternative Asset Class Returns December 31, 2014
Source: Christenson Investment Parnters Source: Christenson Investment Parnters
Source: Christenson Investment Parnters Source: Standard & Poors
19.7 19.0
10.4
‐2.2 ‐2.3
‐8.8
‐0.8
‐13.9
‐5.4 ‐5.9 ‐6.4 ‐7.6
0.4
‐11.7‐15.8
‐12.1
‐30.2 ‐32.5‐38.6 ‐40.5
‐50.0
‐40.0
‐30.0
‐20.0
‐10.0
0.0
10.0
20.0
30.0
Corn
Whe
at
Soybeans
Soybean Oil
Gold
Silver
Cattle
Hogs
Zinc
Copp
er
Alum
inum
Nickel
Cotton
Sugar
Coffe
e
Bloo
mbe
rg Com
m Inde
x
Heatin
g Oil
Natural Gas
Gasoline
Crud
e Oil
Commodity Sector Returns
16.7
‐3.9 ‐5.3 ‐6.2
‐12.0 ‐12.1
‐36.6‐40.0
‐30.0
‐20.0
‐10.0
0.0
10.0
20.0
Grains PreciousMetals
Livestock IndustrialMetals
Softs BloombergComm Index
Energy
Commodity Broad Sector Returns
11.3
2.31.1 0.9 0.5 0.3 0.0
‐2.2 ‐2.3 ‐2.5 ‐3.0‐6.0‐4.0‐2.00.02.04.06.08.010.012.014.0
Managed
Futures
Long/Sho
rt Equ
ity
Multi‐Strategy
HFRI FoF
Com
posite
Globa
l Macro
Equity M
arket N
eutral
Fixed Income Arbitrage
Even
t Driv
en
Distressed
Dedicated Short B
ias
Convertib
le Arbitrage
Hedge Fund Strategy Returns
14.0
10.3 10.3
5.44.0
2.51.3
‐0.9 ‐1.1 ‐2.1‐4.0‐2.00.02.04.06.08.010.012.014.016.0
U.S.
Hon
g Ko
ng
S&P De
velope
d RE
IT
United Kingdo
m
Australia
Europe
Emerging
Markets
Singap
ore
Japa
n
Canada
Global REIT Country and Regional Returns
12INTEGRITY. BALANCE. OBJECTIVITY.

2005 2006 2007 2008 2009 2010 2011 2012 2013 2014
HighCommodities
21.36 %REITs 35.97 %
Commodities16.23 %
Fixed Income5.24 %
Int'l Stocks31.78 %
REITs 28.60 %
REITs 9.24 %
REITs 17.59 %
Small Cap Stocks38.82 %
REITs 31.78 %
REITs 8.26%
REITs 26.31%
REITs 13.82 %
Int'l Stocks26.34 %
Int'l Stocks11.17 %
Hedge Funds‐21.37 %
REITs 28.60 %
Small Cap Stocks26.85 %
Fixed Income7.84 %
Int'l Stocks17.32 %
Large Cap Stocks32.38 %
Large Cap Stocks13.69 %
Small Cap Stocks7.77%
Small Cap Stocks19.67%
Int'l Stocks13.54 %
Small Cap Stocks18.37 %
Hedge Funds10.25 %
Diversifed Portfolio‐24.23%
Small Cap Stocks27.17 %
Commodi es16.83 %
Large Cap Stocks2.11 %
Small Cap Stocks16.35 %
Int'l Stocks22.78%
Fixed Income5.97 %
Large Cap Stocks7.67%
Int'l Stocks18.08%
Hedge Funds7.49 %
Large Cap Stocks15.79 %
Fixed Income6.97 %
Small Cap Stocks‐33.79 %
Large Cap Stocks26.46 %
Large Cap Stocks15.06 %
Diversified Portfolio‐0.50%
Large Cap Stocks16.00 %
Diversified Portfolio14.79%
Small Cap Stocks4.89 %
Diversified Portfolio5.70%
Commodities18.07%
Diversified Portfolio7.01 %
Diversified Portfolio13.25 %
Diversified Portfolio6.64 %
Commodities‐35.65 %
Diversified Portfolio19.48%
Diversified Portfolio12.25%
Small Cap Stocks‐4.18 %
Diversified Portfolio10.27%
Hedge Funds8.81 %
Diversified Portfolio5.44%
Fixed Income4.71%
Large Cap Stocks14.61%
Large Cap Stocks4.91 %
Hedge Funds10.39 %
Large Cap Stocks5.49 %
Large Cap Stocks‐37.00 %
Commodi es18.91 %
Int'l Stocks7.75 %
Hedge Funds‐5.72 %
Hedge Funds5.28 %
REITs 1.86 %
Hedge Funds3.19%
Int'l Stocks4.43%
Diversified Portfolio9.48%
Small Cap Stocks4.55 %
Fixed Income4.34 %
Small Cap Stocks‐1.57 %
REITs ‐39.20 %
Hedge Funds11.47 %
Fixed Income6.54 %
Int'l Stocks‐12.14 %
Fixed Income4.21 %
Fixed Income‐2.02 %
Int'l Stocks‐4.90%
Hedge Funds 3.02%
Hedge Funds5.49%
LowFixed Income
2.43 %Commodi es
2.07 %REITs
‐17.55 %Int'l Stocks‐43.38 %
Fixed Income5.93 %
Hedge Funds5.70 %
Commodities‐13.32 %
Commodities‐1.06 %
Commodi es‐9.53 %
Commodi es‐17.01 %
Commodities ‐1.86%
Fixed Income3.21%
Indices Used: Large Cap Stocks (S&P 500), Small Cap Stock (Russell 2000) Int'l Stocks (MSCI EAFE), Fixed Income (Barclays Aggregate), REITs (DJ‐Wilshire REIT)Hedge Funds (HFRI Fund of Funds Composite), Commodities (DJ‐UBS Commodity)Diversified Portfolio: 25% S&P 500, 10% Russell 2000, 12% MSCI EAFE, 25% BC Aggregate Bond, 5% DJ‐UBS Commodity, 5% DJ‐Wilshire REIT, 20% HFRI Fund of Funds Composite
Periodic Table of Returns 2005 ‐ 2014
Avg Annual Returns '05‐'14
Avg Annual Risk
'05‐'14
13INTEGRITY. BALANCE. OBJECTIVITY.
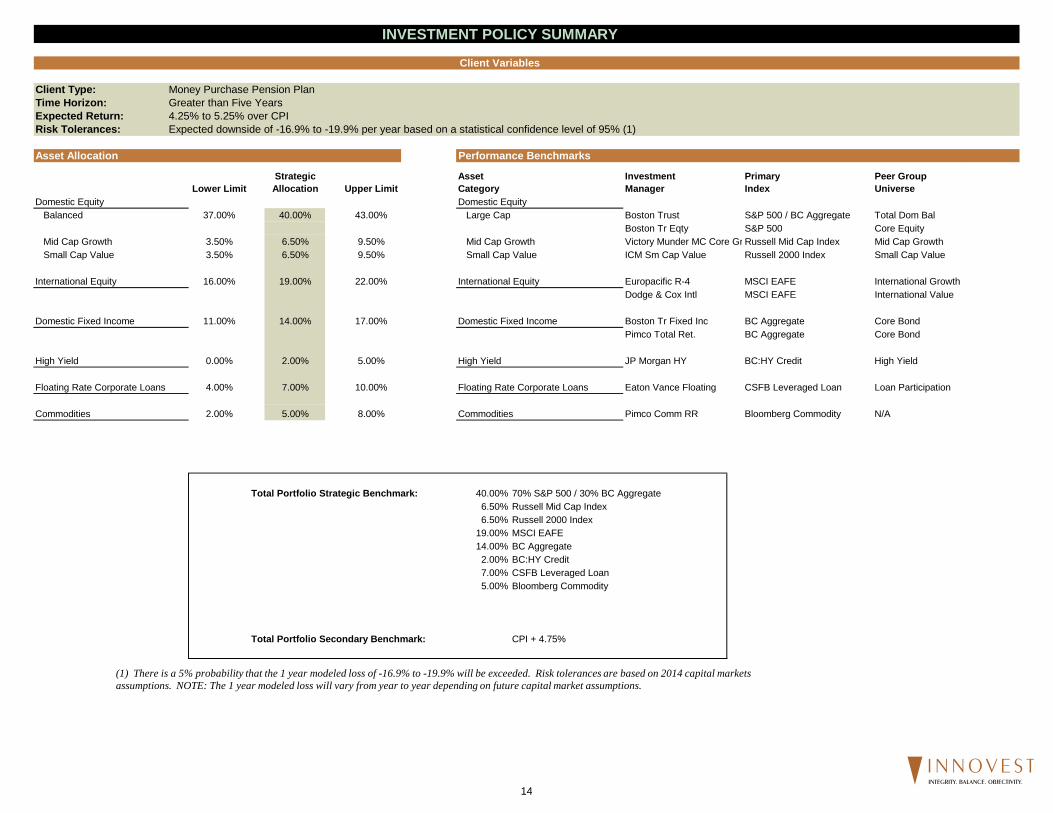
Client Type: Money Purchase Pension PlanTime Horizon: Greater than Five YearsExpected Return: 4.25% to 5.25% over CPIRisk Tolerances: Expected downside of -16.9% to -19.9% per year based on a statistical confidence level of 95% (1)
Asset Allocation Performance Benchmarks
Strategic Asset Investment Primary Peer GroupLower Limit Allocation Upper Limit Category Manager Index Universe
Domestic Equity Domestic Equity Balanced 37.00% 40.00% 43.00% Large Cap Boston Trust S&P 500 / BC Aggregate Total Dom Bal
Boston Tr Eqty S&P 500 Core Equity Mid Cap Growth 3.50% 6.50% 9.50% Mid Cap Growth Victory Munder MC Core Gr Russell Mid Cap Index Mid Cap Growth Small Cap Value 3.50% 6.50% 9.50% Small Cap Value ICM Sm Cap Value Russell 2000 Index Small Cap Value
International Equity 16.00% 19.00% 22.00% International Equity Europacific R-4 MSCI EAFE International GrowthDodge & Cox Intl MSCI EAFE International Value
Domestic Fixed Income 11.00% 14.00% 17.00% Domestic Fixed Income Boston Tr Fixed Inc BC Aggregate Core BondPimco Total Ret. BC Aggregate Core Bond
High Yield 0.00% 2.00% 5.00% High Yield JP Morgan HY BC:HY Credit High Yield
Floating Rate Corporate Loans 4.00% 7.00% 10.00% Floating Rate Corporate Loans Eaton Vance Floating CSFB Leveraged Loan Loan Participation
INVESTMENT POLICY SUMMARY
Client Variables
Commodities 2.00% 5.00% 8.00% Commodities Pimco Comm RR Bloomberg Commodity N/A
Total Portfolio Strategic Benchmark: 40.00% 70% S&P 500 / 30% BC Aggregate6.50% Russell Mid Cap Index 6.50% Russell 2000 Index
19.00% MSCI EAFE14.00% BC Aggregate2.00% BC:HY Credit 7.00% CSFB Leveraged Loan5.00% Bloomberg Commodity
Total Portfolio Secondary Benchmark: CPI + 4.75%
(1) There is a 5% probability that the 1 year modeled loss of -16.9% to -19.9% will be exceeded. Risk tolerances are based on 2014 capital markets assumptions. NOTE: The 1 year modeled loss will vary from year to year depending on future capital market assumptions.
14INTEGRITY. BALANCE. OBJECTIVITY.

Boulder Fire & PoliceAverage plan assets $112,249,407Estimated Investment, Recordkeeping and Administrative Costs 0.59%Estimated Total Plan Expenses 0.70%
Weighted average (bps)
Employer Paid Employee Paid TotalAsset based fee retained by funds 51 -$ 570,802$ 570,802$ Revenue sharing paid to plan provider 13 -$ 150,707$ 150,707$ Per participant fee 0 -$ -$ -$ Administration/Recordkeeping fee 0 -$ -$ -$ Custodial/Trust fees 0 -$ -$ -$ Direct participant paid fees
Loan origination 0 -$ -$ -$ Loan maintenance 0 -$ -$ -$ QDRO 0 -$ -$ -$ Miscellaneous 0 -$ -$ -$
Rebate to plan -5 -$ (55,295)$ (55,295)$
Total Investment, Recordkeeping and Administrative Costs 59 -$ 666,214$ 666,214$
Third party plan paid feesInvestment Consultant 7 37,360$ 37,360$ 74,719$
Operating BudgetAudit 1 9,000$ -$ 9,000$ Trustee Education 1 10,500$ -$ 10,500$ Insurance 1 9,000$ -$ 9,000$ Miscellaneous Expenses 0 1,500$ -$ 1,500$ Legal 2 20,000$ -$ 20,000$
Total Plan Expenses 70 87,360$ 703,574$ 790,934$
Total Plan Expenses in Basis Points 8 63
Fee review reflects an estimate for the following time period: 1/1/2014 - 12/31/2014
Benchmarking: The plan's estimated investment, recordkeeping and administrative costs of 0.59% as shown above, compare favorably to 401(k) Source data, a universe of 84 similarly sized 401(k) plans with an average investment, recordkeeping and administrative cost of 1.19%
Dollars ($)
Total Plan Expenses
Annual Fee Review
15INTEGRITY. BALANCE. OBJECTIVITY.
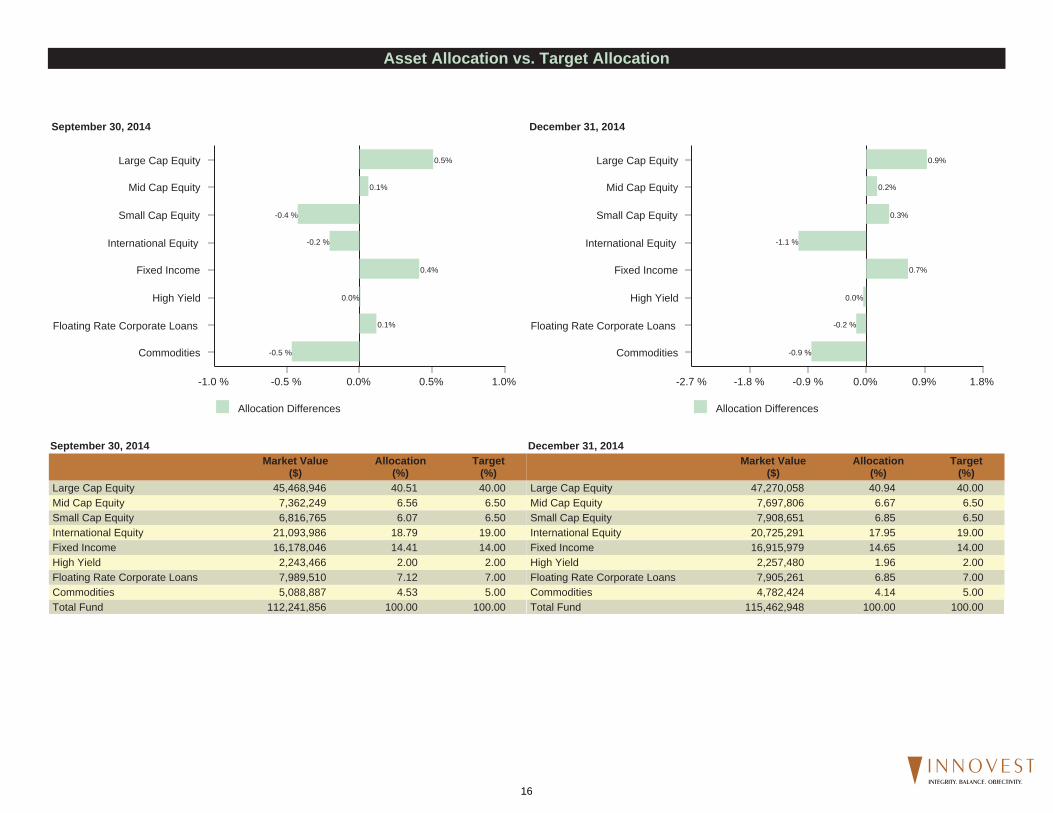
December 31, 2014
Allocation Differences
0.0% 0.9% 1.8%-0.9 %-1.8 %-2.7 %
Commodities
Floating Rate Corporate Loans
High Yield
Fixed Income
International Equity
Small Cap Equity
Mid Cap Equity
Large Cap Equity
-0.9 %
-0.2 %
0.0%
0.7%
-1.1 %
0.3%
0.2%
0.9%
September 30, 2014
Allocation Differences
0.0% 0.5% 1.0%-0.5 %-1.0 %
Commodities
Floating Rate Corporate Loans
High Yield
Fixed Income
International Equity
Small Cap Equity
Mid Cap Equity
Large Cap Equity
-0.5 %
0.1%
0.0%
0.4%
-0.2 %
-0.4 %
0.1%
0.5%
December 31, 2014Market Value
($)Allocation
(%)Target
(%)Large Cap Equity 47,270,058 40.94 40.00Mid Cap Equity 7,697,806 6.67 6.50Small Cap Equity 7,908,651 6.85 6.50International Equity 20,725,291 17.95 19.00Fixed Income 16,915,979 14.65 14.00High Yield 2,257,480 1.96 2.00Floating Rate Corporate Loans 7,905,261 6.85 7.00Commodities 4,782,424 4.14 5.00Total Fund 115,462,948 100.00 100.00
September 30, 2014Market Value
($)Allocation
(%)Target
(%)Large Cap Equity 45,468,946 40.51 40.00Mid Cap Equity 7,362,249 6.56 6.50Small Cap Equity 6,816,765 6.07 6.50International Equity 21,093,986 18.79 19.00Fixed Income 16,178,046 14.41 14.00High Yield 2,243,466 2.00 2.00Floating Rate Corporate Loans 7,989,510 7.12 7.00Commodities 5,088,887 4.53 5.00Total Fund 112,241,856 100.00 100.00
Asset Allocation vs. Target Allocation
16INTEGRITY. BALANCE. OBJECTIVITY.
Allocation
MarketValue
($)%
Performance(%)
LastQuarter
YearTo Date
1Year
3Years
5Years
10Years
SinceInnovestInception
SinceInception
InceptionDate
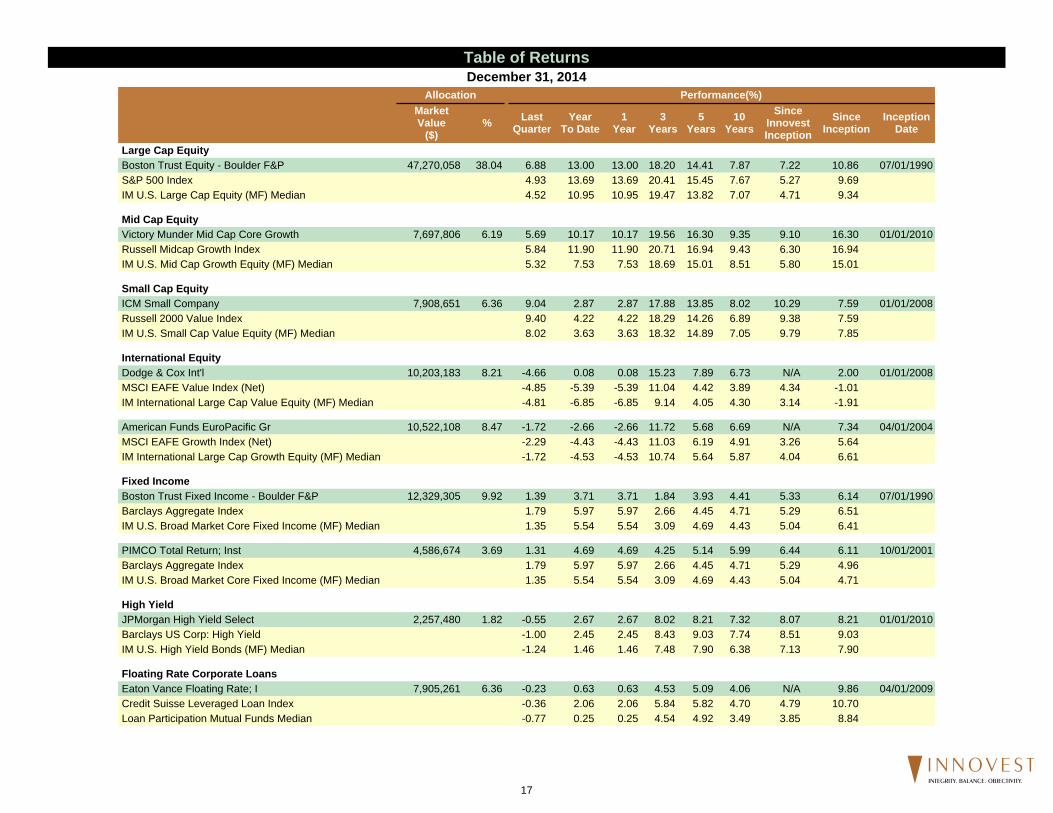
Large Cap Equity
Boston Trust Equity - Boulder F&P 47,270,058 38.04 6.88 13.00 13.00 18.20 14.41 7.87 7.22 10.86 07/01/1990S&P 500 Index 4.93 13.69 13.69 20.41 15.45 7.67 5.27 9.69IM U.S. Large Cap Equity (MF) Median 4.52 10.95 10.95 19.47 13.82 7.07 4.71 9.34
Mid Cap Equity
Victory Munder Mid Cap Core Growth 7,697,806 6.19 5.69 10.17 10.17 19.56 16.30 9.35 9.10 16.30 01/01/2010Russell Midcap Growth Index 5.84 11.90 11.90 20.71 16.94 9.43 6.30 16.94IM U.S. Mid Cap Growth Equity (MF) Median 5.32 7.53 7.53 18.69 15.01 8.51 5.80 15.01
Small Cap Equity
ICM Small Company 7,908,651 6.36 9.04 2.87 2.87 17.88 13.85 8.02 10.29 7.59 01/01/2008Russell 2000 Value Index 9.40 4.22 4.22 18.29 14.26 6.89 9.38 7.59IM U.S. Small Cap Value Equity (MF) Median 8.02 3.63 3.63 18.32 14.89 7.05 9.79 7.85
International Equity
Dodge & Cox Int'l 10,203,183 8.21 -4.66 0.08 0.08 15.23 7.89 6.73 N/A 2.00 01/01/2008MSCI EAFE Value Index (Net) -4.85 -5.39 -5.39 11.04 4.42 3.89 4.34 -1.01IM International Large Cap Value Equity (MF) Median -4.81 -6.85 -6.85 9.14 4.05 4.30 3.14 -1.91
American Funds EuroPacific Gr 10,522,108 8.47 -1.72 -2.66 -2.66 11.72 5.68 6.69 N/A 7.34 04/01/2004MSCI EAFE Growth Index (Net) -2.29 -4.43 -4.43 11.03 6.19 4.91 3.26 5.64IM International Large Cap Growth Equity (MF) Median -1.72 -4.53 -4.53 10.74 5.64 5.87 4.04 6.61
Fixed Income
Boston Trust Fixed Income - Boulder F&P 12,329,305 9.92 1.39 3.71 3.71 1.84 3.93 4.41 5.33 6.14 07/01/1990Barclays Aggregate Index 1.79 5.97 5.97 2.66 4.45 4.71 5.29 6.51IM U.S. Broad Market Core Fixed Income (MF) Median 1.35 5.54 5.54 3.09 4.69 4.43 5.04 6.41
PIMCO Total Return; Inst 4,586,674 3.69 1.31 4.69 4.69 4.25 5.14 5.99 6.44 6.11 10/01/2001Barclays Aggregate Index 1.79 5.97 5.97 2.66 4.45 4.71 5.29 4.96IM U.S. Broad Market Core Fixed Income (MF) Median 1.35 5.54 5.54 3.09 4.69 4.43 5.04 4.71
High Yield
JPMorgan High Yield Select 2,257,480 1.82 -0.55 2.67 2.67 8.02 8.21 7.32 8.07 8.21 01/01/2010Barclays US Corp: High Yield -1.00 2.45 2.45 8.43 9.03 7.74 8.51 9.03IM U.S. High Yield Bonds (MF) Median -1.24 1.46 1.46 7.48 7.90 6.38 7.13 7.90
Floating Rate Corporate Loans
Eaton Vance Floating Rate; I 7,905,261 6.36 -0.23 0.63 0.63 4.53 5.09 4.06 N/A 9.86 04/01/2009Credit Suisse Leveraged Loan Index -0.36 2.06 2.06 5.84 5.82 4.70 4.79 10.70Loan Participation Mutual Funds Median -0.77 0.25 0.25 4.54 4.92 3.49 3.85 8.84
Table of ReturnsDecember 31, 2014
17INTEGRITY. BALANCE. OBJECTIVITY.
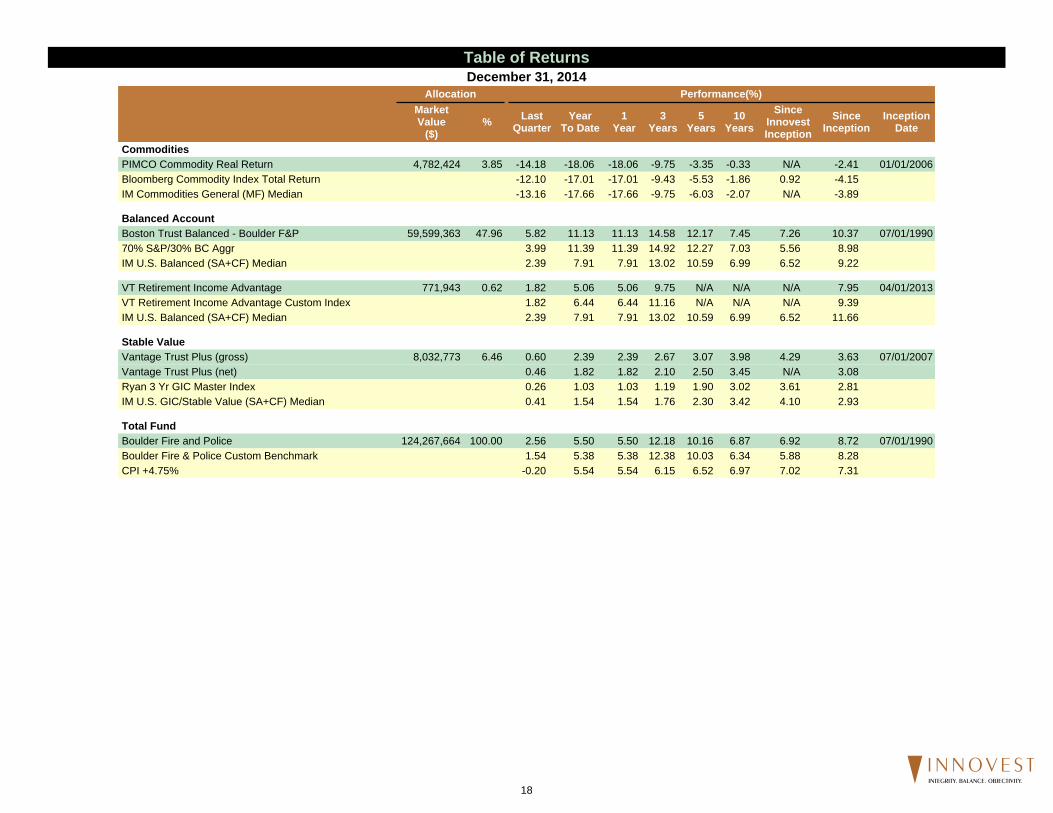
Table of ReturnsDecember 31, 2014
Allocation
MarketValue
($)%
Performance(%)
LastQuarter
YearTo Date
1Year
3Years
5Years
10Years
SinceInnovestInception
SinceInception
InceptionDate
Commodities
PIMCO Commodity Real Return 4,782,424 3.85 -14.18 -18.06 -18.06 -9.75 -3.35 -0.33 N/A -2.41 01/01/2006Bloomberg Commodity Index Total Return -12.10 -17.01 -17.01 -9.43 -5.53 -1.86 0.92 -4.15IM Commodities General (MF) Median -13.16 -17.66 -17.66 -9.75 -6.03 -2.07 N/A -3.89
Balanced Account
Boston Trust Balanced - Boulder F&P 59,599,363 47.96 5.82 11.13 11.13 14.58 12.17 7.45 7.26 10.37 07/01/199070% S&P/30% BC Aggr 3.99 11.39 11.39 14.92 12.27 7.03 5.56 8.98IM U.S. Balanced (SA+CF) Median 2.39 7.91 7.91 13.02 10.59 6.99 6.52 9.22
VT Retirement Income Advantage 771,943 0.62 1.82 5.06 5.06 9.75 N/A N/A N/A 7.95 04/01/2013VT Retirement Income Advantage Custom Index 1.82 6.44 6.44 11.16 N/A N/A N/A 9.39IM U.S. Balanced (SA+CF) Median 2.39 7.91 7.91 13.02 10.59 6.99 6.52 11.66
Stable Value
Vantage Trust Plus (gross) 8,032,773 6.46 0.60 2.39 2.39 2.67 3.07 3.98 4.29 3.63 07/01/2007Vantage Trust Plus (net) 0.46 1.82 1.82 2.10 2.50 3.45 N/A 3.08Ryan 3 Yr GIC Master Index 0.26 1.03 1.03 1.19 1.90 3.02 3.61 2.81IM U.S. GIC/Stable Value (SA+CF) Median 0.41 1.54 1.54 1.76 2.30 3.42 4.10 2.93
Total Fund
Boulder Fire and Police 124,267,664 100.00 2.56 5.50 5.50 12.18 10.16 6.87 6.92 8.72 07/01/1990Boulder Fire & Police Custom Benchmark 1.54 5.38 5.38 12.38 10.03 6.34 5.88 8.28CPI +4.75% -0.20 5.54 5.54 6.15 6.52 6.97 7.02 7.31
18INTEGRITY. BALANCE. OBJECTIVITY.
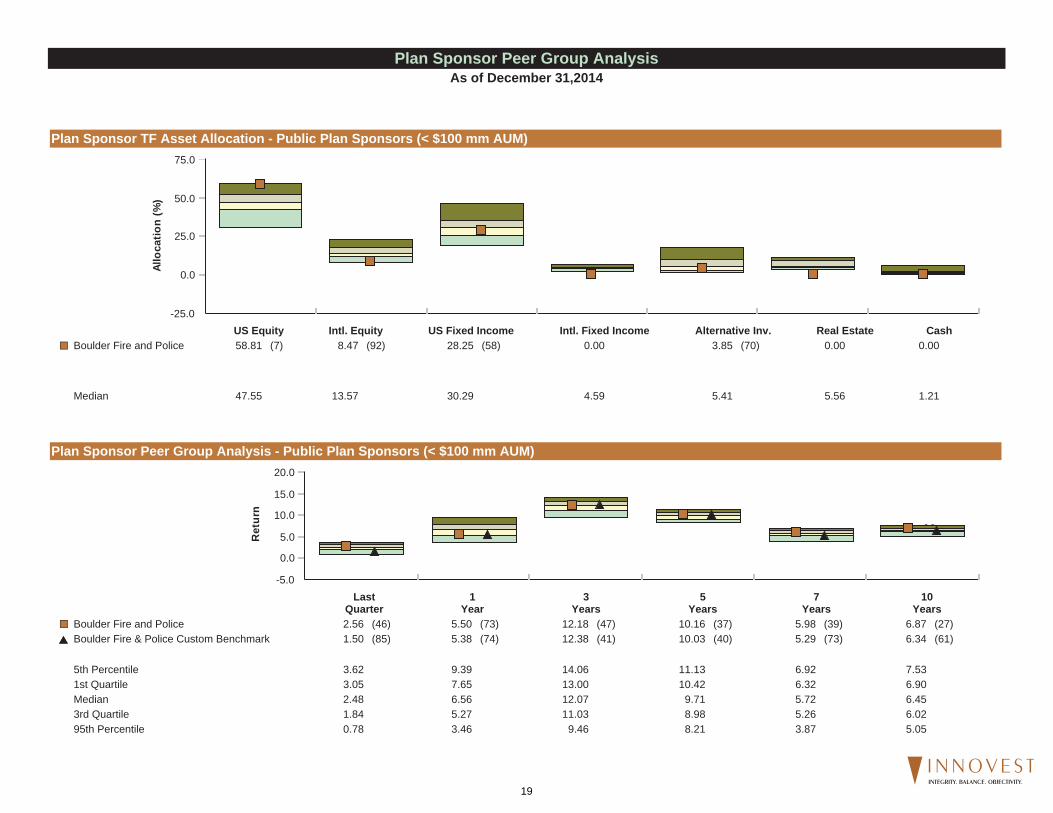
Plan Sponsor TF Asset Allocation - Public Plan Sponsors (< $100 mm AUM)
Plan Sponsor Peer Group Analysis - Public Plan Sponsors (< $100 mm AUM)
-25.0
0.0
25.0
50.0
75.0Al
loca
tion
(%)
US Equity Intl. Equity US Fixed Income Intl. Fixed Income Alternative Inv. Real Estate CashBoulder Fire and Police 58.81 (7) 8.47 (92) 28.25 (58) 0.00 3.85 (70) 0.00 0.00
5th Percentile 59.48 22.55 46.50 6.62 17.52 11.07 6.151st Quartile 52.19 17.30 35.91 4.94 10.15 9.05 2.20
Median 47.55 13.57 30.29 4.59 5.41 5.56 1.213rd Quartile 42.50 12.02 25.27 4.30 2.64 4.75 0.6795th Percentile 30.23 8.10 18.92 2.37 1.48 3.64 0.03
-5.0
0.0
5.0
10.0
15.0
20.0
Ret
urn
0.81.83.55.3
9.511.0
8.29.0
3.95.3 5.16.0
LastQuarter
1Year
3Years
5Years
7Years
10Years
Boulder Fire and Police 2.56 (46) 5.50 (73) 12.18 (47) 10.16 (37) 5.98 (39) 6.87 (27)
Boulder Fire & Police Custom Benchmark 1.50 (85) 5.38 (74) 12.38 (41) 10.03 (40) 5.29 (73) 6.34 (61)
5th Percentile 3.62 9.39 14.06 11.13 6.92 7.531st Quartile 3.05 7.65 13.00 10.42 6.32 6.90Median 2.48 6.56 12.07 9.71 5.72 6.453rd Quartile 1.84 5.27 11.03 8.98 5.26 6.0295th Percentile 0.78 3.46 9.46 8.21 3.87 5.05
Plan Sponsor Peer Group AnalysisAs of December 31,2014
19INTEGRITY. BALANCE. OBJECTIVITY.

Plan Sponsor TF Asset Allocation - Public Plan Sponors ($100mm - $1 Bln AUM)
Plan Sponsor Peer Group Analysis - Public Plan Sponors ($100mm - $1 Bln AUM)
-25.0
0.0
25.0
50.0
75.0Al
loca
tion
(%)
US Equity Intl. Equity US Fixed Income Intl. Fixed Income Alternative Inv. Real Estate CashBoulder Fire and Police 58.81 (4) 8.47 (95) 28.25 (34) 0.00 3.85 (92) 0.00 0.00
5th Percentile 55.81 33.21 48.63 14.57 31.77 12.79 6.231st Quartile 47.71 22.62 31.59 7.31 16.78 10.43 1.62
Median 39.54 18.47 23.75 5.01 11.35 8.07 0.813rd Quartile 32.84 13.70 18.69 4.43 5.50 5.37 0.1895th Percentile 21.20 8.14 15.09 3.04 2.75 2.67 0.02
-4.0
2.0
8.0
14.0
20.0
Ret
urn
0.31.22.75.0
7.8
11.2
7.09.1
3.85.0 5.56.1
LastQuarter
1Year
3Years
5Years
7Years
10Years
Boulder Fire and Police 2.56 (27) 5.50 (64) 12.18 (51) 10.16 (46) 5.98 (25) 6.87 (25)
Boulder Fire & Police Custom Benchmark 1.50 (67) 5.38 (67) 12.38 (46) 10.03 (48) 5.29 (62) 6.34 (63)
5th Percentile 3.19 8.11 14.86 11.79 6.96 7.801st Quartile 2.67 7.03 13.15 10.73 5.98 6.86Median 1.91 6.20 12.24 9.94 5.51 6.573rd Quartile 1.16 4.98 11.20 9.07 5.01 6.0995th Percentile 0.34 2.72 7.82 7.01 3.82 5.52
Plan Sponsor Peer Group AnalysisAs of December 31,2014
20INTEGRITY. BALANCE. OBJECTIVITY.
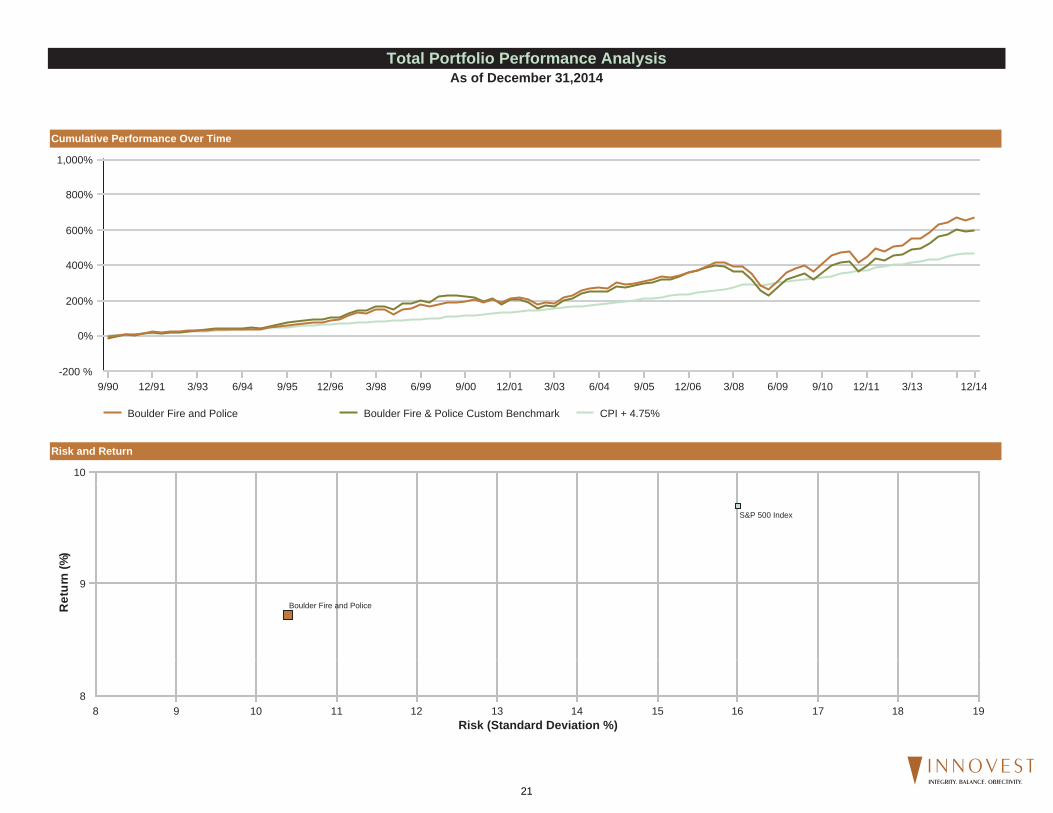
Cumulative Performance Over Time
Risk and Return
Boulder Fire and Police Boulder Fire & Police Custom Benchmark CPI + 4.75%
-200 %
0%
200%
400%
600%
800%
1,000%
9/90 12/91 3/93 6/94 9/95 12/96 3/98 6/99 9/00 12/01 3/03 6/04 9/05 12/06 3/08 6/09 9/10 12/11 3/13 12/14
8
9
10
Ret
urn
(%)
8 9 10 11 12 13 14 15 16 17 18 19Risk (Standard Deviation %)
Boulder Fire and Police
S&P 500 Index
Total Portfolio Performance AnalysisAs of December 31,2014
21INTEGRITY. BALANCE. OBJECTIVITY.

THIS PAGE LEFT INTENTIONALLY BLANK
22INTEGRITY. BALANCE. OBJECTIVITY.

Innovest’s investment performance analysis is not simply the production of a quarterly performance report.Our in-depth investment product analysis is extensive, continual and designed to reduce surprises.
ONGOING MONITORING
Occurrence Action
Daily We review trades and reconcile accounts. Manager due diligence meetings are held both on and off-site.
Weekly
The Investment Committee meets to review managers, client portfolios, and the financial markets. Special attention is reserved for managers with qualitative issues. Clients with objective changes and other issues are discussed by the committee.
MonthlyWe conduct quantitative analysis to identify outlier managers, both positive and negative, for comprehensive evaluation.
Quarterly
Each client’s account is reviewed for possible portfolio rebalancing. Manager calls are made and portfolio attribution is conducted to help determine “why” performance happened. Custom reports are developed for each client. Client meetings are conducted to review portfolio performance, managers, and policy.
Annually
We review the Due Diligence Questionnaire for every manager. Due diligence meetings are conducted and manager review documentation is created. Capital market assumptions are determined after thoughtful analysis. We conduct a formal Asset Allocation Study for every client and review their objectives, goals and investment policy.
23INTEGRITY. BALANCE. OBJECTIVITY.

Criteria
Organization People Philosophy& Process
StyleConsistency Asset Base Performance Expenses Overall
Costs
Exp Ratio(%)
MedianExp Ratio
(%)
Ratio ofExp to
Median (%)Boston Trust Balanced - Boulder F&P 0.64 1.15 55.00Victory:MC Core Gr;Y (MGOYX) 1.15 1.41 81.56ICM Small Company;Inst (ICSCX) 0.93 1.53 60.78Dodge & Cox Intl Stock (DODFX) 0.64 1.25 51.20American Funds EuPc;R-4 (REREX) 0.84 1.46 57.53PIMCO:Tot Rtn;Inst (PTTRX) 0.46 0.92 50.00Eaton Vance Flt Rt;Ins (EIBLX) 0.74 1.14 64.91JPMorgan:High Yield;Sel (OHYFX) 0.81 1.11 72.97PIMCO:Comm RR Str;Inst (PCRIX) 0.74 1.35 54.82Vantage Trust Plus 0.82 0.50 164.00VT Retirement Income Advantage 1.72 1.72 100.00
Legend For Overall CriteriaNo/Minimum ConcernsMinor ConcernMajor ConcernUnder Review
Manager Score Factor CommentsBoston Trust Balanced - Boulder F&P Performance With respect to the equity portion of the balanced fund, performance in 2012, 2013, and the first three quarters of 2014 has lagged
the benchmark and peers. This is because Boston Trust only invests in high quality companies. The high quality focus hascaused the fund to miss the high returns delivered by lower quality companies—those with lower growth, profitability, andstability—which drove higher median and benchmark returns. These results are consistent with Boston Trust’s quality-focusedstrategy, and we remain confident that this strategy will perform well in the long-term. Still, we will closely monitor performance forfuture deterioration.
Victory:MC Core Gr;Y (MGOYX) Organization Victory Capital Mangement Holdings Inc. acquired Munder Captial Managment (April, 2014). Victory manages $18 billion, as doesMunder. The combined company will form an independent investment management firm. It is expected that the investmentprocesses and decision-making that have been utilized by each money management team prior to the acquisition will remain inplace. It is also anticipated that there will be no changes to the Munder investment management teams. In addition, investmentmanagement teams are expected to remain in their current locations. Will monitor closely to ensure a smooth transition.
ICM Small Company;Inst (ICSCX) Performance The fund’s underperformance to the benchmark can be attributed to sector weighting as the fund has been underweight in RealEstate Investment Trusts which have been one of the best performing sectors in the Index. Stock selection of the fund managershas also been a detractor to performance specifically in the Technology and Materials sectors.
PIMCO:Tot Rtn;Inst (PTTRX) Organization The 2014 departures of the firm’s co-founder, Bill Gross, and his co-CIO, Mohamed El-Erian, will have significant implications forthe firm in the long run. In 2014 alone, PIMCO saw nearly $150 billion leave its assets under management. We are confident in thestructure of PIMCO, still one of the largest active fixed income managers in the world; however the rapid change in leadership andassets bears concern.
PIMCO:Tot Rtn;Inst (PTTRX) People PIMCO Co-Founder and Co-Chief Investment Officer Bill Gross has left the firm effective September 2014. As the Co-ChiefInvestment Officer, leader of the firm and lead manager of many of PIMCO’s bond funds, Gross had significant influence on thecompany’s long-term success. While Mr. Gross’s departure from PIMCO is a major event, it is important to keep in mind thatPIMCO has some of the best and brightest fixed income managers, co-CIO’s, and trading staff in the industry.
PIMCO:Tot Rtn;Inst (PTTRX) Overall .
Manager Score Card
24INTEGRITY. BALANCE. OBJECTIVITY.
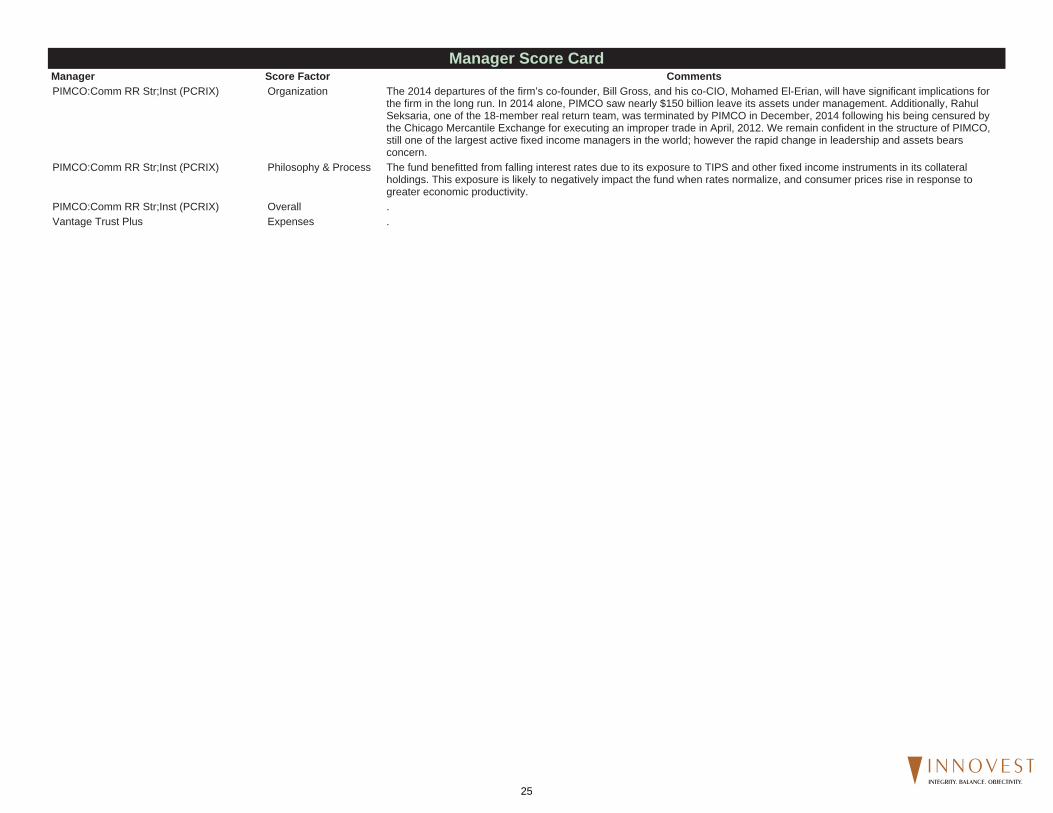
Manager Score CardManager Score Factor CommentsPIMCO:Comm RR Str;Inst (PCRIX) Organization The 2014 departures of the firm’s co-founder, Bill Gross, and his co-CIO, Mohamed El-Erian, will have significant implications for
the firm in the long run. In 2014 alone, PIMCO saw nearly $150 billion leave its assets under management. Additionally, RahulSeksaria, one of the 18-member real return team, was terminated by PIMCO in December, 2014 following his being censured bythe Chicago Mercantile Exchange for executing an improper trade in April, 2012. We remain confident in the structure of PIMCO,still one of the largest active fixed income managers in the world; however the rapid change in leadership and assets bearsconcern.
PIMCO:Comm RR Str;Inst (PCRIX) Philosophy & Process The fund benefitted from falling interest rates due to its exposure to TIPS and other fixed income instruments in its collateralholdings. This exposure is likely to negatively impact the fund when rates normalize, and consumer prices rise in response togreater economic productivity.
PIMCO:Comm RR Str;Inst (PCRIX) Overall .Vantage Trust Plus Expenses .
25INTEGRITY. BALANCE. OBJECTIVITY.
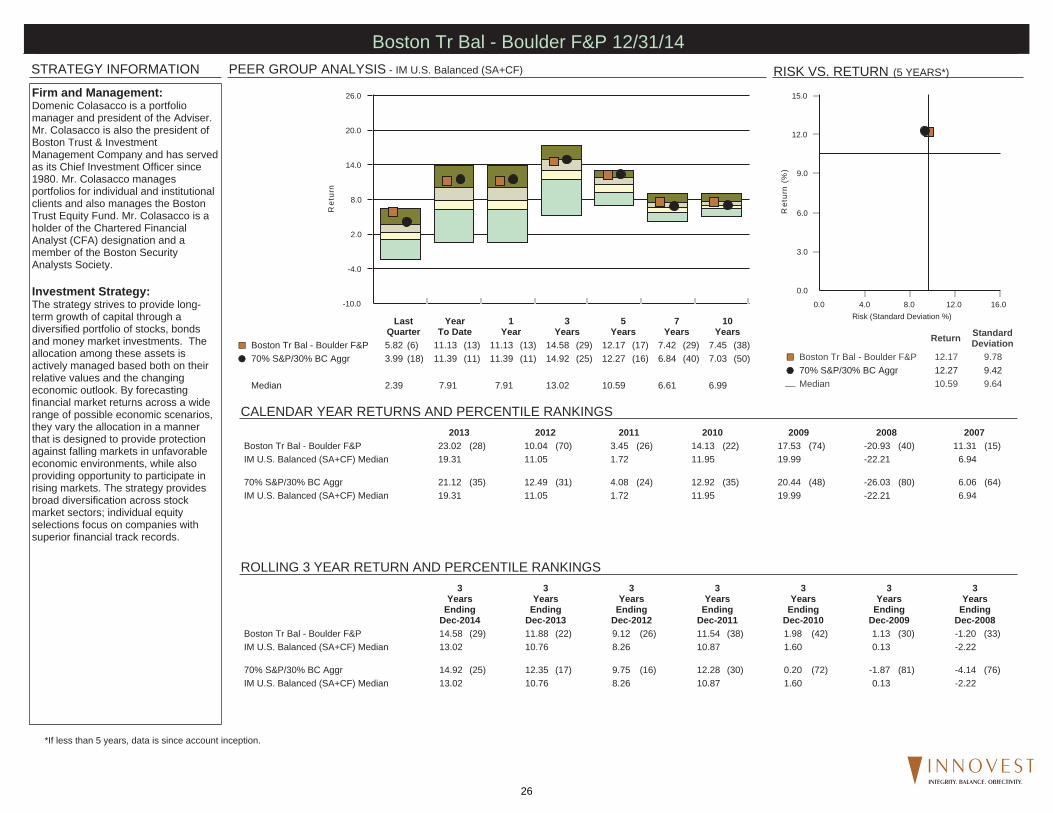
STRATEGY INFORMATION
ROLLING 3 YEAR RETURN AND PERCENTILE RANKINGS
PEER GROUP ANALYSIS - IM U.S. Balanced (SA+CF)
CALENDAR YEAR RETURNS AND PERCENTILE RANKINGS
RISK VS. RETURN (5 YEARS*)
*If less than 5 years, data is since account inception.
Firm and Management:Domenic Colasacco is a portfoliomanager and president of the Adviser.Mr. Colasacco is also the president ofBoston Trust & InvestmentManagement Company and has servedas its Chief Investment Officer since1980. Mr. Colasacco managesportfolios for individual and institutionalclients and also manages the BostonTrust Equity Fund. Mr. Colasacco is aholder of the Chartered FinancialAnalyst (CFA) designation and amember of the Boston SecurityAnalysts Society.
Investment Strategy:The strategy strives to provide long-term growth of capital through adiversified portfolio of stocks, bondsand money market investments. Theallocation among these assets isactively managed based both on theirrelative values and the changingeconomic outlook. By forecastingfinancial market returns across a widerange of possible economic scenarios,they vary the allocation in a mannerthat is designed to provide protectionagainst falling markets in unfavorableeconomic environments, while alsoproviding opportunity to participate inrising markets. The strategy providesbroad diversification across stockmarket sectors; individual equityselections focus on companies withsuperior financial track records.
0.0
3.0
6.0
9.0
12.0
15.0
Ret
urn
(%)
0.0 4.0 8.0 12.0 16.0Risk (Standard Deviation %)
Return StandardDeviation
Boston Tr Bal - Boulder F&P 12.17 9.78
70% S&P/30% BC Aggr 12.27 9.42
Median 10.59 9.64
-10.0
-4.0
2.0
8.0
14.0
20.0
26.0
Ret
urn
LastQuarter
YearTo Date
1Year
3Years
5Years
7Years
10Years
Boston Tr Bal - Boulder F&P 5.82 (6) 11.13 (13) 11.13 (13) 14.58 (29) 12.17 (17) 7.42 (29) 7.45 (38)
70% S&P/30% BC Aggr 3.99 (18) 11.39 (11) 11.39 (11) 14.92 (25) 12.27 (16) 6.84 (40) 7.03 (50)
Median 2.39 7.91 7.91 13.02 10.59 6.61 6.99
2013 2012 2011 2010 2009 2008 2007Boston Tr Bal - Boulder F&P 23.02 (28) 10.04 (70) 3.45 (26) 14.13 (22) 17.53 (74) -20.93 (40) 11.31 (15)IM U.S. Balanced (SA+CF) Median 19.31 11.05 1.72 11.95 19.99 -22.21 6.94
70% S&P/30% BC Aggr 21.12 (35) 12.49 (31) 4.08 (24) 12.92 (35) 20.44 (48) -26.03 (80) 6.06 (64)IM U.S. Balanced (SA+CF) Median 19.31 11.05 1.72 11.95 19.99 -22.21 6.94
3Years
EndingDec-2014
3Years
EndingDec-2013
3Years
EndingDec-2012
3Years
EndingDec-2011
3Years
EndingDec-2010
3Years
EndingDec-2009
3Years
EndingDec-2008
Boston Tr Bal - Boulder F&P 14.58 (29) 11.88 (22) 9.12 (26) 11.54 (38) 1.98 (42) 1.13 (30) -1.20 (33)IM U.S. Balanced (SA+CF) Median 13.02 10.76 8.26 10.87 1.60 0.13 -2.22
70% S&P/30% BC Aggr 14.92 (25) 12.35 (17) 9.75 (16) 12.28 (30) 0.20 (72) -1.87 (81) -4.14 (76)IM U.S. Balanced (SA+CF) Median 13.02 10.76 8.26 10.87 1.60 0.13 -2.22
Boston Tr Bal - Boulder F&P 12/31/14
26INTEGRITY. BALANCE. OBJECTIVITY.

STRATEGY INFORMATION
ROLLING 3 YEAR RETURN AND PERCENTILE RANKINGS
PEER GROUP ANALYSIS - IM U.S. Large Cap Core Equity (SA+CF)
CALENDAR YEAR RETURNS AND PERCENTILE RANKINGS
RISK VS. RETURN (5 YEARS*)
*If less than 5 years, data is since account inception.
Firm and Management:Domenic Colasacco is a portfoliomanager and president of the Adviser.Mr. Colasacco is also the president ofBoston Trust & InvestmentManagement Company and has servedas its Chief Investment Officer since1980. Mr. Colasacco managesportfolios for individual and institutionalclients and also manages the BostonTrust Equity Fund. Mr. Colasacco is aholder of the Chartered FinancialAnalyst (CFA) designation and amember of the Boston SecurityAnalysts Society.
Investment Strategy:The portfolio consists of stocks from allmarket capitalizations; small, mediumand large. The portfolio is constructedwith a bottom up approach to securityselection, however, macro themes areconsidered in deciding which sectorslook most attractive. Each potentialholding is put through a number ofscreens which consider earningsgrowth and relative valuation.
6.0
9.0
12.0
15.0
18.0
21.0
Ret
urn
(%)
0.0 5.0 10.0 15.0 20.0 25.0Risk (Standard Deviation %)
Return StandardDeviation
Boston TrEq - Boulder F&P 14.41 13.50
S&P 500 Index 15.45 14.04
Median 15.47 14.68
-4.0
4.0
12.0
20.0
28.0
36.0
Ret
urn
LastQuarter
YearTo Date
1Year
3Years
5Years
7Years
10Years
Boston TrEq - Boulder F&P 6.88 (14) 13.00 (54) 13.00 (54) 18.20 (81) 14.41 (72) 7.75 (51) 7.87 (75)
S&P 500 Index 4.93 (54) 13.69 (40) 13.69 (40) 20.41 (54) 15.45 (52) 7.27 (70) 7.67 (81)
Median 5.09 13.24 13.24 20.56 15.47 7.78 8.42
2013 2012 2011 2010 2009 2008 2007Boston TrEq - Boulder F&P 30.44 (80) 12.03 (86) 1.56 (56) 16.91 (26) 24.19 (65) -30.73 (17) 11.81 (18)IM U.S. Large Cap Core Equity (SA+CF) Median 33.42 15.68 1.93 14.85 26.59 -36.11 7.19
S&P 500 Index 32.39 (64) 16.00 (46) 2.11 (49) 15.06 (45) 26.46 (51) -37.00 (62) 5.49 (71)IM U.S. Large Cap Core Equity (SA+CF) Median 33.42 15.68 1.93 14.85 26.59 -36.11 7.19
3Years
EndingDec-2014
3Years
EndingDec-2013
3Years
EndingDec-2012
3Years
EndingDec-2011
3Years
EndingDec-2010
3Years
EndingDec-2009
3Years
EndingDec-2008
Boston TrEq - Boulder F&P 18.20 (81) 14.06 (82) 9.97 (65) 13.82 (57) 0.19 (18) -1.29 (16) -4.92 (22)IM U.S. Large Cap Core Equity (SA+CF) Median 20.56 16.38 10.67 14.09 -1.97 -4.36 -7.42
S&P 500 Index 20.41 (54) 16.18 (57) 10.87 (48) 14.11 (49) -2.85 (68) -5.63 (73) -8.36 (69)IM U.S. Large Cap Core Equity (SA+CF) Median 20.56 16.38 10.67 14.09 -1.97 -4.36 -7.42
Boston TrEq - Boulder F&P 12/31/14
27INTEGRITY. BALANCE. OBJECTIVITY.
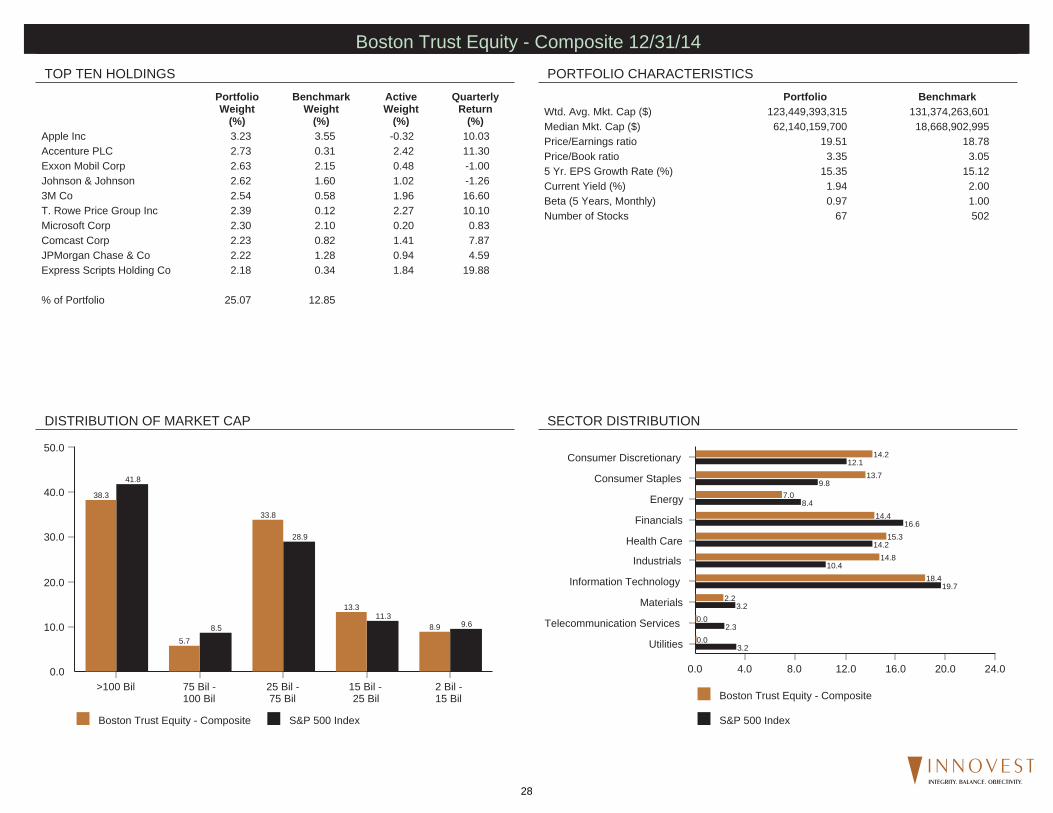
TOP TEN HOLDINGS PORTFOLIO CHARACTERISTICS
DISTRIBUTION OF MARKET CAP SECTOR DISTRIBUTION
Portfolio BenchmarkWtd. Avg. Mkt. Cap ($) 123,449,393,315 131,374,263,601Median Mkt. Cap ($) 62,140,159,700 18,668,902,995Price/Earnings ratio 19.51 18.78Price/Book ratio 3.35 3.055 Yr. EPS Growth Rate (%) 15.35 15.12Current Yield (%) 1.94 2.00Beta (5 Years, Monthly) 0.97 1.00Number of Stocks 67 502
PortfolioWeight
(%)
BenchmarkWeight
(%)
ActiveWeight
(%)
QuarterlyReturn
(%)Apple Inc 3.23 3.55 -0.32 10.03Accenture PLC 2.73 0.31 2.42 11.30Exxon Mobil Corp 2.63 2.15 0.48 -1.00Johnson & Johnson 2.62 1.60 1.02 -1.263M Co 2.54 0.58 1.96 16.60T. Rowe Price Group Inc 2.39 0.12 2.27 10.10Microsoft Corp 2.30 2.10 0.20 0.83Comcast Corp 2.23 0.82 1.41 7.87JPMorgan Chase & Co 2.22 1.28 0.94 4.59Express Scripts Holding Co 2.18 0.34 1.84 19.88
% of Portfolio 25.07 12.85
Boston Trust Equity - Composite
S&P 500 Index
0.0 4.0 8.0 12.0 16.0 20.0 24.0
Utilities
Telecommunication Services
Materials
Information Technology
Industrials
Health Care
Financials
Energy
Consumer Staples
Consumer Discretionary
0.0
0.0
2.2
18.4
14.8
15.3
14.4
7.0
13.7
14.2
3.2
2.3
3.2
19.7
10.4
14.2
16.6
8.4
9.8
12.1
Boston Trust Equity - Composite S&P 500 Index
0.0
10.0
20.0
30.0
40.0
50.0
>100 Bil 75 Bil - 100 Bil
25 Bil - 75 Bil
15 Bil - 25 Bil
2 Bil - 15 Bil
41.8
8.5
28.9
11.39.6
38.3
5.7
33.8
13.3
8.9
Boston Trust Equity - Composite 12/31/14
28INTEGRITY. BALANCE. OBJECTIVITY.

PERFORMANCE - 1 Quarter TOTAL ATTRIBUTION - 1 Quarter
ACTIVE RETURN - 1 Quarter
0.0 0.3 0.6 0.9-0.3-0.6-0.9
Utilities
Telecommunication Services
Materials
Information Technology
Industrials
Health Care
Financials
Energy
Consumer Staples
Consumer Discretionary
-0.2
0.2
0.3
0.4
0.2
0.3
-0.1
0.5
-0.3
0.3
Boston Trust Equity - Composite
S&P 500 Index
0.0 8.0 16.0 24.0-8.0-16.0
Utilities
Telecommunication Services
Materials
Information Technology
Industrials
Health Care
Financials
Energy
Consumer Staples
Consumer Discretionary
0.0
0.0
6.5
7.4
7.9
10.1
7.1
-5.9
4.7
10.9
13.2
-4.5
-1.7
5.3
6.8
7.5
7.3
-10.8
8.2
8.7
Buy-and-Hold Portfolio 6.56Portfolio Trading -0.71Actual Return 5.85Benchmark Return 4.93Actual Active Return 0.92
Stock Selection 1.54Sector Selection 0.10Interaction -0.01Total Selection 1.62
Portfolio Trading -0.71Benchmark Trading -0.01Active Trading Impact -0.70
Buy & Hold Active Return 0.92
Boston Trust Equity - Composite 12/31/14
29INTEGRITY. BALANCE. OBJECTIVITY.

PERFORMANCE - 3 Years TOTAL ATTRIBUTION - 3 Years
ACTIVE RETURN - 3 Years
0.0 0.4 0.8-0.4-0.8-1.2-1.6
Utilities
Telecommunication Services
Materials
Information Technology
Industrials
Health Care
Financials
Energy
Consumer Staples
Consumer Discretionary
0.0
0.2
0.4
-0.3
-0.9
-0.9
-0.8
0.0
-0.6
-0.1
Boston Trust Equity - Composite
S&P 500 Index
0.0 15.0 30.0 45.0-15.0-30.0
Utilities
Telecommunication Services
Materials
Information Technology
Industrials
Health Care
Financials
Energy
Consumer Staples
Consumer Discretionary
-7.7
-4.1
24.1
20.4
16.5
19.8
20.7
7.3
13.8
23.3
13.9
10.7
15.7
21.0
21.2
27.6
26.3
6.5
17.4
25.0
Buy-and-Hold Portfolio 17.46Portfolio Trading 0.33Actual Return 17.80Benchmark Return 20.41Actual Active Return -2.62
Stock Selection -2.50Sector Selection -0.12Interaction -0.40Total Selection -3.03
Portfolio Trading 0.33Benchmark Trading 0.02Active Trading Impact 0.31
Buy & Hold Active Return -2.72
Boston Trust Equity - Composite 12/31/14
30INTEGRITY. BALANCE. OBJECTIVITY.

THIS PAGE LEFT INTENTIONALLY BLANK
31INTEGRITY. BALANCE. OBJECTIVITY.

STRATEGY INFORMATION
ROLLING 3 YEAR RETURN AND PERCENTILE RANKINGS
PEER GROUP ANALYSIS - IM U.S. Fixed Income (SA+CF)
CALENDAR YEAR RETURNS AND PERCENTILE RANKINGS
RISK VS. RETURN (5 YEARS*)
*If less than 5 years, data is since account inception.
Firm and Management:Domenic Colasacco is a portfoliomanager and president of the Adviser.Mr. Colasacco is also the president ofBoston Trust & InvestmentManagement Company and has servedas its Chief Investment Officer since1980. Mr. Colasacco managesportfolios for individual and institutionalclients and also manages the BostonTrust Equity Fund. Mr. Colasacco is aholder of the Chartered FinancialAnalyst (CFA) designation and amember of the Boston SecurityAnalysts Society.
Investment Strategy:Boston Trust's approach to fixedincome investing combines top downeconomic scenario forecasts withbottom up fundamental research. Usingmacroeconomic-based quantitativetools, the investment team forecastsinterest rate changes for a range ofpossible economic outcomes. Theseforecasts contribute to portfoliostrategies with respect to interest ratesand the yield curve. In selectingindividual securities, Boston Trustapplies long-held standards for superiorfinancial quality, appropriate risk, anddiversification.
-3.0
0.0
3.0
6.0
9.0
12.0
15.0
Ret
urn
(%)
-5.0 0.0 5.0 10.0 15.0Risk (Standard Deviation %)
Return StandardDeviation
Boston Tr FI - Boulder F&P 3.93 2.81
Barclays Agg 4.45 2.95
Median 5.16 2.98
-10.0
-4.0
2.0
8.0
14.0
20.0
26.0
Ret
urn
LastQuarter
YearTo Date
1Year
3Years
5Years
7Years
10Years
Boston Tr FI - Boulder F&P 1.39 (36) 3.71 (57) 3.71 (57) 1.84 (83) 3.93 (73) 4.27 (74) 4.41 (72)
Barclays Agg 1.79 (22) 5.97 (36) 5.97 (36) 2.66 (69) 4.45 (63) 4.77 (63) 4.71 (62)
Median 0.88 4.41 4.41 3.82 5.16 5.29 5.07
2013 2012 2011 2010 2009 2008 2007Boston Tr FI - Boulder F&P -2.15 (84) 4.08 (76) 7.76 (33) 6.55 (65) 4.93 (83) 5.33 (23) 8.43 (10)IM U.S. Fixed Income (SA+CF) Median -0.29 6.67 6.42 7.56 10.44 1.36 6.23
Barclays Agg -2.02 (81) 4.21 (75) 7.84 (32) 6.54 (65) 5.93 (78) 5.24 (24) 6.97 (33)IM U.S. Fixed Income (SA+CF) Median -0.29 6.67 6.42 7.56 10.44 1.36 6.23
3Years
EndingDec-2014
3Years
EndingDec-2013
3Years
EndingDec-2012
3Years
EndingDec-2011
3Years
EndingDec-2010
3Years
EndingDec-2009
3Years
EndingDec-2008
Boston Tr FI - Boulder F&P 1.84 (83) 3.15 (74) 6.12 (66) 6.41 (73) 5.60 (64) 6.22 (42) 5.81 (18)IM U.S. Fixed Income (SA+CF) Median 3.82 4.27 7.16 8.73 6.35 5.85 4.07
Barclays Agg 2.66 (69) 3.26 (72) 6.19 (66) 6.77 (70) 5.90 (59) 6.04 (46) 5.51 (24)IM U.S. Fixed Income (SA+CF) Median 3.82 4.27 7.16 8.73 6.35 5.85 4.07
Boston Tr FI - Boulder F&P 12/31/14
32INTEGRITY. BALANCE. OBJECTIVITY.
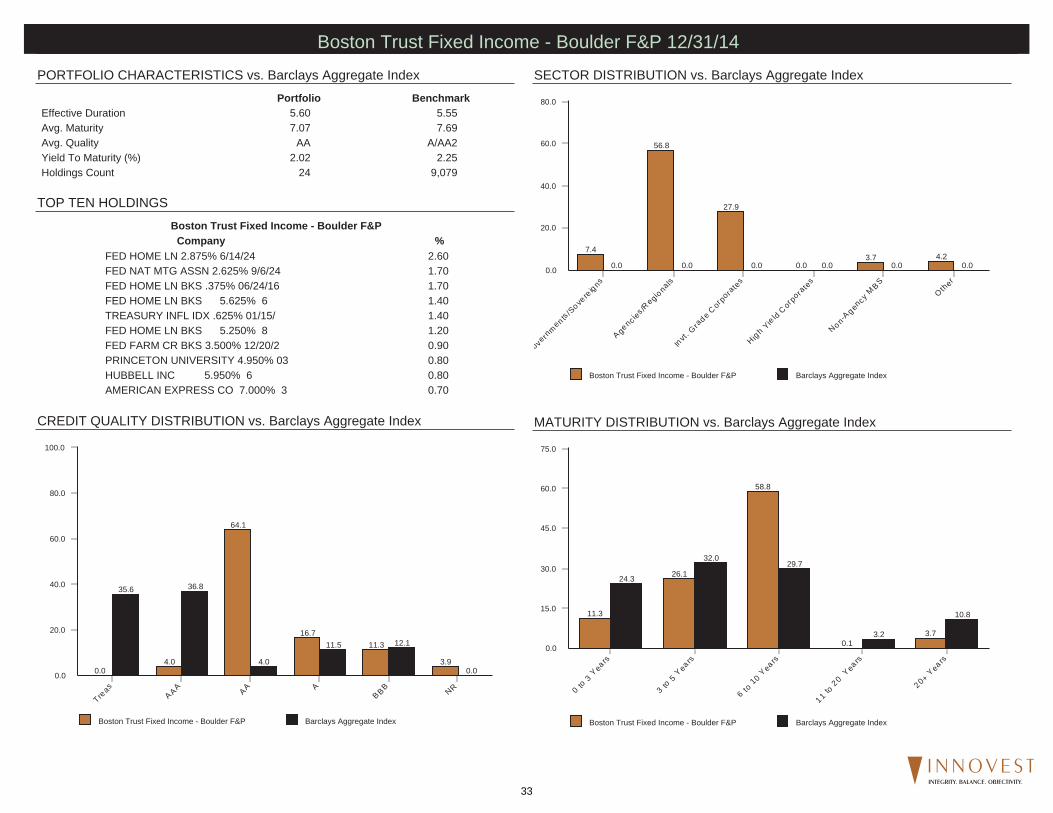
TOP TEN HOLDINGS
PORTFOLIO CHARACTERISTICS vs. Barclays Aggregate Index
CREDIT QUALITY DISTRIBUTION vs. Barclays Aggregate Index
SECTOR DISTRIBUTION vs. Barclays Aggregate Index
MATURITY DISTRIBUTION vs. Barclays Aggregate Index
Boston Trust Fixed Income - Boulder F&P Barclays Aggregate Index
0.0
20.0
40.0
60.0
80.0
overn
men ts /S
overe
igns
A gencie
s /Regio
nals
Invt.
Grade
Corpo
rate
s
H igh
Yield
Corpo
rate
s
Non-A gen
cy M BS
Other
0.0 0.0 0.0 0.0 0.0 0.0
7.4
56.8
27.9
0.03.7 4.2
Portfolio BenchmarkEffective Duration 5.60 5.55Avg. Maturity 7.07 7.69Avg. Quality AA A/AA2Yield To Maturity (%) 2.02 2.25Holdings Count 24 9,079
Boston Trust Fixed Income - Boulder F&PCompany %
FED HOME LN 2.875% 6/14/24 2.60FED NAT MTG ASSN 2.625% 9/6/24 1.70FED HOME LN BKS .375% 06/24/16 1.70FED HOME LN BKS 5.625% 6 1.40TREASURY INFL IDX .625% 01/15/ 1.40FED HOME LN BKS 5.250% 8 1.20FED FARM CR BKS 3.500% 12/20/2 0.90PRINCETON UNIVERSITY 4.950% 03 0.80HUBBELL INC 5.950% 6 0.80AMERICAN EXPRESS CO 7.000% 3 0.70
Boston Trust Fixed Income - Boulder F&P Barclays Aggregate Index
0.0
20.0
40.0
60.0
80.0
100.0
Treas
A AA AA AB BB NR
35.6 36.8
4.0
11.5 12.1
0.00.04.0
64.1
16.711.3
3.9
Boston Trust Fixed Income - Boulder F&P Barclays Aggregate Index
0.0
15.0
30.0
45.0
60.0
75.0
0 to
3 Y ea
rs
3 to
5 Y ea
rs
6 to
10 Y ea
rs
11 to
20 Y ea
rs
20+ Y ea
rs
24.3
32.029.7
3.2
10.811.3
26.1
58.8
0.13.7
Boston Trust Fixed Income - Boulder F&P 12/31/14
33INTEGRITY. BALANCE. OBJECTIVITY.

FUND INFORMATION
ROLLING 3 YEAR RETURN AND PERCENTILE RANKINGS
PEER GROUP ANALYSIS - IM U.S. Mid Cap Growth Equity (MF)
CALENDAR YEAR RETURNS AND PERCENTILE RANKINGS
RISK VS. RETURN (5 YEARS*)
*If less than 5 years, data is since inception of fund share class.
Firm and Management:Tony Dong has been the lead managerhere since February 2001. He's workedat Munder since 1988 and managedlarge-cap, growth-at-a-reasonable pricestrategies before taking over this fund.He's backed here by four comanagers:Andy Mui, Brian Matuszak, GeorgeSanders, and Geoffrey Wilson.
Investment Strategy:The Munder team seek companies thattrade cheaply relative to their growthprospects, using a broad range ofvaluation measures. They keep theFund's sector weightings within 3percentage points of those of the fund'sbenchmark, the S&P Midcap 400 Index.They'll typically hold 70-100 stocks andcap position sizes at 3%. And they'rerelatively patient investors; portfolioturnover has averaged around 50%.
Innovest's Assessment:Munder’s low beta bias is likely tooutperform during market drawdownsand when quality growth companies arein favor. Underperformance is expectedwhen low quality, high beta companiesoutpace high quality securities andduring speculative growth rallies.
4.0
8.0
12.0
16.0
20.0
24.0
Ret
urn
(%)
9.0 12.0 15.0 18.0 21.0Risk (Standard Deviation %)
Return StandardDeviation
Victory Munder MC Core Gr 16.30 14.59
Russell Midcap Growth Index 16.94 15.34
Median 15.01 16.08
-4.0
2.0
8.0
14.0
20.0
26.0
32.0
Ret
urn
LastQuarter
YearTo Date
1Year
3Years
5Years
7Years
10Years
Victory Munder MC Core Gr 5.69 (39) 10.17 (25) 10.17 (25) 19.56 (38) 16.30 (21) 6.92 (51) 9.35 (29)
Russell Midcap Growth Index 5.84 (37) 11.90 (12) 11.90 (12) 20.71 (18) 16.94 (12) 8.59 (18) 9.43 (27)
Median 5.32 7.53 7.53 18.69 15.01 6.97 8.51
2013 2012 2011 2010 2009 2008 2007Victory Munder MC Core Gr 33.71 (67) 16.01 (27) -0.77 (24) 25.48 (54) 32.80 (74) -43.45 (38) 20.97 (28)Russell Midcap Growth Index 35.74 (51) 15.81 (30) -1.65 (28) 26.38 (49) 46.29 (25) -44.32 (43) 11.43 (74)IM U.S. Mid Cap Growth Equity (MF) Median 35.76 14.22 -4.65 26.11 40.65 -45.39 15.86
3Years
EndingDec-2014
3Years
EndingDec-2013
3Years
EndingDec-2012
3Years
EndingDec-2011
3Years
EndingDec-2010
3Years
EndingDec-2009
3Years
EndingDec-2008
Victory Munder MC Core Gr 19.56 (38) 15.46 (23) 13.04 (18) 18.25 (60) -1.96 (64) -3.15 (54) -8.55 (26)Russell Midcap Growth Index 20.71 (18) 15.63 (21) 12.91 (21) 22.06 (17) 0.97 (37) -3.18 (54) -11.79 (60)IM U.S. Mid Cap Growth Equity (MF) Median 18.69 13.99 11.11 19.03 -0.56 -2.94 -11.06
Victory Munder MC Core Gr 12/31/14
34INTEGRITY. BALANCE. OBJECTIVITY.
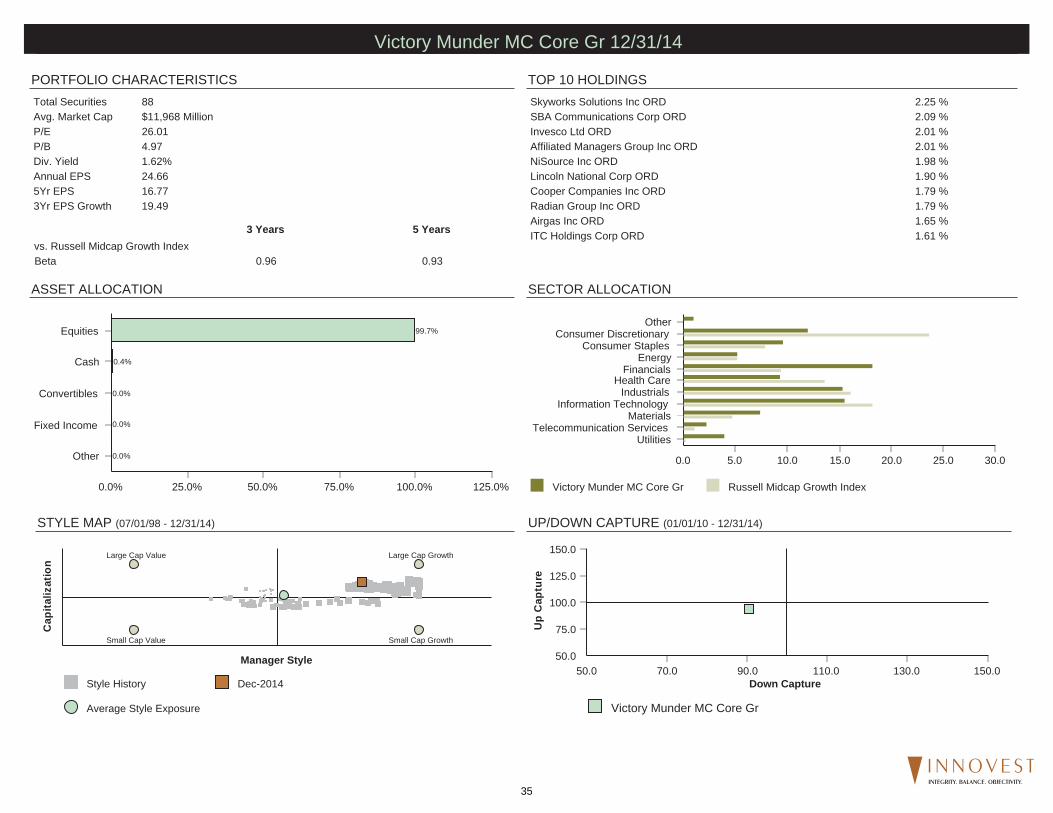
TOP 10 HOLDINGS
STYLE MAP (07/01/98 - 12/31/14)
SECTOR ALLOCATIONASSET ALLOCATION
PORTFOLIO CHARACTERISTICS
UP/DOWN CAPTURE (01/01/10 - 12/31/14)
Total Securities 88Avg. Market Cap $11,968 MillionP/E 26.01P/B 4.97Div. Yield 1.62%Annual EPS 24.665Yr EPS 16.773Yr EPS Growth 19.49
Skyworks Solutions Inc ORD 2.25 %SBA Communications Corp ORD 2.09 %Invesco Ltd ORD 2.01 %Affiliated Managers Group Inc ORD 2.01 %NiSource Inc ORD 1.98 %Lincoln National Corp ORD 1.90 %Cooper Companies Inc ORD 1.79 %Radian Group Inc ORD 1.79 %Airgas Inc ORD 1.65 %ITC Holdings Corp ORD 1.61 %3 Years 5 Years
vs. Russell Midcap Growth IndexBeta 0.96 0.93
0.0% 25.0% 50.0% 75.0% 100.0% 125.0%
Other
Fixed Income
Convertibles
Cash
Equities
0.0%
0.0%
0.0%
0.4%
99.7%
Victory Munder MC Core Gr Russell Midcap Growth Index
0.0 5.0 10.0 15.0 20.0 25.0 30.0
UtilitiesTelecommunication Services
MaterialsInformation Technology
IndustrialsHealth Care
FinancialsEnergy
Consumer StaplesConsumer Discretionary
Other
Style History Dec-2014
Average Style Exposure
Cap
italiz
atio
n
Manager Style
Large Cap Growth
Small Cap GrowthSmall Cap Value
Large Cap Value
Victory Munder MC Core Gr
50.0
75.0
100.0
125.0
150.0U
p C
aptu
re
50.0 70.0 90.0 110.0 130.0 150.0Down Capture
Victory Munder MC Core Gr 12/31/14
35INTEGRITY. BALANCE. OBJECTIVITY.

FUND INFORMATION
ROLLING 3 YEAR RETURN AND PERCENTILE RANKINGS
PEER GROUP ANALYSIS - IM U.S. Small Cap Value Equity (MF)
CALENDAR YEAR RETURNS AND PERCENTILE RANKINGS
RISK VS. RETURN (5 YEARS*)
*If less than 5 years, data is since inception of fund share class.
Firm and Management:ICM's Small Cap Value effort began in1989, and today Bill Heaphy, ChiefInvestment Officer, and Sim Wootenserve as co-portfolio managers of theICM Small Company Portfolio. Bothhave research responsibilities and Billserves as Director of Research for thesmall cap team. Gary Merwitz, RobJacapraro, Josh Overholt and MattFleming are analysts on the small capteam.
Investment Strategy:Management starts with a universe ofstocks with market caps of around $1billion and narrows the list throughscreens and company analysis. Theteam favors well-managed companieswith good growth prospects that aretrading at attractive valuations. It tendsto sell when valuations get too high orwhen the company doesn't meetexpectations.
Innovest's Assessment:The strategy should outperform in downand stable markets and when lessercapitalized companies are leading. Thefund should underperform during bullmarkets when companies with little orno earnings are in vogue due to itssensitivity to high valuations; althoughthis may be subdued due to its higherweighting of lesser capitalizedcompanies. The fund should alsounderperform when financials andutilities lead due to management'sperpetual aversion to the sectors.
3.0
6.0
9.0
12.0
15.0
18.0
21.0
Ret
urn
(%)
0.0 10.0 20.0 30.0Risk (Standard Deviation %)
Return StandardDeviation
ICM Small Company 13.85 18.25
Russell 2000 Value Index 14.26 17.57
Median 14.89 17.35
-12.0
-4.0
4.0
12.0
20.0
28.0
Ret
urn
LastQuarter
YearTo Date
1Year
3Years
5Years
7Years
10Years
ICM Small Company 9.04 (38) 2.87 (62) 2.87 (62) 17.88 (62) 13.85 (76) 7.59 (58) 8.02 (18)
Russell 2000 Value Index 9.40 (33) 4.22 (41) 4.22 (41) 18.29 (51) 14.26 (61) 7.59 (58) 6.89 (54)
Median 8.02 3.63 3.63 18.32 14.89 7.85 7.05
2013 2012 2011 2010 2009 2008 2007ICM Small Company 36.16 (49) 16.93 (45) -4.85 (58) 22.73 (80) 34.46 (26) -35.11 (63) 3.35 (5)Russell 2000 Value Index 34.52 (65) 18.05 (33) -5.50 (66) 24.50 (61) 20.58 (76) -28.92 (22) -9.78 (67)IM U.S. Small Cap Value Equity (MF) Median 36.05 16.59 -4.00 25.40 27.89 -32.13 -6.98
3Years
EndingDec-2014
3Years
EndingDec-2013
3Years
EndingDec-2012
3Years
EndingDec-2011
3Years
EndingDec-2010
3Years
EndingDec-2009
3Years
EndingDec-2008
ICM Small Company 17.88 (62) 14.85 (54) 10.94 (63) 16.23 (39) 2.31 (57) -3.39 (13) -7.18 (15)Russell 2000 Value Index 18.29 (51) 14.49 (63) 11.57 (52) 12.36 (92) 2.19 (58) -8.22 (52) -7.49 (17)IM U.S. Small Cap Value Equity (MF) Median 18.32 14.99 11.79 15.73 2.50 -8.07 -9.89
ICM Small Company 12/31/14
36INTEGRITY. BALANCE. OBJECTIVITY.

TOP 10 HOLDINGS
STYLE MAP (05/01/89 - 12/31/14)
SECTOR ALLOCATIONASSET ALLOCATION
PORTFOLIO CHARACTERISTICS
UP/DOWN CAPTURE (01/01/10 - 12/31/14)
Total Securities 117Avg. Market Cap $1,544 MillionP/E 25.68P/B 1.94Div. Yield 2.20%Annual EPS 11.765Yr EPS 10.033Yr EPS Growth 9.79
Dreyfus Treasury Prime Cash Management;Inst 1.78 %Ameris Bancorp ORD 1.60 %Heartland Express Inc ORD 1.38 %Innophos Holdings Inc ORD 1.38 %Esco Technologies Inc ORD 1.37 %Integrated Device Technology Inc ORD 1.36 %NorthWestern Corp ORD 1.33 %Idacorp Inc ORD 1.33 %Rogers Corp ORD 1.29 %Coherent Inc ORD 1.29 %3 Years 5 Years
vs. Russell 2000 Value IndexBeta 1.03 1.03
0.0% 25.0% 50.0% 75.0% 100.0% 125.0%
Other
Fixed Income
Convertibles
Cash
Equities
0.0%
0.0%
0.0%
1.8%
98.2%
ICM Small Company Russell 2000 Value Index
0.0 10.0 20.0 30.0 40.0 50.0
UtilitiesTelecommunication Services
MaterialsInformation Technology
IndustrialsHealth Care
FinancialsEnergy
Consumer StaplesConsumer Discretionary
Other
Style History Dec-2014
Average Style Exposure
Cap
italiz
atio
n
Manager Style
Large Cap Growth
Small Cap GrowthSmall Cap Value
Large Cap Value
ICM Small Company
50.0
75.0
100.0
125.0
150.0U
p C
aptu
re
50.0 70.0 90.0 110.0 130.0 150.0Down Capture
ICM Small Company 12/31/14
37INTEGRITY. BALANCE. OBJECTIVITY.

FUND INFORMATION
ROLLING 3 YEAR RETURN AND PERCENTILE RANKINGS
PEER GROUP ANALYSIS - IM International Large Cap Value Equity (MF)
CALENDAR YEAR RETURNS AND PERCENTILE RANKINGS
RISK VS. RETURN (5 YEARS*)
*If less than 5 years, data is since inception of fund share class.
Firm and ManagementThe International Stock Fund ismanaged by the InternationalInvestment Policy Committee. The ninemembers of this committee have anaverage tenure at Dodge & Cox of 24years. In addition, all the firm's analystsare involved in security selection due totheir global coverage responsibilities.
Investment StrategyThe Fund invests primarily in adiversified portfolio of equity securitiesissued by non-U.S. companies from atleast three different countries, includingemerging markets. The Fund focuseson countries whose economic andpolitical systems appear more stableand are believed to provide someprotection to foreign shareholders. TheFund invests primarily in medium-to-large well established companiesbased on standards of the applicablemarket. In selecting investments, theFund invests primarily in companiesthat, in Dodge & Cox’s opinion, appearto be temporarily undervalued by thestock market but have a favorableoutlook for long-term growth.
Innovest's AssessmentWe believe this collaborative researchapproach will continue generatingshareholder value over full marketcycles; however, performance maysuffer during periods driven by moremacroeconomic events or a disregardfor company specific fundamentals.The strategy’s notable allocation todeveloping countries also suggests thatrelative performance may be partiallydictated by the market’s preference foremerging market securities.
-2.0
0.0
2.0
4.0
6.0
8.0
10.0
Ret
urn
(%)
12.0 14.0 16.0 18.0 20.0 22.0Risk (Standard Deviation %)
Return StandardDeviation
Dodge & Cox Intl 7.89 17.72
MSCI EAFE Value Idx 4.42 17.50
Median 4.05 17.74
-20.0
-12.0
-4.0
4.0
12.0
20.0
28.0
Ret
urn
LastQuarter
YearTo Date
1Year
3Years
5Years
7Years
10Years
Dodge & Cox Intl -4.66 (33) 0.08 (1) 0.08 (1) 15.23 (1) 7.89 (1) 2.00 (8) 6.73 (16)
MSCI EAFE Value Idx -4.85 (56) -5.39 (25) -5.39 (25) 11.04 (1) 4.42 (34) -1.01 (38) 3.89 (57)
Median -4.81 -6.85 -6.85 9.14 4.05 -1.91 4.30
2013 2012 2011 2010 2009 2008 2007Dodge & Cox Intl 26.31 (2) 21.03 (13) -15.97 (83) 13.69 (6) 47.46 (6) -46.69 (66) 11.71 (29)MSCI EAFE Value Idx 22.95 (8) 17.69 (44) -12.17 (43) 3.25 (81) 34.23 (29) -44.09 (47) 5.95 (93)IM International Large Cap Value Equity (MF) Median 21.02 17.18 -12.93 5.39 27.98 -44.45 9.54
3Years
EndingDec-2014
3Years
EndingDec-2013
3Years
EndingDec-2012
3Years
EndingDec-2011
3Years
EndingDec-2010
3Years
EndingDec-2009
3Years
EndingDec-2008
Dodge & Cox Intl 15.23 (1) 8.71 (3) 4.96 (9) 12.10 (8) -3.67 (6) -4.24 (16) -8.65 (60)MSCI EAFE Value Idx 11.04 (1) 8.32 (11) 2.19 (57) 6.77 (33) -8.15 (41) -7.35 (48) -8.25 (52)IM International Large Cap Value Equity (MF) Median 9.14 6.97 2.58 6.16 -8.67 -7.39 -7.74
Dodge & Cox Intl 12/31/14
38INTEGRITY. BALANCE. OBJECTIVITY.
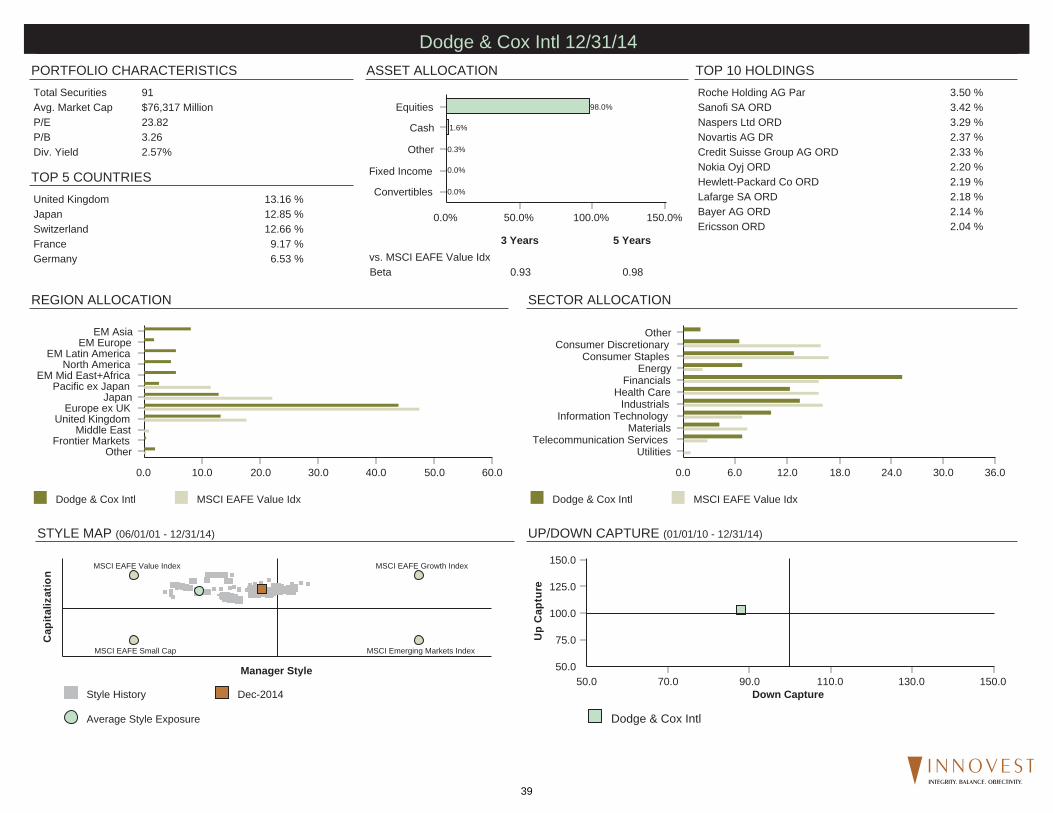
TOP 10 HOLDINGSPORTFOLIO CHARACTERISTICS
STYLE MAP (06/01/01 - 12/31/14)
SECTOR ALLOCATION
ASSET ALLOCATION
REGION ALLOCATION
TOP 5 COUNTRIES
UP/DOWN CAPTURE (01/01/10 - 12/31/14)
0.0% 50.0% 100.0% 150.0%
Convertibles
Fixed Income
Other
Cash
Equities
0.0%
0.0%
0.3%
1.6%
98.0%
Total Securities 91Avg. Market Cap $76,317 MillionP/E 23.82P/B 3.26Div. Yield 2.57%
Roche Holding AG Par 3.50 %Sanofi SA ORD 3.42 %Naspers Ltd ORD 3.29 %Novartis AG DR 2.37 %Credit Suisse Group AG ORD 2.33 %Nokia Oyj ORD 2.20 %Hewlett-Packard Co ORD 2.19 %Lafarge SA ORD 2.18 %Bayer AG ORD 2.14 %Ericsson ORD 2.04 %
United Kingdom 13.16 %Japan 12.85 %Switzerland 12.66 %France 9.17 %Germany 6.53 %
3 Years 5 Yearsvs. MSCI EAFE Value IdxBeta 0.93 0.98
Dodge & Cox Intl MSCI EAFE Value Idx
0.0 10.0 20.0 30.0 40.0 50.0 60.0
OtherFrontier Markets
Middle EastUnited Kingdom
Europe ex UKJapan
Pacific ex JapanEM Mid East+Africa
North AmericaEM Latin America
EM EuropeEM Asia
Dodge & Cox Intl MSCI EAFE Value Idx
0.0 6.0 12.0 18.0 24.0 30.0 36.0
UtilitiesTelecommunication Services
MaterialsInformation Technology
IndustrialsHealth Care
FinancialsEnergy
Consumer StaplesConsumer Discretionary
Other
Style History Dec-2014
Average Style Exposure
Cap
italiz
atio
n
Manager Style
MSCI EAFE Growth Index
MSCI Emerging Markets IndexMSCI EAFE Small Cap
MSCI EAFE Value Index
Dodge & Cox Intl
50.0
75.0
100.0
125.0
150.0
Up
Cap
ture
50.0 70.0 90.0 110.0 130.0 150.0Down Capture
Dodge & Cox Intl 12/31/14
39INTEGRITY. BALANCE. OBJECTIVITY.

FUND INFORMATION
ROLLING 3 YEAR RETURN AND PERCENTILE RANKINGS
PEER GROUP ANALYSIS - IM International Large Cap Growth Equity (MF)
CALENDAR YEAR RETURNS AND PERCENTILE RANKINGS
RISK VS. RETURN (5 YEARS*)
*If less than 5 years, data is since inception of fund share class.
Firm and Management:Like all American Funds, this fundboasts many experienced managers,most of whom have been with thecompany for more than a decade. Thismultimanager system eases personneltransitions, like the June 2014departure of long-time manager RobertLovelace, who moved to an affiliate.Each of the fund's nine managers runsa portion of the fund's assetsindependently. In addition, a portion ofthe portfolio (less than 25% of assets)is run by the firm's analyst staff.
Investment Strategy:This fund's managers are focused onlong term capital growth. They primarilyinvest in common stocks of Europeanand Pacific Basin issuers that haveprospects of above average capitalappreciation. The managers may usecash to moderate volatility, typicallyholding 5-10% of fund assets in cash.The Fund usually has a stake inemerging-markets companies and willsometimes hold preferred stock andconvertibles debt.
Innovest's Assessment:The fund’s propensity to focus intenselyon bottom-up, fundamental factors canlead to periods of underperformancewhen the market is less concernedabout company fundamentals and moredriven by thematic and macroeconomicfactors. Additionally, the fund is likely tolag when highly cyclical stocks andgenerally lower quality companiessignificantly outperform the overallmarket. Finally, the fund’s immenseasset base is likely to present somechallenges in the fund’s ability to buildmeaningful positions in smallercompanies and opportunistically tradein less liquid markets.
-3.0
0.0
3.0
6.0
9.0
12.0
Ret
urn
(%)
9.0 12.0 15.0 18.0 21.0Risk (Standard Deviation %)
Return StandardDeviation
American Funds EuPc 5.68 15.80
MSCI EAFE Growth Index (Net) 6.19 16.02
Median 5.64 15.80
-15.0
-10.0
-5.0
0.0
5.0
10.0
15.0
20.0
Ret
urn
LastQuarter
YearTo Date
1Year
3Years
5Years
7Years
10Years
American Funds EuPc -1.72 (50) -2.64 (32) -2.64 (32) 11.72 (21) 5.68 (47) 1.25 (23) 6.71 (18)
MSCI EAFE Growth Index (Net) -2.29 (66) -4.43 (50) -4.43 (50) 11.03 (38) 6.19 (39) 0.01 (63) 4.91 (73)
Median -1.72 -4.53 -4.53 10.74 5.64 0.46 5.87
2013 2012 2011 2010 2009 2008 2007American Funds EuPc 20.15 (26) 19.21 (37) -13.58 (50) 9.40 (67) 39.10 (15) -40.53 (15) 18.96 (24)MSCI EAFE Growth Index (Net) 22.55 (10) 16.86 (69) -12.11 (33) 12.25 (40) 29.36 (66) -42.70 (45) 16.45 (47)IM International Large Cap Growth Equity (MF) Median 18.31 18.41 -13.60 11.34 32.40 -43.70 16.14
3Years
EndingDec-2014
3Years
EndingDec-2013
3Years
EndingDec-2012
3Years
EndingDec-2011
3Years
EndingDec-2010
3Years
EndingDec-2009
3Years
EndingDec-2008
American Funds EuPc 11.72 (21) 7.37 (47) 4.07 (61) 9.56 (40) -3.27 (12) -0.53 (6) -4.82 (21)MSCI EAFE Growth Index (Net) 11.03 (38) 7.97 (33) 4.85 (39) 8.47 (69) -5.94 (47) -4.78 (52) -6.54 (48)IM International Large Cap Growth Equity (MF) Median 10.74 7.35 4.37 9.25 -6.08 -4.76 -6.83
American Funds EuPc 12/31/14
40INTEGRITY. BALANCE. OBJECTIVITY.

TOP 10 HOLDINGSPORTFOLIO CHARACTERISTICS
STYLE MAP (01/01/99 - 12/31/14)
SECTOR ALLOCATION
ASSET ALLOCATION
REGION ALLOCATION
TOP 5 COUNTRIES
UP/DOWN CAPTURE (01/01/10 - 12/31/14)
0.0% 50.0% 100.0% 150.0%
Convertibles
Cash
Other
Fixed Income
Equities
0.0%
0.0%
0.2%
10.3%
89.5%
Total Securities 429Avg. Market Cap $59,458 MillionP/E 24.67P/B 4.75Div. Yield 2.08%
Novo Nordisk A/S ORD 5.04 %Bayer AG ORD 2.46 %Softbank Corp ORD 2.29 %Novartis AG ORD 2.21 %Prudential PLC ORD 1.80 %Barclays PLC ORD 1.71 %Murata Manufacturing Co Ltd ORD 1.57 %Baidu Inc DR 1.46 %Associated British Foods PLC ORD 1.45 %Samsung Electronics Co Ltd ORD 1.42 %
Japan 12.15 %United Kingdom 11.75 %United States 9.44 %Germany 7.08 %India 6.79 %
3 Years 5 Yearsvs. MSCI EAFE Growth Index (Net)Beta 0.95 0.97
American Funds EuPc MSCI EAFE Growth Index (Net)
0.0 10.0 20.0 30.0 40.0 50.0 60.0
OtherFrontier Markets
Middle EastUnited Kingdom
Europe ex UKJapan
Pacific ex JapanEM Mid East+Africa
North AmericaEM Latin America
EM EuropeEM Asia
American Funds EuPc MSCI EAFE Growth Index (Net)
0.0 5.0 10.0 15.0 20.0 25.0 30.0
UtilitiesTelecommunication Services
MaterialsInformation Technology
IndustrialsHealth Care
FinancialsEnergy
Consumer StaplesConsumer Discretionary
Other
Style History Dec-2014
Average Style Exposure
Cap
italiz
atio
n
Manager Style
MSCI EAFE Growth Index
MSCI Emerging Markets IndexMSCI EAFE Small Cap
MSCI EAFE Value Index
American Funds EuPc
50.0
75.0
100.0
125.0
150.0
Up
Cap
ture
50.0 70.0 90.0 110.0 130.0 150.0Down Capture
American Funds EuPc 12/31/14
41INTEGRITY. BALANCE. OBJECTIVITY.

FUND INFORMATION
ROLLING 3 YEAR RETURN AND PERCENTILE RANKINGS
PEER GROUP ANALYSIS - IM U.S. Broad Market Core Fixed Income (MF)
CALENDAR YEAR RETURNS AND PERCENTILE RANKINGS
RISK VS. RETURN (5 YEARS*)
*If less than 5 years, data is since inception of fund share class.
Firm and Management:PIMCO was founded in 1971, and isone of the world's largest fixed incomemanagers, with a presence in everymajor bond market. The fund's portfoliomanagement team - Scott Mather isCIO U.S. Core Strategies, Mark Kieselis CIO Global Credit and Mihir Worah isCIO Real Return and Asset Allocation -is supported by the full spectrum ofPIMCO's global resources.
Investment Strategy:The fund aims to provide investors witha combination of income and capitalappreciation potential. It emphasizeshigher-quality, intermediate-term bondsand aims to avoid concentration risk bybeing more globally diversified thanmany core bond funds. It also hasconsiderable flexibility to respond tochanging economic conditions, helpingto manage risk and increase total returnpotential. Major shifts in portfoliostrategy are driven by secular andcyclical outlooks as opposed to short-term market events or aberrations ininterest rates.
Innovest's Assessment:The fund attempts to add value throughtop-down positioning and byaggressively pursuing relativelyattractive sectors of the bond market.The fund's total return approach allowsthem to diversify from heavily weightedsectors in the benchmark. Historically,their sector allocation decisions haveresulted in strong relativeoutperformance; however, it isimportant to note that the fund’sintermediate duration mandate couldbecome a headwind to performance ina rising interest rate environment.PIMCO also has the potential tounderperform when its macroeconomicforecast is materially wrong, either froma timing perspective or a fundamentalperspective. PIMCO's approach willnot always be lockstep with the broadbond market index.
0.0
1.5
3.0
4.5
6.0
7.5
Ret
urn
(%)
0.7 1.4 2.1 2.8 3.5 4.2 4.9Risk (Standard Deviation %)
Return StandardDeviation
PIMCO Tot Rtn Inst 5.14 3.55
BC Aggregate Idx 4.45 2.66
Median 4.69 2.75
-2.0
0.0
2.0
4.0
6.0
8.0
10.0
Ret
urn
LastQuarter
YearTo Date
1Year
3Years
5Years
7Years
10Years
PIMCO Tot Rtn Inst 1.31 (53) 4.69 (77) 4.69 (77) 4.25 (13) 5.14 (28) 6.30 (3) 5.99 (1)
BC Aggregate Idx 1.79 (7) 5.97 (27) 5.97 (27) 2.66 (68) 4.45 (60) 4.77 (46) 4.71 (35)
Median 1.35 5.54 5.54 3.09 4.69 4.68 4.43
2013 2012 2011 2010 2009 2008 2007PIMCO Tot Rtn Inst -1.92 (50) 10.35 (2) 4.16 (94) 8.86 (19) 13.87 (41) 4.82 (13) 9.08 (1)Barclays Aggregate Index -2.02 (55) 4.21 (81) 7.84 (11) 6.54 (69) 5.93 (90) 5.24 (10) 6.97 (9)IM U.S. Broad Market Core Fixed Income (MF) Median -1.94 6.04 6.66 7.25 12.24 -3.79 5.27
3Years
EndingDec-2014
3Years
EndingDec-2013
3Years
EndingDec-2012
3Years
EndingDec-2011
3Years
EndingDec-2010
3Years
EndingDec-2009
3Years
EndingDec-2008
PIMCO Tot Rtn Inst 4.25 (13) 4.08 (27) 7.76 (16) 8.89 (48) 9.12 (1) 9.20 (1) 5.94 (3)Barclays Aggregate Index 2.66 (68) 3.26 (61) 6.19 (68) 6.77 (82) 5.90 (48) 6.04 (26) 5.51 (7)IM U.S. Broad Market Core Fixed Income (MF) Median 3.09 3.52 6.70 8.80 5.81 5.11 1.68
PIMCO Tot Rtn Inst 12/31/14
42INTEGRITY. BALANCE. OBJECTIVITY.
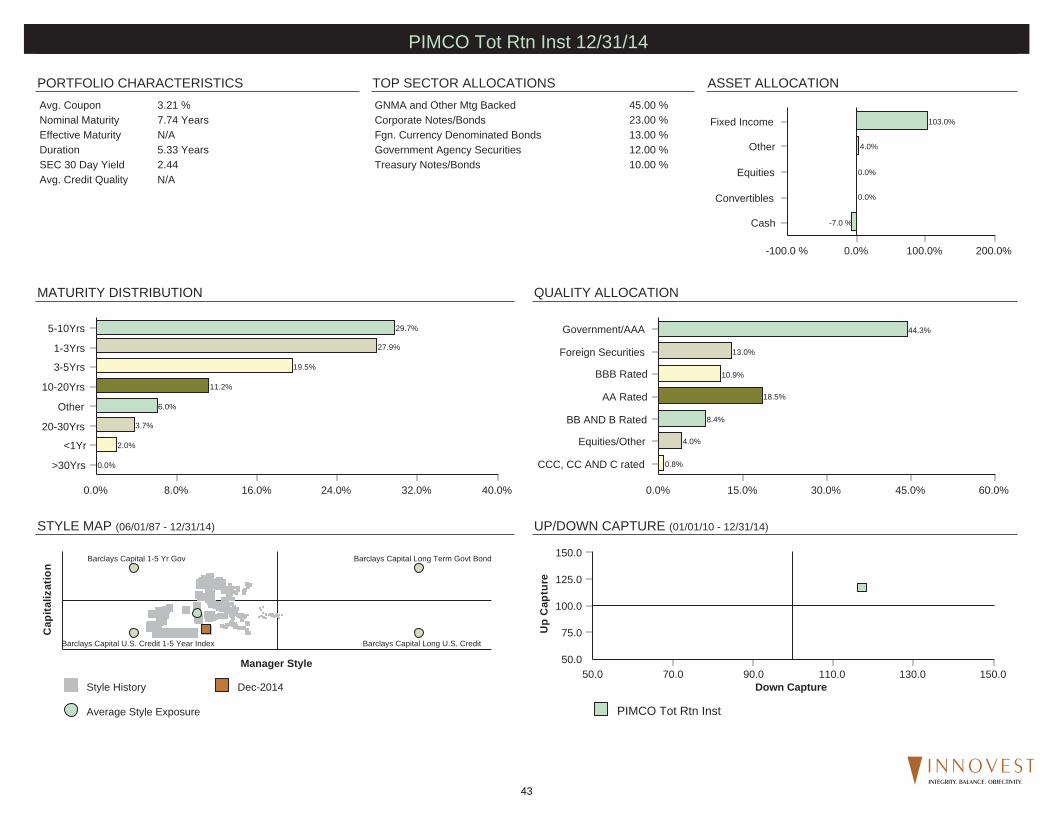
TOP SECTOR ALLOCATIONSPORTFOLIO CHARACTERISTICS
STYLE MAP (06/01/87 - 12/31/14)
QUALITY ALLOCATION
ASSET ALLOCATION
MATURITY DISTRIBUTION
UP/DOWN CAPTURE (01/01/10 - 12/31/14)
0.0% 100.0% 200.0%-100.0 %
Cash
Convertibles
Equities
Other
Fixed Income
-7.0 %
0.0%
0.0%
4.0%
103.0%
Avg. Coupon 3.21 %Nominal Maturity 7.74 YearsEffective Maturity N/ADuration 5.33 YearsSEC 30 Day Yield 2.44Avg. Credit Quality N/A
GNMA and Other Mtg Backed 45.00 %Corporate Notes/Bonds 23.00 %Fgn. Currency Denominated Bonds 13.00 %Government Agency Securities 12.00 %Treasury Notes/Bonds 10.00 %
0.0% 8.0% 16.0% 24.0% 32.0% 40.0%
>30Yrs
<1Yr
20-30Yrs
Other
10-20Yrs
3-5Yrs
1-3Yrs
5-10Yrs
0.0%
2.0%
3.7%
6.0%
11.2%
19.5%
27.9%
29.7%
0.0% 15.0% 30.0% 45.0% 60.0%
CCC, CC AND C rated
Equities/Other
BB AND B Rated
AA Rated
BBB Rated
Foreign Securities
Government/AAA
0.8%
4.0%
8.4%
18.5%
10.9%
13.0%
44.3%
PIMCO Tot Rtn Inst
50.0
75.0
100.0
125.0
150.0U
p C
aptu
re
50.0 70.0 90.0 110.0 130.0 150.0Down CaptureStyle History Dec-2014
Average Style Exposure
Cap
italiz
atio
n
Manager Style
Barclays Capital Long Term Govt Bond
Barclays Capital Long U.S. CreditBarclays Capital U.S. Credit 1-5 Year Index
Barclays Capital 1-5 Yr Gov
PIMCO Tot Rtn Inst 12/31/14
43INTEGRITY. BALANCE. OBJECTIVITY.

FUND INFORMATION
ROLLING 3 YEAR RETURN AND PERCENTILE RANKINGS
PEER GROUP ANALYSIS - IM U.S. High Yield Bonds (MF)
CALENDAR YEAR RETURNS AND PERCENTILE RANKINGS
RISK VS. RETURN (5 YEARS*)
*If less than 5 years, data is since inception of fund share class.
Firm and Management:William J. Morgan joined J.P. Morgan in2005. He is the high yield team leaderand the portfolio manager for allaccounts in the high yield, aggressiveincome high yield, and insurance asset"BB' default rating styles. He is amember of the High Yield ManagementReview Committee and is alsoresponsible for managing the HighYield Team's credit analysts. Prior tojoining the firm, he held the same roleat Banc One High Yield Partners, LLCand Pacholder Associates, Inc.
Investment Style:The team utilizes a flexible approachthat seeks to generate excess return byutilizing the full range of opportunitiespresented by the high yield market,from investment grade credits trading athigh yield spreads to distressed anddefaulted securities and post-reorganization debt securities.
Innovest's Assessment:The JPMorgan High Yield Fund hashistorically had an overweight allocationto BB and B-rated credits; therefore it islikely to underperform in markets wherelower-rated high yield credits (CCC andlower) perform well. The strategy islikely to outperform when higher qualityhigh yield credits are in favor or wheninvestors generally favor less riskyassets. Additionally, the strategy shouldperform well in market environmentswhere bottom-up fundamental creditresearch is rewarded.
2.0
4.0
6.0
8.0
10.0
12.0
Ret
urn
(%)
0.0 2.5 5.0 7.5 10.0 12.5Risk (Standard Deviation %)
Return StandardDeviation
JPMorgan High Yield 8.21 6.23
BC US Corp: High Yield 9.03 6.25
Median 7.90 6.28
-8.0
-4.0
0.0
4.0
8.0
12.0
16.0
Ret
urn
LastQuarter
YearTo Date
1Year
3Years
5Years
7Years
10Years
JPMorgan High Yield -0.55 (24) 2.67 (19) 2.67 (19) 8.02 (34) 8.21 (38) 7.93 (17) 7.32 (12)
BC US Corp: High Yield -1.00 (40) 2.45 (23) 2.45 (23) 8.43 (22) 9.03 (12) 8.76 (6) 7.74 (7)
Median -1.24 1.46 1.46 7.48 7.90 6.98 6.38
2013 2012 2011 2010 2009 2008 2007JPMorgan High Yield 6.94 (42) 14.81 (48) 2.65 (63) 14.67 (36) 48.45 (46) -22.54 (29) 2.18 (41)Barclays US Corp: High Yield 7.44 (29) 15.81 (29) 4.98 (16) 15.12 (28) 58.21 (11) -26.16 (59) 1.87 (50)IM U.S. High Yield Bonds (MF) Median 6.60 14.72 3.31 14.04 47.46 -25.02 1.85
3Years
EndingDec-2014
3Years
EndingDec-2013
3Years
EndingDec-2012
3Years
EndingDec-2011
3Years
EndingDec-2010
3Years
EndingDec-2009
3Years
EndingDec-2008
JPMorgan High Yield 8.02 (34) 8.02 (52) 10.56 (50) 20.45 (46) 9.66 (10) 5.52 (13) -3.71 (15)Barclays US Corp: High Yield 8.43 (22) 9.32 (10) 11.86 (8) 24.12 (5) 10.38 (6) 5.98 (8) -5.59 (50)IM U.S. High Yield Bonds (MF) Median 7.48 8.06 10.55 20.22 7.60 3.70 -5.64
JPMorgan High Yield 12/31/14
44INTEGRITY. BALANCE. OBJECTIVITY.

TOP SECTOR ALLOCATIONSPORTFOLIO CHARACTERISTICS
STYLE MAP (12/01/98 - 12/31/14)
QUALITY ALLOCATION
ASSET ALLOCATION
MATURITY DISTRIBUTION
UP/DOWN CAPTURE (01/01/10 - 12/31/14)
0.0% 50.0% 100.0% 150.0%
Other
Convertibles
Equities
Cash
Fixed Income
0.0%
0.1%
0.4%
2.7%
96.8%
Avg. Coupon N/ANominal Maturity N/AEffective Maturity 6.21 YearsDuration 5.10 YearsSEC 30 Day Yield 7.26Avg. Credit Quality B
Corporate Notes/Bonds 79.39 %US$ Denominated Fgn. Gvt. 16.25 %Preferred Stock-Non Convertible 1.06 %Common Stock 0.44 %Convertible Securities 0.09 %Asset Backed Securities 0.06 %Treasury Notes/Bonds 0.02 %
0.0% 15.0% 30.0% 45.0% 60.0%
>30Yrs
20-30Yrs
1-3Yrs
Other
10-20Yrs
<1Yr
5-10Yrs
3-5Yrs
0.0%
0.0%
0.0%
1.5%
4.0%
4.5%
42.8%
47.2%
0.0% 25.0% 50.0% 75.0% 100.0%
A Rated
Equities/Other
BBB Rated
Government/AAA
Not Rated
CCC, CC AND C rated
BB AND B Rated
0.0%
1.5%
2.2%
2.7%
3.4%
11.2%
79.0%
JPMorgan High Yield
50.0
75.0
100.0
125.0
150.0U
p C
aptu
re
50.0 70.0 90.0 110.0 130.0 150.0Down CaptureStyle History Dec-2014
Average Style Exposure
Cap
italiz
atio
n
Manager Style
Barclays Capital Long Term Govt Bond
Barclays Capital Long U.S. CreditBarclays Capital U.S. Credit 1-5 Year Index
Barclays Capital 1-5 Yr Gov
JPMorgan High Yield 12/31/14
45INTEGRITY. BALANCE. OBJECTIVITY.
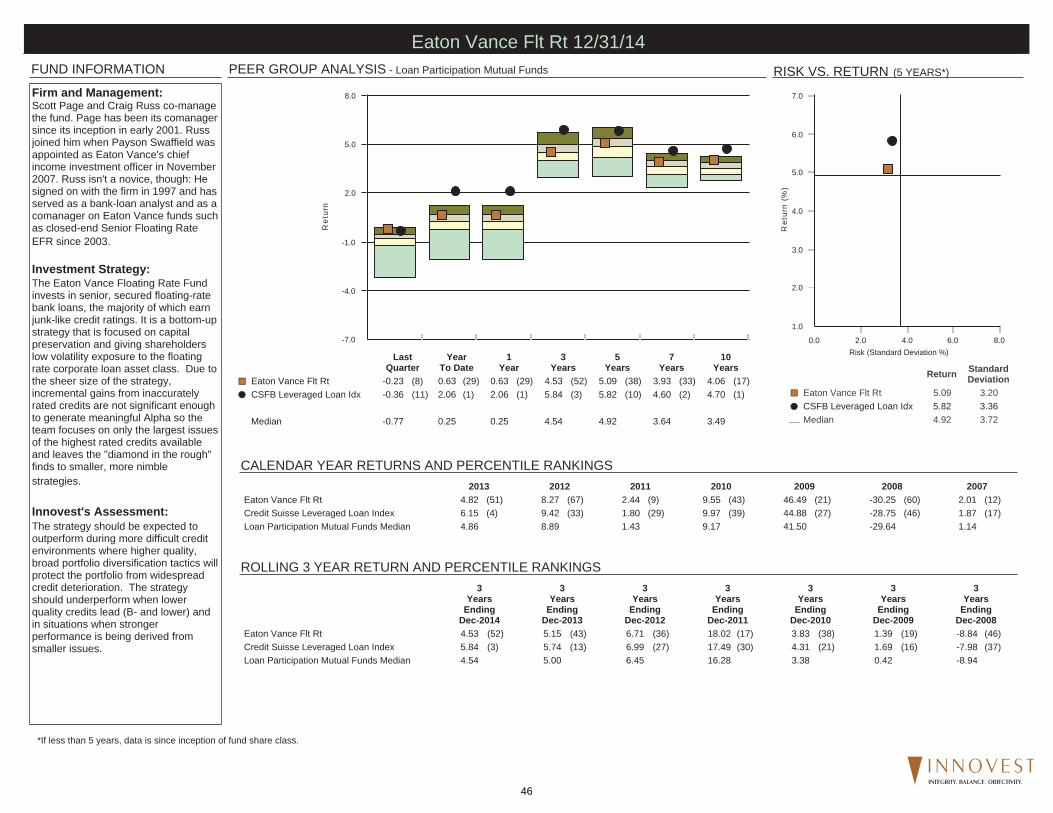
FUND INFORMATION
ROLLING 3 YEAR RETURN AND PERCENTILE RANKINGS
PEER GROUP ANALYSIS - Loan Participation Mutual Funds
CALENDAR YEAR RETURNS AND PERCENTILE RANKINGS
RISK VS. RETURN (5 YEARS*)
*If less than 5 years, data is since inception of fund share class.
Firm and Management:Scott Page and Craig Russ co-managethe fund. Page has been its comanagersince its inception in early 2001. Russjoined him when Payson Swaffield wasappointed as Eaton Vance's chiefincome investment officer in November2007. Russ isn't a novice, though: Hesigned on with the firm in 1997 and hasserved as a bank-loan analyst and as acomanager on Eaton Vance funds suchas closed-end Senior Floating RateEFR since 2003.
Investment Strategy:The Eaton Vance Floating Rate Fundinvests in senior, secured floating-ratebank loans, the majority of which earnjunk-like credit ratings. It is a bottom-upstrategy that is focused on capitalpreservation and giving shareholderslow volatility exposure to the floatingrate corporate loan asset class. Due tothe sheer size of the strategy,incremental gains from inaccuratelyrated credits are not significant enoughto generate meaningful Alpha so theteam focuses on only the largest issuesof the highest rated credits availableand leaves the "diamond in the rough"finds to smaller, more nimblestrategies.
Innovest's Assessment:The strategy should be expected tooutperform during more difficult creditenvironments where higher quality,broad portfolio diversification tactics willprotect the portfolio from widespreadcredit deterioration. The strategyshould underperform when lowerquality credits lead (B- and lower) andin situations when strongerperformance is being derived fromsmaller issues.
1.0
2.0
3.0
4.0
5.0
6.0
7.0
Ret
urn
(%)
0.0 2.0 4.0 6.0 8.0Risk (Standard Deviation %)
Return StandardDeviation
Eaton Vance Flt Rt 5.09 3.20
CSFB Leveraged Loan Idx 5.82 3.36
Median 4.92 3.72
-7.0
-4.0
-1.0
2.0
5.0
8.0
Ret
urn
LastQuarter
YearTo Date
1Year
3Years
5Years
7Years
10Years
Eaton Vance Flt Rt -0.23 (8) 0.63 (29) 0.63 (29) 4.53 (52) 5.09 (38) 3.93 (33) 4.06 (17)
CSFB Leveraged Loan Idx -0.36 (11) 2.06 (1) 2.06 (1) 5.84 (3) 5.82 (10) 4.60 (2) 4.70 (1)
Median -0.77 0.25 0.25 4.54 4.92 3.64 3.49
2013 2012 2011 2010 2009 2008 2007Eaton Vance Flt Rt 4.82 (51) 8.27 (67) 2.44 (9) 9.55 (43) 46.49 (21) -30.25 (60) 2.01 (12)Credit Suisse Leveraged Loan Index 6.15 (4) 9.42 (33) 1.80 (29) 9.97 (39) 44.88 (27) -28.75 (46) 1.87 (17)Loan Participation Mutual Funds Median 4.86 8.89 1.43 9.17 41.50 -29.64 1.14
3Years
EndingDec-2014
3Years
EndingDec-2013
3Years
EndingDec-2012
3Years
EndingDec-2011
3Years
EndingDec-2010
3Years
EndingDec-2009
3Years
EndingDec-2008
Eaton Vance Flt Rt 4.53 (52) 5.15 (43) 6.71 (36) 18.02 (17) 3.83 (38) 1.39 (19) -8.84 (46)Credit Suisse Leveraged Loan Index 5.84 (3) 5.74 (13) 6.99 (27) 17.49 (30) 4.31 (21) 1.69 (16) -7.98 (37)Loan Participation Mutual Funds Median 4.54 5.00 6.45 16.28 3.38 0.42 -8.94
Eaton Vance Flt Rt 12/31/14
46INTEGRITY. BALANCE. OBJECTIVITY.

TOP SECTOR ALLOCATIONSPORTFOLIO CHARACTERISTICS
STYLE MAP (02/01/01 - 12/31/14)
QUALITY ALLOCATION
ASSET ALLOCATION
MATURITY DISTRIBUTION
UP/DOWN CAPTURE (01/01/10 - 12/31/14)
0.0% 50.0% 100.0% 150.0%
Convertibles
Equities
Cash
Other
Fixed Income
0.0%
0.0%
1.8%
2.0%
96.2%
Avg. Coupon 4.41 %Nominal Maturity 5.16 YearsEffective Maturity N/ADuration 0.34 YearsSEC 30 Day Yield 3.84Avg. Credit Quality BB
Corporate Notes/Bonds 96.23 %
0.0% 15.0% 30.0% 45.0% 60.0% 75.0%
>30Yrs
20-30Yrs
10-20Yrs
Other
<1Yr
1-3Yrs
3-5Yrs
5-10Yrs
0.0%
0.8%
1.7%
2.0%
2.1%
6.5%
31.9%
55.0%
0.0% 25.0% 50.0% 75.0% 100.0% 125.0%
D Rated
BBB Rated
CCC, CC AND C rated
Government/AAA
Equities/Other
Not Rated
BB AND B Rated
0.5%
1.2%
1.4%
1.8%
2.0%
3.7%
89.4%
Eaton Vance Flt Rt
50.0
75.0
100.0
125.0
150.0U
p C
aptu
re
50.0 70.0 90.0 110.0 130.0 150.0Down CaptureStyle History Dec-2014
Average Style Exposure
Cap
italiz
atio
n
Manager Style
Barclays Capital Long Term Govt Bond
Barclays Capital Long U.S. CreditBarclays Capital U.S. Credit 1-5 Year Index
Barclays Capital 1-5 Yr Gov
Eaton Vance Flt Rt 12/31/14
47INTEGRITY. BALANCE. OBJECTIVITY.

FUND INFORMATION
INDEX ALLOCATION
PERFORMANCE OVER TIME
INVESTMENT STATISTICS (5 YEARS*)
RISK VS. RETURN (5 YEARS*)
*If less than 5 years, since inception time period was used.
Firm and Management:PIMCO was founded in 1971, and isone of the world's largest fixed incomemanagers, with a presence in everymajor bond market. In 2000, PIMCOwas acquired by Allianz SE (“Allianz”),a large global financial servicescompany based in Germany. PIMCOoperates as a separate andautonomous subsidiary of Allianz. Thelead portfolio manager for the Fund isDr. Mihir Worah, who has been theFund’s lead portfolio manager sinceDecember 2007. He has 13 years ofinvestment experience and holds aPh.D. in theoretical physics from theUniversity of Chicago.
Investment Strategy:The fund captures the performancepotential of commodities throughderivative exposure to the broad-basedBloomberg Commodity Index. The fundcollateralizes this exposure with aportfolio of Treasury Inflation-ProtectedSecurities (TIPS) that serve as anadditional source of return and inflationhedge. Management relies on the factthat, historically, commodities have hada positive correlation with inflation,typically appreciating when inflationspikes; they also have had low ornegative correlation with stocks andbonds, which can enhance portfoliodiversification.
Innovest Assessment:This strategy hinges on the thesis thatTIPS should significantly outperformthe T-Bill financing rate in thecommodity index swap over extendedperiods. For portfolios where inflation-linked securities are chosen as thecollateral, favorable market conditionsinclude: high or rising inflation coupledwith rising commodity prices, or fallingreal yields. There could be periods,however, where TIPS may decline invalue if interest rates rise, and may beparticularly sensitive if real interestrates rise rapidly.
PIMCO Commodity RR
Bloomberg Commodity Index Total Return
-6.3
-5.4
-4.5
-3.6
-2.7
-1.8
Ret
urn
(%)
14.4 15.3 16.2 17.1 18.0Risk (Standard Deviation %)
PIMCO Commodity RR Bloomberg Commodity Index Total Return
-25.0
-20.0
-15.0
-10.0
-5.0
0.0
Ret
urn
(%)
LastQuarter
2014 1Year
3Years
5Years
7Years
10Years
-12.1
-17.0 -17.0
-9.4
-5.5
-7.6
-1.9
-14.2
-18.1 -18.1
-9.7
-3.3
-5.6
-0.3
LastQuarter
YearTo Date
1Year
3Years
5Years
7Years
10Years
PIMCO Commodity RR -14.18 -18.06 -18.06 -9.75 -3.35 -5.59 -0.33Bloomberg Commodity Index Total Return -12.10 -17.01 -17.01 -9.43 -5.53 -7.58 -1.86
2013 2012 2011 2010 2009 2008 2007 2006 2005 2004PIMCO Commodity RR -14.81 5.31 -7.56 24.13 39.91 -43.33 23.80 -3.04 20.50 16.36Bloomberg Commodity Index Total Return -9.52 -1.06 -13.32 16.83 18.91 -35.65 16.23 2.07 21.36 9.15
Alpha Beta ActualCorrelation
UpMarketCapture
DownMarketCapture
InceptionDate
PIMCO Commodity RR 2.98 1.08 0.98 119.94 105.01 07/01/2002Bloomberg Commodity Index Total Return 0.00 1.00 1.00 100.00 100.00 07/01/2002
0.0
10.0
20.0
30.0
40.0
Industr
ia l M et
a ls
Energy
Gr ains
L iv esto
ck
Precious
M eta ls
So fts
18.0
32.0
16.0
6.0
16.012.0
PIMCO Commodity RR 12/31/14
48INTEGRITY. BALANCE. OBJECTIVITY.

THIS PAGE LEFT INTENTIONALLY BLANK
49INTEGRITY. BALANCE. OBJECTIVITY.

FUND INFORMATION
ROLLING 3 YEAR RETURN AND PERCENTILE RANKINGS
PEER GROUP ANALYSIS - IM U.S. GIC/Stable Value (SA+CF)
CALENDAR YEAR RETURNS AND PERCENTILE RANKINGS
RISK VS. RETURN (5 YEARS*)
*If less than 5 years, data is since inception of fund share class.
Investment StrategyThe PLUS Fund's investment strategiesare based on a structured anddiversified multi-product, multi-managerapproach. The PLUS Fund investsprimarily in a diversified portfolio ofstable value investment contracts andfixed income securities that backcertain stable value investmentcontracts. Cash equivalents are held, inpart, to provide liquidity for payouts.The composition of the PLUS Fundportfolio and its allocations to variousstable value investments and fixedincome investment sectors isdetermined based on prevailingeconomic and capital marketconditions, relative value analysis, andother factors.
1.0
1.5
2.0
2.5
3.0
3.5
Ret
urn
(%)
-0.2 0.0 0.2 0.4 0.6 0.8Risk (Standard Deviation %)
Return StandardDeviation
Vantage Trust Plus 3.07 0.27
Ryan 3 Yr GIC Mstr 1.90 0.48
Median 2.30 0.38
-1.0
-0.1
0.8
1.7
2.6
3.5
4.4
5.3
Ret
urn
LastQuarter
YearTo Date
1Year
3Years
5Years
7Years
10Years
Vantage Trust Plus 0.60 (5) 2.39 (4) 2.39 (4) 2.67 (1) 3.07 (7) 3.52 (5) 3.98 (5)
Ryan 3 Yr GIC Mstr 0.26 (97) 1.03 (98) 1.03 (98) 1.19 (100) 1.90 (91) 2.68 (58) 3.02 (90)
Median 0.41 1.54 1.54 1.76 2.30 2.78 3.42
2013 2012 2011 2010 2009 2008 2007Vantage Trust Plus 2.59 (1) 3.03 (9) 3.50 (23) 3.85 (35) 4.16 (24) 5.14 (4) 5.20 (16)Ryan 3 Yr GIC Mstr 1.06 (92) 1.48 (99) 2.44 (59) 3.53 (46) 4.49 (12) 4.79 (31) 4.52 (98)IM U.S. GIC/Stable Value (SA+CF) Median 1.65 2.32 2.85 3.48 3.68 4.65 4.94
3Years
EndingDec-2014
3Years
EndingDec-2013
3Years
EndingDec-2012
3Years
EndingDec-2011
3Years
EndingDec-2010
3Years
EndingDec-2009
3Years
EndingDec-2008
Vantage Trust Plus 2.67 (1) 3.04 (1) 3.46 (27) 3.84 (23) 4.38 (19) 4.83 (12) 5.13 (11)Ryan 3 Yr GIC Mstr 1.19 (100) 1.66 (96) 2.48 (77) 3.48 (38) 4.27 (23) 4.60 (26) 4.36 (95)IM U.S. GIC/Stable Value (SA+CF) Median 1.76 2.22 2.90 3.29 3.95 4.45 4.79
Vantage Trust Plus 12/31/14
50INTEGRITY. BALANCE. OBJECTIVITY.

Financial Strength:
Information as of 12/31/2013
Information as of 9/30/2014
Information as of 9/30/2014
AA‐
8.3%18.0%5.7%18.7% A1
AaaA1A1
AA+A+A+
Vantage Trust PLUS
Investment Contract Issuers % of Wrapped Assets13.2%
S&P AA‐
Moody'sA1
New York Life Ins. Co. Pacific Life Ins. Co. Principal Life Ins. Co.
Prudential Ins. Co. of America
Monumental Life Ins. Co.
8.9%
8.0%
26.1%57.1%
Portfolio Allocation
Cash Buffer
Shorter Duration Focus
Ladder Maturity Focus
Total Return Focus
2007 2008 2009 2010 2011 2012 2013 2014 YTD
Market‐to‐Book 99.88% 95.18% 99.74% 101.37% 102.42% 103.22% 100.60% 101.21%
80.00%
85.00%
90.00%
95.00%
100.00%
105.00%
Historical Market‐to‐Book Values
Market‐to‐Book
Organization:Founded in 1972, ICMA‐RC's mission is to help building retirement security for public employees. ICMA Description:The PLUS Fund's investment strategies are based on a structured and diversified multi‐product, multi‐manager approach. The PLUS Fund invests primarily in a diversified portfolio of stable value investment contracts and fixed income securities that back certain stable value investment contracts. Cash equivalents are held, in part, to provide liquidity for payouts. The compostion of the PLUS fund and its allocations to vaious stable value investments and fixed income invesment sectors is determined based on prevailing economic and capital market condtions, relative value
51INTEGRITY. BALANCE. OBJECTIVITY.

A+AA‐A2
ICMA‐RC VantageTrust Retirement Income Advantage Fund
‐ Participants can choose between a single benefit option and a spousal benefit option.
‐ Single Benefit Option: participant will receive the annual lifetime withdrawal amount for the rest of his/her life, upon death remaining assets in the Fund will be distributed to beneficiaries.
Prudential Retirement Insurance & Annuity Company
‐ The promise that the participant will continue to receive income for life following retirement is only as good as the insurance company making the promise. Therefore, it is important to evaluate and monitor the financial viability of the insurance company.
‐ Spousal Benefit Option: Participant will receive annual lifetime withdrawal amount for rest of his/her life and, upon participant's death, the surviving spouse will be entitled to the annual lifetime withdrawal amount for the rest of his/her life.
A t L k I Si l B fit S l B fit
Insurer RatingsA.M. Best
Standard and Poor'sM d '
Annual Lifetime Withdrawal Amounts:
2nd of 15 ratings ‐ superior2nd of 10 ratings ‐ very strong6th f 21 ti i
Organization:In 1972 the ICMA Retirement Corporation (ICMA‐RC) was established by the International City/County Management Association (ICMA). ICMA‐RC is an independent and non‐profit corporation that provides defined contribution plan administration, investment management and educational services to public sector employers and their employees.
Description: The primary objective of the VantageTrust Retirement IncomeAdvantage Fund is to provide a guaranteed lifetime income feature to participants. This fund is also known as a guaranteed minimum withdrawal benefit (GMWB). The GMWB feature is similar to an insurance policy where participants pay a fee to an insurance company in exchange for the insurance company's promise to pay the participant a guaranteed benefit throughout retirement equal to a percentage of the participant's account balance, typically calculated as the total of their contributions plus any market appreciation as of a specified date such as the participant’s date of birth or investment anniversary. The primary purpose of GMWB features is to provide participants with a minimum guaranteed income for their lives, regardless of how their investments perform and regardless of fluctuations in the market value of their account. Every year, on the participant’s date of birth or investment anniversary, the current market value in the Fund is compared with the highest birthday or anniversary value on record for the participant's account, and the higher value will be used as the participant’s market value in which the lifetime annual withdrawal amount is calculated from. Once a participant begins to receive withdrawals, they will be entitled to withdraw their lifetime annual withdrawal amount for the rest of their life, regardless of their market value in the fund. The primary value of the GMWB is the insurance company's promise that the participant will continue to receive income for life following retirement, even if the participant's account balance is depleted.
A2
A+
0.72%
1.00%
1.72%
Information as of 3/31/2014
70 or older 5.75% 5.25%
Age at Lock‐In Single Benefit Spousal Benefit Moody's
4.50%
3.75%
5.00%
4.25%
65 ‐ 69
55 ‐ 64 Fitch
6th of 21 ratings ‐ superior
3rd of 9 ratings ‐ strong
Total annual cost assuming $100,000 balance:
$1,720
Underlying Investments
• A balanced fund serves as the VantageTrust Retirement IncomeAdvantage Fund's underlying investment. The underlying balanced fund is comprised of both actively and passively managed, proprietary mutual funds as well as an additional fixed income fund managed by Prudential.
Fees & Expenses: Underlying investment management fees:
Guarantee fee:
Total annual cost (%):
25%
20%
15%
10%
30%
Vantagepoint Broad Market Index*
Vantagepoint Growth & Income*
Vantagepoint International*
Vantagepoint Inflation Protected Securities* Prudential Core Conservative Intermediate Bond
* passively managed strategy
52INTEGRITY. BALANCE. OBJECTIVITY.

Passive Portfolios Weight (%)Jul-1990Barclays Aggregate Index 35.00MSCI EAFE (net) Index 15.00Russell 2000 Index 15.00S&P 500 Index 35.00
Apr-2001Barclays Aggregate Index 24.00MSCI EAFE (net) Index 15.00Russell 2000 Index 20.00S&P 500 Index 41.00
Jan-200270% S&P/30% BC Aggr 50.00MSCI EAFE (net) Index 15.00Russell 2000 Index 10.00Barclays Aggregate Index 15.00Russell Midcap Index 10.00
Apr-2002Barclays Aggregate Index 15.00MSCI EAFE (net) Index 15.00Russell 2000 Index 10.00Russell Midcap Index 10.0070% S&P/30% BC Aggr 50.00
Oct-2005Barclays Aggregate Index 15.00MSCI EAFE (net) Index 15.00Bloomberg Commodity Index Total Return 2.00Russell Midcap Index 7.00Russell 2000 Index 7.0070% S&P/30% BC Aggr 54.00
Jan-2006Barclays Aggregate Index 13.50MSCI EAFE (net) Index 15.00Russell Midcap Index 7.00Russell 2000 Index 7.00Bloomberg Commodity Index Total Return 3.5070% S&P/30% BC Aggr 54.00
Passive Portfolios Weight (%)Apr-2006Barclays Aggregate Index 12.00MSCI EAFE (net) Index 15.00Bloomberg Commodity Index Total Return 5.00Russell Midcap Index 7.00Russell 2000 Index 7.0070% S&P/30% BC Aggr 54.00
Oct-200770% S&P/30% BC Aggr 54.00Russell Midcap Index 7.00Russell 2000 Index 7.00MSCI EAFE (net) Index 15.00Barclays Aggregate Index 12.00Bloomberg Commodity Index Total Return 5.00
Apr-201070% S&P/30% BC Aggr 52.00Russell Midcap Index 7.00Russell 2000 Index 7.00MSCI EAFE (net) Index 15.00Barclays Aggregate Index 4.00Barclays US Corp: High Yield 3.00CSFB Leveraged Loan 7.00Bloomberg Commodity Index Total Return 5.00
Apr-201270% S&P/30% BC Aggr 52.00Russell Midcap Index 7.00Russell 2000 Index 7.00MSCI EAFE (net) Index 15.00Barclays Aggregate Index 4.00Barclays US Corp: High Yield 5.00CSFB Leveraged Loan 5.00Bloomberg Commodity Index Total Return 5.00
Custom Benchmark Allocations Over Time
53INTEGRITY. BALANCE. OBJECTIVITY.
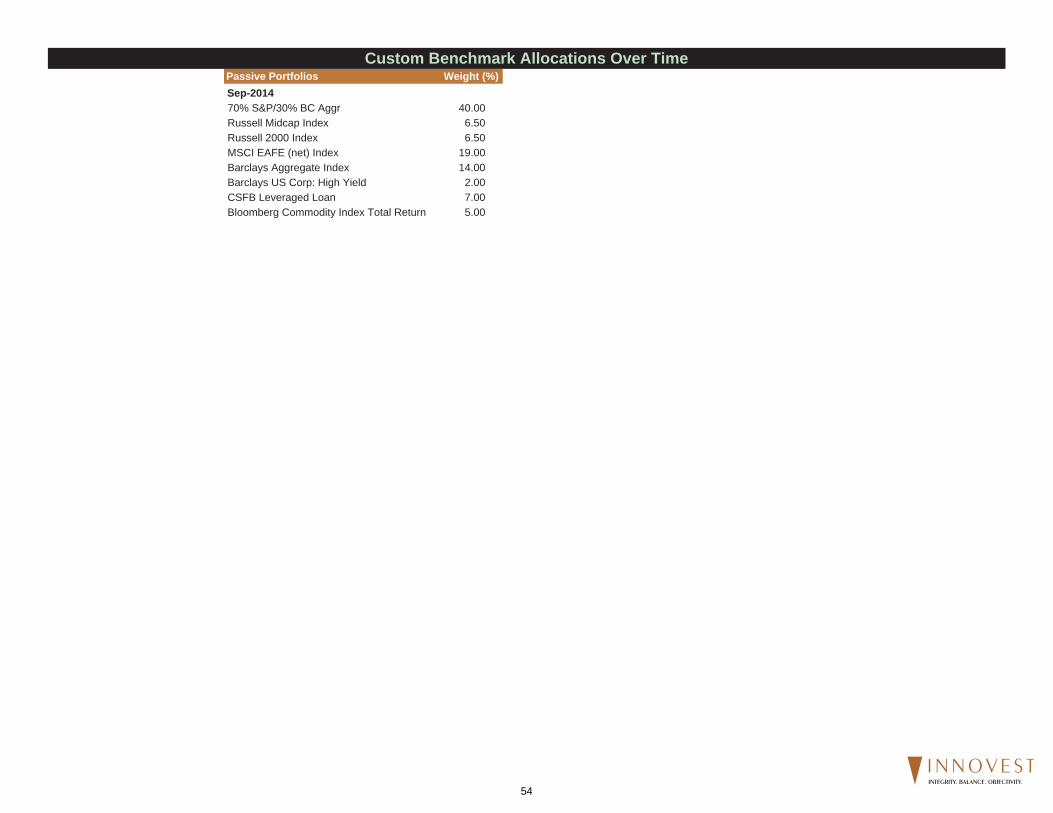
Custom Benchmark Allocations Over TimePassive Portfolios Weight (%)Sep-201470% S&P/30% BC Aggr 40.00Russell Midcap Index 6.50Russell 2000 Index 6.50MSCI EAFE (net) Index 19.00Barclays Aggregate Index 14.00Barclays US Corp: High Yield 2.00CSFB Leveraged Loan 7.00Bloomberg Commodity Index Total Return 5.00
54INTEGRITY. BALANCE. OBJECTIVITY.
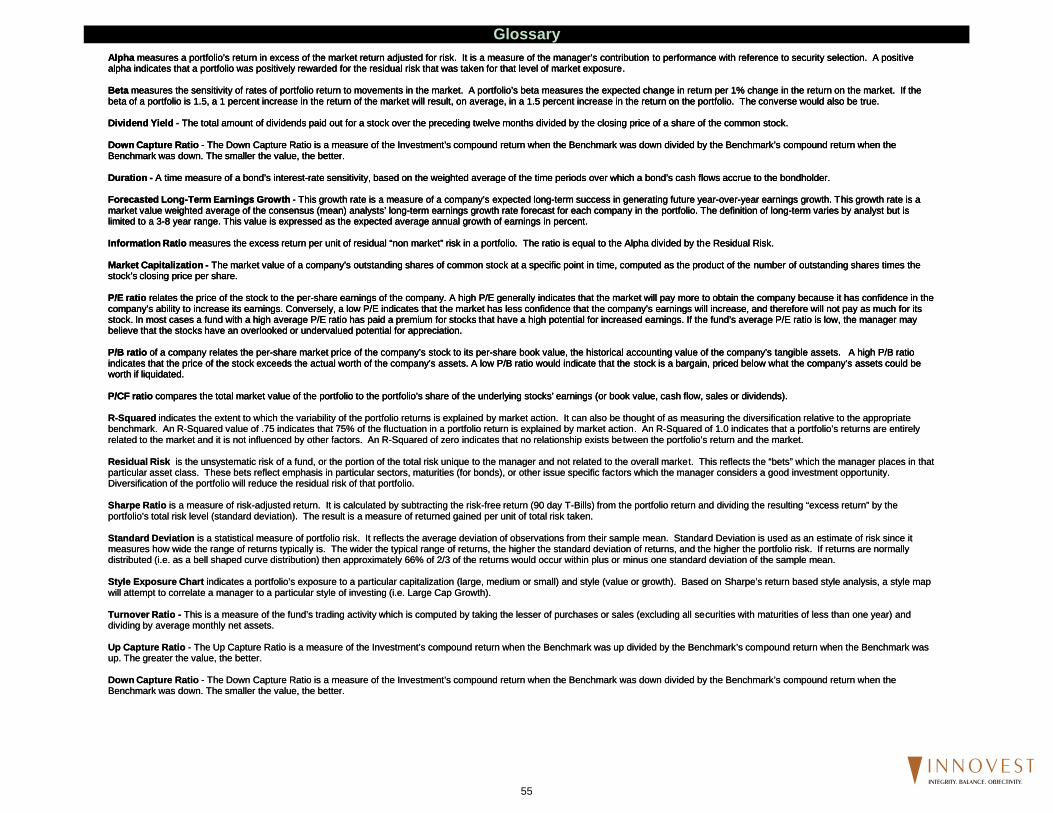
GlossaryAlpha measures a portfolio’s return in excess of the market return adjusted for risk. It is a measure of the manager’s contribution to performance with reference to security selection. A positive alpha indicates that a portfolio was positively rewarded for the residual risk that was taken for that level of market exposure.
Beta measures the sensitivity of rates of portfolio return to movements in the market. A portfolio’s beta measures the expected change in return per 1% change in the return on the market. If the beta of a portfolio is 1.5, a 1 percent increase in the return of the market will result, on average, in a 1.5 percent increase in the return on the portfolio. The converse would also be true.
Dividend Yield - The total amount of dividends paid out for a stock over the preceding twelve months divided by the closing price of a share of the common stock.
Down Capture Ratio - The Down Capture Ratio is a measure of the Investment’s compound return when the Benchmark was down divided by the Benchmark’s compound return when the Benchmark was down. The smaller the value, the better.
Duration - A time measure of a bond’s interest-rate sensitivity, based on the weighted average of the time periods over which a bond’s cash flows accrue to the bondholder.
Forecasted Long-Term Earnings Growth - This growth rate is a measure of a company’s expected long-term success in generating future year-over-year earnings growth. This growth rate is a market value weighted average of the consensus (mean) analysts’ long-term earnings growth rate forecast for each company in the portfolio. The definition of long-term varies by analyst but is limited to a 3-8 year range. This value is expressed as the expected average annual growth of earnings in percent.
Information Ratio measures the excess return per unit of residual “non market” risk in a portfolio. The ratio is equal to the Alpha divided by the Residual Risk.
Market Capitalization - The market value of a company’s outstanding shares of common stock at a specific point in time, computed as the product of the number of outstanding shares times the stock’s closing price per share.
P/E ratio relates the price of the stock to the per-share earnings of the company. A high P/E generally indicates that the market will pay more to obtain the company because it has confidence in the company’s ability to increase its earnings. Conversely, a low P/E indicates that the market has less confidence that the company’s earnings will increase, and therefore will not pay as much for its stock. In most cases a fund with a high average P/E ratio has paid a premium for stocks that have a high potential for increased earnings. If the fund’s average P/E ratio is low, the manager may believe that the stocks have an overlooked or undervalued potential for appreciation.
P/B ratio of a company relates the per-share market price of the company’s stock to its per-share book value, the historical accounting value of the company’s tangible assets. A high P/B ratio indicates that the price of the stock exceeds the actual worth of the company’s assets. A low P/B ratio would indicate that the stock is a bargain, priced below what the company’s assets could be worth if liquidated.
P/CF ratio compares the total market value of the portfolio to the portfolio’s share of the underlying stocks’ earnings (or book value, cash flow, sales or dividends).
Alpha measures a portfolio’s return in excess of the market return adjusted for risk. It is a measure of the manager’s contribution to performance with reference to security selection. A positive alpha indicates that a portfolio was positively rewarded for the residual risk that was taken for that level of market exposure.
Beta measures the sensitivity of rates of portfolio return to movements in the market. A portfolio’s beta measures the expected change in return per 1% change in the return on the market. If the beta of a portfolio is 1.5, a 1 percent increase in the return of the market will result, on average, in a 1.5 percent increase in the return on the portfolio. The converse would also be true.
Dividend Yield - The total amount of dividends paid out for a stock over the preceding twelve months divided by the closing price of a share of the common stock.
Down Capture Ratio - The Down Capture Ratio is a measure of the Investment’s compound return when the Benchmark was down divided by the Benchmark’s compound return when the Benchmark was down. The smaller the value, the better.
Duration - A time measure of a bond’s interest-rate sensitivity, based on the weighted average of the time periods over which a bond’s cash flows accrue to the bondholder.
Forecasted Long-Term Earnings Growth - This growth rate is a measure of a company’s expected long-term success in generating future year-over-year earnings growth. This growth rate is a market value weighted average of the consensus (mean) analysts’ long-term earnings growth rate forecast for each company in the portfolio. The definition of long-term varies by analyst but is limited to a 3-8 year range. This value is expressed as the expected average annual growth of earnings in percent.
Information Ratio measures the excess return per unit of residual “non market” risk in a portfolio. The ratio is equal to the Alpha divided by the Residual Risk.
Market Capitalization - The market value of a company’s outstanding shares of common stock at a specific point in time, computed as the product of the number of outstanding shares times the stock’s closing price per share.
P/E ratio relates the price of the stock to the per-share earnings of the company. A high P/E generally indicates that the market will pay more to obtain the company because it has confidence in the company’s ability to increase its earnings. Conversely, a low P/E indicates that the market has less confidence that the company’s earnings will increase, and therefore will not pay as much for its stock. In most cases a fund with a high average P/E ratio has paid a premium for stocks that have a high potential for increased earnings. If the fund’s average P/E ratio is low, the manager may believe that the stocks have an overlooked or undervalued potential for appreciation.
P/B ratio of a company relates the per-share market price of the company’s stock to its per-share book value, the historical accounting value of the company’s tangible assets. A high P/B ratio indicates that the price of the stock exceeds the actual worth of the company’s assets. A low P/B ratio would indicate that the stock is a bargain, priced below what the company’s assets could be worth if liquidated.
P/CF ratio compares the total market value of the portfolio to the portfolio’s share of the underlying stocks’ earnings (or book value, cash flow, sales or dividends).
R-Squared indicates the extent to which the variability of the portfolio returns is explained by market action. It can also be thought of as measuring the diversification relative to the appropriate benchmark. An R-Squared value of .75 indicates that 75% of the fluctuation in a portfolio return is explained by market action. An R-Squared of 1.0 indicates that a portfolio’s returns are entirely related to the market and it is not influenced by other factors. An R-Squared of zero indicates that no relationship exists between the portfolio’s return and the market.
Residual Risk is the unsystematic risk of a fund, or the portion of the total risk unique to the manager and not related to the overall market. This reflects the “bets” which the manager places in that particular asset class. These bets reflect emphasis in particular sectors, maturities (for bonds), or other issue specific factors which the manager considers a good investment opportunity. Diversification of the portfolio will reduce the residual risk of that portfolio.
Sharpe Ratio is a measure of risk-adjusted return. It is calculated by subtracting the risk-free return (90 day T-Bills) from the portfolio return and dividing the resulting “excess return” by the portfolio’s total risk level (standard deviation). The result is a measure of returned gained per unit of total risk taken.
Standard Deviation is a statistical measure of portfolio risk. It reflects the average deviation of observations from their sample mean. Standard Deviation is used as an estimate of risk since it measures how wide the range of returns typically is. The wider the typical range of returns, the higher the standard deviation of returns, and the higher the portfolio risk. If returns are normally distributed (i.e. as a bell shaped curve distribution) then approximately 66% of 2/3 of the returns would occur within plus or minus one standard deviation of the sample mean.
Style Exposure Chart indicates a portfolio’s exposure to a particular capitalization (large, medium or small) and style (value or growth). Based on Sharpe’s return based style analysis, a style map will attempt to correlate a manager to a particular style of investing (i.e. Large Cap Growth).
Turnover Ratio - This is a measure of the fund’s trading activity which is computed by taking the lesser of purchases or sales (excluding all securities with maturities of less than one year) and dividing by average monthly net assets.
Up Capture Ratio - The Up Capture Ratio is a measure of the Investment’s compound return when the Benchmark was up divided by the Benchmark’s compound return when the Benchmark was up. The greater the value, the better.
Down Capture Ratio - The Down Capture Ratio is a measure of the Investment’s compound return when the Benchmark was down divided by the Benchmark’s compound return when the Benchmark was down. The smaller the value, the better.
55INTEGRITY. BALANCE. OBJECTIVITY.

Organization Asset BasePct. Owned by Employees CurrentBoutique vs. Institutional Growth of AUMRecent Changes in Ownership Capacity ConstraintsManagement Investment in Firm’s Products Soft ClosedSpecialized vs. All in One Re-opening of Products
People PerformanceSize of Team Short Term vs. Benchmark and Style GroupStructure of Team Long Term vs. Benchmark and Style GroupExperience of Team Consistency – Relative/Absolute/Risk AdjustedTurnover of Key MembersGrowth of Team with Assets
Philosophy/Process ExpensesStyle Consistency (Growth/Value, Market Cap) Cost vs. CompetitorsDomestic/Int’l drift
Examples of things that would cause concern resulting in a YELLOW or RED box include but not limited to:
6) EXPENSES - A fund or product that is substantially above the median expense ratio or management fee would be a cause for concern.
Fund Analysis Overview Key
1) ORGANIZATION - A change in ownership whereby it is unclear what the structure of the new organization will be, how will key personnel be compensated, and what type of employment contracts are in place to keep key decision makers.
2) PEOPLE - A change in portfolio manager would be a cause for concern. We would assess the new talent taking over. Is the new portfolio manager a current member of the team or is it someone new from outside the group or organization.
3) PHILOSOPHY/PROCESS - A change in portfolio characteristics would be a cause for concern. For example, if a growth style manager suddenly starts investing in value names during a value rally or if a small cap portfolio was migrating into midcap names due to asset growth.
4) ASSET BASE - A small cap fund with more than $3 billion in assets would be a cause for concern or a fund that continues to add assets as it becomes clear the portfolio management team can not handle the inflows. A sign of this would be a large increase in the cash position of the portfolio.
5) PERFORMANCE - A product that fails to outperform either the index and/or the median manager on a consistent basis (at least 50% of the time) would be a cause for concern. Short term and long term performance is considered both on an absolute basis and relative basis in addition to risk-adjusted measures.
Each of the 6 criteria are evaluated on an individual basis and subjective based on Innovest’s assessment. Below are examples of the many factors under each category we consider when making an assessment.
56INTEGRITY. BALANCE. OBJECTIVITY.
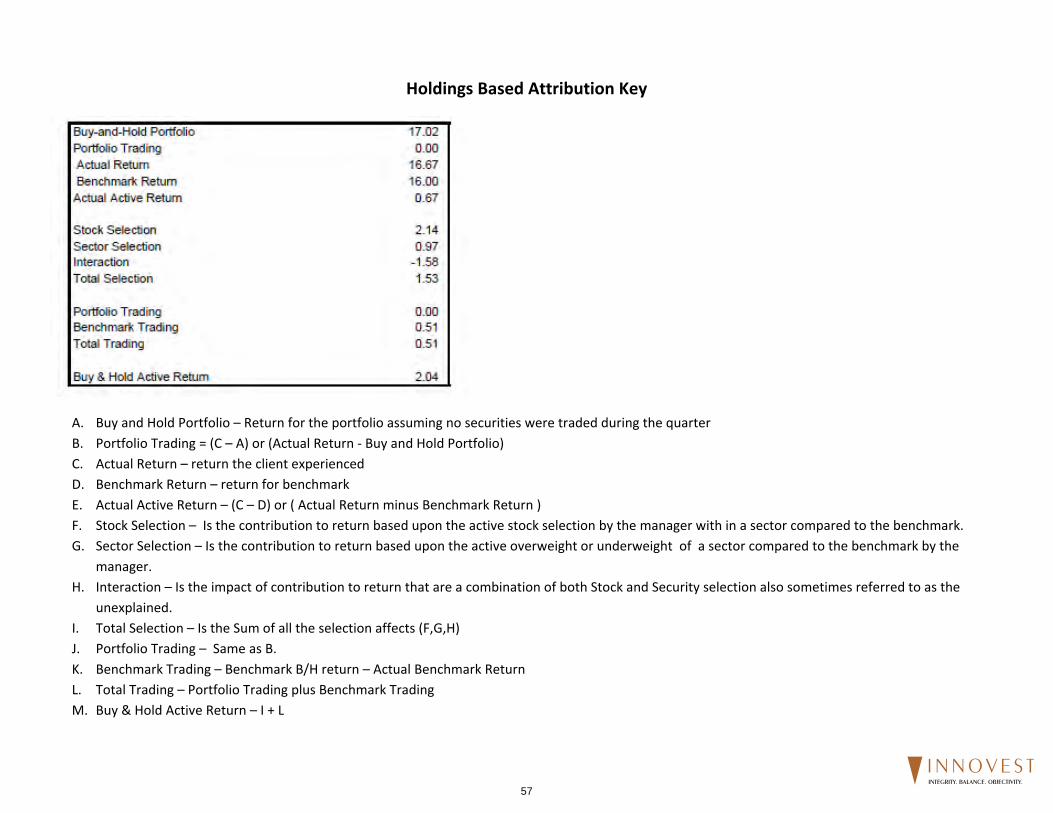
Holdings Based Attribution Key
A. Buy and Hold Portfolio – Return for the portfolio assuming no securities were traded during the quarter B. Portfolio Trading = (C – A) or (Actual Return ‐ Buy and Hold Portfolio) C. Actual Return – return the client experienced D. Benchmark Return – return for benchmark E. Actual Active Return – (C – D) or ( Actual Return minus Benchmark Return ) F. Stock Selection – Is the contribution to return based upon the active stock selection by the manager with in a sector compared to the benchmark. G. Sector Selection – Is the contribution to return based upon the active overweight or underweight of a sector compared to the benchmark by the
manager. H. Interaction – Is the impact of contribution to return that are a combination of both Stock and Security selection also sometimes referred to as the
unexplained. I. Total Selection – Is the Sum of all the selection affects (F,G,H) J. Portfolio Trading – Same as B. K. Benchmark Trading – Benchmark B/H return – Actual Benchmark Return L. Total Trading – Portfolio Trading plus Benchmark Trading M. Buy & Hold Active Return – I + L
57INTEGRITY. BALANCE. OBJECTIVITY.
Disclaimer The preceding statistical analysis was prepared by Innovest Portfolio Solutions LLC with data provided by Investment Metrics (IM), Lipper and Morningstar, Inc. All Rights Reserved. The investment products discussed are not insured by the FDIC and involve investment risk including the possible loss of all principal. The information contained herein: (1) is proprieta ry to the v endors listed above and/or its content providers; (2) may not be c opied or distributed; and (3) is not w arranted to be accurate, complete or timely. None of the vendors nor its content providers are respons ible for any damages or losses arising from any use of this information. Past performance is no guarantee of future results. Innovest compiles the information utilizing secondary data from statements provided by the plan trustee and/or custodian/ This report may also contain returns and valuations from outside sources as directed b y the client. Innovest assumes no respons ibility for the accuracy of these valuations or return methodologies. Reasonable care has been take n to assure the accuracy of the computer software and databases. Innovest disclaims responsibility, financial or ot herwise for t he accuracy and completeness of this report. Copyright 2015 by Innovest Portfolio Solutions LLC Inc. Note: Actual client mutual fund returns are reflected on the table of returns page. Fund pages subsequent to the table of returns reflect the representative mutual fund with the longest track record and may not be the actual share class held by the client. “Copyright 2015, Standard & Poor’s Financial Services LLC. Reproduction of S&P Index Services in any form is prohibited except with the prior written permission of S&P. S&P does not guarantee the accuracy, adequacy, completeness or availability of any information and is not responsible for an y errors or omissions, regardless of the cause or for the r esults obtained from the use of such information. S&P DISCLAIMS ANY AND ALL EXPRESS OR IMPLIED WARRANTIES, INCLUDING, BUT NOT LIMITED TO, ANY WARRANTIES OF MERCHANTABILITY OR FITNESS FOR A PAR TICULAR PURPOSE OR USE. In no event shall S&P be liable f or any direct, indirect, special or consequential damages, costs, expenses, legal fees, or losses (including lost income or lost profit and opportunity costs) in connection with subscriber’s or others’ use of S&P Index Services (2015) Copyright MSCI 2015. Unpublished. All Rights R eserved. This information may only be used for your internal use, may not be reproduced or re-disseminated in any form and m ay not be used to create any financial instruments or products or an y indices. This information is provided on an “as is” basis and the user of this informa tion assumes the entire risk of any use it ma y make or permit t o be made of thi s information. Neither MSCI, an y or its affiliates o r any other person involved in or related to compiling, computing or creating this information makes any express or implied warranties or representations with respect to such information or the results to be ob tained by the use thereof, and MSCI, its affiliates and each such other person hereby expressly disclaim all warr anties (including, without limitation, all warranties of o riginality, accuracy, completeness, timeliness, non-infringement, merchantability and fitness for a particular purpose) with respect to this information. Without lim iting any of the foregoing, in no ev ent shall MSCI, any of its affiliat es or any other person involved in or related to compiling, computing or creating this information have any liability for any direct, indirect, special, incidental, punit ive, consequential or an y other damages (including, without limitation, lost profits) even if notified of, or if it might otherwise have anticipated, the possibility of such damages.
58INTEGRITY. BALANCE. OBJECTIVITY.
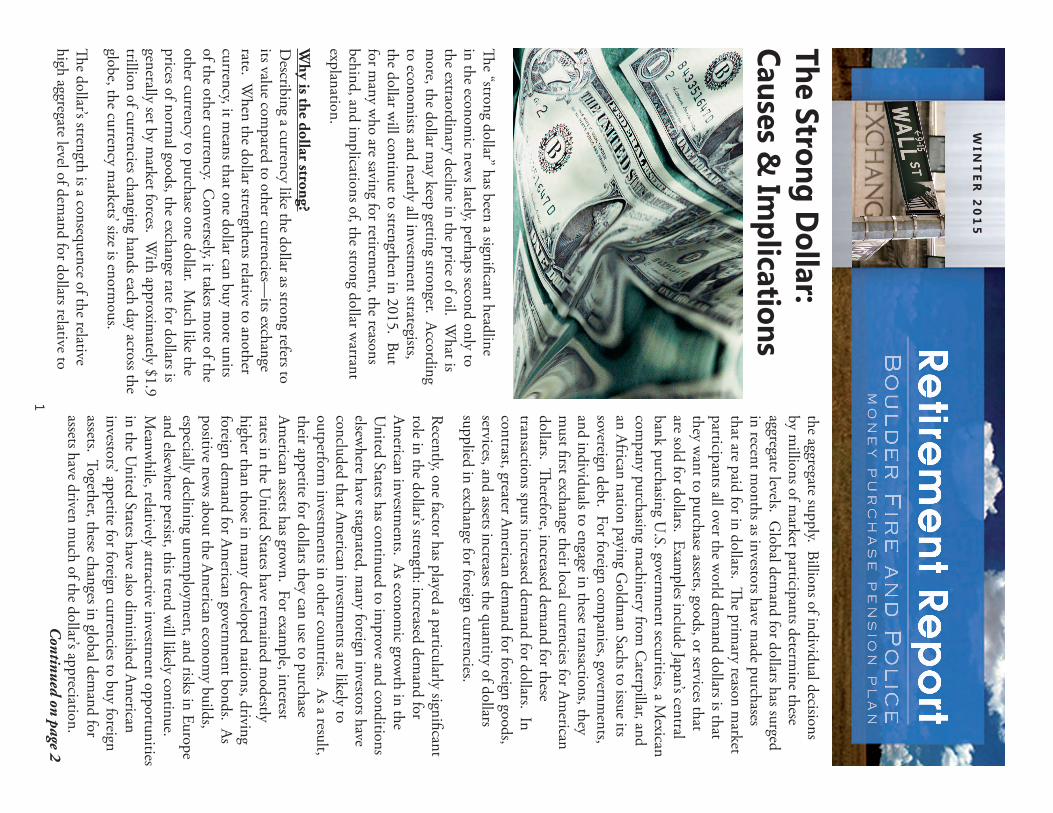
WIN
TE
R 2
01
5
The Strong Dollar: Causes &
Implications
The “strong dollar” has been a significant headline
in the economic new
s lately, perhaps second only to the extraordinary decline in the price of oil. W
hat is m
ore, the dollar may keep getting stronger. According
to economists and nearly all investm
ent strategists, the dollar w
ill continue to strengthen in 2015. But for m
any who are saving for retirem
ent, the reasons behind, and im
plications of, the strong dollar warrant
explanation.
Why is the dollar strong?
Describing a currency like the dollar as strong refers to
its value compared to other currencies—
its exchange rate. W
hen the dollar strengthens relative to another currency, it m
eans that one dollar can buy more units
of the other currency. Conversely, it takes m
ore of the other currency to purchase one dollar. M
uch like the prices of norm
al goods, the exchange rate for dollars is generally set by m
arket forces. With approxim
ately $1.9 trillion of currencies changing hands each day across the globe, the currency m
arkets’ size is enormous.
The dollar’s strength is a consequence of the relative
high aggregate level of demand for dollars relative to
the aggregate supply. Billions of individual decisions by m
illions of market participants determ
ine these aggregate levels. G
lobal demand for dollars has surged
in recent months as investors have m
ade purchases that are paid for in dollars. Th
e primary reason m
arket participants all over the w
orld demand dollars is that
they want to purchase assets, goods, or services that
are sold for dollars. Examples include Japan’s central
bank purchasing U.S. governm
ent securities, a Mexican
company purchasing m
achinery from C
aterpillar, and an African nation paying G
oldman Sachs to issue its
sovereign debt. For foreign companies, governm
ents, and individuals to engage in these transactions, they m
ust first exchange their local currencies for American
dollars. Therefore, increased dem
and for these transactions spurs increased dem
and for dollars. In contrast, greater Am
erican demand for foreign goods,
services, and assets increases the quantity of dollars supplied in exchange for foreign currencies.
Recently, one factor has played a particularly significant role in the dollar’s strength: increased dem
and for Am
erican investments. As econom
ic growth in the
United States has continued to im
prove and conditions elsew
here have stagnated, many foreign investors have
concluded that American investm
ents are likely to outperform
investments in other countries. As a result,
their appetite for dollars they can use to purchase Am
erican assets has grown. For exam
ple, interest rates in the U
nited States have remained m
odestly higher than those in m
any developed nations, driving foreign dem
and for American governm
ent bonds. As positive new
s about the American econom
y builds, especially declining unem
ployment, and risks in Europe
and elsewhere persist, this trend w
ill likely continue. M
eanwhile, relatively attractive investm
ent opportunities in the U
nited States have also diminished Am
erican investors’ appetite for foreign currencies to buy foreign assets. Together, these changes in global dem
and for assets have driven m
uch of the dollar’s appreciation.
1C
ontinued on page 2

The Strong Dollar: Causes &
Implications
Continued from cover
Other factors affect the value of the dollar, too. D
uring periods that investors are risk averse, they tend to hold currencies w
ith strong fundamentals in countries
with stable governm
ents. This preference for stability
has helped the dollar relative to countries like Russia and G
reece. In addition, Investors tend to demand
currencies backed by central banks that try to hold down
inflation.
What are the Im
plications?For Am
erican investors, the strengthening dollar will
have several positive results. First, the stronger dollar m
eans imports from
countries with relatively w
eak currencies are cheaper. As each dollar buys m
ore of a foreign currency, the dollar-cost of foreign goods and services declines. In addition, the rate of inflation m
ay fall. G
iven the Federal Reserve’s focus on minim
izing inflation, as the likelihood of inflation declines, so does the pressure on the Fed to raise interest rates to com
bat it. Finally, m
ore investors may be attracted to Am
erican securities m
arkets, lifting stock and bond prices.
How
ever, a strong dollar’s effects are not all positive. M
ost obviously, American exports suffer as the dollar
strengthens because they become m
ore expensive to those holding foreign currencies. In addition, as the cost of im
ports declines, it can put price pressure on Am
erican competitors. As a result, dom
estic producers’ goods becom
e relatively more expensive than im
ported item
s, and domestic producers lose pow
er to raise prices. Th
is can negatively impact the earnings of Am
erican com
panies, which in turn can cause those com
panies’ share prices to decline. M
oreover, American investors
who hold foreign assets and then convert dividends,
yields, or sale proceeds will see investm
ent returns decline. Th
at is because those currencies will buy few
er dollars than before.
Conclusion
Understanding w
hy the dollar is strong and how
it affects different investments can help retirem
ent investors appreciate the resulting im
pact on their investm
ents. Nonetheless, in light of the billions of
decisions influencing exchange rates, attempting to
improve perform
ance by predicting short-term changes
in those rates is extremely diffi
cult, even for professional investors. C
onsequently, those investing for retirement
would be w
ell-advised to refrain from altering their
portfolios to get ahead of the next exchange rate move.
Moreover, the positive and negative effects of the
strong dollar ripple through a well-diversified portfolio,
benefiting certain components and hurting others.
Appropriately diversified portfolios thus reduce the risk posed by exchange rate changes.
2
Published by Innovest Portfolio Solutions4643 S. Ulster Street, Suite 1040 | Denver, CO
80237 | 303.694.1900 | ww
w.innovestinc.com
Whom
do I call for help?A
ccount Information
> Balances> > Change personal info
Contact : ICMA-RC
800.669.7400 | ww
w.icm
arc.org
The Plan’s Investment Consultant
Innovest Portfolio Solutions
4643 S. Ulster St., Suite 1040D
enver, CO 80237
303.694.1900 | ww
w.innovestinc.com
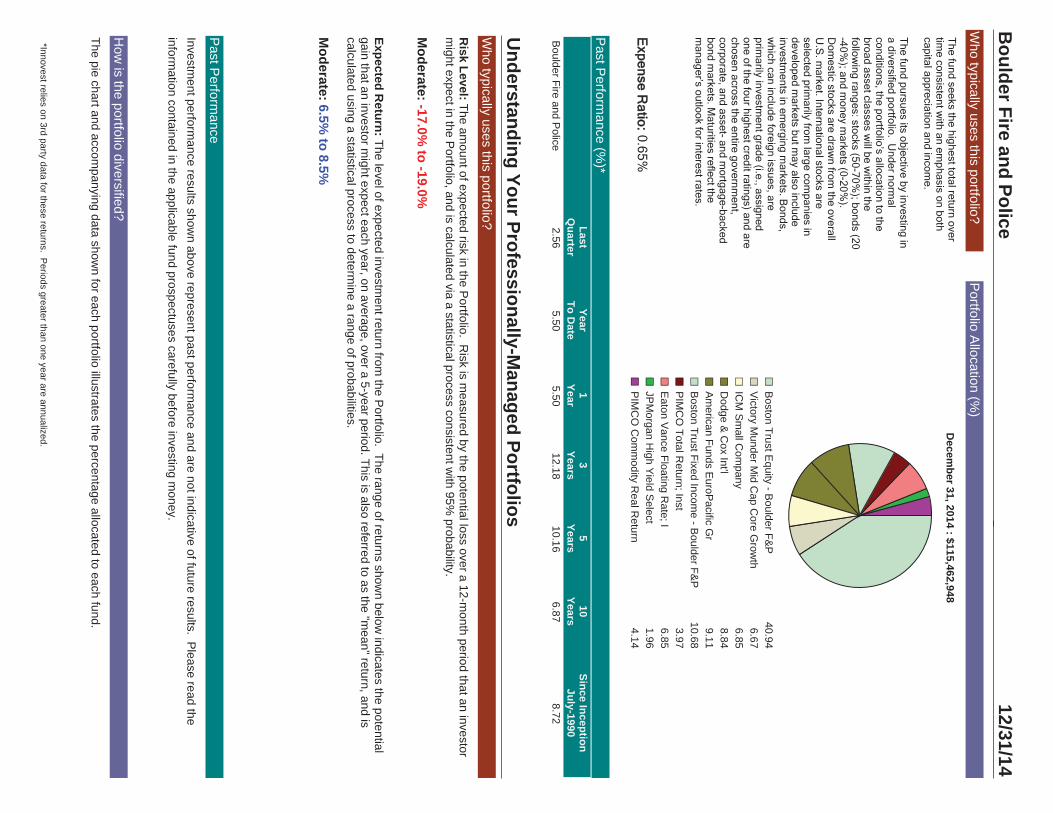
The pie chart and accompanying data show
n for each portfolio illustrates the percentage allocated to each fund.
How
is the portfolio diversified?
Investment perform
ance results shown above represent past perform
ance and are not indicative of future results. Please read the
information contained in the applicable fund prospectuses carefully before investing m
oney.
Past P
erformance
Risk Level:The am
ount of expected risk in the Portfolio. R
isk is measured by the potential loss over a 12-m
onth period that an investorm
ight expect in the Portfolio, and is calculated via a statistical process consistent w
ith 95% probability.
Moderate:-17.0%
to -19.0%
Expected Return: The level of expected investm
ent return from the P
ortfolio. The range of returns shown below
indicates the potentialgain that an investor m
ight expect each year, on average, over a 5-year period. This is also referred to as the "mean" return, and is
calculated using a statistical process to determine a range of probabilities.
Moderate:6.5%
to 8.5%
Who typically uses this portfolio?
Understanding Your Professionally-M
anaged Portfolios
Portfolio A
llocation (%)
Who typically uses this portfolio?
The fund seeks the highest total return over
time consistent w
ith an emphasis on both
capital appreciation and income.
The fund pursues its objective by investing in
a diversified portfolio. Under norm
alconditions, the portfolio’s allocation to thebroad asset classes w
ill be within the
following ranges: stocks (50-70%
); bonds (20-40%
); and money m
arkets (0-20%).
Dom
estic stocks are drawn from
the overallU
.S. m
arket. International stocks areselected prim
arily from large com
panies indeveloped m
arkets but may also include
investments in em
erging markets. B
onds,w
hich can include foreign issues, areprim
arily investment grade (i.e., assigned
one of the four highest credit ratings) and arechosen across the entire governm
ent,corporate, and asset- and m
ortgage-backedbond m
arkets. Maturities reflect the
manager’s outlook for interest rates.
Past P
erformance (%
)*
Expense R
atio:0.65%
Decem
ber 31, 2014 : $115,462,948
Boston Trust E
quity - Boulder F&
P40.94
Victory M
under Mid C
ap Core G
rowth
6.67
ICM
Sm
all Com
pany6.85
Dodge &
Cox Int'l
8.84
Am
erican Funds EuroP
acific Gr
9.11
Boston Trust Fixed Incom
e - Boulder F&
P10.68
PIM
CO
Total Return; Inst
3.97
Eaton V
ance Floating Rate; I
6.85
JPM
organ High Y
ield Select
1.96
PIM
CO
Com
modity R
eal Return
4.14
LastQ
uarterYear
To Date
1Year
3Years
5Years
10Years
Since InceptionJuly-1990
Boulder Fire and P
olice2.56
5.505.50
12.1810.16
6.878.72
Boulder Fire and Police
12/31/14
*Innovest relies on 3rd party data for these returns. Periods greater than one year are annualized.