portfolio strategy - bmo nesbitt burns1).pdf · august 2015 . portfolio strategy august 2015 equity...
TRANSCRIPT

August 2015
Portfolio Strategy August 2015 Equity Strategy: Achtung1! The Collapse in Mining and Energy Shares is NOT a buying Opportunity Stéphane Rochon, CFA, Equity Strategist
We’ve always felt that the German language has a commanding quality and would never use it lightly to warn our readers (yet again) about commodities and commodity related stocks. With the steep price decline in virtually all mining and energy related
stocks, many investors are naturally wondering whether now is a good time to start buying some of these shares. Nein2 is our
answer! Here’s why.
For three years now, we have categorically stated—in every medium available to us—that the commodity super cycle is over. In October 2014 for example we wrote that: “With almost 40% of the Canadian market in energy and basic material stocks (this is now 29% and dropping) AND a loonie that we believe could fall to 75 to 80 cents U.S. in the next two to three years we believe the odds of the S&P/TSX Composite Index outperforming over the next several years are very slim. Our core long-term overweight recommendation remains the more balanced and defensive U.S. market, which also has superior dividend growth potential.” Consistent with this view, we eliminated ALL mining stocks (base and precious metals) from our Guided Portfolio stock recommendations a long time ago.
We updated our thoughts at the end of last year and wrote that “we believe that a reduction in energy exposure will be necessary to generate significant alpha in 2015.” Since then, despite a “dead cat bounce” at the start of the year, oil prices have continued to be under relentless pressure given continued supply growth (from the U.S., Russia and OPEC in particular) in the face of anemic demand growth. We think that the recent diplomatic deal struck with Iran will only increase supply over the next few years and that Mexico, if it follows through with its plans to open up its vast energy resources to foreign capital and technology, could be another major source of oil production growth in the Americas. The implications for Canada are severe. As we have shown many times, the correlation between oil prices, the S&P/TSX Composite Index (“the TSX”), and the Canadian dollar have been approximately 90% over the last 20 years. In other words, the odds of the Canadian stock market and the loonie going down in this environment are very high. As recent trends have shown us, it is NOT DIFFERENT this time.
Figure 2: BMO Nesbitt Burns Investment Strategy Committee’s Recommended Asset Allocation (%)
Income Balanced Growth Aggressive GrowthRecommended Benchmark Recommended Benchmark Recommended Benchmark Recommended Benchmark
Asset Mix Weights Asset Mix Weights Asset Mix Weights Asset Mix Weights
Cash 5 5 5 5 5 5 0 5
Fixed Income 65 70 35 45 15 25 0 0
Equity 30 25 60 50 80 70 100 95Canadian Equity 10 15 15 25 20 35 20 40
U.S. Equity 15 5 35 15 40 20 50 30
EAFE Equity 5* 5 5* 5 10* 10 15* 15
Emerging Equity 0 0 5 5 10 5 15 10 * Within EAFE, we specifically recommend Continental European equity. Source: BMO Nesbitt Burns Private Client Strategy Committee
1 Danger or watch out in German
2 No in German
Figure 1: Canadian Stock Performance versus U.S. Stock Performance
80
90
100
110
120
130
140
150
160
Jul-12 Dec-12 May-13 Oct-13 Mar-14 Aug-14 Jan-15 Jun-15
S&P/TSX Composite S&P 500 Source: Factset
Member-Canadian Investor Protection Fund. Member of the Investment Industry Regulatory Organization of Canada. All figures in C$ unless otherwise noted
Error! Reference source not found. | Error! Reference source not found. Portfolio Strategy | August 2015
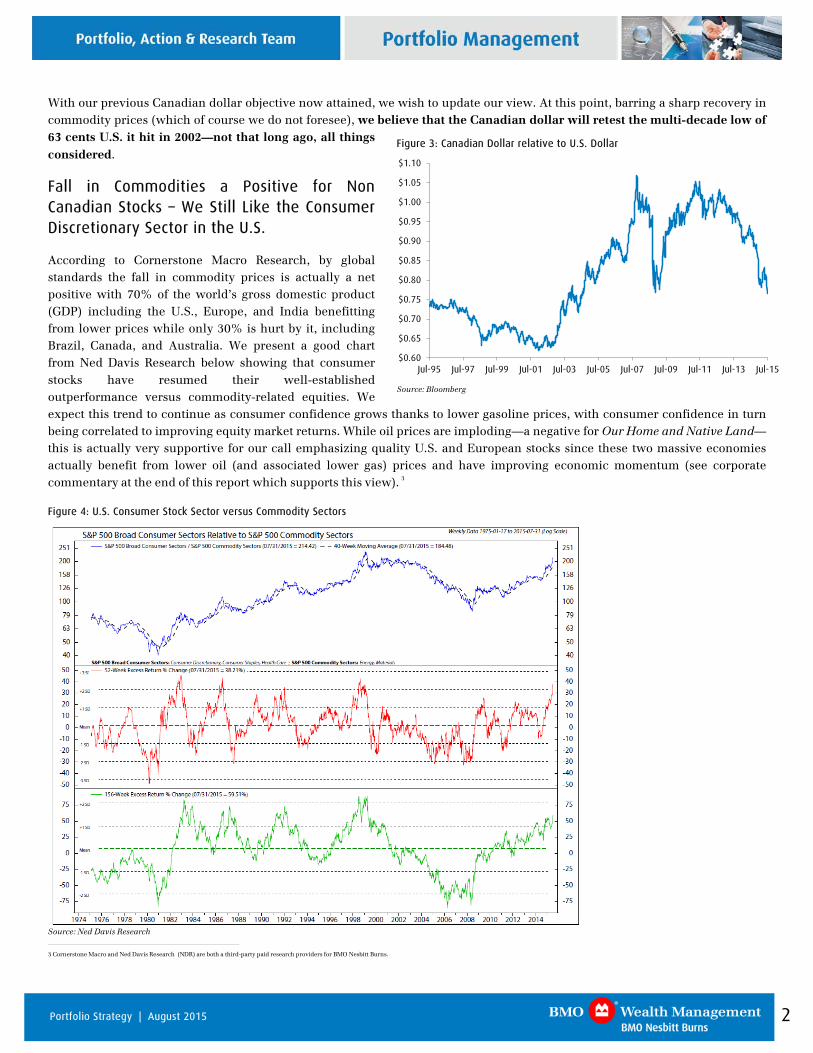
With our previous Canadian dollar objective now attained, we wish to update our view. At this point, barring a sharp recovery in commodity prices (which of course we do not foresee), we believe that the Canadian dollar will retest the multi-decade low of 63 cents U.S. it hit in 2002—not that long ago, all things considered.
Fall in Commodities a Positive for Non Canadian Stocks – We Still Like the Consumer Discretionary Sector in the U.S.
According to Cornerstone Macro Research, by global standards the fall in commodity prices is actually a net positive with 70% of the world’s gross domestic product (GDP) including the U.S., Europe, and India benefitting from lower prices while only 30% is hurt by it, including Brazil, Canada, and Australia. We present a good chart from Ned Davis Research below showing that consumer stocks have resumed their well-established outperformance versus commodity-related equities. We expect this trend to continue as consumer confidence grows thanks to lower gasoline prices, with consumer confidence in turn being correlated to improving equity market returns. While oil prices are imploding—a negative for Our Home and Native Land—this is actually very supportive for our call emphasizing quality U.S. and European stocks since these two massive economies actually benefit from lower oil (and associated lower gas) prices and have improving economic momentum (see corporate commentary at the end of this report which supports this view). 3
Figure 4: U.S. Consumer Stock Sector versus Commodity Sectors
Source: Ned Davis Research
3 Cornerstone Macro and Ned Davis Research (NDR) are both a third-party paid research providers for BMO Nesbitt Burns.
Figure 3: Canadian Dollar relative to U.S. Dollar
$0.60
$0.65
$0.70
$0.75
$0.80
$0.85
$0.90
$0.95
$1.00
$1.05
$1.10
Jul-95 Jul-97 Jul-99 Jul-01 Jul-03 Jul-05 Jul-07 Jul-09 Jul-11 Jul-13 Jul-15
Source: Bloomberg
2 Portfolio Strategy | August 2015

Figure 5: Gasoline Prices (US$) vs Consumer Confidence (inverted on the right hand axis)
50
60
70
80
90
100
110$2.00
$2.50
$3.00
$3.50
$4.00
$4.50
Jun-10 Jan-11 Aug-11 Mar-12 Oct-12 May-13 Dec-13 Jul-14 Feb-15AAA Avg. U.S. Unleaded Gas Prices Consumer Confid. (Univ. of Mich.)
Source: Bloomberg
Figure 6: Consumer Confidence vs. S&P 500 Monthly Returns (year-over-year % change)
50
60
70
80
90
100
110
120
-60%
-40%
-20%
0%
20%
40%
60%
Jan-81 Jan-85 Jan-89 Jan-93 Jan-97 Jan-01 Jan-05 Jan-09 Jan-13
S&P 500 Mthly Y/Y return (LHS) Consumer Confid. (Univ. of Mich.)
Source: Bloomberg
Remember that our back-of-the-envelope math from previous reports shows that for every penny gasoline goes down US$1.5 billion is added in U.S. disposable income. Also, don’t forget that natural gas has also been under pressure which benefits energy-intensive North American industries.
3 Portfolio Strategy | August 2015

Figure 8: Growth in China’s Fixed Inventories versus the Price of Copper
0%
5%
10%
15%
20%
25%
30%
35%
40%
$100
$150
$200
$250
$300
$350
$400
$450
$500
May-05 Feb-08 Nov-10 Aug-13
Copper
China Fixed Assets Investment (yearly % change)
Source: Bloomberg
Figure 7: Natural Gas Price (US$per mmBTU)
$2.00
$2.50
$3.00
$3.50
$4.00
$4.50
$5.00
Jul-14 Sep-14 Nov-14 Jan-15 Mar-15 May-15 Jul-15
Source: Factset
By the way, the sharp decline in Chinese fixed investment growth (now at a multi decade low) tells us that there is more commodity downside risk in store for markets over the next few quarters. And don’t look for salvation from India, whose copper consumption is only 4% of China’s:
Figure 10: World Copper Consumption
Copper consumption (kt) Percent of
2010 2011 2012 2013 2014 China's consumption
China 7,204 7,815 8,204 9,165 9,832 100%
India 447 448 454 422 433 4%
South Korea 901 788 665 698 719 7%
Brazil 452 395 419 442 443 5%
Russia 452 713 646 667 620 6%
Middle East 546 555 595 650 733 7% Source: BMO Capital Markets Research
Figure 9: Growth in China’s Fixed Inventories vs the Price of Crude Oil
0%
5%
10%
15%
20%
25%
30%
35%
40%
$20
$40
$60
$80
$100
$120
$140
$160
May-05 Feb-08 Nov-10 Aug-13
Crude oil
China Fixed Assets Investment (yearly % change)
Source: Bloomberg,
4 Portfolio Strategy | August 2015

Figure 11: Canadian Stocks versus the Price of Copper
$50
$100
$150
$200
$250
$300
$350
$400
$450
$500
4000
6000
8000
10000
12000
14000
16000
18000
Jan-03 Jan-05 Jan-07 Jan-09 Jan-11 Jan-13 Jan-15
TSX Copper
Source: Bloomberg
Figure 13: Canadian Dollar versus the Price of Copper
$0
$50
$100
$150
$200
$250
$300
$350
$400
$450
$500
0.60
0.65
0.70
0.75
0.80
0.85
0.90
0.95
1.00
1.05
1.10
May-02 May-05 May-08 May-11 May-14CAD/USD Copper
Source: Bloomberg
From a Canadian investor’s perspective, this is an extremely important development as copper and oil have been the most highly correlated macro factors to both the TSX and the Canadian dollar (over 90% correlation!) over the last 20+ years. In other words, when oil and copper go down, typically so do the TSX and the loonie.
Figure 12: Canadian Stocks versus the Price of Crude Oil
$0
$20
$40
$60
$80
$100
$120
$140
$160
6000
8000
10000
12000
14000
16000
18000
Jan-03 Jan-05 Jan-07 Jan-09 Jan-11 Jan-13 Jan-15
TSX WTI Oil
Source: Bloomberg
Figure 14: Canadian Dollar versus the Price of Oil
$0
$20
$40
$60
$80
$100
$120
$140
$160
0.60
0.65
0.70
0.75
0.80
0.85
0.90
0.95
1.00
1.05
1.10
May-02 May-05 May-08 May-11 May-14CAD/USD WTI Oil
Source: Bloomberg
5 Portfolio Strategy | August 2015

Figure 15: Canadian Dollar versus the Price of Gold
$0
$200
$400
$600
$800
$1,000
$1,200
$1,400
$1,600
$1,800
$2,000
0.60
0.65
0.70
0.75
0.80
0.85
0.90
0.95
1.00
1.05
1.10
May-02 May-04 May-06 May-08 May-10 May-12 May-14CAD/USD Gold
Source: Bloomberg
Technical analyst Russ Visch adds that commodities should still be avoided.
Technical Outlook for Commodities Still Negative – Russ Visch
The long-term trend for commodities remains bearish and so far there is no evidence that they are beginning to bottom in any substantial way.
Figure 16: Thomson Reuters/Jeffries CRB Index
2008 2009 2010 2011 2012 2013 2014 2015
350
400
450
500
550
600
650
700THOMSON REUTERS/JEFFRIES CRB INDEX
Source: BMO Nesbitt Burns Technical Research
6 Portfolio Strategy | August 2015

In fact, it’s just the opposite as the Thomson Reuters/Jeffries CRB Index (“the CRB”) recently broke down again following a routine medium-term consolidation. The break below support near 407 signaled a resumption of the long-term downtrend and opened a new downside swing target of 370. Below that, there is no major support until the late 2008 low at 322. It should come as no surprise then that there isn’t a lot to be bullish about in terms of the commodities most relevant to Canadian equity markets. For example:
Gold recently suffered a major technical breakdown.
Figure 17: Price of Gold ($US)
O N D 2012 M A M J J A S O N D 2013 M A M J J A S O N D 2014 M A M J J A S O N D 2015 M A M J J A S
1050
1100
1150
1200
1250
1300
1350
1400
1450
1500
1550
1600
1650
1700
1750
1800
1850
1900
1950
2000GOLD
Source: BMO Nesbitt Burns Technical Research
The close below key support at US$1131.85 signaled a resumption of the long-term downtrend and opened a new downside swing target of US$956. The next major support zone from here are the 2008-2009 price peaks in the US$1000-1030 zone. More specifically: US$1030.80, then US$1005.40. We may see some stabilization in that range before heading to US$956. If support in the US$1000-1030 zone breaks, then the next major support zone is US$700-725.
Silver is also reversing back to the downside from a routine countertrend pullback which brought it back to its declining 200-day moving average.
7 Portfolio Strategy | August 2015

Figure 18: Price of Silver (US$)
J J A S O N D 2011 A M J J A S O N D 2012 A M J J A S O N D 2013 A M J J A S O N D 2014 A M J J A S O N D 2015 A M J J A S
15
20
25
30
35
40
45
50
55SILVER
Source: BMO Nesbitt Burns Technical Research
Typically, these tests of the 200-day are the best point in which to sell a security in a long-term downtrend. (See recent examples noted on the chart by red arrows). Risk exists for another test of the recent low at US$14.10. A break below that level would open a new downside swing target of US$10.50.
Copper also remains in a long-term downtrend and like gold, also suffered a fresh breakdown in recent weeks.
Figure 19: Price of Copper (US$)
D 2011 A M J J A S O N D 2012 A M J J A S O N D 2013 A M J J A S O N D 2014 M A M J J A S O N D 2015 M A M J J A S
2.3
2.4
2.5
2.6
2.7
2.8
2.9
3.0
3.1
3.2
3.3
3.43.53.63.73.83.94.04.14.24.34.44.54.64.74.84.9
COPPER
Price with 40-week moving average
Source: BMO Nesbitt Burns Technical Research
8 Portfolio Strategy | August 2015

The break below the early 2015 low at US$2.43 signaled a resumption of the long-term downtrend and opened a new downside swing target of US$1.90.
On the energy side, natural gas appears to be in the late stages of a medium-term countertrend rally which has brought it back to its declining 200-day moving average.
Figure 20: Price of Natural Gas ($US)
ec 2013 Mar Apr May Jun Jul Aug Sep Oct Nov Dec 2014 Feb Mar Apr May Jun Jul Aug Sep Oct Nov Dec 2015 Feb Mar Apr May Jun Jul Aug
2.5
3.0
3.5
4.0
4.5
5.0
5.5
6.0
6.5
7.0NATURAL GAS
Source: B BMO Nesbitt Burns Technical Research
For securities in long-term downtrends, a test of a declining 200-day moving average is the ideal sell point, so natural gas and gas stocks are essentially sells right now. At a minimum risk exists for a test of the May low at US$2.44. A break below that level would signal a resumption of the long-term downtrend and opened a new downside swing target of US$1.78.
The one area that looks like it actually might be bottoming is crude oil, specifically the West Texas Intermediate (WTI) contract. The reason we say that is back in March all of our momentum and sentiment gauges were absolutely blown out on the downside.
9 Portfolio Strategy | August 2015

Figure 21: Price of West Intermediate Crude Oil (US$)
2008 2009 2010 2011 2012 2013 2014 2015
5101520253035404550556065707580859095MARKET VANE SURVEY - CRUDE OIL
2008 2009 2010 2011 2012 2013 2014 2015
1015202530354045505560657075808590CONSENSUS INC. SURVEY - CRUDE OIL
2007 2008 2009 2010 2011 2012 2013 2014 2015
30
40
50
60
70
80
90
100110120130140150160WTI CRUDE OIL - WEEKLY
Price with 40-week moving average
50
RSI
0
50
100Stochastic Oscillator
Source: B BMO Nesbitt Burns Technical Research
In fact, the degree to which our momentum and sentiment indicators fell was much worse than in 2008/2009 when crude oil was US$10-15 lower and everyone thought the financial world was ending. So it’s hard to believe it can get much worse than that. That said, we have to see how WTI acts on this re-test before automatically assuming the low will hold. The problem is that crude oil stocks tend to bottom well after and well below the point at which crude oil puts in its final low. We initially published the following charts back in early December using an old TSE Oil and Gas index which was a precursor to the current index.
10 Portfolio Strategy | August 2015

Figure 22: Crude Oil and Canadian Oil Stocks During the 1986 and 1991 Bear Markets
J A S O N D 1991 M A M J J A S O N D 1992 M A M J J A
15
20
25
30
35
40WTI CRUDE OIL: 1991 BEAR MARKET
58% decline over 5 months
3000
3500
4000
4500
TSE OIL & GAS INDEX
Crude oil makesits lowest low
Crude oil undergoes atest of the early 1991
low
Index bottoms out 57 weeks from crude's price low and and 29.75%lower. If you consider the early 1992 re-test in oil as the end of thebear market then oil stocks still dropped a further 3.31% during thenext 11 weeks.
1985 1986 1987 1988 1989
10
15
20
25
30WTI CRUDE OIL: 1986 BEAR MARKET
69% decline over 5 months
2000
2500
3000
3500
4000
4500
5000TSE OIL & GAS INDEX
Crude oil makesits final low
Index bottoms out 18weeks later and 16.7%
lower
Source: BMO Nesbitt Burns Technical Research
Figure 23: Crude Oil and Canadian Oil Stocks During the 2001 and 2008 Bear Markets
A MJ J A S O N D 2001 A MJ J A S O N D 2002 A M J J A S O N D 20
15
20
25
30
35
WTI CRUDE OIL: 2001 BEAR MARKET
45% decline over 6 months
650
700
750
800
850
900
9501000105011001150120012501300S&P/TSX COMPOSITE GICS ENERGY INDEX
This is the one exception. During the 2001 bear market in crudeoil, energy stocks actually rallied. The only plausible explanationhere is the beginning of the war in Iraq and the commencementof the commodity bull market in general.
A S O N D 2008 A M J J A S O N D 2009 A M J J A S O N D 2010 A MJ
50
100
150WTI CRUDE OIL: 2008 BEAR MARKET
78% decline over 6 months
1500
2000
2500
3000
3500
4000
4500S&P/TSX COMPOSITE GICS ENERGY INDEX
Crude oil makesits final low
Index bottoms out 11weeks later and 14.8%
lower
Source: BMO Nesbitt Burns Technical Research
11 Portfolio Strategy | August 2015

The bottom line here is that even if crude oil has bottomed—and we will need to see more evidence of that in the weeks ahead before we have any degree of confidence in that call—then there is still considerably more pain to be felt in oil stocks in the second half of the year. –Russ Visch
The U.S. and European Recoveries are on Track
With second quarter earnings season in full swing, we thought we would look at some “real world” commentary from major companies. Our source is FactSet. Generally, we see very positive commentary on the U.S. expansion from a number of companies which are included in our Guided Portfolios including Bank of America (BAC), Wells Fargo (WFC), Pepsi (PEP), General Mills (GIS), Accenture (ACN) and Carnival Corp (CCL). Commentary on Europe is also reasonably constructive with the caveat that Greece is creating volatility and uncertainty.
Consumer companies and airlines are making very positive comments on the impact of lower oil/fuel prices. Delta Air Lines mentions a US$2 BILLION tailwind from lower fuel costs this year alone while restaurant chain Darden notes that consumers are less price- sensitive and buying more items. The strength in the U.S. dollar, a negative for U.S. multinationals, will have to be watched BUT, as Canadian investors, the positive impact on the stock’s price in Canadian dollar terms will more than offset the negative earnings impact in our view.
Second quarter 2015 earnings season: Themes
“Our industry-leading research team under Candace's leadership in Bank of America Research expects U.S. GDP growth for the second half of the year to be 3% for each of those quarters, and we see that in our statistics. Our company is well positioned to benefit from that continued health in the economy, and we continue to manage this company to deliver for our customers, clients and for you our shareholders.” – Bank of America (Jul. 15)
“While recent developments in Europe and Asia have implications for the U.S. economy, the ongoing U.S. economic expansion has remained on track and has entered its 7th year, a feat accomplished only four other times in U.S. history.…These factors, along with an increase in consumer confidence, makes me optimistic that the economic expansion will sustain momentum into H2, and Wells Fargo should benefit from the increase in economic activity as we remain focused on meeting our customers’ financial needs.” – Wells Fargo (Jul. 15)
“In the second quarter, PepsiCo was once again the largest contributor to US retail sales growth among all food and beverage manufacturers, with over $400 million of retail sales growth in all major channels. This was more than two times the next largest contributor to growth, and represented more growth than the next 14 largest manufacturers combined. Notably, North American beverages was the key driver of US retail sales growth within PepsiCo and the largest contributor to US retail sales growth on the standalone basis.” – PepsiCo (Jul. 1)
“North America had a great quarter and another remarkable year. Revenues were up 14% for thequarter and 12% for the year, despite the headwind from the West Coast port congestion. Growth in the quarter was driven by nearly every key category.” –NIKE (Jun. 25)
“In North America, we delivered very strong 12% revenue growth in local currency, driven by continued double-digit growth in the United States, where we are strengthening our position as the market leader.”– Accenture (Jun. 25)
“All of our North American brands had a strong performance led by the Carnival brand, which achieved a double digit improvement in ticket revenue yield, a testament to the strength of the Carnival Cruise Line product and the brand team’s incredible execution in delivering a vacation experience that truly resonates with our guests.” – Carnival Corp. (Jun. 23)
Europe
“Our International segment generated 6% constant currency net sales growth in 2015. We had a strong year in Europe where constant currency sales rose 5%.” – General Mills (Jul. 1)
12 Portfolio Strategy | August 2015

“Now let’s turn to Western Europe, where we’ve seen broad-based demand with growth of 17% in the quarter and 21% for the year. Growth in the quarter and throughout the year was fueled by our continued efforts to transform the marketplace in line with the Category Offense. We saw strong growth across most key categories, led by Sportswear, Running, Women’s Training, and Basketball, and in the territories, particularly in AGS, that’s Austria, Germany and Switzerland, as well as in the UK and Ireland.” – NIKE (Jun. 25)
“In Europe, I’m very pleased with our growth of 7% in local currency, driven primarily by Spain, the United Kingdom, Germany, and the Netherlands.” – Accenture (Jun. 25)
“As we had said before in the notes, there is a lot of macroeconomic difficulties in Europe. The economy seems to be bouncing along at the bottom. Our Costa brand is doing very well. But as a result of the geopolitical risk and other things, they have had some challenges on the yield side this year.” – Carnival Corp. (Jun 23)
“And just to note, we are monitoring the situation in Greece as the country considers its path forward economically. We do not anticipate any significant negative impact to our sales results for 2015, nor to our earnings for 2015, unless there's a significant change in the current expected resolution.” – Johnson & Johnson (Jul. 14)
13 Portfolio Strategy | August 2015

Market Valuations
Our fair value DCF (Discounted Cash Flow) index models using expected 2015 earnings estimates of $120 for the S&P 500 and $850 for the TSX. This gives us a fair value range of 2200 – 2300 for the S&P and 14,000 – 15,000 for the TSX.
We are using a discount rate of 8.5% to 9.0% given the continued economic recovery and very supportive money and fixed income markets. This is the sum of a 3% long bond yield + 4.5% equity risk premium (the last 110 year average for North America) + an extra 1-1.5% premium we add for conservatism (given normalized bond rates are likely to move higher).
Figure 24: S&P 500 Index Estimates
Present value % of valueEarnings per share growth
Discount rate
Period 1 (2015-2018) 459.49$ 20.5% 6% 9.0%Period 2 (2019-2023) 492.82$ 22.0% 5% 9.0%Period 3 (2023 - ) 1,285.80$ 57.5% 2% 9.0%
Total fair value 2,238.10$ 100.0% Consensus EPS for 2015 120.00 Rounded 2,240.00$ Implied terminal mult. 14.1 X
Current Price SPX 2,090.00$ Long Bond 3.0%Historical Equity Risk Premium 4.5%
Upside Potential 7% Additional Risk Premium 1.5%Total discount rate 9.0%
Source: BMO Private Client Research
Figure 25: S&P/TSX Composite Index Estimates
Present value % of total
present valueConsensus earnings per share growth
Discount Rate
Period 1 (2015-2018) 3,240.43$ 22.4% 6% 9.5%Period 2 (2019-2023) 3,311.88$ 22.9% 4% 9.5%Period 3 (2023 - ) 7,887.18$ 54.6% 2% 9.5%
Total fair value 14,439.49$ 100.0% Implied terminal multiple 13.2 XRounded 14,440.00$ Consensus EPS for 2015 850.0
Current Price TSEC-TSE 14,500.00$ Long Bond 3.0%ls Historical Equity Risk Premium 4.5%
Upside Potential 0% Additional Risk Premium 2.0%9.5%
Source: BMO Private Client Research
14 Portfolio Strategy | August 2015
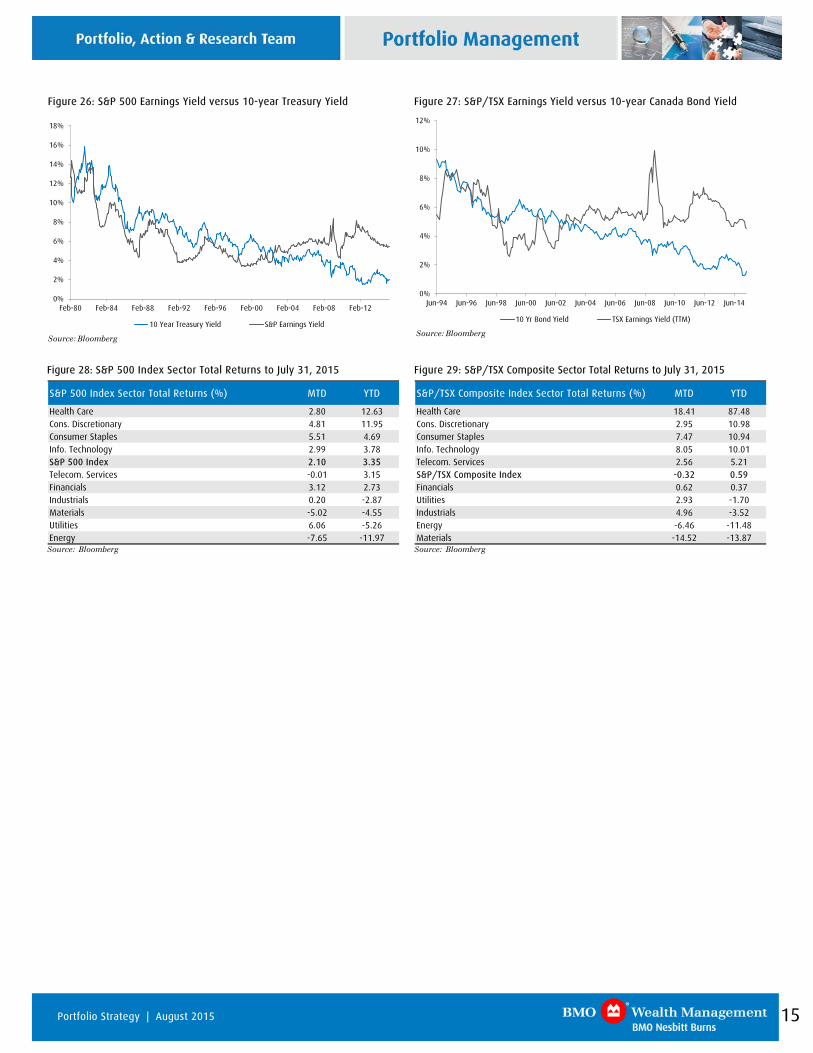
Figure 26: S&P 500 Earnings Yield versus 10-year Treasury Yield
0%
2%
4%
6%
8%
10%
12%
14%
16%
18%
Feb-80 Feb-84 Feb-88 Feb-92 Feb-96 Feb-00 Feb-04 Feb-08 Feb-12
10 Year Treasury Yield S&P Earnings Yield Source: Bloomberg
Figure 27: S&P/TSX Earnings Yield versus 10-year Canada Bond Yield
0%
2%
4%
6%
8%
10%
12%
Jun-94 Jun-96 Jun-98 Jun-00 Jun-02 Jun-04 Jun-06 Jun-08 Jun-10 Jun-12 Jun-14
10 Yr Bond Yield TSX Earnings Yield (TTM) Source: Bloomberg
Figure 28: S&P 500 Index Sector Total Returns to July 31, 2015
S&P 500 Index Sector Total Returns (%) MTD YTD
Health Care 2.80 12.63Cons. Discretionary 4.81 11.95Consumer Staples 5.51 4.69Info. Technology 2.99 3.78S&P 500 Index 2.10 3.35Telecom. Services -0.01 3.15Financials 3.12 2.73Industrials 0.20 -2.87Materials -5.02 -4.55Utilities 6.06 -5.26Energy -7.65 -11.97
Source: Bloomberg
Figure 29: S&P/TSX Composite Sector Total Returns to July 31, 2015
S&P/TSX Composite Index Sector Total Returns (%) MTD YTD
Health Care 18.41 87.48Cons. Discretionary 2.95 10.98Consumer Staples 7.47 10.94Info. Technology 8.05 10.01Telecom. Services 2.56 5.21S&P/TSX Composite Index -0.32 0.59Financials 0.62 0.37Utilities 2.93 -1.70Industrials 4.96 -3.52Energy -6.46 -11.48Materials -14.52 -13.87
Source: Bloomberg
15 Portfolio Strategy | August 2015

The Technical Picture— U.S. Equities: A Consolidation, Not a Top Russ Visch, CMT, Technical Analyst
Usually our Asset Manager comments are somewhat easy in that a few paragraphs of commentary can encompass the action in North American equity markets. However, as we noted in last month’s comments titled “Two Roads Diverged” the medium-term outlook for U.S. and Canadian markets are very different.
We’ll start with U.S. markets, where the choppy price action has been frustrating to watch in recent months and doubly so to write about! The S&P 500 continues to trade within a wide sideways range that stretches back to near the beginning of the year.
Figure 30: S&P 500 Daily Index Momentum Indicators
J J A S O N D 2015 A M J J A
05101520253035404550556065707580859095100105110%K
1520253035404550556065707580859095RSI
Jun Jul Aug Sep Oct Nov Dec 2015 Feb Mar Apr May Jun Jul Au
10000200003000040000
x10
1800
1850
1900
1950
2000
2050
2100
2150S&P 500 - DAILY
-5
0
5
10MOMENTUM
-20-1001020
MACD
Source: BMO Nesbitt Burns Technical Analysis
Overall, it appears to be nothing more than a fairly routine medium-term consolidation pattern within a bigger long-term uptrend. Momentum and breadth oscillators remain negative…
16 Portfolio Strategy | August 2015

Figure 31: S&P 500 Index Weekly Momentum Indicators
12 2013 2014 2015
101520253035404550556065707580859095100105%K
25
30
35
40
45
50
55
60
65
70
75
80
85RSI
A M J J A S O N D 2013 A M J J A S O N D 2014 M A M J J A S O N D 2015 M A M J J A S
50001000015000
x100
1300
1400
1500
1600
1700
1800
1900
2000
2100
2200S&P 500 - WEEKLY
-505101520MOMENTUM
0
50
MACD
Source: BMO Nesbitt Burns Technical Analysis
Figure 32: NYSE Broad-based Measures of Equity Performance
N D 2013 A M J J A S O N D 2014 A M J J A S O N D 2015 A M J J A
15
20
25
30
35
40
45
50
55
60
65
70
75
80
85
90
95PERCENTAGE OF NYSE STOCKS OVERTHEIR 10-WEEK MOVING AVERAGE(Investor's Intelligence)
J A S ON D 2013 A M J J A S ON D 2014 A M J J A S O N D 2015 A M J J A S
15
20
25
30
35
40
45
50
55
60
65
70
75
80
85
90
95PERCENTAGE OF NYSE STOCKS OVERTHEIR 30-WEEK MOVING AVERAGE(Investor's Intelligence)
Source: BMO Nesbitt Burns Technical Analysis
17 Portfolio Strategy | August 2015

…so this sideways price action is likely to persist into the end of the third quarter but ultimately it should be resolved to the upside. Why do we think that? Well for starters, the moving average configuration remains bullish with a rising 50-day continuing to trade above a rising 200-day. At the same time, key barometers of market health such as the various Advance-Decline lines that we follow…
Figure 33: NYSE Advance Decline Lines
NYSE COMMON-STOCK-ONLY ADVANCE DECLINE LINE NYSE ADVANCE DECLINE LINE
May Jun Jul Aug Sep Oct Nov Dec 2015 Mar Apr May Jun Jul AuMay Jun Jul Aug Sep Oct Nov Dec 2015 Mar Apr May Jun Jul AugApr Source: BMO Nesbitt Burns Technical Analysis
…as well as other broad measures of equity participation such as the Russell 2000…
Figure 34: Broad Measures of Equity Participation—Russell 2000 and Value Line Composite
N D 2013 A M J J A S O N D 2014 A M J J A S O N D 2015 A M J J A S
330
340
350
360
370
380
390
400
410
420
430
440
450
460
470
480
490
500
510
520
530
540VALUE LINE COMPOSITE
N D 2013 A M J J A S O N D 2014 A M J J A S O N D 2015 A M J J A S
750
800
850
900
950
1000
1050
1100
1150
1200
1250
1300
1350RUSSELL 2000
Source: BMO Nesbitt Burns Technical Analysis
18 Portfolio Strategy | August 2015
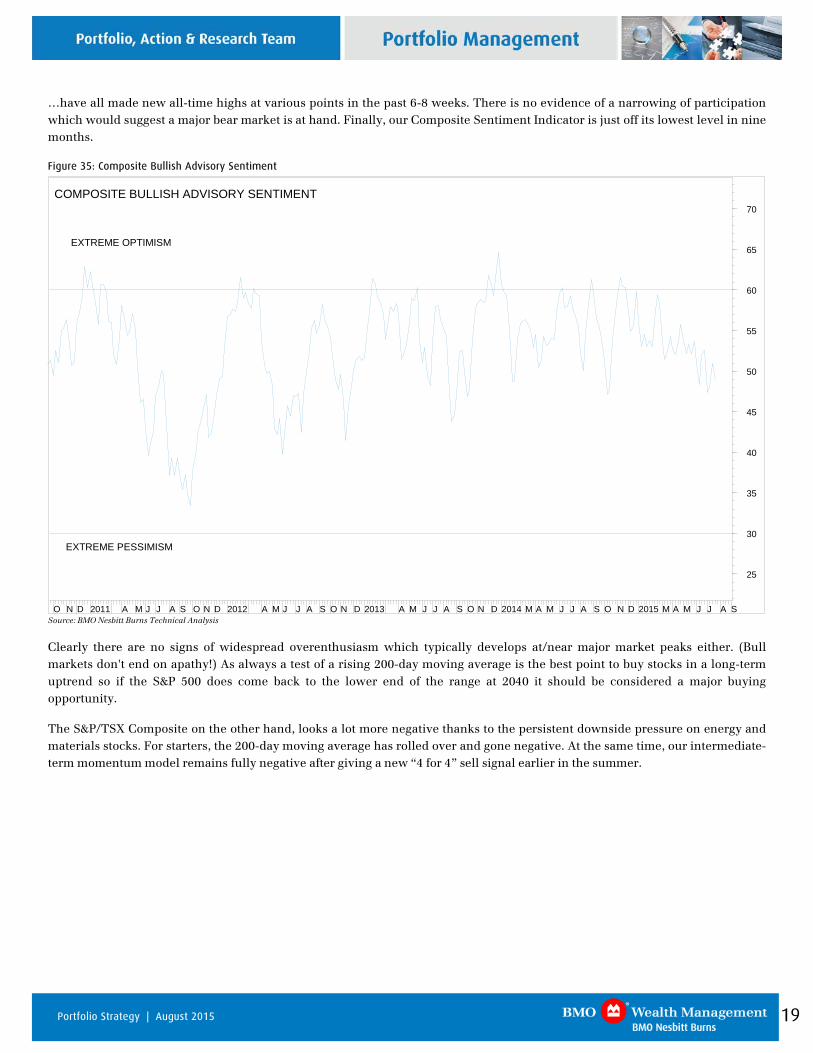
…have all made new all-time highs at various points in the past 6-8 weeks. There is no evidence of a narrowing of participation which would suggest a major bear market is at hand. Finally, our Composite Sentiment Indicator is just off its lowest level in nine months.
Figure 35: Composite Bullish Advisory Sentiment
O N D 2011 A M J J A S O N D 2012 A M J J A S O N D 2013 A M J J A S O N D 2014 M A M J J A S O N D 2015 M A M J J A S
25
30
35
40
45
50
55
60
65
70COMPOSITE BULLISH ADVISORY SENTIMENT
EXTREME PESSIMISM
EXTREME OPTIMISM
Source: BMO Nesbitt Burns Technical Analysis
Clearly there are no signs of widespread overenthusiasm which typically develops at/near major market peaks either. (Bull markets don't end on apathy!) As always a test of a rising 200-day moving average is the best point to buy stocks in a long-term uptrend so if the S&P 500 does come back to the lower end of the range at 2040 it should be considered a major buying opportunity.
The S&P/TSX Composite on the other hand, looks a lot more negative thanks to the persistent downside pressure on energy and materials stocks. For starters, the 200-day moving average has rolled over and gone negative. At the same time, our intermediate-term momentum model remains fully negative after giving a new “4 for 4” sell signal earlier in the summer.
19 Portfolio Strategy | August 2015

Figure 36: S&P/TSX Composite Index Momentum Indicators
2012 2013 2014 2015101520253035404550556065707580859095%K
20
25
30
35
40
45
50
55
60
65
70
75
80RSI
N D 2012 A M J J A S O N D 2013 A M J J A S O N D 2014 A M J J A S O N D 2015 A M J J A S
5000100001500020000
x1000
11000
11500
12000
12500
13000
13500
14000
14500
15000
15500
16000S&P/TSX COMPOSITE - WEEKLY
-20
-10
0
10
20MOMENTUM
0
500MACD
Source: BMO Nesbitt Burns Technical Analysis
Three similar sell signals have occurred in the TSX since the beginning of 2012 and have resulted in corrections averaging 10% over a three month period. At a minimum we expect major support at 13,646 (the October/December lows) will be tested in the weeks ahead. If that level breaks the next major support level below that is at 12,900.
20 Portfolio Strategy | August 2015

Fixed Income Strategy— Separate Ways Richard Belley, CFA, Fixed Income Strategist
Just when it seemed like the summer doldrums would finally kick in, events have forced investors to stay on their toes, delaying the seasonal downtime. The Bank of Canada’s rate cut was one of those events, the positive side of which is that downward pressure on yields across the term structure should provide easier financing conditions for households to manage their budgets and record debt levels. However, the falling Canadian dollar, which tested a new 11 year low, will likely influence many to vacation within our borders for the foreseeable future.
Figure 37: Canadian Government Bond Yields
0.0%
0.5%
1.0%
1.5%
2.0%
2.5%
3.0%
Aug-14 Oct-14 Dec-14 Feb-15 Apr-15 Jun-15
30 year 10 year 5 year 2 year Source: Bloomberg, ONS
The last couple of months have been marked by increased market volatility, a risk not traditionally associated with fixed income investments. Whether it is the uncertainties surrounding the Greece bailout negotiations, the slowing Chinese economy and its equity market sell-off, or the weak Canadian economy, a combination of domestic and international issues continued to push investors into the safety of higher quality investments. The commodity slump and the renewed weakness in crude oil, down 19% in July, also contributed to the volatility, especially in longer term securities as sentiment shifted back and forth between deflation and reflation.
Figure 38: Thomson Reuters/Jefferies CRB Index and Canadian Consumer Price Index (yearly % change)
150
200
250
300
350
400
450
500
-2.0%
-1.0%
0.0%
1.0%
2.0%
3.0%
4.0%
Jan-06 Jan-07 Jan-08 Jan-09 Jan-10 Jan-11 Jan-12 Jan-13 Jan-14 Jan-15
CRB Index (right axis) CPI yearly change Source: Bloomberg
21 Portfolio Strategy | August 2015

In addition to global monetary policies that are targeting low yields, currency depreciation and asset purchases, the recent divergence of the U.S. Federal Reserve (“the Fed”) policy from other major central banks as it prepares to raise rates has contributed to market uncertainty. This divergence has become more noticeable this year, particularly in the case of the U.S and Canada, as the two economies have parted ways in 2015 so far.
Figure 39: Canadian and U.S. Gross Domestic Product Growth, Quarterly
-6%
-4%
-2%
0%
2%
4%
6%
8%
Mar-98 Mar-00 Mar-02 Mar-04 Mar-06 Mar-08 Mar-10 Mar-12 Mar-14
US Canada Source: Bloomberg
Rising liquidity and volatility risk and low compensation for term risk have been the main reasons supporting our recommendation to target lower portfolio duration / interest rate sensitivity. This should not be interpreted as an expectation of higher rates; in fact, rates could still move lower. In the current environment, we prefer adopting a more conservative approach to help mitigate portfolio term risk and potential of capital losses at the expense of what we believe are marginal return opportunities.
Diverging Monetary Policies
As the Canadian economy struggles this year compared to the U.S., these two nations’ respective monetary policies have taken a different direction also. Even as the Fed tries to signal the end of the zero interest rate policy, the Bank of Canada has opted for two rate cuts in the last six months. We have seen divergences before. Back in 2002 and 2010, the health of the Canadian economy and the rise in inflation pushed the Bank of Canada to tighten policy early as the Fed was either easing or already engaged in purchasing assets.
Figure 40: Target for the U.S. and Canadian Overnight Interest Rate
0%
1%
2%
3%
4%
5%
6%
7%
8%
May-95 May-98 May-01 May-04 May-07 May-10 May-13
Canada US Source: Bloomberg
22 Portfolio Strategy | August 2015

This time around, it is the Canadian economy that is underperforming the U.S. economy, with Canada’s gross domestic product (GDP) growth rate trending into negative territory for a second quarter in a row. Whether this will get tagged as an official recession (normally defined as two consecutive quarters of negative GDP) or not will only be known after long debate, but there is no doubt that the economy continues to suffer from weakening commodity markets, a condition that is likely to persist. It is difficult to say if oil will re-test the March 2015 lows of US$43-44, rebound, or simply consolidate in a new range, but we do know that the demand and supply dynamic has not changed enough to be supportive of prices. Saudi Arabia, the largest producer in OPEC, may consider cutting production later this year, but this would likely have limited impact as Iranian oil, in particular, should soon hit international markets. On the demand side of the equation, global economic growth should help but probably not before 2016.
Figure 41: Canadian GDP Growth (annual), the Canadian Dollar, and the Price of Crude Oil in U.S. Dollars
$0
$20
$40
$60
$80
$100
$120
$140
$160
$0.00
$0.20
$0.40
$0.60
$0.80
$1.00
$1.20
May-07 May-08 May-09 May-10 May-11 May-12 May-13 May-14 May-15
CADUSD Crude oil
-5.0%
-2.5%
0.0%
2.5%
5.0%
GDP
Source: Bloomberg
As we discussed in recent strategy reports, expectations were for the pick-up in Ontario and Quebec manufacturing thanks to the benefits of a lower Canadian dollar. Unfortunately, the sector has failed to support the Canadian economy, forcing two rate cuts this year out of the Bank of Canada (BoC). The export data for June painted a more encouraging picture with the biggest jump in almost ten years. While a month does not make a trend, the trade data was a rare positive data point for Canada and provides some optimism for the third quarter. However, while exports may continue to improve and fiscal stimulus could help anchor the third quarter’s bottom line, it may be too early to exclude further easing from the Bank of Canada.
If lower rates are required, would this help consumers and corporations? Major banks have only transferred 60% of the last two cuts, cutting the prime rate only 30 basis points (bps) compared to the cumulative 50 bps cut. Should the Bank of Canada cut again, banks may continue to transfer only some of the benefits. Unfortunately, those who would benefit the most from rate cuts, households, cannot take full advantage of policy action, which in turn reduces the impact of further easing. Nonetheless, whether the BoC follows with more cuts or simply maintains an easing bias, we doubt that this is an environment that justifies higher Canadian rates. If conditions deteriorate from here, lower rates will probably be in the offing.
23 Portfolio Strategy | August 2015

Can’t Exclude September Yet
As for the U.S., after years of easing the Federal Reserve is getting closer to pulling the trigger on rate hikes, but uncertainties remain as to the timing. Given that market liquidity is generally weaker in December, we think that the Fed will have to implement a hike between September or October’s meeting or wait until 2016. The positive revision to first and second quarter growth, bringing these numbers in-line with historical averages, is encouraging and supports action this year, but in general recent economic data has remained soft and below consensus expectations.
Figure 42: Citigroup Economic Surprises Indexes for Canada and the U.S.
-100
-80
-60
-40
-20
0
20
40
60
80
100
Aug-14 Oct-14 Dec-14 Feb-15 Apr-15 Jun-15
U.S. Canada Source: Bloomberg
Notably, we haven’t experienced the sort of wage pressures we’d normally expect in a rapidly tightening labor market with an unemployment rate approaching 5%. Both the employment cost index and the average hourly earnings, two indicators that the Fed monitors, have failed to move significantly above 2%. In fact, wage growth recently slowed down, a trend that is not supportive of a rate hike.
Figure 43: U.S. Employment Cost Index and Growth in Average Hourly Earnings
0.5%
1.0%
1.5%
2.0%
2.5%
3.0%
3.5%
4.0%
4.5%
Jun-03 Nov-04 Mar-06 Aug-07 Dec-08 May-10 Sep-11 Jan-13 Jun-14 Oct-15
Employment Cost Index: Wages & Salaries Average Hourly Earnings of Production and Nonsupervisory Employees
Source: Bloomberg
The dilemma for the Fed is that while they have intensified their communications in favour of a tightening as early as this year, a hike isn’t fully supported by the data yet. This will not be your traditional tightening. The Fed needs to remove extraordinary stimulus to avoid future complications, not to slow down an overheating economy or remove inflationary pressures. With the combination of softer data, a weakening China, a strengthening U.S. dollar, and potential emerging market risks, the Fed can afford to be patient before raising rates. The Fed remains concerned, however, about the financial risks of maintaining zero
24 Portfolio Strategy | August 2015

interest rates for too long. For that reason, we may have to take Fed Chair Janet Yellen at face value when she says she will likely hike this year. Unless the economy experiences a significant slowdown before the next meeting, a September rate hike remains on the table. It may end-up being a smaller hike than the minimum 25 bps, and it may take a while before we get a second hike, but the message the Fed is sending remains clear: earlier rather than later!
Diverging economies and monetary policies means widening differentials between U.S. and Canadian interest rates as the U.S. yield curve continued to rise above the Canadian curve. At the end of July, U.S Treasury bonds with maturities longer than two years were yielding a minimum of 30 basis points above their Canadian equivalent. The combination of more attractive yields, a better economic environment for businesses to grow earnings and the potential for a strengthening U.S. dollar against the loonie continues to support our recommendation to maintain an allocation to U.S. dollar fixed income investments. In particular, we favour short- and mid-term investment grade corporate bonds.
Figure 44: Canadian and U.S. Yield Curves with Spread at Bottom
0.0%
0.5%
1.0%
1.5%
2.0%
2.5%
3.0%
0 5 10 15 20 25 30
US Canada
years
-100
-50
0
50Differential (basis points)
Source: Bloomberg
Figure 45: Canadian and U.S. 10-year Government Bond Yields and Spread Between the Two (in green)
-100
-50
0
50
100
150
200
250
300
0%
2%
4%
6%
8%
10%
12%
Aug-90 Aug-93 Aug-96 Aug-99 Aug-02 Aug-05 Aug-08 Aug-11 Aug-14
Canada minus US (right axis, basis points) Canada US Source: Bloomberg
25 Portfolio Strategy | August 2015

Figure 46: U.S. High Yield Net Issuance (Top), U.S. High Yield Net Flows (Middle) and U.S. High Yield Credit Spreads (Bottom)
0
50,000
100,000
150,000
200,000
250,000
300,000
350,000
400,000
450,000
2012
-01
2012
-03
2012
-05
2012
-07
2012
-09
2012
-11
2013
-01
2013
-03
2013
-05
2013
-07
2013
-09
2013
-11
2014
-01
2014
-03
2014
-05
2014
-07
2014
-09
2014
-11
2015
-01
2015
-03
2015
-05
Cumulative U.S. Net HY SupplyUS$MM
0
10,000
20,000
30,000
40,000
50,000
60,000
2012
-01
2012
-03
2012
-05
2012
-07
2012
-09
2012
-11
2013
-01
2013
-03
2013
-05
2013
-07
2013
-09
2013
-11
2014
-01
2014
-03
2014
-05
2014
-07
2014
-09
2014
-11
2015
-01
2015
-03
2015
-05
Cumulative HY Net FlowsUS$MM
45
55
65
75
85
95
10
11250
350
450
550
650
750
850
2012
-01
2012
-03
2012
-05
2012
-07
2012
-09
2012
-11
2013
-01
2013
-03
2013
-05
2013
-07
2013
-09
2013
-11
2014
-01
2014
-03
2014
-05
2014
-07
2014
-09
2014
-11
2015
-01
2015
-03
2015
-05
HY Sectors Ex. EnergyHY Ex. EnergyHY EnergyWTI Oil, RHS
Source: Barclays
Revisiting Our Non-investment Grade Sector Recommendations
While we recommend U.S. investment grade credits, we have not turned positive on high-yield bonds as we believe the sector will continue to face significant headwinds. When we recommended eliminating high-yield portfolio exposure in June, we stated the following:
‘’Whether this recent sell-off in spreads leads to greater weakness or ends-up being a false signal is yet to be determined. At this time, we prefer taking a more precautionary stance and reducing overall risk exposure as investors will likely continue experiencing high fixed income volatility.’’
The pressure on non-investment credit spreads continued in July as the sector posted the only monthly negative return among U.S. bond market sectors. High-yield bonds have not performed well during previous Fed tightening cycles. However, as we discussed above, the reasoning behind the upcoming tightening is different and we doubt that a small increase in interest rates will significantly impact the financing environment. In fact, this tightening cycle will confirm that the current economic recovery is a strong one, indicating a positive backdrop in which the high yield sector can continue to perform.
The question is whether July’s weakness in non-investment credit markets is a reflection of liquidity or credit risk. A closer look at market activity shows that the demand for high yield bonds has not followed the pace of new issuance. We also note that weaker demand and recent outflows from large ETFs may have been linked to the weakness in commodities and energy markets, two sectors that have traditionally been active issuers in the sector. As we can see in the bottom panel, once we strip out the energy sub-sector, the High Yield spreads ex-energy have behaved relatively well.
Liquidity issues, increased supply, and spread weakness support our recommendation to avoid exposure to high-yield index funds and ETFs. Arguably, we believe an active manager can successfully avoid some, if not all, of the weak sectors and continue to generate attractive returns, but we expect the composition of future returns to lean on coupon income more than capital gains. For specific recommendations, please refer to your BMO Nesbitt Burns Investment Advisor.
26 Portfolio Strategy | August 2015

Market Recap
The negative performance experienced by North American fixed income markets in June became a distant memory last month as bond prices rallied and yields dropped across the yield curve. The Canadian bond market, as represented by the FTSE TMX Canada Universe Bond Index, posted a 1.44% total return, boosting the year-to-date total return to 3.84%. Despite the Bank of Canada cutting rates by 25 basis points, the yield curve flattened as can be seen in the yield differential between 2-Year and 10-Year Government of Canada bonds (2s-10s) which narrowed by over 16 bps and 2s-30s which came in by 10 bps. The long-end of the yield curve outperformed the other term buckets, turning in a 2.83% total return. Real Return bonds, as represented by the FTSE TMX Canada RRB Index which had a modified duration of 15.78 years, more than double the FTSE TMX Canada Universe Bond Index, benefitted from the shift in nominal rates, realizing a 2.08% total return for the month. This brings its year-to-date total return to 5.51%.
Investors continued to favour provincial bonds over corporates in July, as provincial bonds outperformed all other sectors with a 2.09% total return. Increased aversion to risk by investors contributed to spreads widening by an average of 7 basis points over the course of month and resulted in the corporate sector lagging provincials as well as the broad index, posting a modest 0.87% total return. In terms of sub-sector performance, Infrastructure and Communication were the best performers while Financial and Securitization lagged the other sub-sectors.
Figure 47: FTSE-TMX Universe Bond Index Returns (For Period Ended July 31, 2015)
1.44%
2.83%
1.56%
0.37%
0.09%
1.08%
0.77%
1.61%
1.03%
0.22%
3.84%
5.14%
4.65%
2.49%
0.49%
0.00% 1.00% 2.00% 3.00% 4.00% 5.00% 6.00%
Universe Bond Index
Long-Term Bond Index
Mid-Term Bond Index
Short-Term Bond Index
91 Day Treasury Bills
Year-to-date 3-Month Month-to-date
Source: FTSE TMX
The U.S. bond market, as measured by the Barclay’s Aggregate Index, earned 0.70% in July, returning the year to date total return to positive territory at 0.60%. Similar to their Canadian counterparts, bonds with longer maturities outperformed other term buckets, as bonds with maturity dates of 10+ Years realized a 2.11% total return for the month.
The corporate bond sector marginally lagged the broad market by 3 basis points, ending July with a 0.67% total return. Spread widening and a lower appetite for risk continued to hamper the high yield sector, as the Barclays U.S. Corporate High Yield Index had another negative month, realizing a -0.58% total return
27 Portfolio Strategy | August 2015

General Disclosure
The information and opinions in this report were prepared by BMO Nesbitt Burns Inc. Portfolio, Action & Research Team (“BMO Nesbitt Burns”). This publication is protected by copyright laws. Views or opinions expressed herein may differ from the views and opinions expressed by BMO Capital Markets’ Research Department. No part of this publication or its contents may be copied, downloaded, stored in a retrieval system, further transmitted, or otherwise reproduced, stored, disseminated, transferred or used, in any form or by any means by any third parties, except with the prior written permission of BMO Nesbitt Burns. Any further disclosure or use, distribution, dissemination or copying of this publication, message or any attachment is strictly prohibited. If you have received this report in error, please notify the sender immediately and delete or destroy this report without reading, copying or forwarding. The opinions, estimates and projections contained in this report are those of BMO Nesbitt Burns as of the date of this report and are subject to change without notice. BMO Nesbitt Burns endeavours to ensure that the contents have been compiled or derived from sources that we believe are reliable and contain information and opinions that are accurate and complete. However, BMO Nesbitt Burns makes no representation or warranty, express or implied, in respect thereof, takes no responsibility for any errors and omissions contained herein and accepts no liability whatsoever for any loss arising from any use of, or reliance on, this report or its contents. Information may be available to BMO Nesbitt Burns or its affiliates that is not reflected in this report. This report is not to be construed as an offer to sell or solicitation of an offer to buy or sell any security. BMO Nesbitt Burns or its affiliates will buy from or sell to customers the securities of issuers mentioned in this report on a principal basis. BMO Nesbitt Burns, its affiliates, officers, directors or employees may have a long or short position in the securities discussed herein, related securities or in options, futures or other derivative instruments based thereon. BMO Nesbitt Burns or its affiliates may act as financial advisor and/or underwriter for the issuers mentioned herein and may receive remuneration for same. Bank of Montreal or its affiliates (“BMO”) has lending arrangements with, or provides other remunerated services to, many issuers covered by BMO Nesbitt Burns’ Portfolio, Action & Research Team. A significant lending relationship may exist between BMO and certain of the issuers mentioned herein. BMO Nesbitt Burns Inc. is a wholly owned subsidiary of Bank of Montreal. Dissemination of Reports: BMO Nesbitt Burns Portfolio, Action & Research Team’s reports are made widely available at the same time to all BMO Nesbitt Burns investment advisors. Additional Matters TO U.S. RESIDENTS: Any U.S. person wishing to effect transactions in any security discussed herein should do so through BMO Capital Markets Corp. (“BMO CM”) and/or BMO Nesbitt Burns Securities Ltd. (“BMO NBSL”) TO U.K. RESIDENTS: The contents hereof are intended solely for the use of, and may only be issued or passed onto, persons described in part VI of the Financial Services and Markets Act 2000 (Financial Promotion) Order 2001. BMO Wealth Management is the brand name for a business group consisting of Bank of Montreal and certain of its affiliates, including BMO Nesbitt Burns Inc., in providing wealth management products and services.
Member-Canadian Investor Protection Fund. Member of the Investment Industry Regulatory Organization of Canada.
BMO CM and BMO NBSL are Members of SIPC. ® BMO and the roundel symbol are registered trade-marks of Bank of Montreal, used under license. If you are already a client of BMO Nesbitt Burns, please contact your investment Advisor for more information.
Company Specific Disclosures For Important Disclosures on the stocks discussed in this report, please go to: http://researchglobal.bmocapitalmarkets.com/Public/Company_Disclosure_Public.aspx
The authors of this report (or their household members) directly or beneficially own securities of this issuer: N/A
Ratings and Sector Key
BMO Capital Markets uses the following ratings system definitions:
OP = Outperform — Forecast to outperform the analyst’s coverage universe on a total return basis;
Mkt = Market Perform — Forecast to perform roughly in line with the analyst’s coverage universe on a total return basis;
Und = Underperform — Forecast to underperform the analyst’s coverage universe on a total return basis;
(S) = speculative investment;
NR = No rating at this time;
R = Restricted — Dissemination of research is currently restricted.
Prior BMO Capital Markets Rating System (January 4, 2010 – April 5, 2013):
http://researchglobal.bmocapitalmarkets.com/documents/2013/prior_rating_system.pdf
Other Important Disclosures For Other Important Disclosures on the stocks discussed in this report, please contact your BMO Nesbitt Burns Investment Advisor or go to http://researchglobal.bmocapitalmarkets.com/Public/Company_Disclosure_Public.aspx or write to Editorial Department, BMO Capital Markets, 3 Times Square, New York, NY 10036 or Editorial Department, BMO Capital Markets, 1 First Canadian Place, Toronto, Ontario, M5X 1H3.
Technical Analysis Disclaimer
Recommendations and opinions contained herein are based on Technical Analysis and do not necessarily reflect fundamental recommendations and opinions and may relate to companies which, in some instances, are not followed on a fundamental research basis.
28 Portfolio Strategy | August 2015