portland apartment market sales history 2014-2019 · gone from
TRANSCRIPT

3625 River Rd N Ste 250 • Keizer, OR 97303 • (971) 888-4010
www.smicre.com
Steve Morris Vice President Principal Broker – OR
Managing Broker – WA
[email protected] • 503.970.4593 www.smicre.com
OR License 200202054 | WA License 24512 3625 River Road N, #250, Keizer, OR 97303
Portland Apartment Market
Sales History 2014-2019
P a g e | 2
www.smicre.com
Steve Morris / Principal Broker SMI CRE / (503) 970-4593 / [email protected]
2014-2019 Portland Apartment Sales
Introduction ................................................................................................................................... 3
2014-2019 Portland Apartment Market Issues ............................................................................. 4
2014-2019 Year by Year Comments / Forecast ......................................................................... 9
2014-2019 Portland Apartment Market Comments .............................................................. 11
4 County Sales Metrics ............................................................................................................ 13
New Construction Overview ...................................................................................................... 17
New Construction Trends ....................................................................................................... 18
2018 Sales by County ................................................................................................................... 20
2018 Sales by Neighborhood ...................................................................................................... 23
Portland Central / West ........................................................................................................... 24
Vancouver ................................................................................................................................ 24
Portland SE/NE/North (West of 82nd Avenue) ..................................................................... 25
Beaverton/Hillsboro/Tigard .................................................................................................... 25
South Portland Suburbs .......................................................................................................... 26
Portland (East of 82nd) and Gresham ..................................................................................... 26
2014-2019 Sales by Complex Size ................................................................................................ 29
Complexes with 100+ Units ..................................................................................................... 30
Complexes with Less Than 100 Units ..................................................................................... 30
2014-2019 Sales by Decade Built ................................................................................................. 32
All Inventory by Decade Built ................................................................................................. 33
2014-2019 Sales by Decade Built Detail .................................................................................. 34
2019 Largest Sales by Gross $, $/Unit & $/SqFt .......................................................................... 37
2019 Largest Sales by County...................................................................................................... 39
Clackamas - 2019 Top 10 Sales by Total $ ............................................................................... 40
Clark (WA) - 2019 Top 10 Sales by Total $ ............................................................................... 40
Multnomah - 2019 Top 10 Sales by Total $ ............................................................................. 40
Washington - 2019 Top 10 Sales by Total $ ............................................................................. 40
2014-2019 Largest Sales by Gross $ ............................................................................................. 41

P a g e | 3
www.smicre.com
Steve Morris / Principal Broker SMI CRE / (503) 970-4593 / [email protected]
Introduction
We hope this report helps you understand the Portland rental market as of Spring 2020 and how you can make money. We are always happy to provide market evaluations of your properties value along with suggestions on how to increase NOI. Increasing NOI should be paramount whether you are holding or selling your units. It never hurts to know the value of what you own in the current market. As a buyer, this information should give guidelines on what to expect to pay, but every property is unique and you need to determine an accurate value using your own financial analysis. If you would like: - A more readable or in-depth copy of anything here or - Similar information tailored to your neighborhood or ZIP code(s) or - To be included on our monthly eMail of individual apartment sales - FREE copy of our 80-page book – “Buying, Selling and Operating Apartments – Using
Financial Analysis” Please contact me at:
Steve Morris [email protected]
(503) 970-4593 SMI Commercial Real Estate
3625 River Road N, #250 Keizer, OR 97303
Of course, any in depth analysis of the Portland market is available – Let us know how you’d like to “slice” the market. In addition, if you’d like an objective analysis of your apartments without obligation, let us know.

P a g e | 4
www.smicre.com
Steve Morris / Principal Broker SMI CRE / (503) 970-4593 / [email protected]
2014-2019 Portland Apartment Market Issues
P a g e | 5
www.smicre.com
Steve Morris / Principal Broker SMI CRE / (503) 970-4593 / [email protected]
Oregon State Rent Control –State laws could’ve been worse (especially when compared to Portland). Allowing a min of 7% rent increases a year will probably allow you to stay at market plus the state-level NO CAUSE isn’t quite as onerous as Portland. If you are not well-organized with paperwork and timelines for notices, you open yourself up to a lot of potential problems. City of Portland Rent Control – Current Portland rules are more stringent than enacted state rules noticeably with penalties for NO CAUSE. New FAIR housing rules have been adopted in Portland (eff. 1 Mar 20). These affect application screening and security deposits. I’ve posted some useful downloads (training and PHB documents) on my WEBsite: https://portlandapartmentsales.com/2020/03/04/city-of-portland-f-a-i-r-downloads-27-feb-20/ As above, you’ll need to make sure you have the latest forms and systems in place to track delivery and how you handle the forms and screening. The emerging focus for owners will be a stable tenant base - A lot of the rules kick in with new applicants. Keeping and rewarding good tenants is a high priority. If you must get tenants so you may want to ask your property manager:
1) Is your advertising effective and are we stating all the positive things about our apartment compared to the competition?
2) Are your on-sites tracking applications and following up? 3) Is my asking rent in line with the competition or can I succinctly justify higher asking
with what my property offers? 4) What’s my online reputation? – You need a consistent plan to respond to any bad
online comments immediately. Managing expenses. Be strategic with repairs that may be cheaper now versus waiting. Issues like moisture invasion should be addressed as soon as possible. Ongoing utility usage, merit close examination whether curbing use (desired) or off-loading the cost onto tenants (bill-backs).
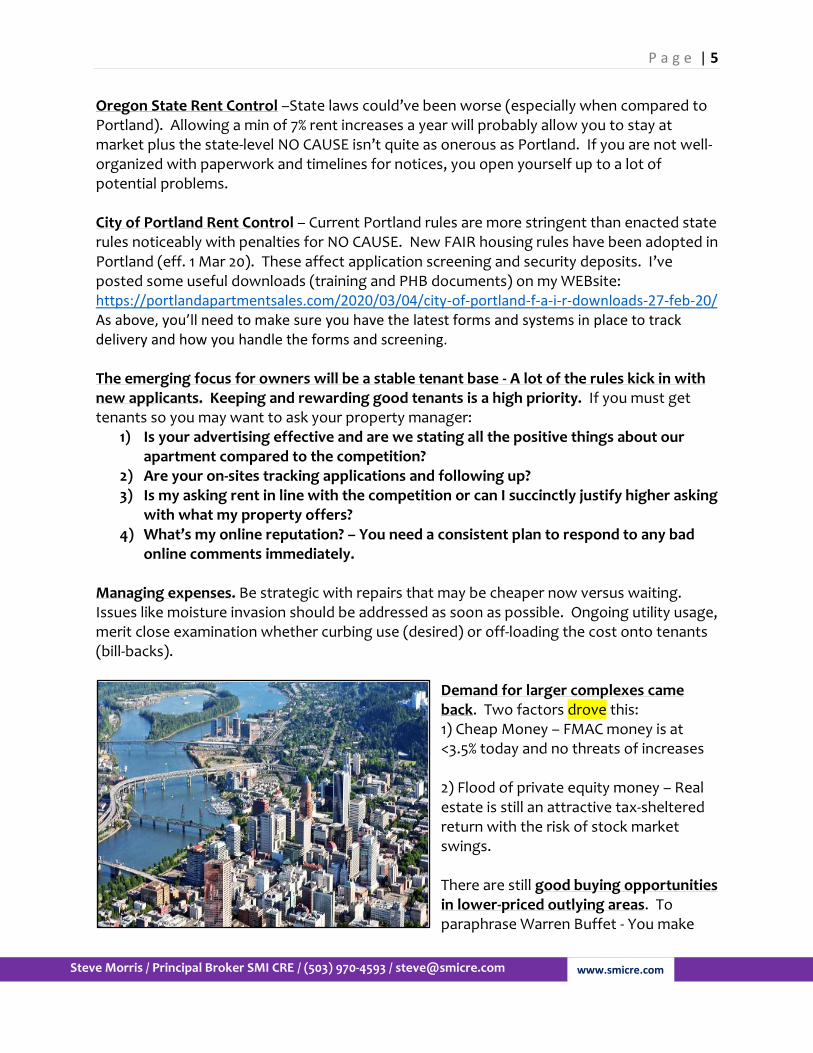
Demand for larger complexes came back. Two factors drove this: 1) Cheap Money – FMAC money is at <3.5% today and no threats of increases 2) Flood of private equity money – Real estate is still an attractive tax-sheltered return with the risk of stock market swings. There are still good buying opportunities in lower-priced outlying areas. To paraphrase Warren Buffet - You make

P a g e | 6
www.smicre.com
Steve Morris / Principal Broker SMI CRE / (503) 970-4593 / [email protected]
your gain when you buy. Demand for smaller complexes is growing since they are priced more keenly (cf. 2014-2019 Sales by Complex Size) . Also, tertiary markets (like Willamette Valley, Yamhill County, Oregon coast) are seeing more interest since little new construction while population growth has continued. Sellers not being persuaded- The factors encouraging inaction by owners: a) Finding few desirable replacement properties for a 1031 exchange. b) Faith prices will keep increasing from brokers trying to buy listings. c) Still getting a good return (especially long-term owners) even in light of new regulations.
2019 leasing issues- The market has gone from <3% to 5% vacancy rates. Owners need to compete for better-quality tenants – Especially on high-end properties. Focus on what you can do to improve the attractiveness of your apartments to good tenants including energy efficiency, water-use management and strategic improvements. Make sure you know what your online reputation is and have a plan to counter any bad reviews that get posted.
URM (Unreinforced masonry) – While the retrofits initiative has been put on hold for a while, it is affecting buyers looking at properties. This especially affects pre-1928 brick buildings without support framing. Pricing on these has taken a large hit from the $200K+/unit to as low as $140K/unit price range (in close-in Portland). Sell or keep, you’ll need to get an idea of the cost. Sooner is better since it’ll be a major CapEx project. Main items will be roof parapets and then wall reinforcements to secure the structure. The city of Portland is still in flux so I’m not clear on what the timeline or notice (posting a big ”U”) provisions are for certain. In any case, if you own a URM building (most likely brick built pre-1928), you need to figure what the cost is – Whether you keep or sell it. Turnovers – While this has always been an issue, it’s one of the biggest variables to controlling expenses. For example, you own 100 units and turn 40 every year. If it takes you 1 month to turn, that’s a 3.33% vacancy rate (40 empty unit-months / 1200 total unit- months). If it takes you 2 months to turn, then that’s a 6.67% vacancy. At $1000/month avg rent, that’s the diff between $40,000 (3.33% vacancy) and $80,000 (6.67% vacancy) in lost income.
P a g e | 7
www.smicre.com
Steve Morris / Principal Broker SMI CRE / (503) 970-4593 / [email protected]
Think about how you handle turns: 1) Try to get in as soon as possible after the tenant gives notice so you can assess
condition. 2) If you have some units that are major and some that are minor repairs, focus on the
minor repairs to get those units up quickly 3) On rehabs, spending extra to “bullet-proof” (i.e. harder wearing surfaces) a place is
worth it. FEDs (forcible entry and detainers = evictions) can be a min of 3 months lost time. Make sure you/your property manager file all required papers properly and ASAP! Once a tenant goes sideways on you, they have courts on their side and can stretch out FEDs if you are not on top of your game. Should I Self-Manage to save money? – Since more owners are asking, you should review what a property manager does and then determine if this is best for you.
Plusses Cost savings – Each situation is unique, but for a market-rate property, you’re probably looking at saving 8% of gross income (13% for LIH due to compliance paperwork). Consistency – You’ll be there from the time you buy it until you sell it. That is, no rotation of staff. Control – Since you’ll be more involved, you can watch expenses like maintenance closer. This assumes you’ll have a property management program that can track account receivable and payable with some degree of precision.
Minuses Changing rules – Portland is gaining a discomfiting expertise in creating new rules. PMs, as part of their job, keep updated on all of this in addition to existing fair housing laws. As a landlord, if you go to court (e.g. a FED), you may not even get one mistake and tenants are usually allowed a lot more latitude. Marketing – Half of the tenant’s interest is still from drive-bys. Is someone onsite to greet them? Having a show of presence also serves as a check on bad behaviors by tenants and keeps your property attractive to tenants. Can you do ongoing rent surveys to make sure you’re at a competitive price? Recruiting tenants. A PM will have more advertising than a CraigsList ad, including WEBsites, signage, print magazines. They should also have a system to track applicants for feedback to you. Liability shield – Having a state-licensed operator as the first contact makes it safer for you and reduces your liability exposure. Handling Emergencies. Tenants can call at any time for even minor annoyances. With a tightening market, your response affects perceptions Handling CapEx – Usually contracted out, but doing things in a timely manner works in the long run. Waiting on moisture invasion issues only makes them more expensive

P a g e | 8
www.smicre.com
Steve Morris / Principal Broker SMI CRE / (503) 970-4593 / [email protected]
Handling maintenance – Once you get >50 units, you probably need staff to handle this. The tendency of owner-operators is usually to delay maintenance. Turnover – Can you do this in a timely manner? With a tightening market, downtime means lost opportunity. Accounting – While interfaces like AppFolio are making this easier, someone needs to do data entry and bill-paying. In addition, a good accounting system can serve as a forensic device to find out where you not making money. IF YOU CANNOT MEASURE INCOME & EXPENSES – YOU CAN’T MANAGE THEM.
I’m not discounting 3rd party management at all, yet for most owners, the 8%+/- cost is well worth it. However, you shouldn’t abdicate all of your responsibility in managing. If your main involvement is cashing your monthly check, you are probably missing income. If you have a management company, sitting with them and setting goals (i.e. what are the 3 things we’re going to do this month to increase NOI). It gives them guidance and helps you understand what issues are with your property and what stops you from making more money. The value of your apartment (whether you hold or sell) is directly related to your NOI. Low-Income Housing Inflation – For the past 2 years LIH has far outpaced the price increases of market-rate housing (albeit from a lower $/unit level). The demand has been driven by money dedicated to acquisition of affordable. The pot includes a City of Portland bond ($256M), METRO bond ($680M) and CalSTRS (Cal Teacher Ret Fund = $1B). IN addition, HUD gave a healthy jump in AMI rents in 2018. If you do own income-qualified property, before you accept an offer make sure you have a grip on recent comparable sales.
P a g e | 9
www.smicre.com
Steve Morris / Principal Broker SMI CRE / (503) 970-4593 / [email protected]
2014-2019 Year by Year Comments / Forecast
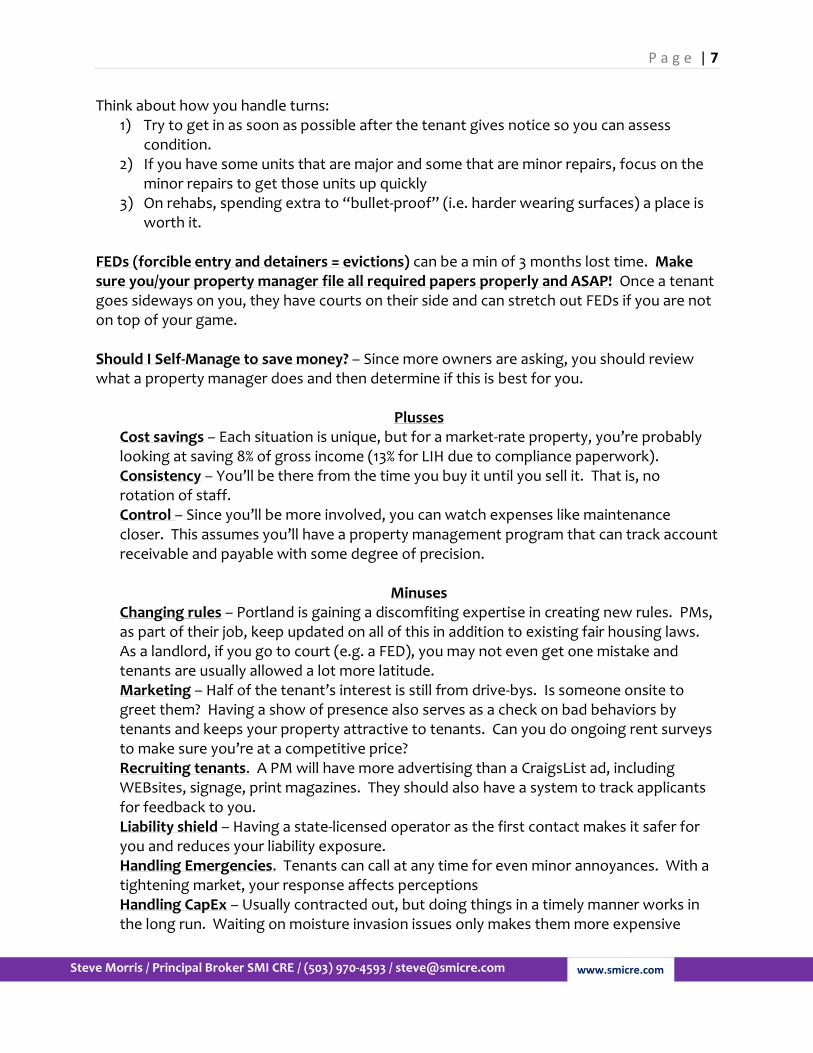
Note: Sample Interest Rates on 5 yr balloon term >$500K borrowed 2019 – Finding reasonably priced properties in good locations becomes an issue since there is a bid-ask spread with down pressure on pricing. Properties in Portland proper showing the threat of more screening regulations. Vacancies up from <3% to mid-3% range. The spread between average Cap Rates (5.46%) and average lending rates (3.75%) is > 40%. 2018– More rules in Portland and state-level. However, sales bounced back (+40% over 2017, but 15% still down from 2016). The years of increasing rent seem to have hit a ceiling which should shift owner focus more to managing expenses to keep NOI up. As of today, available FOR SALE inventory has markedly increased. Perhaps this is in reaction to rent control laws. It may be worth monitoring before you decide to sell or hold. 2017– Looks to be a watershed year. There was a 40% drop from 2016 in gross sales dollars. Even more new construction inventory being brought on-line. Rents returned to their normal 3%-5% year-over-year increase with a vacancy uptick in the 2nd half of 2018. The rental market for rent gains and price increases seems to be returning to a more normal level as opposed to the hot years of 2014-2019 for sales price and rent growth
2016 –An all-time high in gross sales dollars ($3.10B). A large amount of new construction inventory starting to be brought on-line. In Portland, the threat of government interference thru soft rent controls in Portland. On the horizon, permitting changes require part of new construction to be low-income units (Inclusionary Zoning). 2015 –Peak transactions (286). Total transaction $ surpass sets record easily. Buyer demand
5 yr Lending
Rate Avg $/unit Avg $/SqFt Avg CapRate Deals
Total Units
Sold Avg Transaction Total Sales
2014 4.13% $118,931 $128.83 6.11% 201 10853 $7,734,263 $1,554,586,907
2015 3.95% $126,454 $151.70 5.75% 292 15717 $7,974,728 $2,328,620,641
2016 4.25% $150,241 $172.37 5.46% 281 16251 $10,710,136 $3,009,548,130
2017 4.25% $176,233 $201.91 5.37% 227 9081 $7,856,707 $1,783,472,585
2018 4.75% $185,909 $221.93 5.35% 279 11270 $9,063,195 $2,528,631,522
2019 3.75% $183,062 $207.57 5.46% 256 10332 $8,979,975 $2,298,873,605
5 yr Avg 4.18% $156,805 $180.72 5.58% 256.0 12251 $8,719,834 $2,250,622,232
5 Yr Total 1536 73504 $13,503,733,390
P a g e | 10
www.smicre.com
Steve Morris / Principal Broker SMI CRE / (503) 970-4593 / [email protected]
swamps inventory resulting in pricing growth being driven by buyers. Sellers still are seeing good income on properties. Meanwhile, new construction (see later) hits another high with money still cheap. Interest rates hit low of 3.95% on average. 2014 – Huge jump in apartment pricing of 20%+. Total transaction $ surpass previous all-time high (2011). The market is heating up with institutional buyers leading the way with a 30% jump in average $/unit from 2013 for larger complexes.
Now what for 2020? Questions to be answered:
1) Are rents peaking? 2) Will income keep up with expenses and what can an owner do to control expenses? 3) With inflated sales prices are we hitting a buyer limit? Class A property gross $ sales
have dropped 50% from 2016 to 2019. 4) Will an interest rate decrease reverse pricing trends? 5) What’ll it take to get/keep good tenants? More lead generation, advertising,
watching your online reputation, monitoring your rent pricing? 6) Oregon rent control / City of Portland laws – What effect on all owners in Oregon?
What do you need to do in terms of paperwork and understanding new rules? We stay current on the Portland rental market. We send out a monthly eMail detailing individual apartment sales>$450K. If you’d like to be included, let us know. Knowing your property and how it compares to neighboring properties helps make well-informed decisions. With unsolicited offers increasing, you need to know where you stand and if an offer is worth considering. We’ve helped owners with weatherization grants, finding new ways to do utility bill-backs that are not intrusive and provide financial analyses that set a value based on your rents and expenses compared to the neighborhood averages.

P a g e | 11
www.smicre.com
Steve Morris / Principal Broker SMI CRE / (503) 970-4593 / [email protected]
2014-2019 Portland Apartment Market Comments
Whether you SELL or HOLD, job number one is to increase your Net Operating Income (NOI). If you can raise top-line income thru rents, fees or bill-backs - Great. However, you’re always prey to the market for what income you can drive. What you have more control over are expenses. Whether this means reducing utility usage and getting/keeping better tenants you should make NOI growth an ongoing action item. Ultimately, attracting and keeping good tenants is the best investment of effort you can make. Keeping maintenance manageable is important. If you are making a maintenance decision, you should prioritize, in order:
- Tenant safety issues– Way too much liability and too many tenant lawyers. - Moisture invasion (the sooner you address, the cheaper it will be to fix) - Energy efficiency – Helps your tenants and adds value to your property - Aesthetics - Your tenants look no better than your apartments. - Landscaping improvements – Beyond tenant attraction, the payback is low - The
more you spend on new landscape, the more it’ll cost to maintain.
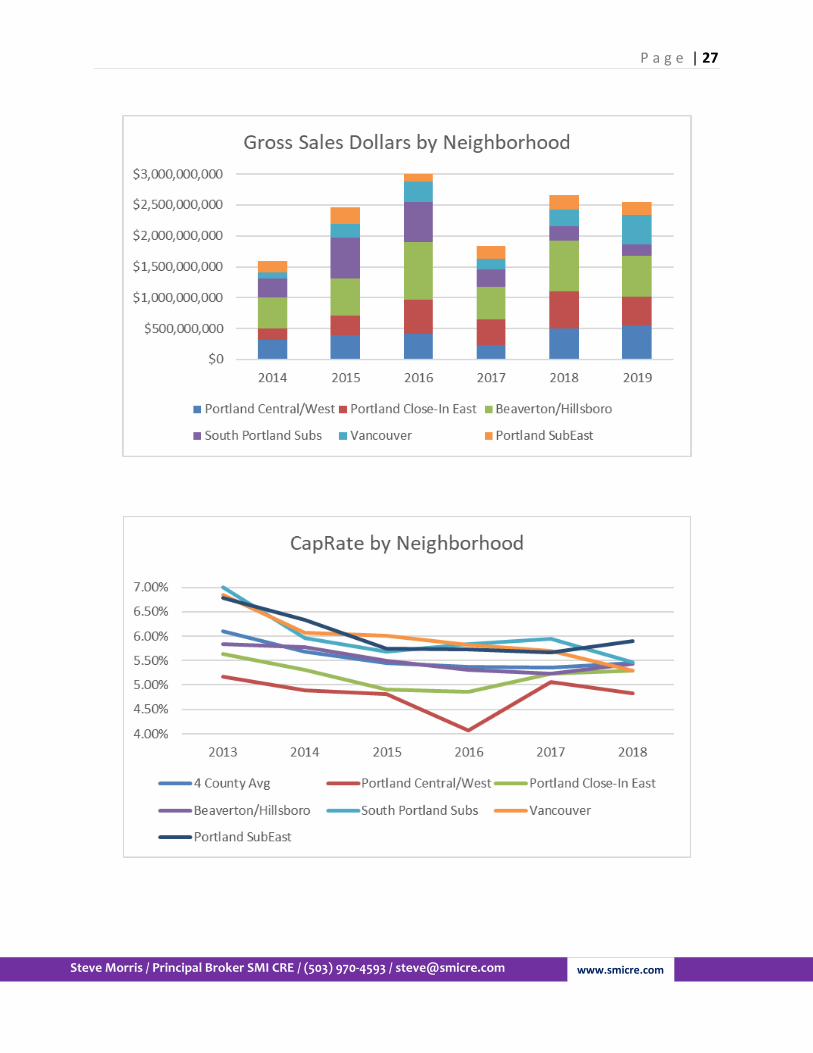
What’s Hot and What’s Not
Hot Vancouver Because it’s not Portland. Evidenced by the only county showing growth
in pricing in 2019 Tertiary markets Like the Willamette valley, coast and Yamhill county Expenses With rent income increase being limited, you’ll need to analyze
maintenance/repair expenses and utilities like water/sewer (which can cost a month’s rent every year).

P a g e | 12
www.smicre.com
Steve Morris / Principal Broker SMI CRE / (503) 970-4593 / [email protected]
Cost of debt With FMAC going below 3.5%, debt is an expense that can be reduced. You may want to talk with your servicer on re-fis. If you have large CapEx cash-out re-fis are one of the most efficient way to get money.
Affordable Apts Income qualified housing has jumped in price more than market-rate housing the past 3 years. Part of this is due to generous HUD rent bumps and the desire to keep and create (multiple bond issues) more affordable housing.
Not
Portland proper Expect even more rules from a city council trying to fix things for affordable housing
Older buildings Due to URM issues Bend Due to a large jump in pricing and avg income keeping rent growth down Poor paperwork With every new rule, your main defense as a landlord is accurate
paperwork and delivery and tracking. If you don’t know what the rules are, at a min, join a rental association and learn. In this market, nice (keeping rents below market) and sloppy landlords will get punished.
Find out where you stand today – Prices change! We can provide a very useful financial analysis including:
- Opinion of current value and suggestions on how to increase it - Analysis of expenses compared to area averages - Sales comparables to justify pricing - Rent comparables to see if you’re getting enough.

P a g e | 13
www.smicre.com
Steve Morris / Principal Broker SMI CRE / (503) 970-4593 / [email protected]
4 County Sales Metrics
2014 2015 2016 2017 2018 2019 Avg / Grand Total$120,350 $128,544 $150,536 $176,779 $186,959 $185,978 $158,906
Year-Year Change 6.8% 17.1% 17.4% 5.8% -0.5%
$129.79 $153.84 $173.86 $201.60 $223.59 $210.51 $183.65
Year-Year Change 18.5% 13.0% 16.0% 10.9% -5.9%
6.10% 5.68% 5.44% 5.37% 5.35% 5.45% 5.53%
Year-Year Change -6.9% -4.2% -1.4% -0.2% 1.8%
194 278 275 223 272 244 1486
Year-Year Change 43.3% -1.1% -18.9% 22.0% -10.3%
10814 15542 16200 9053 11249 10234 73092
Year-Year Change 43.7% 4.2% -44.1% 24.3% -9.0%
$1,551,580,907 $2,308,767,766 $3,001,744,130 $1,778,623,585 $2,525,182,022 $2,286,732,405 $13,452,630,815
Year-Year Change 48.8% 30.0% -40.7% 42.0% -9.4%
2014 2015 2016 2017 2018 2019 Avg / Grand Total
Avg $/PerUnit $97,012 $127,680 $127,900 $157,238 $161,899 $148,322 $135,208
Avg $/SqFt $109.40 $137.58 $136.72 $167.49 $171.61 $176.64 $147.94
Avg CapRate 6.11% 5.69% 5.87% 6.01% 5.58% 5.72% 5.85%
Transactions 25 34 39 30 19 25 172
Total Units 2310 3669 2730 1296 1206 837 12048
Gross Dollars $290,672,000 $590,270,514 $435,629,640 $242,440,000 $240,254,977 $169,125,950 $1,968,393,081
Avg $/PerUnit $87,055 $120,271 $116,795 $172,836 $176,903 $184,862 $145,196
Avg $/SqFt $90.06 $128.10 $128.89 $162.68 $161.49 $195.36 $147.63
Avg CapRate 6.84% 6.07% 6.00% 5.83% 5.69% 5.30% 5.87%
Transactions 17 23 29 16 25 29 139
Total Units 908 1644 2420 1044 1383 2432 9831
Gross Dollars $93,749,709 $218,235,301 $335,454,339 $168,480,884 $270,783,450 $477,422,660 $1,564,126,343
Avg $/PerUnit $133,051 $133,934 $163,260 $185,594 $192,268 $192,563 $167,676
Avg $/SqFt $145.04 $167.12 $195.11 $218.74 $243.97 $223.78 $201.19
Avg CapRate 6.07% 5.61% 5.27% 5.15% 5.32% 5.44% 5.42%
Transactions 120 174 163 143 182 149 931
Total Units 4024 5776 6510 4043 5024 4199 29576
Gross Dollars $674,239,698 $900,316,748 $1,260,819,651 $817,628,709 $1,202,746,465 $972,368,581 $5,828,119,852
Avg $/PerUnit $108,643 $113,263 $145,704 $158,803 $181,770 $185,798 $149,956
Avg $/SqFt $109.65 $129.06 $157.70 $177.96 $198.20 $193.67 $162.39
Avg CapRate 5.83% 5.77% 5.41% 5.35% 5.23% 5.44% 5.50%
Transactions 32 47 44 34 46 41 244
Total Units 3572 4453 4540 2670 3636 2766 21637
Gross Dollars $492,919,500 $599,945,203 $969,840,500 $550,073,992 $811,397,130 $667,815,214 $4,091,991,539
Clackamas
Clark (WA)
Multnomah
Washington
4 County Total
Gross Dollars
Total Units
Transactions
Avg CapRate
Avg $/SqFt
Avg $/PerUnit

P a g e | 14
www.smicre.com
Steve Morris / Principal Broker SMI CRE / (503) 970-4593 / [email protected]
4 County Sales Metrics

P a g e | 15
www.smicre.com
Steve Morris / Principal Broker SMI CRE / (503) 970-4593 / [email protected]
4 County Sales Metrics

P a g e | 16
www.smicre.com
Steve Morris / Principal Broker SMI CRE / (503) 970-4593 / [email protected]

P a g e | 17
www.smicre.com
Steve Morris / Principal Broker SMI CRE / (503) 970-4593 / [email protected]
New Construction Overview

P a g e | 18
www.smicre.com
Steve Morris / Principal Broker SMI CRE / (503) 970-4593 / [email protected]
New Construction Trends
New construction It’s difficult to build a new apartment building today that can compete with existing construction. Most new construction is happening in higher rent parts of town (downtown, close-in and Beaverton-Hillsboro). With builders looking at SDCs (System Development Charges) and fees pushing >$20K per UNIT, this comes out of anticipated return (at 5% debt that’s almost $100/month to service soft costs). Add in Inclusionary Zoning (forcing builders to include income restricted units) and Portland is in a new construction lull.
NEW CONSTRUCTION BY COUNTY
The continuing attraction of Washington County (Beaverton and Hillsboro) as a rental market will be due to the availability of high-income jobs at places like Nike, Intel and their support businesses. Projections have Washington County exceeding Multnomah County in jobs and population by 2030 with development following suit.
Portland Building Permits – With the introduction of Inclusionary Zoning, building permits have declined markedly. Adding the effect of Portland-only tenant rules, I’d expect a housing shortage in about 3 to 5 years once excess new inventory gets absorbed. Lease-up – Is becoming an issue with a lot of new inventory coming on line at once. Most banks won’t transition to permanent (i.e. cheaper than construction) financing until a property is stabilized (<10% vacancies).
Projects Units Projects Units Projects Units Projects Units Projects Units
2010 2 129 2 66 9 747 1 238 14 1180
2011 1 302 1 48 16 691 1 34 19 1075
2012 4 518 4 528 19 1051 2 225 29 2322
2013 4 586 11 1880 59 3931 9 1124 83 7521
2014 3 361 7 629 54 3685 12 2256 76 6931
2015 5 265 7 792 57 3660 17 1846 86 6563
2016 6 494 18 2418 86 9542 13 2397 123 14851
2017 8 779 13 1182 75 5404 15 2402 111 9767
2018 4 240 35 5792 232 15499 24 2050 295 23581
2019 6 1138 8 851 144 10981 16 1547 174 14517
2020 7 1133 9 487 202 11231 17 1856 235 14707
All Const 646 37297 750 50445 4903 176845 1137 83897 7436 348484
New/All Const 7.74% 15.94% 15.33% 29.09% 19.44% 37.56% 11.17% 19.04% 16.74% 29.56%
Clack Clark Mult Wash 4 County

P a g e | 19
www.smicre.com
Steve Morris / Principal Broker SMI CRE / (503) 970-4593 / [email protected]
Non-traditional housing – New projects include micro-units, group housing like college quads, no allowance for cars and active green designs. It’ll take time to see what sticks, but keeping current can give you ideas for upgrades on your apartments. However, sometimes markets can only support one outlier of a different rental arrangement.
P a g e | 20
www.smicre.com
Steve Morris / Principal Broker SMI CRE / (503) 970-4593 / [email protected]
2019 Sales by County
P a g e | 21
www.smicre.com
Steve Morris / Principal Broker SMI CRE / (503) 970-4593 / [email protected]
2019 Sales by County
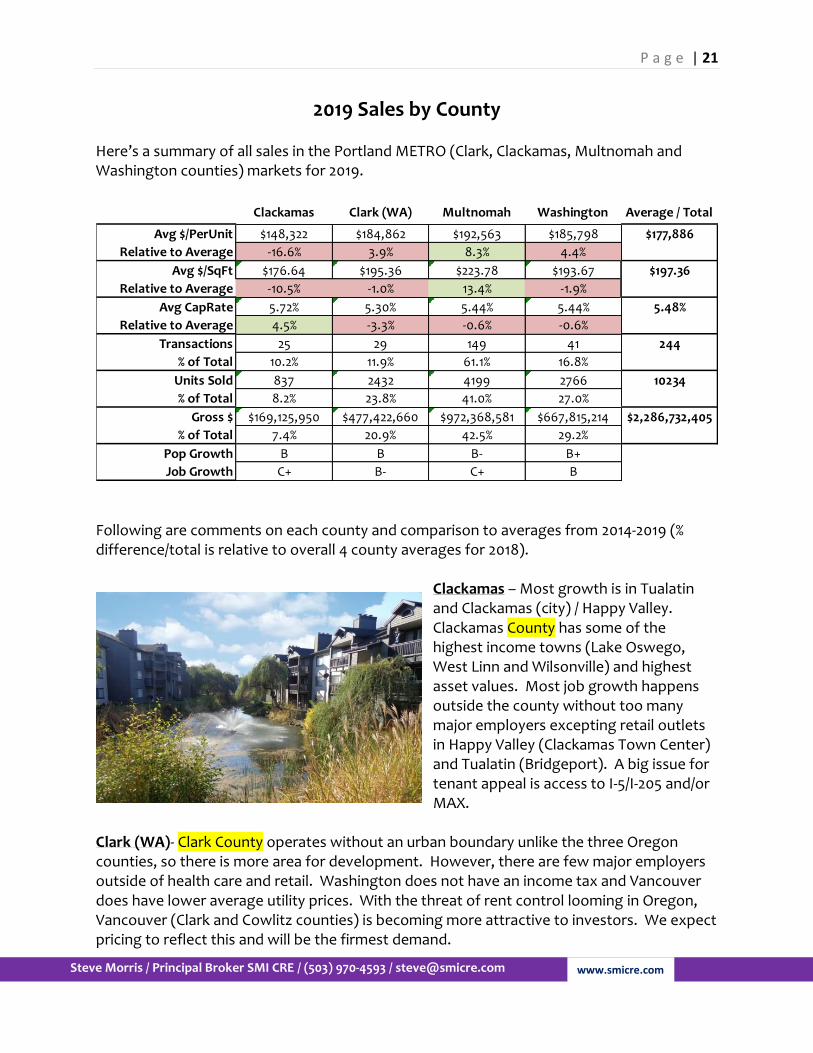
Here’s a summary of all sales in the Portland METRO (Clark, Clackamas, Multnomah and Washington counties) markets for 2019.
Following are comments on each county and comparison to averages from 2014-2019 (% difference/total is relative to overall 4 county averages for 2018).
Clackamas – Most growth is in Tualatin and Clackamas (city) / Happy Valley. Clackamas County has some of the highest income towns (Lake Oswego, West Linn and Wilsonville) and highest asset values. Most job growth happens outside the county without too many major employers excepting retail outlets in Happy Valley (Clackamas Town Center) and Tualatin (Bridgeport). A big issue for tenant appeal is access to I-5/I-205 and/or MAX.
Clark (WA)- Clark County operates without an urban boundary unlike the three Oregon counties, so there is more area for development. However, there are few major employers outside of health care and retail. Washington does not have an income tax and Vancouver does have lower average utility prices. With the threat of rent control looming in Oregon, Vancouver (Clark and Cowlitz counties) is becoming more attractive to investors. We expect pricing to reflect this and will be the firmest demand.
Clackamas Clark (WA) Multnomah Washington Average / Total
Avg $/PerUnit $148,322 $184,862 $192,563 $185,798 $177,886
Relative to Average -16.6% 3.9% 8.3% 4.4%
Avg $/SqFt $176.64 $195.36 $223.78 $193.67 $197.36
Relative to Average -10.5% -1.0% 13.4% -1.9%
Avg CapRate 5.72% 5.30% 5.44% 5.44% 5.48%
Relative to Average 4.5% -3.3% -0.6% -0.6%
Transactions 25 29 149 41 244
% of Total 10.2% 11.9% 61.1% 16.8%
Units Sold 837 2432 4199 2766 10234
% of Total 8.2% 23.8% 41.0% 27.0%
Gross $ $169,125,950 $477,422,660 $972,368,581 $667,815,214 $2,286,732,405
% of Total 7.4% 20.9% 42.5% 29.2%
Pop Growth B B B- B+
Job Growth C+ B- C+ B

P a g e | 22
www.smicre.com
Steve Morris / Principal Broker SMI CRE / (503) 970-4593 / [email protected]
Multnomah – Is the economic center of METRO, however, the inability to attract large non-governmental employers is beginning to show. Multnomah remains the most expensive part of the METRO area. Portland has one of the most activist governments for tenant rights and the highest soft costs in the area for builders. Portland has introduced soft rent caps and inclusionary zoning forcing builders into including affordable units. Washington –In 10 years its population is projected to pass Multnomah county. A lot of fuel for growth is based on the high-tech business (Intel, Synopsys, Genentech and Salesforce.com) centered on Hillsboro and Nike in the Beaverton area. In addition, there is more land available for construction of residential and plant, so larger complexes exist as a focus for developers. Here’s an estimate of the total number of rentable units by county and complexes
Clack Clark Mult Wash Grand Total
Buildings 650 763 5093 1146 7652
Units 37842 50769 190959 84988 364558
% of Total Units 10.4% 13.9% 52.4% 23.3% 100%
P a g e | 23
www.smicre.com
Steve Morris / Principal Broker SMI CRE / (503) 970-4593 / [email protected]
2019 Sales by Neighborhood

P a g e | 24
www.smicre.com
Steve Morris / Principal Broker SMI CRE / (503) 970-4593 / [email protected]
2014-2019 Sales by Neighborhood
Total Sales all 4 Portland Metro Counties (Neighborhoods are sorted by ascending Cap Rates)
4 County Total
Portland Central / West
Central Portland and close-in West – Prices are higher, but you get asset preservation since it’s still a very in demand neighborhood. Most new construction is either income-qualified or high-end (>$3/sqft/month rent). Operating expenses (especially water/sewer) and property taxes (due to bonds) are among the highest in the metro area. Two other areas are siphoning off high rents – Close-in East Portland and Hillsboro / Beaverton. The gross dollar sales lead is slipping to the Beaverton-Hillsboro and Washington county area due to job growth and availability of amenities. If you’re thinking of buying an older building (pre-1930), be aware of Portland’s seismic retrofit plans – I can send info.
Vancouver
Vancouver – Benefits from lower operating costs (especially utilities). Rent demand seems
2014 2015 2016 2017 2018 2019 Grand Total
Total Sales $1,552,279,907 $2,324,616,766 $3,003,614,130 $1,782,698,685 $2,526,774,022 $2,295,433,405 $12,367,173,787
Avg $/unit $120,450 $128,605 $150,095 $177,034 $186,684 $185,554 $145,163
Tranasctions 195 281 277 225 274 246 1450
Avg $/SqFt $129.73 $153.61 $173.41 $202.53 $223.26 $210.29 $167.65
Avg CapRate 6.10% 5.68% 5.43% 5.36% 5.35% 5.45% 5.70%
2014 2015 2016 2017 2018 2019 Grand Total
Total Sales $321,315,450 $392,167,070 $409,330,500 $236,059,716 $503,731,676 $551,567,920 $2,049,903,192
Avg $/unit $206,485 $171,964 $223,320 $243,481 $226,506 $227,360 $197,997
Tranasctions 25 41 26 21 41 33 174
Avg $/SqFt $203.40 $223.30 $279.30 $293.57 $297.27 $246.03 $241.16
Avg CapRate 5.18% 4.89% 4.82% 4.13% 5.07% 4.83% 4.97%
% 4 county total $ 20.7% 16.9% 13.6% 13.2% 19.9% 24.0% 16.6%
2014 2015 2016 2017 2018 2019 Grand Total
Total Sales $94,448,709 $218,934,301 $335,454,339 $168,480,884 $270,783,450 $476,723,660 $1,356,211,474
Avg $/unit $89,986 $121,084 $116,795 $172,836 $176,903 $186,471 $125,198
Tranasctions 18 24 29 16 25 28 130
Avg $/SqFt $91.59 $127.67 $128.89 $162.68 $161.49 $198.14 $125.03
Avg CapRate 6.69% 6.00% 6.00% 5.83% 5.69% 5.31% 6.19%
% 4 county total $ 6.1% 9.4% 11.2% 9.5% 10.7% 20.8% 11.0%
P a g e | 25
www.smicre.com
Steve Morris / Principal Broker SMI CRE / (503) 970-4593 / [email protected]
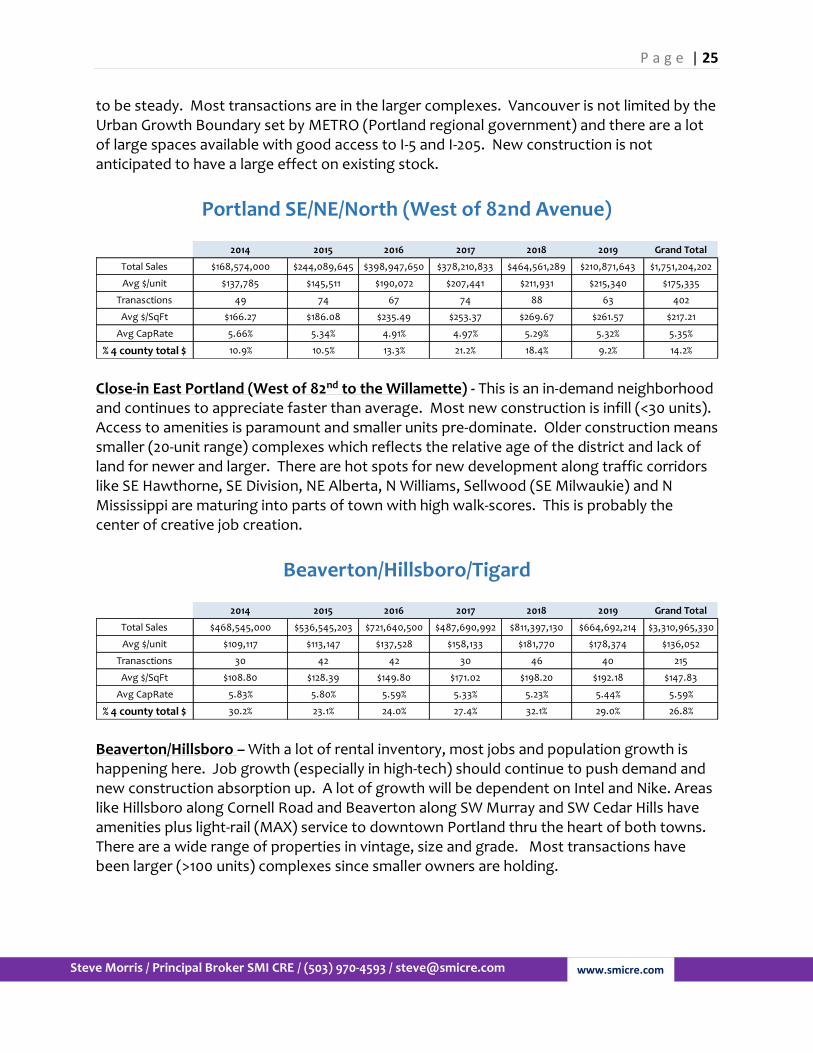
to be steady. Most transactions are in the larger complexes. Vancouver is not limited by the Urban Growth Boundary set by METRO (Portland regional government) and there are a lot of large spaces available with good access to I-5 and I-205. New construction is not anticipated to have a large effect on existing stock.
Portland SE/NE/North (West of 82nd Avenue)
Close-in East Portland (West of 82nd to the Willamette) - This is an in-demand neighborhood and continues to appreciate faster than average. Most new construction is infill (<30 units). Access to amenities is paramount and smaller units pre-dominate. Older construction means smaller (20-unit range) complexes which reflects the relative age of the district and lack of land for newer and larger. There are hot spots for new development along traffic corridors like SE Hawthorne, SE Division, NE Alberta, N Williams, Sellwood (SE Milwaukie) and N Mississippi are maturing into parts of town with high walk-scores. This is probably the center of creative job creation.
Beaverton/Hillsboro/Tigard
Beaverton/Hillsboro – With a lot of rental inventory, most jobs and population growth is happening here. Job growth (especially in high-tech) should continue to push demand and new construction absorption up. A lot of growth will be dependent on Intel and Nike. Areas like Hillsboro along Cornell Road and Beaverton along SW Murray and SW Cedar Hills have amenities plus light-rail (MAX) service to downtown Portland thru the heart of both towns. There are a wide range of properties in vintage, size and grade. Most transactions have been larger (>100 units) complexes since smaller owners are holding.
2014 2015 2016 2017 2018 2019 Grand Total
Total Sales $168,574,000 $244,089,645 $398,947,650 $378,210,833 $464,561,289 $210,871,643 $1,751,204,202
Avg $/unit $137,785 $145,511 $190,072 $207,441 $211,931 $215,340 $175,335
Tranasctions 49 74 67 74 88 63 402
Avg $/SqFt $166.27 $186.08 $235.49 $253.37 $269.67 $261.57 $217.21
Avg CapRate 5.66% 5.34% 4.91% 4.97% 5.29% 5.32% 5.35%
% 4 county total $ 10.9% 10.5% 13.3% 21.2% 18.4% 9.2% 14.2%
2014 2015 2016 2017 2018 2019 Grand Total
Total Sales $468,545,000 $536,545,203 $721,640,500 $487,690,992 $811,397,130 $664,692,214 $3,310,965,330
Avg $/unit $109,117 $113,147 $137,528 $158,133 $181,770 $178,374 $136,052
Tranasctions 30 42 42 30 46 40 215
Avg $/SqFt $108.80 $128.39 $149.80 $171.02 $198.20 $192.18 $147.83
Avg CapRate 5.83% 5.80% 5.59% 5.33% 5.23% 5.44% 5.59%
% 4 county total $ 30.2% 23.1% 24.0% 27.4% 32.1% 29.0% 26.8%
P a g e | 26
www.smicre.com
Steve Morris / Principal Broker SMI CRE / (503) 970-4593 / [email protected]
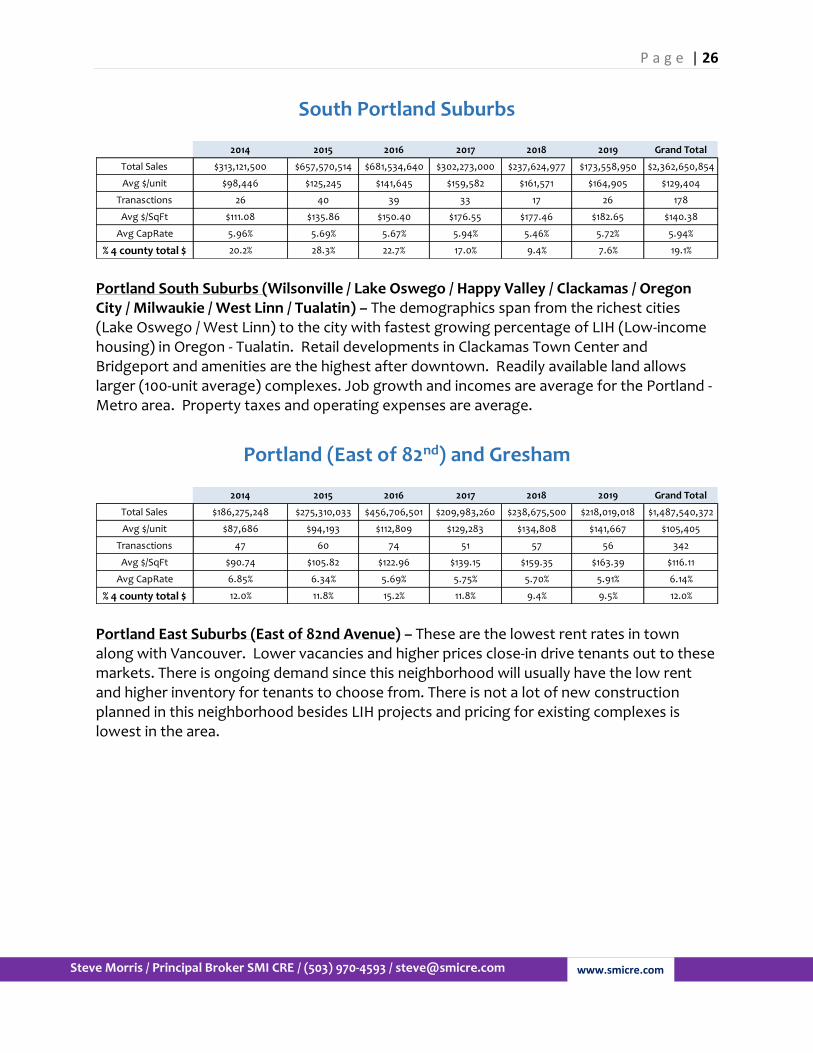
South Portland Suburbs
Portland South Suburbs (Wilsonville / Lake Oswego / Happy Valley / Clackamas / Oregon City / Milwaukie / West Linn / Tualatin) – The demographics span from the richest cities (Lake Oswego / West Linn) to the city with fastest growing percentage of LIH (Low-income housing) in Oregon - Tualatin. Retail developments in Clackamas Town Center and Bridgeport and amenities are the highest after downtown. Readily available land allows larger (100-unit average) complexes. Job growth and incomes are average for the Portland - Metro area. Property taxes and operating expenses are average.
Portland (East of 82nd) and Gresham
Portland East Suburbs (East of 82nd Avenue) – These are the lowest rent rates in town along with Vancouver. Lower vacancies and higher prices close-in drive tenants out to these markets. There is ongoing demand since this neighborhood will usually have the low rent and higher inventory for tenants to choose from. There is not a lot of new construction planned in this neighborhood besides LIH projects and pricing for existing complexes is lowest in the area.
2014 2015 2016 2017 2018 2019 Grand Total
Total Sales $313,121,500 $657,570,514 $681,534,640 $302,273,000 $237,624,977 $173,558,950 $2,362,650,854
Avg $/unit $98,446 $125,245 $141,645 $159,582 $161,571 $164,905 $129,404
Tranasctions 26 40 39 33 17 26 178
Avg $/SqFt $111.08 $135.86 $150.40 $176.55 $177.46 $182.65 $140.38
Avg CapRate 5.96% 5.69% 5.67% 5.94% 5.46% 5.72% 5.94%
% 4 county total $ 20.2% 28.3% 22.7% 17.0% 9.4% 7.6% 19.1%
2014 2015 2016 2017 2018 2019 Grand Total
Total Sales $186,275,248 $275,310,033 $456,706,501 $209,983,260 $238,675,500 $218,019,018 $1,487,540,372
Avg $/unit $87,686 $94,193 $112,809 $129,283 $134,808 $141,667 $105,405
Tranasctions 47 60 74 51 57 56 342
Avg $/SqFt $90.74 $105.82 $122.96 $139.15 $159.35 $163.39 $116.11
Avg CapRate 6.85% 6.34% 5.69% 5.75% 5.70% 5.91% 6.14%
% 4 county total $ 12.0% 11.8% 15.2% 11.8% 9.4% 9.5% 12.0%
P a g e | 27
www.smicre.com
Steve Morris / Principal Broker SMI CRE / (503) 970-4593 / [email protected]
P a g e | 28
www.smicre.com
Steve Morris / Principal Broker SMI CRE / (503) 970-4593 / [email protected]
P a g e | 29
www.smicre.com
Steve Morris / Principal Broker SMI CRE / (503) 970-4593 / [email protected]
2014-2019 Sales by Complex Size
P a g e | 30
www.smicre.com
Steve Morris / Principal Broker SMI CRE / (503) 970-4593 / [email protected]
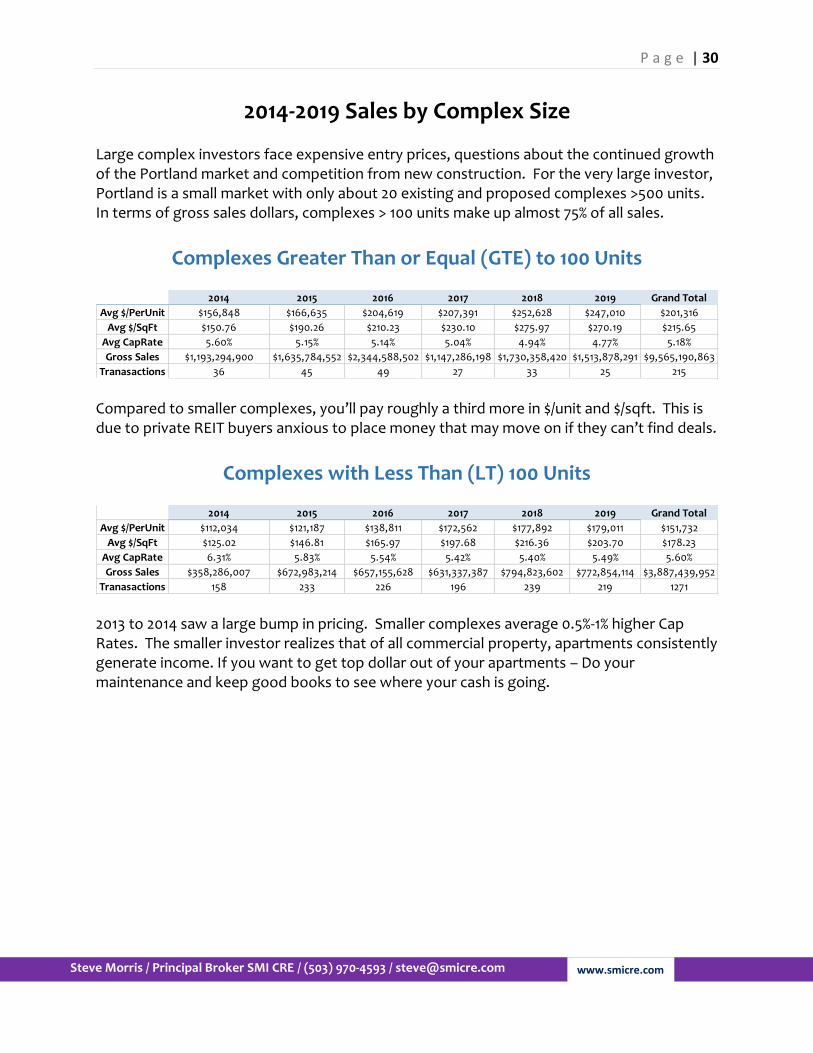
2014-2019 Sales by Complex Size Large complex investors face expensive entry prices, questions about the continued growth of the Portland market and competition from new construction. For the very large investor, Portland is a small market with only about 20 existing and proposed complexes >500 units. In terms of gross sales dollars, complexes > 100 units make up almost 75% of all sales.
Complexes Greater Than or Equal (GTE) to 100 Units
Compared to smaller complexes, you’ll pay roughly a third more in $/unit and $/sqft. This is due to private REIT buyers anxious to place money that may move on if they can’t find deals.
Complexes with Less Than (LT) 100 Units
2013 to 2014 saw a large bump in pricing. Smaller complexes average 0.5%-1% higher Cap Rates. The smaller investor realizes that of all commercial property, apartments consistently generate income. If you want to get top dollar out of your apartments – Do your maintenance and keep good books to see where your cash is going.
2014 2015 2016 2017 2018 2019 Grand Total
Avg $/PerUnit $156,848 $166,635 $204,619 $207,391 $252,628 $247,010 $201,316
Avg $/SqFt $150.76 $190.26 $210.23 $230.10 $275.97 $270.19 $215.65
Avg CapRate 5.60% 5.15% 5.14% 5.04% 4.94% 4.77% 5.18%
Gross Sales $1,193,294,900 $1,635,784,552 $2,344,588,502 $1,147,286,198 $1,730,358,420 $1,513,878,291 $9,565,190,863
Tranasactions 36 45 49 27 33 25 215
2014 2015 2016 2017 2018 2019 Grand Total
Avg $/PerUnit $112,034 $121,187 $138,811 $172,562 $177,892 $179,011 $151,732
Avg $/SqFt $125.02 $146.81 $165.97 $197.68 $216.36 $203.70 $178.23
Avg CapRate 6.31% 5.83% 5.54% 5.42% 5.40% 5.49% 5.60%
Gross Sales $358,286,007 $672,983,214 $657,155,628 $631,337,387 $794,823,602 $772,854,114 $3,887,439,952
Tranasactions 158 233 226 196 239 219 1271

P a g e | 31
www.smicre.com
Steve Morris / Principal Broker SMI CRE / (503) 970-4593 / [email protected]
P a g e | 32
www.smicre.com
Steve Morris / Principal Broker SMI CRE / (503) 970-4593 / [email protected]
2014-2019 Sales by Decade Built
P a g e | 33
www.smicre.com
Steve Morris / Principal Broker SMI CRE / (503) 970-4593 / [email protected]
2014-2019 Sales by Decade Built
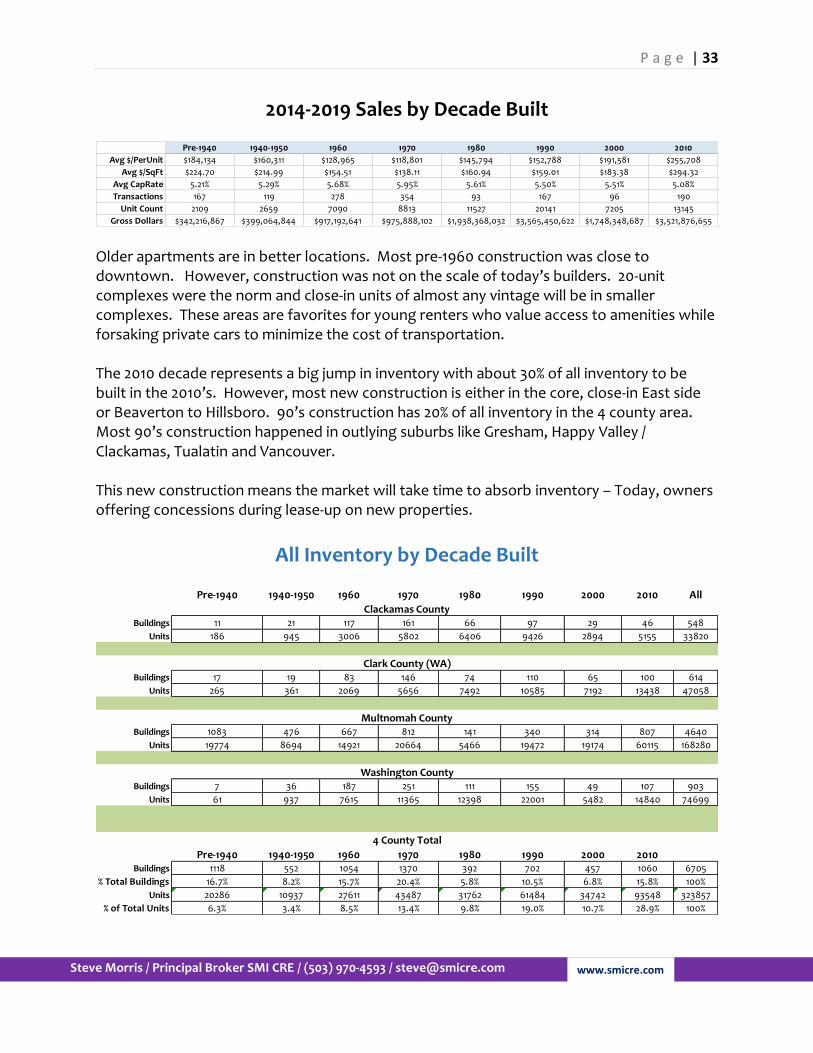
Older apartments are in better locations. Most pre-1960 construction was close to downtown. However, construction was not on the scale of today’s builders. 20-unit complexes were the norm and close-in units of almost any vintage will be in smaller complexes. These areas are favorites for young renters who value access to amenities while forsaking private cars to minimize the cost of transportation. The 2010 decade represents a big jump in inventory with about 30% of all inventory to be built in the 2010’s. However, most new construction is either in the core, close-in East side or Beaverton to Hillsboro. 90’s construction has 20% of all inventory in the 4 county area. Most 90’s construction happened in outlying suburbs like Gresham, Happy Valley / Clackamas, Tualatin and Vancouver. This new construction means the market will take time to absorb inventory – Today, owners offering concessions during lease-up on new properties.
All Inventory by Decade Built
Pre-1940 1940-1950 1960 1970 1980 1990 2000 2010
Avg $/PerUnit $184,134 $160,311 $128,965 $118,801 $145,794 $152,788 $191,581 $255,708
Avg $/SqFt $224.70 $214.99 $154.51 $138.11 $160.94 $159.01 $183.38 $294.32
Avg CapRate 5.21% 5.29% 5.68% 5.95% 5.61% 5.50% 5.51% 5.08%
Transactions 167 119 278 354 93 167 96 190
Unit Count 2109 2659 7090 8813 11527 20141 7205 13145
Gross Dollars $342,216,867 $399,064,844 $917,192,641 $975,888,102 $1,938,368,032 $3,565,450,622 $1,748,348,687 $3,521,876,655
Pre-1940 1940-1950 1960 1970 1980 1990 2000 2010 All
Buildings 11 21 117 161 66 97 29 46 548
Units 186 945 3006 5802 6406 9426 2894 5155 33820
Buildings 17 19 83 146 74 110 65 100 614
Units 265 361 2069 5656 7492 10585 7192 13438 47058
Buildings 1083 476 667 812 141 340 314 807 4640
Units 19774 8694 14921 20664 5466 19472 19174 60115 168280
Buildings 7 36 187 251 111 155 49 107 903
Units 61 937 7615 11365 12398 22001 5482 14840 74699
Pre-1940 1940-1950 1960 1970 1980 1990 2000 2010Buildings 1118 552 1054 1370 392 702 457 1060 6705
% Total Buildings 16.7% 8.2% 15.7% 20.4% 5.8% 10.5% 6.8% 15.8% 100%
Units 20286 10937 27611 43487 31762 61484 34742 93548 323857
% of Total Units 6.3% 3.4% 8.5% 13.4% 9.8% 19.0% 10.7% 28.9% 100%
4 County Total
Clackamas County
Clark County (WA)
Multnomah County
Washington County

P a g e | 34
www.smicre.com
Steve Morris / Principal Broker SMI CRE / (503) 970-4593 / [email protected]
2014-2019 Sales by Decade Built Detail Pre-1940 - Almost all construction close-in (downtown) to the Willamette. Before mid-1920’s construction was mostly unreinforced masonry (check with your insurance agent on coverage). City of Portland has backed off on new rules for retrofits on URM (unreinforced masonry) buildings, but be prepared. Most units in a studio configuration or SROs.
194x-195x - After World War II Portland witnessed a burst of population and income growth. In addition, housing for all these new residents included single-family residences. Location was a little farther out (West Hills to 39th avenue and North Portland.) Most construction was wood frame and siding, however units became larger including 1- and 2-bedroom complexes. Again, most of these complexes have great locations since Portland didn’t go much beyond 39th/Cesar Chavez to the east.
196x and 197x - Construction trends continued, however the growth of suburbs like Beaverton and Gresham and Vancouver captured a lot of new construction with the availability and low cost of land along with lower soft costs than Portland proper. Also contributing were services and amenities became more common in the suburbs and outer edges of town. Complex sizes began to inch up into the 100+ unit range, but this was just the start. 70s vintage units see to offer the most bang for the buck with lowest $/unit but seem to suffer the ravages of owner neglect and poorer locations.
P a g e | 35
www.smicre.com
Steve Morris / Principal Broker SMI CRE / (503) 970-4593 / [email protected]
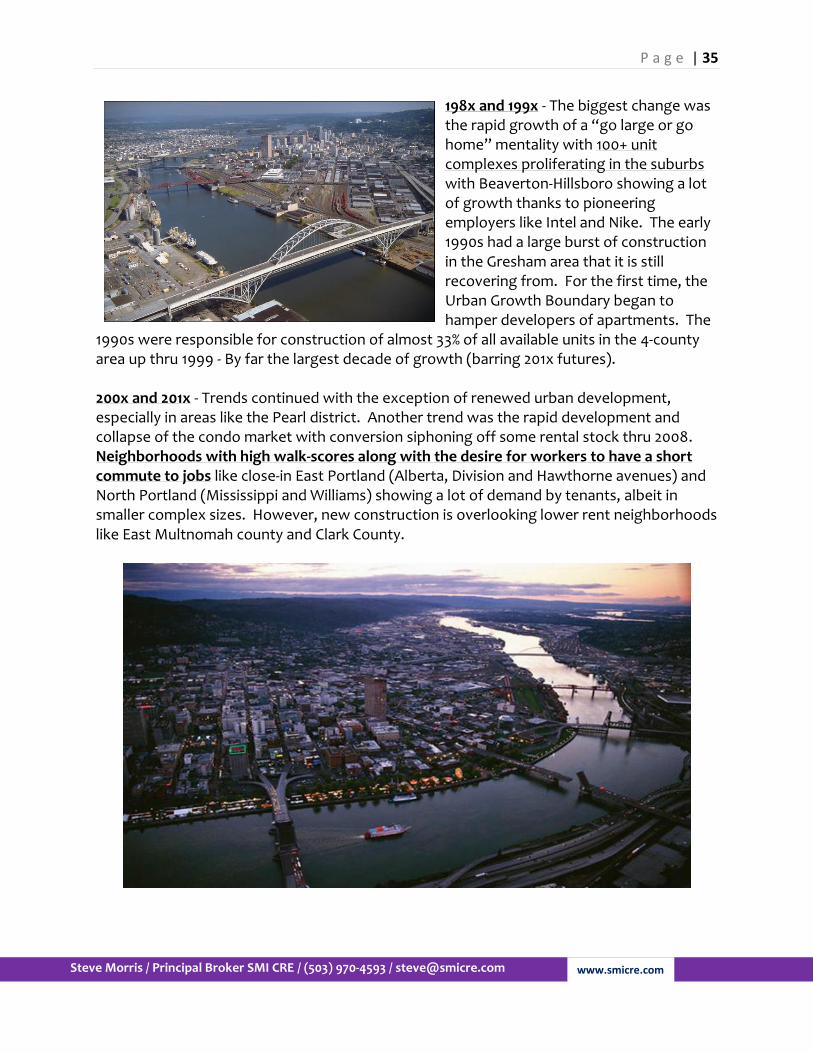
198x and 199x - The biggest change was the rapid growth of a “go large or go home” mentality with 100+ unit complexes proliferating in the suburbs with Beaverton-Hillsboro showing a lot of growth thanks to pioneering employers like Intel and Nike. The early 1990s had a large burst of construction in the Gresham area that it is still recovering from. For the first time, the Urban Growth Boundary began to hamper developers of apartments. The
1990s were responsible for construction of almost 33% of all available units in the 4-county area up thru 1999 - By far the largest decade of growth (barring 201x futures). 200x and 201x - Trends continued with the exception of renewed urban development, especially in areas like the Pearl district. Another trend was the rapid development and collapse of the condo market with conversion siphoning off some rental stock thru 2008. Neighborhoods with high walk-scores along with the desire for workers to have a short commute to jobs like close-in East Portland (Alberta, Division and Hawthorne avenues) and North Portland (Mississippi and Williams) showing a lot of demand by tenants, albeit in smaller complex sizes. However, new construction is overlooking lower rent neighborhoods like East Multnomah county and Clark County.

P a g e | 36
www.smicre.com
Steve Morris / Principal Broker SMI CRE / (503) 970-4593 / [email protected]

P a g e | 37
www.smicre.com
Steve Morris / Principal Broker SMI CRE / (503) 970-4593 / [email protected]
2019 Largest Sales by Gross $, $/Unit& $/SqFt
P a g e | 38
www.smicre.com
Steve Morris / Principal Broker SMI CRE / (503) 970-4593 / [email protected]
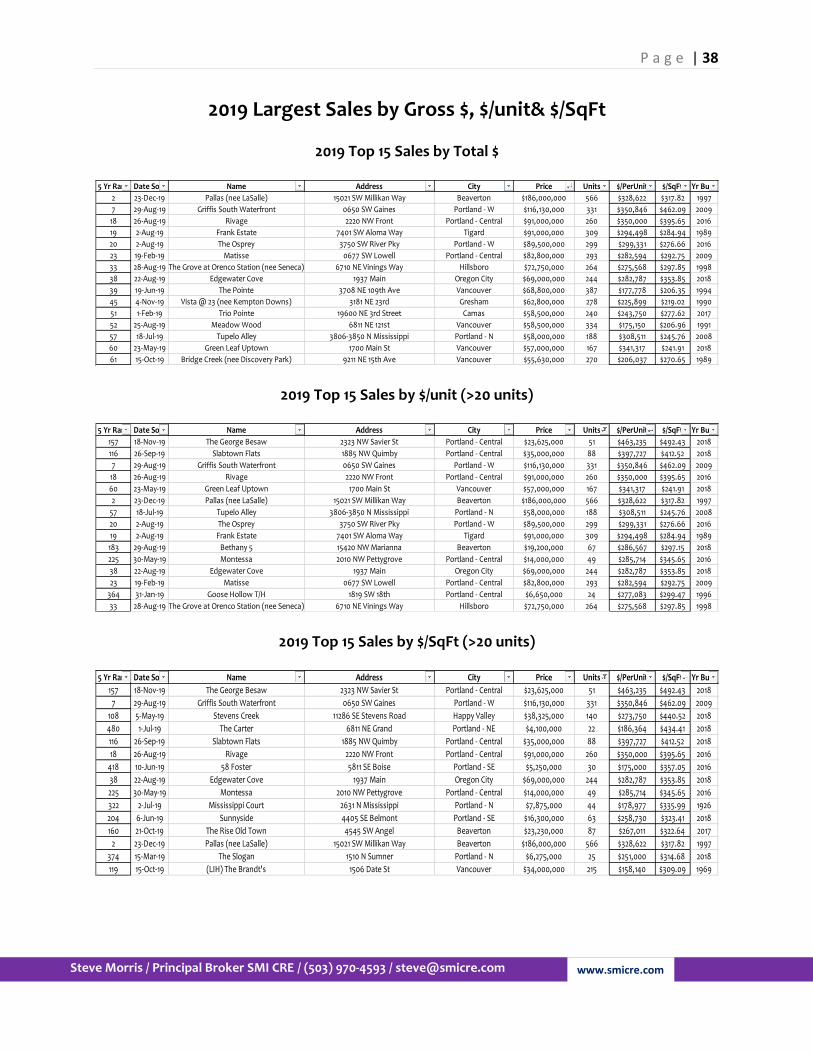
2019 Largest Sales by Gross $, $/unit& $/SqFt
2019 Top 15 Sales by Total $
2019 Top 15 Sales by $/unit (>20 units)
2019 Top 15 Sales by $/SqFt (>20 units)
5 Yr Rank Date Sold Name Address City Price Units $/PerUnit $/SqFt Yr Built
2 23-Dec-19 Pallas (nee LaSalle) 15021 SW Millikan Way Beaverton $186,000,000 566 $328,622 $317.82 1997
7 29-Aug-19 Griffis South Waterfront 0650 SW Gaines Portland - W $116,130,000 331 $350,846 $462.09 2009
18 26-Aug-19 Rivage 2220 NW Front Portland - Central $91,000,000 260 $350,000 $395.65 2016
19 2-Aug-19 Frank Estate 7401 SW Aloma Way Tigard $91,000,000 309 $294,498 $284.94 1989
20 2-Aug-19 The Osprey 3750 SW River Pky Portland - W $89,500,000 299 $299,331 $276.66 2016
23 19-Feb-19 Matisse 0677 SW Lowell Portland - Central $82,800,000 293 $282,594 $292.75 2009
33 28-Aug-19 The Grove at Orenco Station (nee Seneca) 6710 NE Vinings Way Hillsboro $72,750,000 264 $275,568 $297.85 1998
38 22-Aug-19 Edgewater Cove 1937 Main Oregon City $69,000,000 244 $282,787 $353.85 2018
39 19-Jun-19 The Pointe 3708 NE 109th Ave Vancouver $68,800,000 387 $177,778 $206.35 1994
45 4-Nov-19 Vista @ 23 (nee Kempton Downs) 3181 NE 23rd Gresham $62,800,000 278 $225,899 $219.02 1990
51 1-Feb-19 Trio Pointe 19600 NE 3rd Street Camas $58,500,000 240 $243,750 $277.62 2017
52 25-Aug-19 Meadow Wood 6811 NE 121st Vancouver $58,500,000 334 $175,150 $206.96 1991
57 18-Jul-19 Tupelo Alley 3806-3850 N Mississippi Portland - N $58,000,000 188 $308,511 $245.76 2008
60 23-May-19 Green Leaf Uptown 1700 Main St Vancouver $57,000,000 167 $341,317 $241.91 2018
61 15-Oct-19 Bridge Creek (nee Discovery Park) 9211 NE 15th Ave Vancouver $55,630,000 270 $206,037 $270.65 1989
5 Yr Rank Date Sold Name Address City Price Units $/PerUnit $/SqFt Yr Built
157 18-Nov-19 The George Besaw 2323 NW Savier St Portland - Central $23,625,000 51 $463,235 $492.43 2018
116 26-Sep-19 Slabtown Flats 1885 NW Quimby Portland - Central $35,000,000 88 $397,727 $412.52 2018
7 29-Aug-19 Griffis South Waterfront 0650 SW Gaines Portland - W $116,130,000 331 $350,846 $462.09 2009
18 26-Aug-19 Rivage 2220 NW Front Portland - Central $91,000,000 260 $350,000 $395.65 2016
60 23-May-19 Green Leaf Uptown 1700 Main St Vancouver $57,000,000 167 $341,317 $241.91 2018
2 23-Dec-19 Pallas (nee LaSalle) 15021 SW Millikan Way Beaverton $186,000,000 566 $328,622 $317.82 1997
57 18-Jul-19 Tupelo Alley 3806-3850 N Mississippi Portland - N $58,000,000 188 $308,511 $245.76 2008
20 2-Aug-19 The Osprey 3750 SW River Pky Portland - W $89,500,000 299 $299,331 $276.66 2016
19 2-Aug-19 Frank Estate 7401 SW Aloma Way Tigard $91,000,000 309 $294,498 $284.94 1989
183 29-Aug-19 Bethany 5 15420 NW Marianna Beaverton $19,200,000 67 $286,567 $297.15 2018
225 30-May-19 Montessa 2010 NW Pettygrove Portland - Central $14,000,000 49 $285,714 $345.65 2016
38 22-Aug-19 Edgewater Cove 1937 Main Oregon City $69,000,000 244 $282,787 $353.85 2018
23 19-Feb-19 Matisse 0677 SW Lowell Portland - Central $82,800,000 293 $282,594 $292.75 2009
364 31-Jan-19 Goose Hollow T/H 1819 SW 18th Portland - Central $6,650,000 24 $277,083 $299.47 1996
33 28-Aug-19 The Grove at Orenco Station (nee Seneca) 6710 NE Vinings Way Hillsboro $72,750,000 264 $275,568 $297.85 1998
5 Yr Rank Date Sold Name Address City Price Units $/PerUnit $/SqFt Yr Built
157 18-Nov-19 The George Besaw 2323 NW Savier St Portland - Central $23,625,000 51 $463,235 $492.43 2018
7 29-Aug-19 Griffis South Waterfront 0650 SW Gaines Portland - W $116,130,000 331 $350,846 $462.09 2009
108 5-May-19 Stevens Creek 11286 SE Stevens Road Happy Valley $38,325,000 140 $273,750 $440.52 2018
480 1-Jul-19 The Carter 6811 NE Grand Portland - NE $4,100,000 22 $186,364 $434.41 2018
116 26-Sep-19 Slabtown Flats 1885 NW Quimby Portland - Central $35,000,000 88 $397,727 $412.52 2018
18 26-Aug-19 Rivage 2220 NW Front Portland - Central $91,000,000 260 $350,000 $395.65 2016
418 10-Jun-19 58 Foster 5811 SE Boise Portland - SE $5,250,000 30 $175,000 $357.05 2016
38 22-Aug-19 Edgewater Cove 1937 Main Oregon City $69,000,000 244 $282,787 $353.85 2018
225 30-May-19 Montessa 2010 NW Pettygrove Portland - Central $14,000,000 49 $285,714 $345.65 2016
322 2-Jul-19 Mississippi Court 2631 N Mississippi Portland - N $7,875,000 44 $178,977 $335.99 1926
204 6-Jun-19 Sunnyside 4405 SE Belmont Portland - SE $16,300,000 63 $258,730 $323.41 2018
160 21-Oct-19 The Rise Old Town 4545 SW Angel Beaverton $23,230,000 87 $267,011 $322.64 2017
2 23-Dec-19 Pallas (nee LaSalle) 15021 SW Millikan Way Beaverton $186,000,000 566 $328,622 $317.82 1997
374 15-Mar-19 The Slogan 1510 N Sumner Portland - N $6,275,000 25 $251,000 $314.68 2018
119 15-Oct-19 (LIH) The Brandt's 1506 Date St Vancouver $34,000,000 215 $158,140 $309.09 1969

P a g e | 39
www.smicre.com
Steve Morris / Principal Broker SMI CRE / (503) 970-4593 / [email protected]
2019 Largest Sales by County

P a g e | 40
www.smicre.com
Steve Morris / Principal Broker SMI CRE / (503) 970-4593 / [email protected]
Clackamas - 2019 Top 10 Sales by Total $
Clark (WA) - 2019 Top 10 Sales by Total $
Multnomah - 2019 Top 10 Sales by Total $
Washington - 2019 Top 10 Sales by Total $
5 Yr Rank Date Sold Name Address City Price Units $/PerUnit $/SqFt Yr Built
38 22-Aug-19 Edgewater Cove 1937 Main Oregon City $69,000,000 244 $282,787 $353.85 2018
108 5-May-19 Stevens Creek 11286 SE Stevens Road Happy Valley $38,325,000 140 $273,750 $440.52 2018
331 19-Dec-19 Heather Crossing 4483 SE Roethe Rd Milwaukie $7,685,000 44 $174,659 $170.75 1972
359 24-Sep-19 Village Monroe 3677 SE Monroe Milwaukie $6,775,000 46 $147,283 $173.54 1978
400 22-Apr-19 Stanford 2013 SE Courtney Rd Milwaukie $5,700,000 35 $162,857 $240.00 1977
422 30-Aug-19 Westview Villa 3552 SE Westview Rd Milwaukie $5,195,000 30 $173,167 $151.12 1971
467 27-Sep-19 Oregon City Terrace 600 May Oregon City $4,250,000 48 $88,542 $106.38 1970
517 28-Aug-19 Pheasant Court 7015 SE Lake Milwaukie $3,700,000 22 $168,182 $195.25 1970
605 5-Apr-19 Park at 28 (nee Woodleaf) 28900 SW Parkway Wilsonville $2,950,000 24 $122,917 $154.65 1977
614 30-Jan-19 Fox Chase 30625 SW Willamette Way E Wilsonville $2,850,000 15 $190,000 $152.86 2015
5 Yr Rank Date Sold Name Address City Price Units $/PerUnit $/SqFt Yr Built
39 19-Jun-19 The Pointe 3708 NE 109th Ave Vancouver $68,800,000 387 $177,778 $206.35 1994
51 1-Feb-19 Trio Pointe 19600 NE 3rd Street Camas $58,500,000 240 $243,750 $277.62 2017
52 25-Aug-19 Meadow Wood 6811 NE 121st Vancouver $58,500,000 334 $175,150 $206.96 1991
60 23-May-19 Green Leaf Uptown 1700 Main St Vancouver $57,000,000 167 $341,317 $241.91 2018
61 15-Oct-19 Bridge Creek (nee Discovery Park) 9211 NE 15th Ave Vancouver $55,630,000 270 $206,037 $270.65 1989
119 15-Oct-19 (LIH) The Brandt's 1506 Date St Vancouver $34,000,000 215 $158,140 $309.09 1969
132 23-May-19Creekside Village (The Glen at Burnt Bridge Creek) 3100 Falk Rd Vancouver $29,000,000 132 $219,697 $148.89 1992
148 25-Sep-19 Springwood Landing (SENIOR) 301 SE 136th Ave Vancouver $26,320,497 136 $193,533 $203.59 2018
201 28-Aug-19 The Lavonne 6727 NE Vancouver Mall Dr Vancouver $17,062,500 75 $227,500 $226.80 2019
209 3-May-19 Somerset Terrace 13607 SE 19th Street Vancouver $16,130,000 95 $169,789 $158.14 1974
5 Yr Rank Date Sold Name Address City Price Units $/PerUnit $/SqFt Yr Built
7 29-Aug-19 Griffis South Waterfront 0650 SW Gaines Portland - W $116,130,000 331 $350,846 $462.09 2009
18 26-Aug-19 Rivage 2220 NW Front Portland - Central $91,000,000 260 $350,000 $395.65 2016
20 2-Aug-19 The Osprey 3750 SW River Pky Portland - W $89,500,000 299 $299,331 $276.66 2016
23 19-Feb-19 Matisse 0677 SW Lowell Portland - Central $82,800,000 293 $282,594 $292.75 2009
45 4-Nov-19 Vista @ 23 (nee Kempton Downs) 3181 NE 23rd Gresham $62,800,000 278 $225,899 $219.02 1990
57 18-Jul-19 Tupelo Alley 3806-3850 N Mississippi Portland - N $58,000,000 188 $308,511 $245.76 2008
116 26-Sep-19 Slabtown Flats 1885 NW Quimby Portland - Central $35,000,000 88 $397,727 $412.52 2018
157 18-Nov-19 The George Besaw 2323 NW Savier St Portland - Central $23,625,000 51 $463,235 $492.43 2018
174 15-Aug-19 Halsey Station 1700 NE 162nd Portland - SubE $20,800,000 124 $167,742 $249.50 1990
204 6-Jun-19 Sunnyside 4405 SE Belmont Portland - SE $16,300,000 63 $258,730 $323.41 2018
5 Yr Rank Date Sold Name Address City Price Units $/PerUnit $/SqFt Yr Built
2 23-Dec-19 Pallas (nee LaSalle) 15021 SW Millikan Way Beaverton $186,000,000 566 $328,622 $317.82 1997
19 2-Aug-19 Frank Estate 7401 SW Aloma Way Tigard $91,000,000 309 $294,498 $284.94 1989
33 28-Aug-19 The Grove at Orenco Station (nee Seneca) 6710 NE Vinings Way Hillsboro $72,750,000 264 $275,568 $297.85 1998
68 28-Feb-19 The 206 (Portfolio) 2451 NW 206th Hillsboro $54,023,677 203 $266,126 $220.46 2014
118 15-Dec-19 Terra at Murrayhill (nee Spyglass) 14305 SW Sexton Mountain Dr Beaverton $34,100,000 137 $248,905 $279.38 1985
130 28-Feb-19 Springville Oaks (Portofolio) 16320 NW Canton Beaverton $29,431,202 112 $262,779 $260.92 2014
160 21-Oct-19 The Rise Old Town 4545 SW Angel Beaverton $23,230,000 87 $267,011 $322.64 2017
183 29-Aug-19 Bethany 5 15420 NW Marianna Beaverton $19,200,000 67 $286,567 $297.15 2018
195 19-Dec-19 Revel Amberglen 1189 NE 89th Ave (Portfolio) Hillsboro $18,017,915 140 $128,699 $128.70 2020
245 17-Sep-19 Bel Aire Court 12020-12275 SW Why Worry Lane Beaverton $12,950,000 67 $193,284 $214.94 1961
P a g e | 41
www.smicre.com
Steve Morris / Principal Broker SMI CRE / (503) 970-4593 / [email protected]
2014-2019 Largest Sales by Gross $
P a g e | 42
www.smicre.com
Steve Morris / Principal Broker SMI CRE / (503) 970-4593 / [email protected]
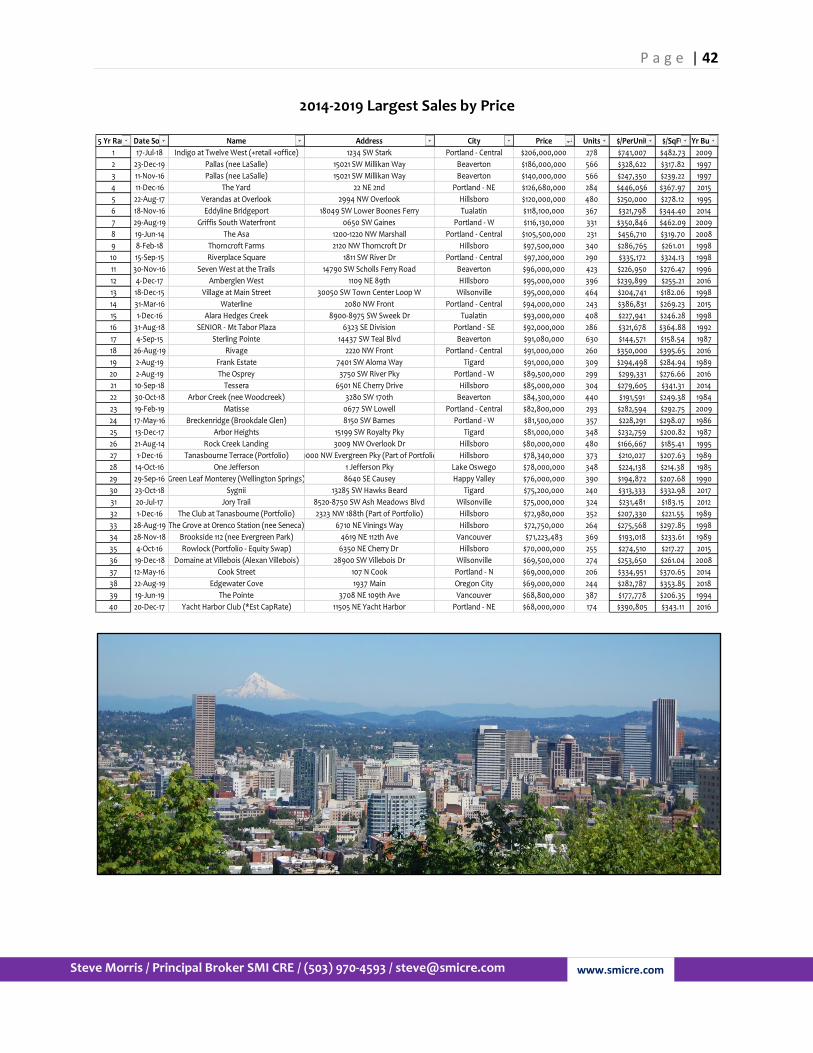
2014-2019 Largest Sales by Price
5 Yr Rank Date Sold Name Address City Price Units $/PerUnit $/SqFt Yr Built
1 17-Jul-18 Indigo at Twelve West (+retail +office) 1234 SW Stark Portland - Central $206,000,000 278 $741,007 $482.73 2009
2 23-Dec-19 Pallas (nee LaSalle) 15021 SW Millikan Way Beaverton $186,000,000 566 $328,622 $317.82 1997
3 11-Nov-16 Pallas (nee LaSalle) 15021 SW Millikan Way Beaverton $140,000,000 566 $247,350 $239.22 1997
4 11-Dec-16 The Yard 22 NE 2nd Portland - NE $126,680,000 284 $446,056 $367.97 2015
5 22-Aug-17 Verandas at Overlook 2994 NW Overlook Hillsboro $120,000,000 480 $250,000 $278.12 1995
6 18-Nov-16 Eddyline Bridgeport 18049 SW Lower Boones Ferry Tualatin $118,100,000 367 $321,798 $344.40 2014
7 29-Aug-19 Griffis South Waterfront 0650 SW Gaines Portland - W $116,130,000 331 $350,846 $462.09 2009
8 19-Jun-14 The Asa 1200-1220 NW Marshall Portland - Central $105,500,000 231 $456,710 $319.70 2008
9 8-Feb-18 Thorncroft Farms 2120 NW Thorncroft Dr Hillsboro $97,500,000 340 $286,765 $261.01 1998
10 15-Sep-15 Riverplace Square 1811 SW River Dr Portland - Central $97,200,000 290 $335,172 $324.13 1998
11 30-Nov-16 Seven West at the Trails 14790 SW Scholls Ferry Road Beaverton $96,000,000 423 $226,950 $276.47 1996
12 4-Dec-17 Amberglen West 1109 NE 89th HIllsboro $95,000,000 396 $239,899 $255.21 2016
13 18-Dec-15 Village at Main Street 30050 SW Town Center Loop W Wilsonville $95,000,000 464 $204,741 $182.06 1998
14 31-Mar-16 Waterline 2080 NW Front Portland - Central $94,000,000 243 $386,831 $269.23 2015
15 1-Dec-16 Alara Hedges Creek 8900-8975 SW Sweek Dr Tualatin $93,000,000 408 $227,941 $246.28 1998
16 31-Aug-18 SENIOR - Mt Tabor Plaza 6323 SE Division Portland - SE $92,000,000 286 $321,678 $364.88 1992
17 4-Sep-15 Sterling Pointe 14437 SW Teal Blvd Beaverton $91,080,000 630 $144,571 $158.54 1987
18 26-Aug-19 Rivage 2220 NW Front Portland - Central $91,000,000 260 $350,000 $395.65 2016
19 2-Aug-19 Frank Estate 7401 SW Aloma Way Tigard $91,000,000 309 $294,498 $284.94 1989
20 2-Aug-19 The Osprey 3750 SW River Pky Portland - W $89,500,000 299 $299,331 $276.66 2016
21 10-Sep-18 Tessera 6501 NE Cherry Drive Hillsboro $85,000,000 304 $279,605 $341.31 2014
22 30-Oct-18 Arbor Creek (nee Woodcreek) 3280 SW 170th Beaverton $84,300,000 440 $191,591 $249.38 1984
23 19-Feb-19 Matisse 0677 SW Lowell Portland - Central $82,800,000 293 $282,594 $292.75 2009
24 17-May-16 Breckenridge (Brookdale Glen) 8150 SW Barnes Portland - W $81,500,000 357 $228,291 $298.07 1986
25 13-Dec-17 Arbor Heights 15199 SW Royalty Pky Tigard $81,000,000 348 $232,759 $200.82 1987
26 21-Aug-14 Rock Creek Landing 3009 NW Overlook Dr Hillsboro $80,000,000 480 $166,667 $185.41 1995
27 1-Dec-16 Tanasbourne Terrace (Portfolio) 19000 NW Evergreen Pky (Part of Portfolio) Hillsboro $78,340,000 373 $210,027 $207.63 1989
28 14-Oct-16 One Jefferson 1 Jefferson Pky Lake Oswego $78,000,000 348 $224,138 $214.38 1985
29 29-Sep-16 Green Leaf Monterey (Wellington Springs) 8640 SE Causey Happy Valley $76,000,000 390 $194,872 $207.68 1990
30 23-Oct-18 Sygnii 13285 SW Hawks Beard Tigard $75,200,000 240 $313,333 $332.98 2017
31 20-Jul-17 Jory Trail 8520-8750 SW Ash Meadows Blvd Wilsonville $75,000,000 324 $231,481 $183.15 2012
32 1-Dec-16 The Club at Tanasbourne (Portfolio) 2323 NW 188th (Part of Portfolio) Hillsboro $72,980,000 352 $207,330 $221.55 1989
33 28-Aug-19 The Grove at Orenco Station (nee Seneca) 6710 NE Vinings Way Hillsboro $72,750,000 264 $275,568 $297.85 1998
34 28-Nov-18 Brookside 112 (nee Evergreen Park) 4619 NE 112th Ave Vancouver $71,223,483 369 $193,018 $233.61 1989
35 4-Oct-16 Rowlock (Portfolio - Equity Swap) 6350 NE Cherry Dr Hillsboro $70,000,000 255 $274,510 $217.27 2015
36 19-Dec-18 Domaine at Villebois (Alexan Villebois) 28900 SW Villebois Dr Wilsonville $69,500,000 274 $253,650 $261.04 2008
37 12-May-16 Cook Street 107 N Cook Portland - N $69,000,000 206 $334,951 $370.65 2014
38 22-Aug-19 Edgewater Cove 1937 Main Oregon City $69,000,000 244 $282,787 $353.85 2018
39 19-Jun-19 The Pointe 3708 NE 109th Ave Vancouver $68,800,000 387 $177,778 $206.35 1994
40 20-Dec-17 Yacht Harbor Club (*Est CapRate) 11505 NE Yacht Harbor Portland - NE $68,000,000 174 $390,805 $343.11 2016