portland’s private for-hire transportation market: …media.oregonlive.com/commuting/other/pfht...
TRANSCRIPT

page 1
Portland’s Private for-Hire Transportation Market:Summary Report of the PFHT Innovation Pilot Program
I am pleased to submit a detailed report analyzing taxi and Transportation Network ridership during the first four months of Portland’s Private for-Hire Transportation Innovation Pilot Program.
In January 2015, I convened a 12-member community Task Force to provide guidance and recommendations about how the City of Portland’s Private for-Hire Transportation (PFHT) regulatory program should evolve and respond to new developments in the industry, including the entry of transportation network companies (TNCs). It is critical that the City provide necessary safeguards and standards to protect consumers, ensure accessibility for all, and allow for a fair, competitive market for drivers and companies throughout the PFHT industry.
Following a presentation of regulatory recommendations from the Task Force and a great deal of public input, Council approved the PFHT Innovation Pilot Program with revised regulations for taxi companies and new rules that allow for TNCs. The Portland Bureau of Transportation is managing and overseeing the Pilot Program, which began in April 2015.
The following status report includes trip pattern data from May to August 2015. Data collection is a critical component of the Pilot. PFHT Program staff worked collaboratively with taxi companies, Transportation Network Companies and industry experts to analyze ridership data to better understand trip trends and PFHT market patterns. Program staff also collect data to ensure compliance with all PFHT regulatory requirements. Data points collected and analyzed include trip date, time, origin and destination, wait time for vehicles, duration of the trip, wheelchair accessible service availability, and unfulfilled rides.
1120 SW Fifth Ave, Suite 800 Portland, OR 97204 503.823.5185Fax 503.823.7576 TTY 503.823.6868 www.portlandoregon.gov/transportation
Steve Novick Commissioner Leah Treat Director
The Portland Bureau of Transportation fully complies with Title VI of the Civil Rights Act of 1964, the ADA Title II, and related statutes and regulations in all programs and activities. For accommodations and additional information, contact the Title II and Title VI Coordinator at Room 1204, 1120 SW 5th Ave, Portland, OR 97204, or by telephone (503) 823-2559, City TTY (503) 823-6868, or use Oregon Relay Service: 711.

page 2
Additionally, this report includes an overview of transportation options in Portland for people with disabilities, which have historically been limited and challenging to access. These challenges are widely known and experienced in the disability community—in Portland and throughout the U.S.—and have also been highlighted as we evaluate PFHT service and regulations. Coupled with the 25th Anniversary of the Americans with Disabilities Act, which was passed by Congress in July 1990, I am hopeful that additional attention to transportation accessibility will result in much needed improvements to transportation options for people with disabilities.
Lastly, I want to thank members of the PFHT Innovation Task Force who spent more than 700 hours since January 2015 soliciting public input, reviewing current PFHT regulations and developing thoughtful and creative new PFHT service requirements that ensure public safety, improve transportation options for consumers and create a fair, competitive market for companies and drivers.
Sincerely,
Commissioner Steve NovickCity of Portland, Oregon

page 3
TABLE OF CONTENTS1. INTRODUCTION ............................................................................................52. DATE & TIME TRIP PATTERNS ........................................................................7
Figure 2.1 - Weekly TNC and Taxi Rides ........................................................................... 7Figure 2.2 - TNC and Taxi Monthly Rides ......................................................................... 8Figure 2.3 - Average Service Levels by Day of Week ........................................................ 8Figure 2.4 - Average Service Levels by Time of Day ......................................................... 9Figure 2.5 - Average Weekend Rides ............................................................................. 10Figure 2.6 - Average Weekday Rides ............................................................................. 10Figure 2.7 - Average Daily Rides .................................................................................... 10Figure 2.8 - Historic PDX Airport Street Hails ................................................................ 11Figure 2.9 - Breakdown of Taxi Service .......................................................................... 12Figure 2.10 - Change in Taxi Rides by Type .................................................................... 12
3. LOCATION TRENDS ......................................................................................13Figure 3.1 - Change in TNC and Taxi Rides, May through August ................................. 13Figure 3.2 - Total Rides by Originating ZIP Code (as percentage) .................................. 14Figure 3.3 - TNC and Taxi Peak Request Time by Originating ZIP Code ......................... 15Figure 3.4 - Map of East Portland .................................................................................. 16Figure 3.5 - East Portland Change in Level of Service .................................................... 16Figure 3.6 - Hourly Service in East Portland (as proportion) .......................................... 17
4. CITYWIDE WAIT TIMES ................................................................................18Figure 4.1 - Distribution of Wait Times .......................................................................... 18Figure 4.2 - Average Monthly Wait Times ..................................................................... 19Figure 4.3 - Breakdown of Taxi Wait Times ................................................................... 19Figure 4.4 - Average Wait Times by Originating ZIP Code (graph) ................................ 20Figure 4.5 - Average Wait Times by ZIP Code (map) ..................................................... 20Figure 4.6 - Average Wait Times by Time of Day ........................................................... 20Figure 4.7 - TNC Demand and Wait Time ...................................................................... 21Figure 4.8 - Taxi Demand and Wait Time ...................................................................... 21
5. RIDE DURATIONS ........................................................................................22Figure 5.1 - Distribution of Ride Durations .................................................................... 22Figure 5.2 - Ride Durations by Time of Day ................................................................... 22Figure 5.3 - Average Ride Duration by Originating ZIP Code ......................................... 23Figure 5.4 - Average Ride Duration by Month ............................................................... 23
6. ACCESSIBLE TRANSPORTATION ...................................................................24Figure 6.1 - TNC and Taxi WAV Service .......................................................................... 26Figure 6.2- TNC WAV Service ......................................................................................... 27Figure 6.3- TNC and Taxi WAV Service by Originating ZIP Code .................................... 27Figure 6.4- Average Monthly WAV Wait Times ............................................................. 28
7. TNC UNFULFILLED AND TAXI INCOMPLETE TRIPS.........................................29Figure 7.1 Unfulfilled TNC Rides as Proportion of Total Requests ................................. 29Figure 7.2 Incomplete Taxi Rides as Proportion of Total Requests ................................ 29

page 4
8. COMPLIANCE ..............................................................................................309. ADDITIONAL CONSIDERATIONS ...................................................................32
Figure 9.1 - TriMet Weekly Boardings (MAX and Bus)................................................... 32Figure 9.2 - DUII Statistics from Portland Police Bureau ............................................... 32
10. SUMMARY ................................................................................................3311. REFERENCES .............................................................................................34

page 5
1. INTRODUCTION
Responding to changes in the Private for-Hire Transportation (PFHT) market and changes in consumer demand, the Portland City Council initiated the PFHT Innovation Pilot Program that established new regulations for taxi companies and transportation network companies (TNCs). The Pilot Program officially began on April 24, 2015 and required permitted taxi companies and TNCs to report aggregated, anonymized ridership data for analysis by the Portland Bureau of Transportation. This report analyzes data received from Portland’s new TNCs, Uber and Lyft, as well as from Portland’s taxi companies (with the exception of EcoCab that began operating after the start of the Pilot Program):
• Broadway Cab• Green Cab• New Rose City Cab• Portland Taxi Cab Company• Radio Cab• Sassy’s Cab (owned by Broadway Cab)• Union Cab
In order to accurately evaluate both industries, this report uses data from trips that originated between May 1st and August 31st. In comparing taxi and TNC ridership patterns, it is important to understand the different types of taxi and TNC trips that are analyzed in this report, and the reporting capacity of the different companies. All TNC trips must be requested through a TNC smartphone app and rides are provided on-demand by the nearest TNC driver. Taxi service may similarly be requested on-demand through a taxi’s dispatch service (via telephone or, for some, via a smartphone app), but may also be pre-arranged through advance reservation. Taxi compa-nies also have the exclusive ability to accept immediate street-hails and queue in any of the 46 designated taxi stands throughout the city, which TNCs are prohibited from doing.
Because TNCs process all of their records through a central database, all data records submitted by TNCs were complete, and represent the full population size of the rides given. The ability for taxi companies to report data for the performance metrics in this report was dependent on their dispatching system, which often left records missing or incomplete. Despite these missing data points, the number of complete records submitted represented a very large sample size from which PBOT could confidently extrapolate to represent the entire taxi industry in Portland.

page 6
CITY OF PORTLAND MAP

page 7
2. DATE & TIME TRIP PATTERNS
During the first four months (May through August) of the Pilot Program, Portland’s permitted taxi companies and transportation network companies (TNCs) provided over 1 million rides to customers. These ridership patterns reflect growing consumer demand for for-hire transporta-tion service within the Portland Metro area. While taxi companies and TNCs offer similar ser-vices, unique ridership patterns between the two company types are reflected in the trip data analyzed within this report.
Ridership among the two new entrants into Portland’s PFHT market, Uber and Lyft, took off dramatically in the first four months of their operation in the City. In this short period of time, TNC ridership increased by 125% from May to August. Ridership among taxi companies, on the other hand, decreased by 16% from May to August. Combined, overall ridership in the Portland market increased by almost 40% between May and August.
Of the more than 1 million trips that were provided between May and August 2015, 52% were provided by TNCs and 48% were provided by taxi companies. Early in the Pilot Program, taxi service accounted for 70% of the market share of for-hire ridership (see Figure 2.1). However, by mid-June, TNC ridership increased to account for half of the market share of ridership. Ridership among the two TNCs continued to increase and by the end of August, TNCs held 60% of the market share while taxis held 40%.
This increase can reasonably be attributed to several factors. Most notably, these numbers strongly suggest that prior to the PFHT Innovation Pilot Program, consumer demand for paid transportation services far outpaced the available supply of taxicabs in Portland. Four months into the Pilot, aggregated ridership data suggests that consumer demand is being better served
0
50,000
100,000
Wee
k 1
Wee
k 2
Wee
k 3
Wee
k 4
Wee
k 5
Wee
k 6
Wee
k 7
Wee
k 8
Wee
k 9
Wee
k 10
Wee
k 11
Wee
k 12
Wee
k 13
Wee
k 14
Wee
k 15
Wee
k 16
Wee
k 17
May June July August
rides
Taxi TNC
Figure 2.1 - Weekly TNC and Taxi Rides

page 8
with the addition of new taxi vehicles, new taxi companies, and transportation network compa-nies. Portland’s PFHT market is likely to continue to adjust to consumer demand, service supply, and other factors. More long-term market impacts will be reflected in subsequent PFHT reports.
Figure 2.2 displays the change in ridership between taxi companies and TNCs by month. At the beginning of the Pilot Program in May, taxis provided an average of 5,500 rides per day com-pared to the daily average of 2,300 TNC rides. However, TNC ridership expanded and soon began to outpace the average daily taxi ridership. By the end of August, TNCs provided a daily average of over 8,000 rides and taxi ridership declined to an average of 4,500 rides per day. Again, overall ridership increased and by August, 100,000 more rides were fulfilled than were in May.
Distinct ridership patterns among taxis and TNCs can be seen by comparing weekend (Fri-day-Sunday) and weekday (Monday-Thursday) trip trends in Figure 2.3, below. Ridership was generally higher on weekends for both taxis and TNCs. These higher weekend ridership trends were clearly pronounced for TNCs, whereas taxi ridership was less varied between weekdays and weekends.
0
125,000
250,000
May June July August
rides
TNC TAXI
Figure 2.2 - TNC and Taxi Monthly Rides
0
5,000
10,000
Thu Fri Sat Sun Mon Tue Wed
rides
TNC Taxi
Figure 2.3 - Average Service Levels by Day of Week

page 9
Along with noticeable ridership patterns between weekdays and weekends, there were distinct trip trends at different times of the day (see Figure 2.4 below). For taxi service1, peak ride-time occurred during the afternoon (12 pm - 5 pm), with smaller peaks during the late-night and overnight hours (11pm - 6am). For TNCs, peak ride-time occurred mostly during the late evening hours (8 pm - 11 pm). The increase in rides during the evening and late night hours are likely attributed to late-night entertainment in Portland, while the overnight peak is likely related to early morning flights out of the Portland Airport.
Changes in market patterns over the course of the Pilot can be seen in weekday and weekend trip trends. As depicted in Figures 2.5 - 2.7,on the next page, TNC ridership outpaced taxi rid-ership on both weekdays and weekends. TNCs saw a greater uptick in weekend ridership than on weekday at the onset of the Pilot. Just seven weeks into the pilot, weekend ridership among TNCs outpaced weekend taxi ridership. It was not until week eleven (about mid-July) that week-day TNC ridership surpassed weekday taxis2 ridership.
1 Includes data related to on-demand and reserved pickups. Street hail data submitted did not have timestamps and were not included here.2 Taxi data in this chart is comprised of on-demand rides, reserved rides, and street hails.
0
700
1,400
EarlyMorning
(6am - 9am)
LateMorning
(9am - 12pm)
Afternoon(12pm - 5pm)
EarlyEvening
(5pm - 8pm)
LateEvening
(8pm - 11pm)
LateNight
(11pm - 2am)
Overnight(2am - 6am)
rides
TNC Taxi
Figure 2.4 - Average Service Levels by Time of Day

page 10
0
5,000
10,000
May June July August
Ride
s
TNC Taxi
Figure 2.7 - Average Daily Rides
0
5,000
10,000
May June July August
Ride
s
TNC Taxi
Figure 2.5 - Average Weekend Rides
0
5,000
10,000
May June July August
Ride
s
TNC Taxi
Figure 2.6 - Average Weekday Rides
page 11
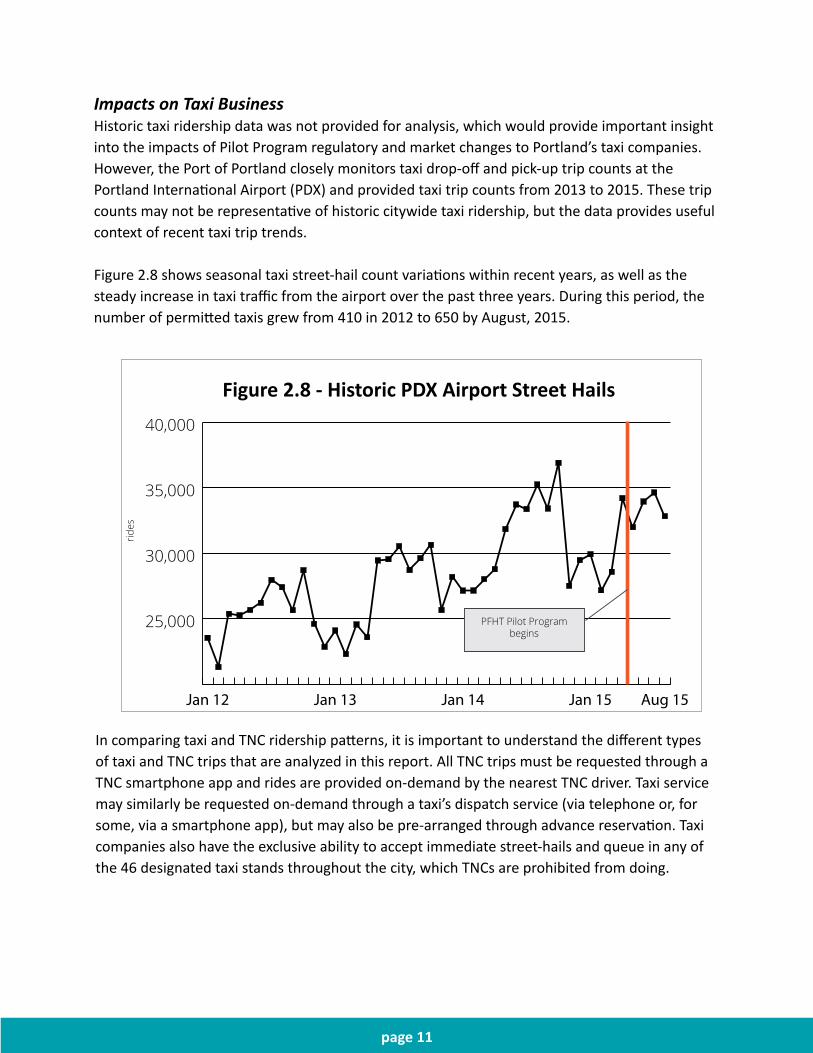
Impacts on Taxi BusinessHistoric taxi ridership data was not provided for analysis, which would provide important insight into the impacts of Pilot Program regulatory and market changes to Portland’s taxi companies. However, the Port of Portland closely monitors taxi drop-off and pick-up trip counts at the Portland International Airport (PDX) and provided taxi trip counts from 2013 to 2015. These trip counts may not be representative of historic citywide taxi ridership, but the data provides useful context of recent taxi trip trends.
Figure 2.8 shows seasonal taxi street-hail count variations within recent years, as well as the steady increase in taxi traffic from the airport over the past three years. During this period, the number of permitted taxis grew from 410 in 2012 to 650 by August, 2015.
In comparing taxi and TNC ridership patterns, it is important to understand the different types of taxi and TNC trips that are analyzed in this report. All TNC trips must be requested through a TNC smartphone app and rides are provided on-demand by the nearest TNC driver. Taxi service may similarly be requested on-demand through a taxi’s dispatch service (via telephone or, for some, via a smartphone app), but may also be pre-arranged through advance reservation. Taxi companies also have the exclusive ability to accept immediate street-hails and queue in any of the 46 designated taxi stands throughout the city, which TNCs are prohibited from doing.
25,000
30,000
35,000
40,000
Aug 15Jan 15Jan 14Jan 13Jan 12
PFHT Pilot Program begins
Figure 2.8Historic PDX Taxi Street Hails
rides
Figure 2.8 - Historic PDX Airport Street Hails

page 12
Based on the data provided during the Pilot Program, on-de-mand dispatch trips account for about 60% of the taxi service in Portland, with the remaining 40% of taxi trips being street-hailed trips or booked in advance through reservation (Figure 2.9)3.
The proportional representa-tion of each taxi service type remained relatively stable during the Pilot Program, but taxis saw an overall decline in on-demand retail rides and street hails (see Figure 2.10). On-demand rides (which are directly competitive to TNCs) saw a 16% decrease over the four months, while re-served pickup rides saw no change between the start and end of the Pilot Program. Taxi street hails saw a 24% decline.
Street hails accounted for approximately 30% of the all taxi trips during the Pilot Program. Of those street hails, most originated from the Portland International Airport. Between May and August, taxi street-hails from the airport increased by nearly 3%. However, overall taxi street hails decreased by 24%, as mentioned above. This overall decrease, despite an increase in trips from the airport, is due to a significant decrease (60%) of street hail service from hotels throughout the City.
Figure 2.10 - Change in Taxi Rides by Type
3 It is important to note that this is an industry average, and may not be indicative of an individual taxi company.
Figure 2.9 - Breakdown of Taxi Service

page 13
3. LOCATION TRENDS
Figure 3.1 shows the change in ridership throughout the City of Portland among taxis4 and TNCs from May to August. There was a clear pattern of growth from TNCs between May and August, most of which occurred in the areas closest to the City Center. Of the roughly 98,000 TNC rides and 158,000 taxi rides provided in May, most originated in the central city and from the Port-land International Airport (within the 97218 ZIP code area). Though ridership for taxis and TNCs remained concentrated in the central city and from the airport, TNC ridership expanded to other neighborhoods by August.
Looking at the change in taxi service over the four months, Figure 3.1 shows very little change within the specific ZIP codes throughout the area. So although taxis did lose a proportion of their retail service, no specific area of the City seemed to be noticeably affected, and the decrease occurred uniformly throughout the City. In terms of total trip counts, TNCs provided more rides than taxis in 20 of the 31 ZIP code areas within the City of Portland.
4 Includes taxi on-demand rides and reserved rides.
Figure 3.1 Change in TNC and Taxi Rides, May through August

page 14
Depicting ridership as a percentage of overall originating trips by ZIP code provides important insight into service coverage by taxis and TNCs. One of the key minimum standards of service requirements of Portland’s PFHT program mandates that taxis and TNCs provide citywide, 24/7 service. Figure 3.2 affirms that taxis and TNCs provide full, citywide service, with rides originat-ing in all ZIP code areas within the City of Portland. Again, ridership is geographically concentrat-ed in the city center for both taxis and TNCs. However, overall taxi ridership is more dispersed throughout the City than is TNC ridership.
TNC Taxi
Total Rides by Originating ZIP Code (as percentage)
Percentage< 2.0%
2.00% - 3.99%
4.00% - 5.99%
6.00% - 7.99%
8.00% - 9.99%
10.0% +
Figure 3.2 - Total Rides by Originating ZIP Code (as percentage)

page 15
Peak Ridership Times throughout the City Unique ridership patterns can be also seen between taxis and TNCs by analyzing the time of day of originating trips. Figure 3.3 shows this peak ride time geographically for each of the ZIP code areas within Portland. In a vast majority of the City, TNC peak ride time was during the late evening (8pm - 11pm) while taxi rides were, for the most part, provided during the late night hours (11pm - 2am). Breaking taxi service down into on-demand and reserved rides shows that throughout the City, reserved rides tend to occur in the overnight hours (2am – 6am) while on-demand rides have no clear pattern.
TNC
Taxi - Reserved Rides
TNC and Taxi Peak RequestTime by Originating ZIP Code
Early Morning
Late Morning
Afternoon
Early Evening
Late Evening
Late Night
Overnight
Taxi - On-Demand Rides
Taxi - Combined
Figure 3.3 - TNC and Taxi Peak Request Time by Originating ZIP Code

page 16
East Portland Trip TrendsAs the Portland Bureau of Transportation seeks to advance equity, improving transportation options in historically under-served neighborhoods is a top priority. This is particularly true for East Portland neighborhoods (see Figure 3.4 for reference map). Concerns have been raised in other cities that taxis and TNCs predominately service city centers and avoid outlying neighborhoods. Monitoring ridership trends in all neighbor-hoods, and specifically in East Portland, was an important focus during the Pilot Program.
Trips originating from East Portland account for 8% of all taxi rides and 3% of all TNC rides that were provided from May to August. Figure 3.5, below, shows ridership changes among tax-is, TNCs and overall service throughout East Portland. Although TNC ridership in East Portland was sparse in May compared to
taxi ridership, TNC ridership within the area grew substantially during the Pilot Program. TNC service increased by almost 170% between May and August, while taxi service increased 15% during this period. Combined, East Portland saw a nearly 50% increase in total level of service during these four months.
Additionally, as the number of TNC rides completed in East Portland increased, the number of unfulfilled TNC rides (rides that were requested but not completed due to lack of available TNC vehicles) dropped substantially. Overall, the number of unfulfilled rides in East Portland decreased by 48% between May and August.
Figure 3.4 - Map of East Portland
TNC
§̈¦84
§̈¦205
§̈¦205
§̈¦84
§̈¦205
§̈¦205
§̈¦84
§̈¦205
§̈¦20518%
151% 57%
7% 154% 36%
34% -7% 183% 169% 70% 30%
12% -5% 180% 307% 41% 19%
Taxi on-demand & reserved
Figure 3.7East Portland Change in Level of Service
Total PFHT
Figure 3.5 - East Portland Change in Level of Service

page 17
Overall service in East Portland markedly improved by nearly 50% since the beginning of the Pilot Program. Figure 3.6 also shows ridership in East Portland throughout the hours of the day, as a proportion of rides given by TNCs and taxis. Both TNCs and taxis provided service to East Portland at all hours of the day.
0.0%
3.0%
6.0%
6am
- 7a
m
7am
- 8a
m
8am
- 9a
m
9am
- 10
am
10am
- 11
am
11am
- 12
pm
12pm
- 1p
m
1pm
- 2p
m
2pm
- 3p
m
3pm
- 4p
m
4pm
- 5p
m
5pm
- 6p
m6p
m -
7pm
7pm
- 8p
m8p
m -
9pm
9pm
- 10
pm10
pm -
11pm
11pm
- 12
amM
idni
ght -
1am
1am
- 2a
m
2am
- 3a
m
3am
- 4a
m
4am
- 5a
m
5am
- 6a
m
TNC Taxi
Figure 3.6 - Hourly Service in East Portland (as proportion)

page 18
4. CITYWIDE WAIT TIMES
Notable differences between taxi and TNC service can again be seen when analyzing the amount of time consumers experienced between when a ride was requested and when a vehicle arrived to the requested pick-up location. For the purposes of this report, this time is referred to simply as the “wait time.”
Figure 4.1 shows that, overall, 75% of TNC passengers waited six minutes or less for a ride, while 58% of taxi passengers received a ride within the same amount of time5. Additionally, a key dif-ference in wait time patterns is seen by looking to the number of rides that took 20 minutes or more to arrive to passengers’ requested pick-up location. In total, roughly 6% of taxi passengers (or 1 in every 17) waited more than 20 minutes for taxi service during the first four months of the Pilot. As was previously explained, TNCs and taxis provide similar services but do so through different means. In comparing TNC and taxi wait times, it is important to understand the differ-ent types of taxi trips that are analyzed in this report. All TNC trips must be requested through a TNC app and rides are provided on-demand by the nearest TNC driver. Taxi service may similarly be requested on-demand through a taxi’s dispatch service (via telephone or for some, via smart-phone app), but may also be pre-arranged through advance reservation.
5 Only 74% of on-demand taxi data and 65% of reserved ride data had a valid wait time to be analyzed. Wait times were typically calculated as the difference between “call time” (for on-demand rides) or “pickup time” (for re-served rides) and the “driver on-site time”. In some instances, wait times were not able to be calculated due to blank “driver on-site” fields (it is unclear why some of the data records were missing values). In other instances, the dispatching system of the taxi company was not able to determine the “driver on-site time”. Despite these missing data points, the number of complete records represents a large sample size, and this sample data was consistently distributed. As a result, PBOT is confident that the data submitted was an accurate baseline for which to extrapo-late to the entire taxi industry.
TaxiTNC
20+
19:00 - 19:59
18:00 - 18:59
17:00 - 17:59
16:00 - 16:59
15:00 - 15:59
14:00 - 14:59
13:00 - 13:59
12:00 - 12:59
11:00 - 11:59
10:00 - 10:59
9:00 - 9:59
8:00 - 8:59
7:00 - 7:59
6:00 - 6:59
5:00 - 5:59
4:00 - 4:59
3:00 - 3:59
2:00 - 2:59
1:00 - 1:59
0:00 - 0:59
3%
6%
9%
12%
15%
perc
enta
ge
Distribution of Wait TimesFigure 4.1 - Distribution of Wait Times

page 19
Figure 4.2 shows the average wait time by month for all TNC and taxi trips. For Figure 4.2, taxi on-demand service and reserved ride service have been combined, but are shown separated in Figure 4.3. While it may be expected that reserved taxi trips would not have wait times, Figure 4.3 indicates that wait times for reserved trips often averaged at least two minutes6.
Comparing average wait times by time-of-day and by originating ZIP code area (Figures 4.4 - 4.6 on the next page), reveals that TNCs and taxis had similar wait time patterns. However, TNCs had consistently shorter wait times at nearly all times of the day and across nearly all ZIP code areas, including popular business district areas such as Belmont/Hawthorne (97232), Clinton/Di-vision (97214) and Albina (97227), and at the airport (ZIP Code 97218). TNCs and taxis generally had longer wait times in areas further from the city center.
00:00
02:00
04:00
06:00
08:00
10:00
May June July August
min
utes
Average Monthly Wait
Taxi Total TNC
Figure 4.2 - Average Monthly Wait Times
00:00
02:00
04:00
06:00
08:00
10:00
May June July August
min
utes
Breakdown of Taxi Wait Times
Reserved On-Demand
Figure 4.3 - Breakdown of Taxi Wait Times
6 Data from reserved ride records for the month of May was omitted due to inconsistencies with data reporting.

page 20
00:00
02:00
04:00
06:00
08:00
10:00
12:00
min
utes
Average Wait Time by Time of Day
Taxi TNC
Figure 4.6 - Average Wait Times by Time of Day
Figure 4.5 - Average Wait Times by ZIP Code
00:00
02:00
04:00
06:00
08:00
10:00
12:00
14:00
16:00
18:00
min
utes
Average Wait ime by Originating ZIP Code
Taxi TNC
Figure 4.4 - Average Wait Times by Originating ZIP Code

page 21
Figure 4.7 and 4.8 compare wait times to passenger demand by time-of-day. For TNCs, wait times stayed generally consistent throughout the day, and actually decreased during periods of high-demand (the evening hours).
These consistent and relatively short wait times may be credited to the TNCs’ use of dynamic pricing, or surge pricing, which incentivizes more drivers during periods of high demand. On the other hand, demand for taxi service was relatively consistent during the daytime hours, but wait times varied throughout the day. Not enough data or information is currently available to make conclusive correlations, but factors that have been cited as impacting wait times include how taxi driver shifts are scheduled, which may not reflect real-time changes in consumer demand.
Additionally, the types of dispatch systems utilized by TNCs and taxi companies may impact wait time patterns. TNCs utilize a dispatch system primarily based on proximity of driver to passenger. In contrast, most taxi companies utilize a zone dispatch system to respond to passenger requests based on a queue of drivers waiting for a fare. This type of dispatch system may provide more equity for taxi drivers, but not necessarily more efficiency, and may contribute to longer wait times.
00:00
02:00
04:00
06:00
08:00
10:00
12:00
0
30,000
60,000
min
utes
rides
time of day
TNC Ride Demand and Wait Time
TNC Rides TNC Wait Times
Figure 4.7 - TNC Demand and Wait Time
00:00
02:00
04:00
06:00
08:00
10:00
12:00
0
30,000
60,000
min
utes
rides
time of day
TNC Ride Demand and Wait Time
Taxi Rides Taxi Wait Times
Figure 4.8 - Taxi Demand and Wait Time

page 22
5. RIDE DURATIONS
Average ride durations7 were similar between on-demand taxi and TNC trips, as can be see in Figure 5.1. Most of the taxi and TNC rides provided from May to August had durations of 12 minutes or less. Additionally, taxis and TNCs provided a notable number of ride with durations of 40 minutes or longer, which were likely trips to and from the Portland International Airport or to and from surrounding suburbs.
7 For TNCs, ride duration is defined as the time between when the driver officially began the ride on the app plat-form and when the ride officially ended. For taxis, ride duration is defined as the time between when the meter was turned on and when the meter was turned off.
0.0%
7.0%
14.0%
Distribution of Ride Durations
Taxi TNC
Figure 5.1 - Distribution of Ride Durations
10:00
12:00
14:00
16:00
18:00
20:00
Taxi TNC
Figure 5.2 - Ride Durations by Time of Day
page 23
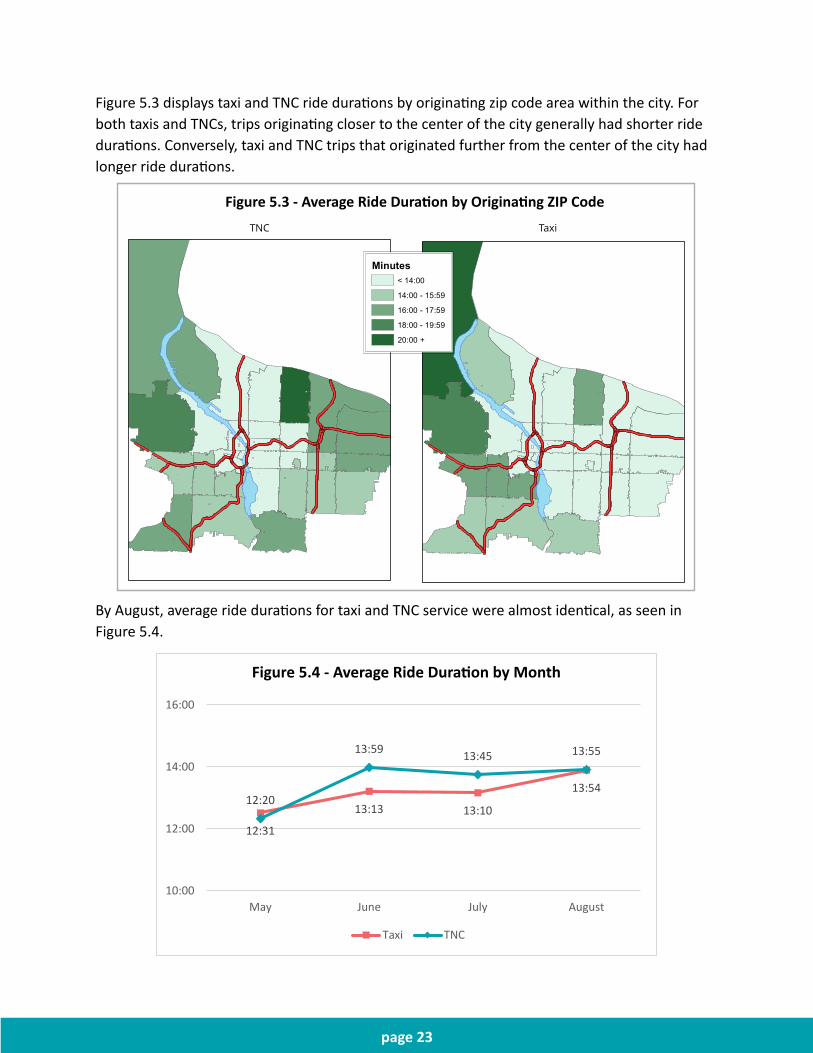
Figure 5.3 displays taxi and TNC ride durations by originating zip code area within the city. For both taxis and TNCs, trips originating closer to the center of the city generally had shorter ride durations. Conversely, taxi and TNC trips that originated further from the center of the city had longer ride durations.
By August, average ride durations for taxi and TNC service were almost identical, as seen in Figure 5.4.
TNC Taxi
Average Ride Duration by Originating ZIP Code
Minutes< 14:00
14:00 - 15:59
16:00 - 17:59
18:00 - 19:59
20:00 +
Figure 5.3 - Average Ride Duration by Originating ZIP Code
12:31
13:13 13:10
13:5412:20
13:59 13:45 13:55
10:00
12:00
14:00
16:00
May June July August
Taxi TNC
Figure 5.4 - Average Ride Duration by Month

page 24
6. ACCESSIBLE TRANSPORTATION
Seniors and people with disabilities often require special accommoda-tions and assistance to access and utilize transportation services. The Americans with Disabilities Act (ADA), a landmark civil rights bill enact-ed by Congress 25 years ago, prohibits discrimination, guarantees that people with disabilities have the same opportunities as those without disabilities and requires that government agencies and public service s provide reasonable accommodations to people with disabilities.
The National Commission on Disability (2015) explains that, “[Private for hire transportation services] may not charge higher fares for passengers with disabilities; they may not refuse to serve a passenger with a disability who can use a taxi sedan (including people who use wheel-chairs); the may not refuse to stow a wheelchair or other mobility devise in the trunk of a sedan or impose a special charge for doing so; and the must accept passengers traveling with service animals.”
In the 2015 report, Transportation Update: Where We’ve Gone and What We’ve Learned, the National Commission on Disability (NCD) finds that, “Since the 2005 NCD report, wheelchair-ac-cessible taxis have become more available in larger communities around the country. Cities with accessible taxi services include, Chicago, Boston, San Francisco, Miami, Las Vegas, and Portland.”
Portland is one of the first U.S. cities to adopt wheelchair accessible vehicle (WAV) requirements for taxi companies, some of which may be credited to TriMet’s efforts to become compliant with the ADA requirements established in the mid-1990s. TriMet began partnering with taxi companies to provide stop-gap transportation service to people with disabilities, and TriMet maintains contracts with several taxi companies and other transportation operators to this day to supplement ADA transit service.
There are, in fact, several transportation options currently available to Portlanders with disabilities: privately-owned and operated vehicles, transportation service provided by TriMet and the TriMet LIFT paratransit program, Medicaid-funded, non-emergency medical transporta-tion services (under the local authority of Coordinated Care Organizations) and private for-hire transportation service to consumers. However, the availability and accessibility of these options varies greatly depending on the specific needs and resources of individual consumers and the overall demand for these services at any given time.
People who need wheelchair accessible vehicles (WAVs) often experience substantially greater challenges in accessing those vehicles. Privately-owned, consumer-operated WAVs can be cost restrictive, particularly given that Americans with disabilities experience poverty at twice the rate as those without disabilities. On average, American households with an adult member with a disability earn nearly 40% less than households without an adult member with a disability (U.S. Senate Committee on Health, Education, Labor & Pensions, 2014).
TriMet is mandated by the ADA to provide reasonableaccommodations to those who are un-able to use TriMet buses and/or light rail some or all of the time due to a disability or medical

page 25
condition. TriMet’s LIFT paratransit service is a shared-ride public transportation service and is generally regarded as reliable, but the service requires advance reservation and is only available within the TriMet service district during regular hours of TriMet operations (4:30am-2:30am, seven days a week). TriMet LIFT service is federally and locally subsidized so that the cost to consumers is significantly reduced. Qualifying users are eligible for discounted “LIFT Paratransit” or “Honored Citizen” passes.
Similarly, WAV fares for private for hire transportation are regulated so they are the same as non-WAV fares. However, private for hire transportation operators report that WAV trips take longer and cost up to $30 and $40 more than non-WAV trips. These additional operating costs have been absorbed by the overall operating costs to taxi companies and most recently TNCs. However, several Portland taxi companies have mitigated those higher operational costs by markedly subsidizing retail WAV service through contracting taxi WAVs to other transportation service providers, including paratransit, mass-transit operators, and non-emergency medical transportation brokers. That has had the unintended consequence of further confining the al-ready limited availability of wheelchair accessible transportation service in Portland.
History of Wheelchair Accessible PFHT RegulationsShortly after Congress passed the Americans with Disabilities Act in 1990, TriMet began devel-oping and implementing ADA policies and protocols, in many ways setting the national pace for improving transportation options for people with disabilities. At the same time, the City set a goal for taxi companies to increase the size of their respective wheelchair accessible fleets to a minimum of 20% of each company’s total fleet. The WAV fleet requirement was intended to ensure that taxi companies could meet demand for WAV service from consumers requesting retail transportation service and from other transportation operators needing additional WAV capacity, including TriMet.
Maintaining an operational fleet of WAV taxis proved to be challenging for most taxi compa-nies, largely because of the higher initial and ongoing costs of WAV service compared to tradi-tional taxi sedan service. In 2003, the PFHT Board and a coalition of taxi companies developed an agreement to form a central WAV dispatch broker between taxi companies. Pooling WAV resources and utilizing a centralized WAV broker was expected to be a more efficient and cost effective method to provide WAV service to the community.
This centralized and shared WAV-fleet agreement, known as the Portland Accessible Cab Associ-ation (PACA), was finalized and began operating in June 2004. Under the PACA agreement, 10% of a participating taxi company’s fleet needed to be WAVs, instead of the 20% that was other-wise required. Unfortunately, this centralized model proved challenging to coordinated and was formally disbanded in December 2012. However, not all taxi companies that had participated in the PACA brought their fleets back in to compliance with the 20% WAV requirement. The PFHT Board began considering increasing WAV fleet requirements to 30% to improve WAV service, but this requirement was never adopted. In years since the formal end of PACA, WAV taxi fleets ranged from 10-20%. Today, Taxi WAVs constitute about 15% of all of Portland’s permitted taxi vehicles.
In July 2014, the PFHT program was transferred from the Revenue Bureau to the Portland

page 26
Bureau of Transportation to better align with the City’s overall transportation policies and goals. At the direction of Transportation Commissioner Steve Novick, the PFHT was asked to reevalu-ate all pending permit applications for new and existing taxi companies. After review, the Board voted in February 2015 to approve all 242 requested taxi vehicle permits from the six existing taxi companies in Portland. The Board added a condition to the additional vehicle permits, requiring that taxi companies bring their fleets into the 20% WAV compliance requirement prior to the approval of additional taxi sedan permits.
A special PFHT Innovation Task Force was convened by Commissioner Novick in January 2015 to review existing PFHT regulations and to recommend regulatory changes to ensure public safety, improve service and ensure a fair, competitive market for companies and drivers. The Task Force, independent of the PFHT Board, recommended that service performance standards, not fleet vehicle requirements, would provide a better and more efficient means of ensuring PFHT WAV service to people with disabilities.
The PFHT Innovation Pilot Program, approved by Portland City Council in April 2015, supports this recommendation. In order to transition the PFHT industry from a WAV fleet requirement to service performance standards largely tied to response times and service requests, three provisions are included in the Pilot Program: one, lower WAV fleet requirements for taxi companies (10%); two, the expanded use of permits for non-emergency transportation vehicles; and three data-informed performance standards for TNCs.
Wheelchair Accessible Vehicle TripsAccessible transportation service to passengers with disabilities has been an important and closely monitored service during the Pilot Program. The PFHT Program requires that all taxis and TNCs accommodate requests for service from people with disabilities, including those who are accompanied by a service animal and those needing wheelchair accessible vehicles (WAV).
0 100 200 300 400 500
TNC WAV Taxi WAV Reserved
Taxi WAV On-Demand
August
July
June
May
TNC and Taxi WAV Service
rides
Figure 6.1 - TNC and Taxi WAV Service

page 27
During the four-month initial pilot period, TNCs provided 400 WAV rides, while taxis provided 2,600 WAV rides. Figure 6.1, above, shows the change in WAV rides for both TNCs and taxis over the course of the pilot program. Taxis provide two types of dispatched WAV service: reserved pickups and on-demand pickups8. TNCs, however, only provide on-demand WAV service. Inter-estingly, reserved taxi WAV rides constitute only 35% of the taxi WAV service, while the remain-ing 65% of taxi WAV trips were requested on-demand. Over the course of the pilot program, on-demand taxi WAV rides decreased 8% from an about 430 per month to 395 per month, while reserved taxi WAV rides increased 26% from 200 per month to 250 per month.
TNC WAV service decreased over 70% during the course of the pilot program, from 188 rides in May to 53 rides in August. Figure 6.2 shows that although the number of completed TNC WAV trips decreased, the demand also decreased. It is unclear why there was a decrease, but it may be attributed to large numbers of customers requesting WAV rides at the beginning of the pilot without understanding what type of service they were requesting. Uber and Lyft have since put in mechanisms for drivers to confirm with passengers that they are in fact in need of a WAV vehicle before the ride is dispatched.
The breakdown of WAV trips by originating ZIP code area can be seen in Figure 6.3, below. A large portion of taxi WAV trips originated in areas with several medical offices, whereas no clear TNC WAV ridership patterns are apparent.
8 This does not include SAT or any other contracted WAV service.
Figure 6.2- TNC WAV Service
TNC Taxi - Reserved Rides
Figure 3.19TNC and Taxi WAV Rides by Originating ZIP Code
Taxi - On-Demand Rides
Rides < 25 25 - 49 50 - 74 75 - 99 100 +
Figure 6.3- TNC and Taxi WAV Service by Originating ZIP Code

page 28
Although taxis provided siginficantly more WAV trips than did TNCs, on-demand taxi WAV trips had consistently higher wait times compared to TNCs WAV trips. Additionally, while average TNC WAV wait times increased since the beginning of the pilot period, August wait times were still nearly seven minutes shorter than on-demand taxi WAV trips. Despite their longer wait times, taxis have been able to improve average WAV wait times over the past four months, reducing wait-times by nearly four minutes for on-demand WAV service.
Contrary to the short wait times for reserved non-WAV taxi trips, reserved WAV taxi riders still experienced significant wait times despite arranging service in advance (see Figure 6.4). Of the total reserved WAV taxi trips, about 15% of riders waited 30 minutes or more after their sched-uled pickup-time and before a taxi WAV arrived. For on-demand WAV taxi rides, this proportion jumps to about 35%. Only 4% of TNC WAV riders waited more than 30 minutes for a TNC WAV to arrive.
5:00
10:00
15:00
20:00
25:00
30:00
Taxi ReservedTaxi On-DemandTNC
AugustJulyJuneMay
12:17
18:33 18:58
09:57
25:3027:22
28:3529:42
Figure 3.20Average Monthly WAV Wait Times
09:42
14:2016:27 17:49
Figure 6.4- Average Monthly WAV Wait Times

page 29
7. TNC UNFULFILLED AND TAXI INCOMPLETE TRIPS
TNC unfulfilled rides are rides that are actively requested by a customer, but never fulfilled because there were no vehicles available. From May to August, unfulfilled TNCs rides decreased noticeably, as seen in Figure 7.1. In May, unfulfilled TNC rides made up about 6% of total ride requests, and dropped to roughly 2% by the end of August.
Incomplete taxi rides refer to rides that are either actively canceled by consumers, or are rides that were requested but the consumer is not present at the requested pick-up location. Incom-plete taxi trips decreased slightly during the Pilot Program (Figure 7.2) from roughly 17% of total taxi requests in May to roughly 15% of total taxi requests in August. This decrease is largely attributed to a reduction in canceled rides, which decreased 1.7 percentage points over the course of the pilot program.
0.0%
4.0%
8.0%
May June July August
Figure 7.1 Unfulfilled TNC Rides as Proportion of Total Requests
0.0%
10.0%
20.0%
May June July August
Incomplete Taxi Trips
Cancelled No Show
Figure 7.2 Incomplete Taxi Rides as Proportion of Total Requests

page 30
8. COMPLIANCE
PBOT’s PFHT program has established new policies and protocols to ensure compliance with all program rules and regulations. The objective of the procedures is to inspect, educate and to en-force compliance. A key element to achieving compliance is the ongoing education, particularly when adapting to new regulations. This is true not only for permitted companies and drivers, but for compliance staff, law enforcement and the general public. The program primarily uses three methods to seek compliance: one, random certification audits; two, regular field compliance inspections; and three, complaint investigations. Consequences of violating pilot rules and reg-ulations range from warnings to civil penalties that escalate with recurring offenses and permit suspension or revocation.
As a condition of a City of Portland Permit, taxi companies and TNCs must adhere to minimum standards of service that included the following:
• Permitted taxi and transportation network companies must remain in operation 24 hours each day and be capable of providing reasonably prompt service in response to requests at all times.
• Acceptance of any request made by any passenger of proper demeanor for taxi and TNC service received from any location within the City, including requests made by persons with disabilities and requests for wheelchair accessible service, is required.
• Taxi and TNC operators must reasonably accommodate passengers with service animals.• All PFHT operators must adhere to a zero tolerance drug policy. The use of tobacco
products is prohibited in any PFHT vehicle.• No person may provide private for-hire transportation after engaging in more than 14
hours of commercial activity in any given 24-hour period.• All vehicles must be kept clean and in good appearance and good repair. Additional-
ly, vehicles must be equipped with all required components, including a hands-free accessory for mobile devices, a standard first aid kit, and fire extinguisher.
To ensure that all City of Portland requirements are met during the pilot program, random audits are routinely conducted and include review of drivers’ criminal history and motor vehicle records, vehicle safety and condition certification, insurance coverage, and business license registration. The privilege of driving for a permitted taxi company or TNC is immediately sus-pended if drivers or vehicles fail to comply with pilot program rules. Violations identified during an audit are investigated and corrective action—which may include the issuance of penalties or a revocation of permit—is taken.
Regular field compliance inspections are conducted by regulatory staff to ensure operation-al compliance by taxi and TNC operators. These actions entail staff ride-along to ensure that vehicles are in good condition, are properly equipped with required signage or trade-dress, a

page 31
hands-free accessory for mobile devices, and a first aid kit and fire extinguisher. Staff also docu-ment compliance with requirements for vehicle registration, insurance documentation, business license registration, driver conduct and WAV availability. Adherence to hailing and queuing rules, driver conduct are also monitored and audited.
Throughout the Pilot Program, regulatory staff found taxi companies, TNCs, and their respective drivers and vehicles to be in substantial compliance with PFHT requirements. A notable excep-tion pertained to the availability and reliability of WAV service for taxis and TNCs. Early into the Pilot, staff documented limited availability of taxis WAVs and a concerning lack TNC WAVs. From May to August, however, WAV availability greatly improved. Staff continue to closely monitor the availability of WAV service and will issue penalties if any company is found to be out of compli-ance with accessibility requirements.
Finally, staff investigate and resolved consumer and other complaints reported to the PFHT Program. Since the beginning of the pilot program, PFHT has received 18 complaints. Complaints regarding PFHT operators in the City of Portland may be submitted to the following:
● Through email at [email protected]● By calling 503-865-2486● Online at portlandoregon.gov/pdxrides● In writing by mail or fax: PO Box 8572 Portland, Oregon 97207 or 503-865-9022 (fax)

page 32
9. ADDITIONAL CONSIDERATIONS
Beyond ridership patterns and PFHT trip trends, the Portland Bureau of Transportation will continue to monitor other factors that may be impacted by the PFHT industry, including impacts on traffic and congestion, carbon emissions, TriMet ridership, and DUII arrest rates. At this time, however, not enough data or information is available to make conclusive determinations on the impact of PFHT regulatory and market changes on those factors. Data from TriMet and the Port-land Police Bureau is readily available and present in Figures 9.1 and 9.2, below. The Bureau will continue to work with industry stakeholders and community partners to better track and ana-lyze other considerations, which will be presented in subsequent annual PFHT market reports.
In April of 2015, the Portland Police Bureau began using a new records management system. At this juncture, the Police Bureau is still reconciling records between the old “PPDS” system and the new “ReJINS” system. For this and a variety of statistical analysis reasons, DUII arrest trends cannot be attributed to changes in the PFHT market.
600,000700,000800,000900,000
1,000,0001,100,0001,200,0001,300,0001,400,000
Trimet Weekly Boardings (Bus and Max)
PFHT Pilot Program Began All Bus MAX
Figure 9.1 - TriMet Weekly Boardings (MAX and Bus)
2014 DUII Arrests 2015 DUII Arrests % Change April 145 106 -27% May 147 99 -33% June 90 108 17% July 105 108 3% August 140 131* -6%
*The Portland Police Bureau may not have all DUII arrest data entered for August of 2015
Figure 9.2 - DUII Statistics from Portland Police Bureau

page 33
10. SUMMARY
The data presented in this report was an analysis of taxi and TNC rides completed between May 1st and August 31st. As part of their business model, taxis are able to provide three distinct services (on-demand rides, reserved rides, and street hails) while TNCs only provide on-demand pick up rides.
Overall retail taxi service decreased 16% since the beginning of the Pilot Program. This overall decrease was the result of a 16% decrease in on-demand service and a 24% decrease in street hail service. Taxi reserved ride service remained steady throughout the pilot.
Despite a 16% reduction in retail service from the taxi companies, the combined taxi and TNC segment of the Private for-Hire Transportation business grew 41% during the course of the four-month Pilot Program. The increase in ridership was due entirely to the addition of TNC service in Portland, which increased 125% since May. It is important to note that growth in TNC ridership was partly the result of pent up demand for service, and partly a result of latent demand for ser-vice. After the substantial growth seen in the first four months of the Pilot program, it is unclear when TNC ride numbers will plateau and stabilize.
Two key positive highlights from this report focused on service to East Portland and Accessible Transportation. East Portland, which is an area typically underserved in many aspects, especially transportation, saw a nearly 50% increase in taxi and TNC service during the four-month Pilot Program. For Accessible Transportation, TNCs were able to consistently provide WAV service with the lowest wait times. Concurrently, taxi on-demand WAV service reduced their wait times by 5 minutes on average.
In many respects, taxi and TNC service had similar patterns across a variety of performance metrics, both taxis and TNCs provided the greatest number of rides in areas closest to the City Center, but TNCs tended to provide a greater proportion of their service in this concentrated area than taxis. Important distinctions are also found. Both TNCs and taxis saw peak ridership during the weekends, coupled with lower numbers during the weekdays. Taxis tended to provide the most of their service during the afternoon (12 pm - 5 pm) and overnight hours (2 am - 6am), the latter of which were likely due to travel for early morning airport flights. In contrast, TNCs tended to provide their greatest level of service during the evening and late night hours (8 pm - 2 am).
TNCs provided consistently shorter wait times than did taxis, with average wait times at the end of the Pilot Program just over four minutes, while taxi wait times averaged just under eight min-utes. Over the four months, taxis were able to reduce average wait times by about one minute. Overall, ridership within Portland increased markedly in just the first four months of the Pilot. From May to August, ridership increased by 40%, suggesting that consumer demand for retail transportation service is now being much better served by Portland’s taxi companies and TNCs.

page 34
11. REFERENCES
National Council on Disability. (2015). Transportation Update: Where We’ve Gone and What We’ve Learned. Washington, DC: U.S. Government Printing Office.
U.S. Senate Committee on Health, Education, Labor & Pensions. (2014). Fulfilling the Promise: Overcoming Persistent Barriers to Economic Self-Sufficiency for People with Disabilities. Washington, DC: U.S. Government Printing Office.
Report prepared by:Colleen Caldwell, Portland Bureau of Transportation
Bryan Hockaday, Office of Commissioner Steve NovickDave Benson, Portland Bureau of Transportation
Mark Williams, Portland Bureau of Transportation
Special thanks to:Leah Treat, Portland Bureau of Transportation
Ken McGair, Office of the City AttorneyNickole Cheron, Office of Neighborhood Involvement
Judith Mowery, Office of Equity and Human RightsPFHT Innovation Task Force