ports and waterways safety assessment (pawsa) final report report text.pdf · final report...
TRANSCRIPT
PORTS AND WATERWAYS SAFETY ASSESSMENTS (PAWSA)
FINAL REPORT
Executive Summary
Ports and Waterways Safety Assessment (PAWSA) workshops were completed in 28 ports around the United States between August 1999 and June 2001. Those PAWSA workshops were conducted to support the Office of Vessel Traffic Management (G-MWV) and the Vessel Traffic Services Project Manager (G-AVT) in their efforts to evaluate the need for and plan future vessel traffic management (VTM) projects, including installation and upgrades to Vessel Traffic Services (VTS). The PAWSA process also was designed to provide the Captain of the Port and local maritime community with a risk level baseline and a formal risk assessment process which can be used on a recurring basis to measure the effectiveness of VTM mitigations within their port.
This report is the end product of a risk-based decision-making process established to ensure the safety of vessel traffic in U.S. ports and waterways in ways that meet waterway user and stakeholder needs. In addition to an overview of the PAWSA process, this report provides a comparative analysis of the quantitative and qualitative data collected from each port and general recommendations for national level VTM improvements based on that analysis. An appendix to this report for each port in which a PAWSA workshop was completed, organized by Coast Guard District, provides more detail about port safety risks and recommended risk mitigation strategies at the local and regional levels.
The PAWSA process uses a Port Risk Model that was conceived by a National Dialogue Group on National Needs for Vessel Traffic Services (NDG) which convened in May 1998 under the auspices of the Marine Board of the National Research Council. That Port Risk Model includes twenty risk factors that affect port and waterway safety and which the NDG thought should be considered before establishing a VTS. Using those twenty risk factors, Dr. Jack Harrald of George Washington University and Dr. Jason Merrick of Virginia Commonwealth University created the PAWSA assessment methodology, which was based on the Analytical Hierarchy Process (AHP). AHP was developed by Dr. T. L. Saaty at the Wharton School of the University of Pennsylvania and is widely used in business and government situations where diverse groups of individuals need to reach consensus and/or make decisions on complex issues.
After analyzing all of the information obtained during the 28 PAWSA workshops, key recommendations emerged with respect to AIS carriage requirements, precision navigation equipment, and VTS / VTIS.

PAWSA Final Report
Executive Summary (continued)
AIS Carriage. The Coast Guard should propose regulations which apply domestic carriage requirements for Automatic Identification Systems (AIS) to all commercial vessels, regardless of length or tonnage. In addition, domestic and Canadian AIS carriage requirements need to be harmonized. There are a number of risk factors which AIS helps to mitigate. Virtually all of those risk factors are common to every port in the United States. Risk levels for those factors are particularly high in:
Berwick Bay, LA Honolulu, HI Lake Charles, LA Los Angeles / Long Beach, CA Pascagoula, MS Port Arthur, TX Port Everglades, FL San Juan, PR
Precision Navigation Equipment. United States and International Maritime Organization (IMO) standards for Electronic Chart Display Information Systems (ECDIS) need to be aligned. In addition, the Coast Guard should provide incentives for all commercial vessels, regardless of length or tonnage, to install and use precision navigation equipment (e.g., Differential Global Positioning System (DGPS), ECDIS). As with AIS carriage, there are a number of risk factors which precision navigation equipment helps to mitigate. Virtually all of those risk factors also are common to every port in the United States. Risk levels for those factors are particularly high in:
Berwick Bay, LA Miami, FL Port Everglades, FL
Vessel Traffic Service (VTS) / Vessel Traffic Information Service (VTIS). Establish / improve VTS or VTIS. Note: none of the ports listed below has an established VTS or formal VTIS, although the port authorities in Port Everglades, San Juan, and Honolulu already exercise some control over vessel movements in their respective waterways. As with AIS carriage and precision navigation equipment, there are a number of risk factors which a VTS or VTIS helps to mitigate. Virtually all of those risk factors also are common to every port in the United States. Risk levels for those factors are particularly high in:
Honolulu, HI Pascagoula, MS Port Everglades, FL Port Arthur, TX San Juan, PR
2
PAWSA Final Report
Introduction This report summarizes the results from 28 Ports and Waterways Safety Assessment (PAWSA) workshops which were completed in ports around the United States between August 1999 and June 2001. Those PAWSA workshops were conducted to support the Coast Guard Office of Vessel Traffic Management (G-MWV) and the Coast Guard Vessel Traffic Services Project Manager (G-AVT) in their efforts to evaluate the need for and plan future vessel traffic management (VTM) projects, including installation and upgrades to Vessel Traffic Services (VTS). This report is the end product of a risk-based decision-making process established to meet the shared government, industry, and public goal of ensuring the safety of vessel traffic in U.S. ports and waterways, in technologically sound and cost effective ways that meet the needs of waterway users and stakeholders.
In addition to an overview of the PAWSA process, this report provides a comparative analysis of the quantitative and qualitative data collected from each port and general recommendations for national level VTM improvements based on that analysis. There is an appendix to this report for each port in which a PAWSA workshop was completed. Those appendices are organized by Coast Guard District and provide more detail about the port safety risks and recommended risk mitigation strategies that workshop participants identified as appropriate for their port.
Background Over the past few years, the Coast Guard acquisition program has seen tremendous change with respect to the decision making approach for acquisition of Vessel Traffic Services. In September 1996, Congress terminated VTS 2000 contracts and, through the 1997 Appropriations Bill, directed the Coast Guard to identify minimum user requirements for new VTS systems in consultation with local officials, waterways users and port authorities and also to review private/public partnership opportunities in VTS operations. As a result of this Congressional direction, the Coast Guard established the Ports and Waterways Safety System (PAWSS) program to address waterway user needs and place a greater emphasis on partnerships with industry to reduce risk in the marine environment.
Before proceeding with a VTS acquisition under the PAWSS project, the Coast Guard sought to identify those ports and waterways where a shore based VTS or other VTM improvements were both necessary and appropriate for federal funding. As an early step in that process, a National Dialogue Group on National Needs for Vessel Traffic Services was convened in May 1998 under the auspices of the Marine Board of the National Research Council. Among many other findings, the National Dialogue Group identified twenty factors that affect port
3

PAWSA Final Report
Background (continued)
and waterway safety and which should be considered before establishing a VTS.
Those twenty risk factors were molded into a generic Port Risk Model by Dr. Jack Harrald of George Washington University and Dr. Jason Merrick of Virginia Commonwealth University. The PAWSA assessment methodology developed by Drs. Harrald and Merrick was based on the Analytical Hierarchy Process (AHP). AHP was developed by Dr. T. L. Saaty at the Wharton School of the University of Pennsylvania and is widely used in business and government situations where diverse groups of individuals need to reach consensus and/or make decisions on complex issues. AHP algorithms convert individual preferences for alternatives into weights that can be used to compare and rank those alternatives. Using the AHP algorithms and the Port Risk Model, a Microsoft Access® computer application was assembled by the Volpe Transportation Systems Center in Cambridge, MA for use during the quantitative assessment portions of the PAWSA workshops.
Port Risk Model In the Port Risk Model, risk is defined as a function of the probability of a casualty and its consequences. Consequently, the model includes variables associated with both the causes and the effects of vessel casualties. The twenty port safety risk factors are grouped into one of six categories, as follows:
Fleet Composition
Traffic Conditions
Navigational Conditions
Waterway Configuration
Immediate Consequences
Subsequent Consequences
Percentage of High Risk
Deep Draft
Volume of Deep Draft
Vessels
Wind Conditions
Visibility Obstructions
Number of People on Waterway
Economic Impacts
Percentage of High Risk
Shallow Draft
Volume of Shallow Draft
Vessels
Visibility Conditions
Channel Width
Volume of Petroleum Cargoes
Environmental Impacts
Volume of Fishing &
Pleasure Craft
Tide & River Currents
Bottom Type
Volume of Hazardous Chemical Cargoes
Health & Safety Impacts
Traffic Density
Ice Conditions
Waterway Complexity
4

PAWSA Final Report
Goals, Purpose and Objectives
Based on National Dialogue Group recommendations, a series of in-depth, user focused PAWSA workshops were conducted around the country, using the Port Risk Model to frame participant discussions and computer algorithms to translate expert opinions into quantified data. Those assessments were conducted to identify, from the perspective of those most affected, the major risk drivers in each port visited and the VTM measures that could be appropriate to reduce that risk. The long-term goals of the PAWSA process were:
• Provide input to G-MWV and G-AVT to assist in planning for future VTM projects, including VTS.
• Further the Marine Transportation System (MTS) goals of improved coordination and cooperation between government and the private sector, and of involving stakeholders in decisions affecting them.
• Foster development / strengthen role of Harbor Safety Committees (HSC) with each port.
• Support and reinforce the role of Coast Guard Captains of the Port (COTP) in waterway and vessel traffic management within their assigned geographic areas of responsibility.
• Develop a risk assessment methodology usable by COTPs without professional facilitator support.
The short-term goals of the PAWSA process were:
• Educate port communities about available VTM tools, including the concept of public/private partnerships and the status of Automatic Identification System (AIS) implementation.
• Familiarize Marine Safety Office (MSO) staffs with vessel traffic management concepts and the expanding role of the COTP in VTM.
• Educate the diverse members of port communities about structured risk-based assessment methodologies.
• Develop port-specific snapshots of perceived risks and desired mitigations which can be used by:
– COTPs for pursuing HSC and waterway user involvement in planning port and waterway improvements.
– G-MWV for near-term program planning.
• G-MWV and G-AVT in the selection of candidate ports for future PAWSS installations.
5

PAWSA Final Report
Goals, Purpose and Objectives (continued)
The purpose of the PAWSA workshop incorporates three main objectives:
• Get input from port experts and stakeholders to help calibrate the national Port Risk Model.
• Identify and rank risks in each port.
• Determine the most appropriate Vessel Traffic Management risk mitigation measures from the perspective of port stakeholders.
The ultimate objective of the PAWSA process is make ports safer for all users and stakeholders, thereby contributing to the overall vitality of the United States marine transportation system.
Ports Selection Criteria
In developing the initial list of ports in which to conduct PAWSA workshops, G-MWV identified all U.S. “ports” which handle more than 1 million tons of cargo per year according to the 1995 U.S. Army Corps of Engineers (USACE) Waterborne Commerce of the United States publication. Based on that criteria, 145 “ports” were identified. However, examining that list disclosed that many of these “ports” were really just discrete locations for which the USACE captures data within a larger geographic locality that is more traditionally considered to be the port for that area. When those discrete localities were grouped together by traditional port boundaries, 61 geographically defined port areas resulted. Most of those port areas were encompassed within a single COTP zone. After those 61 port areas were identified, data was collected from numerous sources about each one. That data included accident/incident history, the numbers and types of vessels using the port, weather conditions, waterway characteristics (e.g., configuration and complexity), and cargo types and volume. Each of those data elements was thought to bear some relationship to one or more of the risk factors included in the Port Risk Model. A comparative analysis of that data resulted in a preliminary ranking of the 61 ports. In ultimately deciding which ports to visit, variations from the prioritized list of 61 occurred for three reasons: • The COTP requested that a secondary port (either not high on the
list of 61 or not on the list at all) be assessed in conjunction with the assessment of a primary port which was high on the list. This was why Pascagoula, Port Lavaca, Port Fourchon, Port Everglades, Ponce, and Coos Bay were assessed.
• The COTP, having heard from peers about the value of the PAWSA workshops, requested that a workshop be conducted for the major port in his/her zone, but which was not high on the list of 61. This
6
PAWSA Final Report
Ports Selection Criteria (continued)
is why Portland, ME, Honolulu, San Juan, Sault Ste. Marie, Cook Inlet, and Lake Charles were assessed.
• Due to either the plethora of recent studies completed in a port, a request from the COTP, or other factors, G-MWV decided to skip doing a PAWSA in a port that was high on the list of 61. This was why the Lower Mississippi River, New York, Puget Sound, the Tennessee River, Lake Erie, Lake Michigan, Tampa, Jacksonville, and Prince William Sound were NOT assessed.
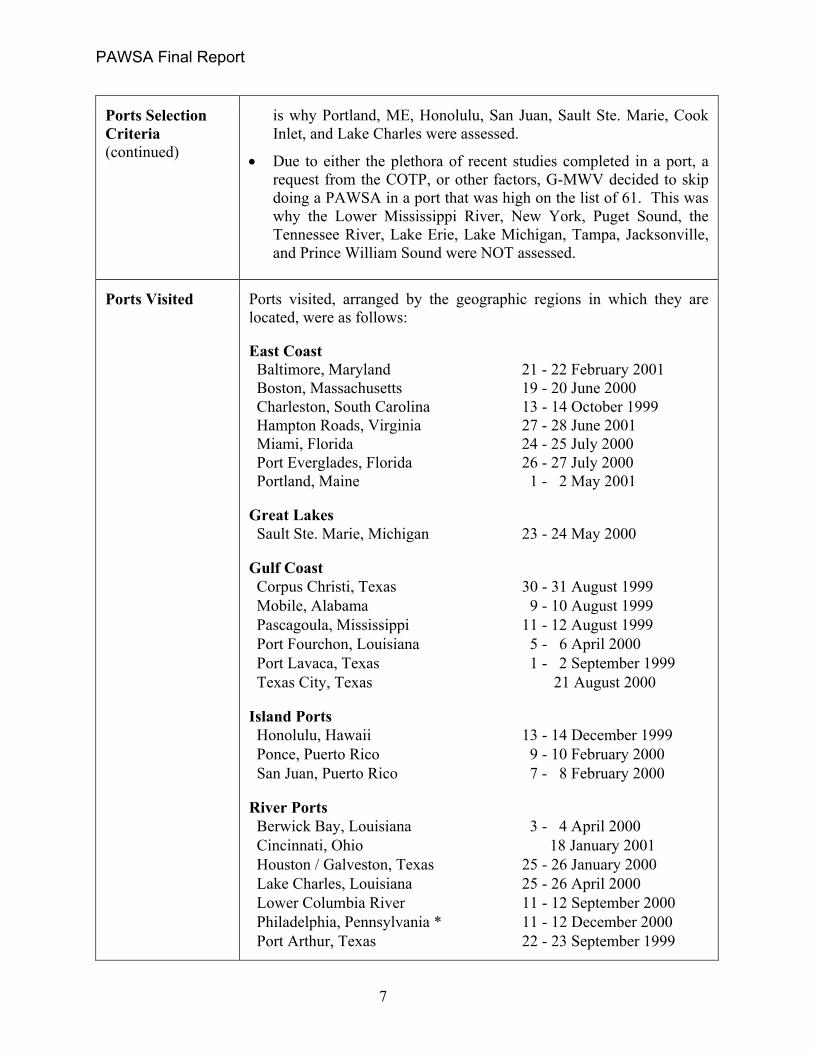
Ports Visited Ports visited, arranged by the geographic regions in which they are located, were as follows: East Coast Baltimore, Maryland 21 - 22 February 2001 Boston, Massachusetts 19 - 20 June 2000 Charleston, South Carolina 13 - 14 October 1999 Hampton Roads, Virginia 27 - 28 June 2001 Miami, Florida 24 - 25 July 2000 Port Everglades, Florida 26 - 27 July 2000 Portland, Maine 1 - 2 May 2001
Great Lakes Sault Ste. Marie, Michigan 23 - 24 May 2000
Gulf Coast Corpus Christi, Texas 30 - 31 August 1999 Mobile, Alabama 9 - 10 August 1999 Pascagoula, Mississippi 11 - 12 August 1999 Port Fourchon, Louisiana 5 - 6 April 2000 Port Lavaca, Texas 1 - 2 September 1999 Texas City, Texas 21 August 2000
Island Ports Honolulu, Hawaii 13 - 14 December 1999 Ponce, Puerto Rico 9 - 10 February 2000 San Juan, Puerto Rico 7 - 8 February 2000
River Ports Berwick Bay, Louisiana 3 - 4 April 2000 Cincinnati, Ohio 18 January 2001 Houston / Galveston, Texas 25 - 26 January 2000 Lake Charles, Louisiana 25 - 26 April 2000 Lower Columbia River 11 - 12 September 2000 Philadelphia, Pennsylvania * 11 - 12 December 2000 Port Arthur, Texas 22 - 23 September 1999
7

PAWSA Final Report
Ports Visited (continued)
West Coast Cook Inlet, Alaska 10 - 11 October 2000 Coos Bay, Oregon 7 September 2000 Los Angeles – Long Beach, California 21 March 2001 San Francisco, California 16 - 17 November 1999
* Though visited, the Philadelphia PAWSA was NOT completed due to the unwillingness of the workshop attendees to identify risks in their port out of fear that doing so would put them at a competitive disadvantage with respect to other ports in that region.
Geographic Distribution of Ports Visited
The following table shows the geographic distribution of the 61 ports on the initial list compared to the distribution of the 28 ports visited. As can be seen, the Gulf Coast is over-represented and the Great Lakes are under-represented in the ports visited. Ports Initial List Visited Category Count Percentage Count Percentage East Coast 15 24% 7 25% Gulf Coast 6 10% 6 21% Great Lakes 5 8% 1 4% River Ports 20 33% 8 25% Island Ports 6 10% 3 11% West Coast 9 15% 4 14% Totals 61 100% 28 100%
Overview of the PAWSA Process
The PAWSA process for each port began with G-MWV notification to the COTP that one of the ports in his/her zone had been scheduled for a workshop several months hence. A guidebook was sent to the COTP explaining the PAWSA process and laying out the logistical steps needed to organize the workshop. A consulting firm specializing in workshop facilitation services arranged for use of appropriate meeting facilities in each port, usually at a hotel or conference center.
Workshop participants usually met for a 4 hour session on the afternoon of the first day followed by an 8 hour session on the second day. This session length was chosen in recognition that the participants were busy people in responsible positions and that asking for more time might well preclude attendance. While feedback on the workshop critiques indicated that the session length was about right (comments were balanced that the workshop was too long or too short), four ports only had one day available to conduct the PAWSA. In those four ports, an abbreviated PAWSA was completed in one 8 hour session.
8

PAWSA Final Report
Overview of the PAWSA Process (continued)
Every workshop included opening presentations about PAWSA concepts, a briefing on the Port Risk Model which was used to frame discussions, discussion and evaluation of risk levels in the port, discussion of risk mitigation strategies (existing and needed), evaluation of the effectiveness of various VTM tools in reducing unmitigated risk, and a critique. Most workshops also included a participant expertise self-assessment segment and provided input for a national weighting scheme for the Port Risk Model. Numerical inputs were captured in a series of quantitative assessment questionnaires, collectively known as Books 1 through 5.
Participant Selection
The COTP, with his/her in depth knowledge, understanding, and familiarity with key members of the local port community, was tasked with advertising the forthcoming PAWSA, then identifying and inviting workshop participants. Often this was accomplished through the COTP’s contacts with the port’s Harbor Safety Committee or equivalent organization.
The PAWSA process was conceived as a forum for waterway user experts (i.e., ship captains, pilots, and boat operators) to discuss port and vessel safety issues. From the outset, however, COTPs included other waterway stakeholders (e.g., shore facility operators, port captains, port authorities, environmentalists) in the workshop participant mix. This broader port community representation turned out well, as stakeholder participants often had expertise in marine casualty consequences that ship and boat operators did not possess.
A typical PAWSA panel included waterway user and stakeholder experts representing: • Commercial fishing or fishing charter operators • Dinner cruise and other small passenger vessel operators • Environmental interest organizations • Ferry operators • Marine police and firefighters • Local / state officials with waterways management responsibilities • Pilots and deep draft vessel officers • Port authorities • Recreational boat operators, often represented by USCG Auxiliary • Terminal operators • Tug and towboat operators • USACE and NOAA project planners • USCG buoy tender or patrol boat commanding officers • USCG marine inspectors and marine casualty investigators • USCG small boat station personnel • U.S. Navy afloat community representatives
9
PAWSA Final Report
Participant Selection (continued)
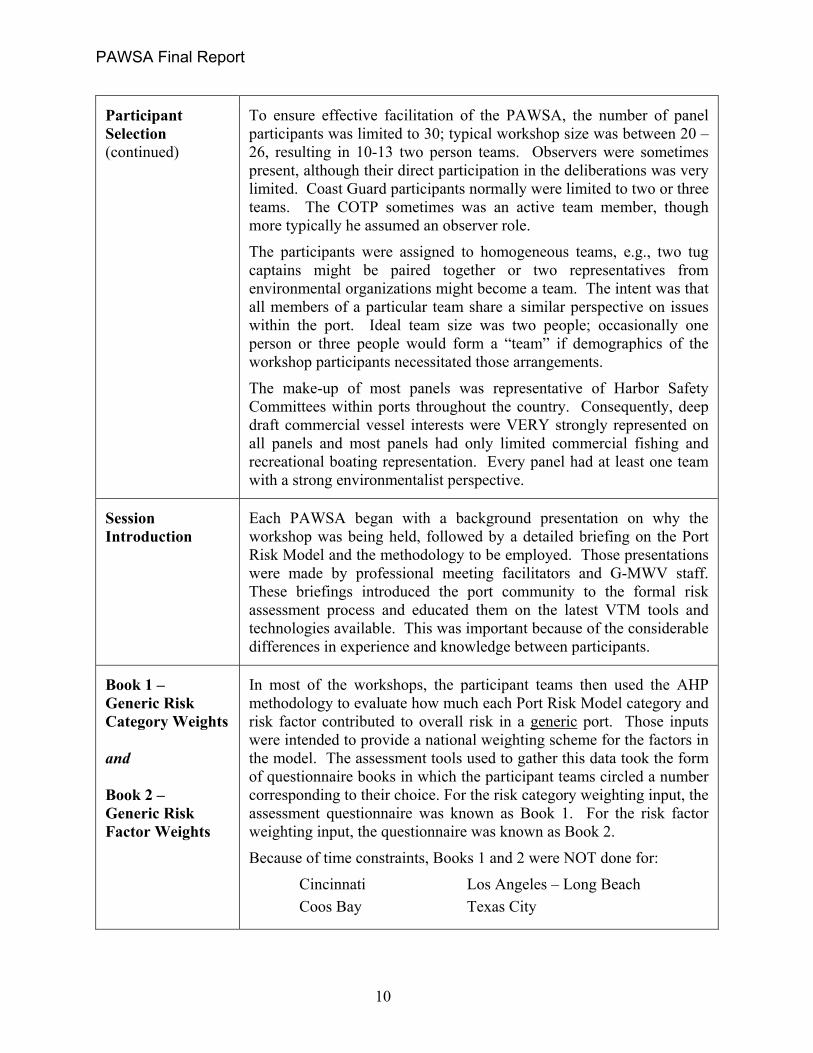
To ensure effective facilitation of the PAWSA, the number of panel participants was limited to 30; typical workshop size was between 20 – 26, resulting in 10-13 two person teams. Observers were sometimes present, although their direct participation in the deliberations was very limited. Coast Guard participants normally were limited to two or three teams. The COTP sometimes was an active team member, though more typically he assumed an observer role.
The participants were assigned to homogeneous teams, e.g., two tug captains might be paired together or two representatives from environmental organizations might become a team. The intent was that all members of a particular team share a similar perspective on issues within the port. Ideal team size was two people; occasionally one person or three people would form a “team” if demographics of the workshop participants necessitated those arrangements.
The make-up of most panels was representative of Harbor Safety Committees within ports throughout the country. Consequently, deep draft commercial vessel interests were VERY strongly represented on all panels and most panels had only limited commercial fishing and recreational boating representation. Every panel had at least one team with a strong environmentalist perspective.
Session Introduction
Each PAWSA began with a background presentation on why the workshop was being held, followed by a detailed briefing on the Port Risk Model and the methodology to be employed. Those presentations were made by professional meeting facilitators and G-MWV staff. These briefings introduced the port community to the formal risk assessment process and educated them on the latest VTM tools and technologies available. This was important because of the considerable differences in experience and knowledge between participants.
Book 1 – Generic Risk Category Weights and Book 2 – Generic Risk Factor Weights
In most of the workshops, the participant teams then used the AHP methodology to evaluate how much each Port Risk Model category and risk factor contributed to overall risk in a generic port. Those inputs were intended to provide a national weighting scheme for the factors in the model. The assessment tools used to gather this data took the form of questionnaire books in which the participant teams circled a number corresponding to their choice. For the risk category weighting input, the assessment questionnaire was known as Book 1. For the risk factor weighting input, the questionnaire was known as Book 2.
Because of time constraints, Books 1 and 2 were NOT done for:
Cincinnati Los Angeles – Long Beach Coos Bay Texas City
10

PAWSA Final Report
Book 3 – Generic Risk Factor Scales
Next the participants calibrated a risk measurement scale for each risk factor by assigning numbers to four qualitative descriptions of risk levels. This input was via a questionnaire known as Book 3. The Book 3 scales are a series of four numeric values between 1 and 9, inclusive. The greater the difference between the values assigned to two levels, the greater the difference in their effects on port safety.
As an example, for the risk factor of Waterway Complexity, the four qualitative descriptors of risk, arranged in increasing risk level order, were as follows:
A. Straight with NO crossing traffic B. Multiple turns over 15 degrees with NO crossing traffic C. Converging waterways with NO crossing traffic D. Converging waterways WITH crossing traffic
Results from a particular port might have been: A. 1.0 B. 2.8 C. 4.9 D. 9.0
These values can be interpreted to mean that there is only a moderate increase in risk (1.8 point difference) between a straight waterway and a waterway with many turns, so long as there is no crossing traffic. Risk continues to increase at about the same rate (2.1 point difference) when converging waterways are added to the mix. But, when crossing traffic enters the picture, risk increases dramatically, as shown by the jump from 4.9 to 9.0 (4.1 point difference).
Two points distinguish Book 3 from Books 1 and 2. First, Book 3 did not employ the AHP, which both ranks (or orders) and scales a group of alternatives. Since Book 3 was designed so that the order of the levels being compared was already established (i.e., each level was increasingly more risky than the previous level), the AHP does not apply. Second, Book 3 only included risk factors that are best characterized by discrete qualitative descriptors of possible conditions as they progress from less risky to more risky, as opposed to a continuous scale. Thus, Book 3 only established risk measurement scales for the factors under the Navigational Conditions, Waterway Configuration, Immediate Consequences, and Subsequent Consequences categories in the Port Risk Model. Risk factors under Fleet Composition and Traffic Conditions were measured using a different procedure, described below.
11

PAWSA Final Report
Book 4 – Estimating Risk In This Port
The most important segment of the workshop followed these preliminary activities, wherein the participants were asked to discuss specific problems in the port relating to each Port Risk Model factor. A note taker recorded the gist of those discussions, key elements of which are in each port’s appendix to this report. After two to three hours of discussion, the participants used the risk measuring scales, previously created from Book 3 inputs, to numerically evaluate the risk levels in their port. The risk level range for each factor was from 1 [Port Heaven – risk level doesn’t get any lower (better) than this] to 9 [Port Hell – risk level doesn’t get any higher (worse) than this]. For each of the risk factors in the two categories not covered by Book 3, participants simply circled the value on a 1 to 9 scale that corresponded to their perception of the risk level for that factor. The two risk level questionnaires used for this segment were known as Books 4A and 4B.
Ultimately, the risk measuring scales (Book 3 inputs) from all 28 ports were used to produce a set of national scales. Those national scales then were used to determine the final port risk levels (Book 4 results) presented in this report.
Book 5 – VTM Tools Evaluation
A discussion of existing risk mitigation strategies and appropriate ways to further reduce risk occurred next. Generally, workshops only discussed mitigations for those risk factors which had been evaluated as being above mid-range (5.0 on the 1 to 9 scale). The gist of those discussions also were recorded by a note taker. Following that discussion session, the participants evaluated the efficacy and appropriateness of a selection of VTM measures for addressing unmitigated risk, i.e., risk that was not well-balanced by mitigation strategies already in place. In this evaluation (Book 5), the participants had three choices:
(1) risk level for this factor IS well-balanced by existing mitigations;
(2) risk level is NOT well-balanced by existing mitigations and a specific VTM measure should be implemented to reduce risk; or
(3) risk level is NOT well-balanced by existing mitigations and something else (non-VTM solution) should be implemented to reduce risk.
As each numerical assessment (Book) was completed, the responses were entered into the PAWSA computer software. Aggregated results were presented to the panel for validation before moving on to the next workshop segment.
12
PAWSA Final Report
Process Evolution The final step in each PAWSA workshop was for the participants to fill out a critique. The critique asked a series of questions eliciting ways in which the workshop methodology, the presentations, the various assessment tools (Books), and the meeting facilities could be improved. Those critiques were formally evaluated after each session and appropriate changes made as directed by G-MWV. Consequently, the overall approach and countless details were incrementally changed (and hopefully improved) after EVERY workshop, up to and including Hampton Roads. Significant changes were:
• After the first five ports the facilitation team and G-MWV became convinced that the VTM measures assessment tool (Books 5A thru 5E) was cumbersome to administer and the results were sometimes inconclusive. An alternate approach was developed using Microsoft Excel® spreadsheets. That alternate approach was used along with the original method in the next two ports (Charleston and San Francisco). Based on critique input received at that point, the original methodology was dropped entirely and the Excel® spreadsheet approach was used for all subsequent ports.
• The names used for two of the risk categories and several of the risk factors in the Port Risk Model developed by Drs. Harrald and Merrick proved to be somewhat confusing to workshop participants. This manifested itself as questions asked / confusion expressed during the evaluation segments and as comments on the critiques. Over time, those names were changed.
– Short-term Consequences → Immediate Consequences – Long-term Consequences → Subsequent Consequences – % High Risk Deep Draft Cargo & Passenger Vessels →
Percentage of High Risk Deep Draft – % High Risk Shallow Draft Cargo & Passenger Vessels →
Percentage of High Risk Shallow Draft – Currents, Tides and Rivers → Tide & River Currents – Passing Arrangements → Channel Width – Channel and Bottom → Bottom Type
• Recurring participant comments during the first eleven ports indicated that there should be some method for adjusting inputs based on the varying levels of expertise within each workshop panel. Beginning with Berwick Bay, participant teams were asked to assess their expertise with respect to each category in the Port Risk Model. Those expertise scores subsequently were used to mathematically weight each team’s input to the risk level (Book 4) and VTM tool selection (Book 5) evaluations.
13

PAWSA Final Report
Workshop Report and Strategy Plan
Within several hours after each workshop ended, the facilitation team generated a Workshop Report which briefly described the PAWSA process, recorded the results from the quantitative assessments (Books 1 to 5), and captured the gist of the participant discussions with respect to risks and appropriate risk mitigation strategies. A draft of the Workshop Report was delivered to the COTP at a briefing the following morning. After review and comment by the COTP, the Workshop Report was finalized and then formed the basis for a Strategy Plan, also drafted by the facilitation team. Whereas the Workshop Report was intended as the minutes of the meeting for use by panel participants and the local Coast Guard staff, the Strategy Plan was intended as a medium to long-range planning document for seniors in the Coast Guard chain of command and other interests who were not present at the workshop. The Strategy Plan also included recommendations based on facilitation team experiences with similar problems in other ports.
Results and Analysis
The following sections summarize findings from the workshops. Those results are presented for each Book, with Book 4 broken down into a port to port comparison of the risk levels for each factor in the Port Risk Model.
The ports visited were grouped by geographical region / location: East Coast, Gulf Coast, West Coast, river ports, and island ports. An analysis of the Book 4 results showed that there were no statistically significant regional differences between risk levels for any factors in the Port Risk Model.
Results and Analysis: Books 1 and 2
Books 1 and 2 were designed to gather data needed to establish a national weighting scheme for the Port Risk Model. The initial expectation was that reasonably consistent data would be obtained from the first half-dozen or so ports visited, such that no subsequent inputs would be needed. Analysis of weighting scheme inputs at that point indicated that a significant amount of variation was occurring within each panel (from team to team) and from panel to panel. Consequently, data was collected from 24 of the 28 ports in which PAWSA workshops were conducted. (Workshop time constraints precluded obtaining Book 1 and 2 inputs from the other four ports.) Even with the larger data set, large port-to-port differences in weights assigned to each risk factor precluded development of a reliable national weighting scheme.
To illustrate: one port said that Economic Impacts should be given a weight of 1.2 (out of a possible 100 total points for all factors) while another port said that factor should have a weight of 21.3. The average weight across all 24 ports for Economic Impacts was 5.1, but the
14
PAWSA Final Report
Results and Analysis: Books 1 and 2 (continued)
standard deviation (a measure of how much variation there was in the inputs) was 4.2. Those statistics mean that there is a 90% chance that the “true” average is somewhere between 13.5 and – 3.3. As the latter value is off the scale (less than zero) no “true” average exists. Even in the best case example, for Volume of Shallow Draft, the range of inputs was from 0.9 to 5.8, the average was 2.7 and the standard deviation was 1.2. Therefore, there is a 90% chance that the “true” average lies somewhere between 0.2 and 5.1, which is not very useful information.
Results and Analysis: Book 3
Risk measuring scales for four of the six risk categories in the Port Risk Model were calibrated in all 28 ports visited. Those risk measuring scales were used in the next step (Book 4A) of the local PAWSA process. [Risk levels for the Fleet Composition and Traffic Conditions categories were measured directly in Book 4B on a loosely anchored 1 (low risk) to 9 (high risk) point scale.] The measured risk levels reported in the Workshop Report and Strategy Plan for each port were based on those locally developed scales. Because each port used different scales to assess risk levels, those previously reported results can NOT be compared between ports.
To correct for this difficulty, a national risk measuring scale was developed for each of the 14 risk factors addressed by Book 3. This was done by averaging together the results from all 28 ports for each factor. Contrary to the large variations from panel to panel that were seen in Book 1 and 2, there was very little variation from panel to panel for the Book 3 results. The average standard deviation was only .30, which means that results reported below are accurate, with 90% confidence, to ± 3%.
For the other 6 risk factors (under the Fleet Composition and Traffic Conditions categories), no correction was needed because they were measured directly on the same numerical scale.
In preparing this report, the national scales were reapplied to the Book 4 inputs, generating risk level results which CAN be compared from port to port.
The national risk measuring scales use the following values. The first qualitative risk level description, the “A” or Port Heaven descriptor in Book 4, is always assigned a value of 1.00. Likewise, the last qualitative risk level description, the “D” or Port Hell descriptor, is always assigned a value of 9.00. The first and second intermediate descriptors, the “B” and “C” values, use the intermediate values shown.
15

PAWSA Final Report
Results and Analysis: Book 3 (continued)
Risk Factor “A” Value
“B” Value
“C” Value
“D” Value
Wind Conditions 1.00 2.53 4.87 9.00 Visibility Conditions 1.00 2.43 4.89 9.00 Tide & River Currents 1.00 2.25 5.05 9.00 Ice Conditions 1.00 2.04 5.25 9.00 Visibility Obstructions 1.00 2.00 4.70 9.00 Channel Width 1.00 2.21 5.94 9.00 Bottom Type 1.00 1.84 4.85 9.00 Waterway Complexity 1.00 2.57 4.86 9.00 Number of People on Waterway 1.00 3.22 5.85 9.00 Volume of Petroleum 1.00 2.40 5.10 9.00 Volume of Chemicals 1.00 2.38 5.32 9.00 Economic Impacts 1.00 3.25 5.46 9.00 Environmental Impacts 1.00 3.03 5.91 9.00 Health & Safety Impacts 1.00 2.56 5.56 9.00
Expertise Assessment Results
In Berwick Bay and all subsequent ports (total of 17), each participant team was asked to self-assess their level of expertise with respect to the six risk categories in the Port Risk Model. Those self-assessments were done after the detailed briefing on the concepts underlying all of the factors in the model. The expertise assessment used a loosely anchored 1 (no knowledge) to 9 (world-class expert) scale.
Overall expertise results:
Risk Category Average Fleet Composition 5.9 Traffic Volume 6.6 Navigational Conditions 6.9 Waterway Configuration 6.7 Immediate 6.7 Subsequent Consequences 6.2
Every port’s teams thought that they were well above average in their knowledge of the causes and effects of marine casualties. The “weakest” area, and at 5.9 that was well above the mid-point on the scale, was in knowledge of Fleet Composition. These results shouldn’t be too surprising, given that most participants were selected for a panel based on their acknowledged expertise with respect to vessel navigation, port operations, and environmental response activities.
16

PAWSA Final Report
Expertise Assessment Results (continued)
The expertise self-assessments were not used to weight inputs during a PAWSA workshop, so the risk level results reported in the Workshop Report and Strategy Plan for each port do NOT reflect that information. However, the Book 4 results reported in this report HAVE been adjusted for those expertise self-assessments, for those ports where they were done. This adjustment was done by weighting the Book 4 inputs from each team by that team’s expertise relative to every other team’s expertise.
Results and Analysis: Book 4
The next twenty sections of this report will examine the Book 4 risk level results for each factor in the Port Risk Model. For each factor, all ports whose risk level was above the scale midpoint (5.0) are listed, arranged in decreasing order of perceived risk.
The measured risk level for each factor has been recomputed using the national risk measurement scales, as discussed previously, EXCEPT for Port Lavaca and Houston / Galveston. The PAWSA database became corrupted after those two ports were completed, resulting in loss of the raw electronic data for those workshops. Paper copies of the books were discarded before the database corruption was discovered. Consequently, the risk level results reported herein are exactly the same as were reported in the Workshop Reports and Strategy Plans for those two ports.
Risk levels for Berwick Bay and all subsequent ports visited have been recomputed taking into account participant team expertise.
No results are reported for Philadelphia because the PAWSA workshop was terminated before any Book 4 inputs were obtained from that port.
Risk mitigation strategies requiring national implementation are given for each factor. These national strategies were developed by analyzing the VTM tools evaluation (Book 5) and the risk mitigation discussion results for all 28 ports (less Philadelphia). Risk mitigation strategies requiring regional or local implementation are in each port’s appendix to this report.
17

PAWSA Final Report
Percentage High Risk Deep Draft
Concept: The extent to which high risk deep draft shipping calling at the port affects safety. High risk ships are those which are more likely to have a marine casualty due to poor overall maintenance and/or low crew competency. Deep draft ships are defined as large, ocean-going vessels such as freight ships, tankers, and cruise ships, typically being used in international trade. Oil rigs also were considered under this factor. Results:
Port Risk Level San Juan 7.31 Ponce 6.61
Los Angeles / Long Beach 6.4 Port Everglades 6.0
National Risk Mitigation Strategies: • Continue efforts at IMO to strengthen ISM Code and STCW
requirements.
• Validate that the Port State Control Targeting Matrix is properly identifying high risk foreign flag ships calling at U.S. ports.
• Continue vigorously enforcing, via port state control boardings, ISM Code / STCW requirements for ships calling at U.S. ports.
1 Risk level NOT adjusted for participant expertise evaluations.
18

PAWSA Final Report
Percentage High Risk Shallow Draft
Concept: The extent to which high risk shallow draft vessels using the port affect safety. High risk vessels are those which are more likely to have a marine casualty due to poor maintenance and/or low operator competency. Shallow draft vessels are defined as everything other than deep draft ships. Examples included: some coastal freighters, most offshore oil rig supply vessels, all tugs and towboats, most commercial fishing vessels, all dinner cruise vessels, and all recreational craft. Results:
Port Risk Level Miami 7.0 Berwick Bay 6.5 Port Lavaca 6.51 Port Everglades 6.2 Port Arthur 6.21
Pascagoula 6.21 Hampton Roads 6.0 Honolulu 5.41 Houston / Galveston 5.41 Portland, ME 5.4 San Francisco 5.41 Los Angeles / Long Beach 5.3
National Risk Mitigation Strategies: • Validate that the Port State Control Targeting Matrix is properly
identifying high risk foreign flag ships calling at U.S. ports. • Continue vigorously enforcing, via port state control boardings,
ISM Code / STCW requirements for ships calling at U.S. ports. • Provide incentives for tug and towboat owners to enroll in the
American Waterway Operators’ Responsible Carrier Program or adopt similar maintenance and operating standards.
• Examine crewing requirements on tugs and towboats, especially as they relate to chronic crew fatigue human factors issues.
• Establish mandatory inspection for commercial fishing vessels. • Encourage States to adopt recreational boat operator licensing or
mandatory education programs. • Expand / actively market Coast Guard Auxiliary education outreach
efforts to commercial fishing vessel / recreational vessel operators, focusing on Rules of the Road awareness, especially Rule 9.
1 Risk level NOT adjusted for participant expertise evaluations.
19

PAWSA Final Report
Volume of Deep Draft Vessels
Concept: The extent to which the volume of deep draft vessels using the port affects safety. Deep draft vessels are defined the same as for the Percentage of High Risk Deep Draft factor. Traffic volume related safety issues typically manifest themselves as an inability of the port infrastructure to handle ships alongside as they arrive, necessitating loitering or anchoring while awaiting a berth. As volume increases situational awareness also is degraded: identifying and making passing arrangements with other vessels becomes more difficult for ship masters and pilots. Results:
Port Risk Level Los Angeles / Long Beach 7.0 San Juan 6.91 Port Arthur 6.51 Port Everglades 6.3 Houston / Galveston 6.11 Honolulu 6.11 Texas City 6.0 Charleston 5.81 Ponce 5.51 Lake Charles 5.3 Portland, ME 5.3 San Francisco 5.31 Mobile 5.21
National Risk Mitigation Strategies: • Establish / improve Vessel Traffic Services or Vessel Traffic
Information Services.
• Establish domestic carriage requirements for Automatic Identification Systems.
1 Risk level NOT adjusted for participant expertise evaluations.
20

PAWSA Final Report
Volume of Shallow Draft Vessels
Concept: The extent to which the volume of shallow draft vessels using the port affects safety. Shallow draft vessels are defined as non-recreational craft that are not deep draft. As in the Percentage High Risk Shallow Draft factor, these include: some coastal freighters, most offshore oil rig supply vessels, all tugs and towboats, most commercial fishing vessels, and all dinner cruise vessels. Traffic volume related safety issues typically manifest themselves as either an inability of the port infrastructure to handle ships alongside in a timely manner or as radio traffic congestion. As volume increases situational awareness also is degraded: identifying and making passing arrangements with other vessels becomes more difficult for vessel operators. Results:
Port Risk Level Port Arthur 7.41 Berwick Bay 7.2 Texas City 6.9 Houston / Galveston 6.81 Honolulu 6.81 Pascagoula 6.71 Port Lavaca 6.41 Los Angeles / Long Beach 6.4 Cincinnati 6.2 Port Everglades 6.1 Lake Charles 5.7 Hampton Roads 5.7 Miami 5.6 Boston 5.3 San Juan 5.21 Portland, ME 5.2 San Francisco 5.21
National Risk Mitigation Strategies: • Establish / improve Vessel Traffic Services or Vessel Traffic
Information Services.
• Apply domestic carriage requirements for Automatic Identification Systems to all commercial vessels, regardless of length or tonnage.
1 Risk level NOT adjusted for participant expertise evaluations.
21
PAWSA Final Report
Volume of Fishing & Pleasure Craft
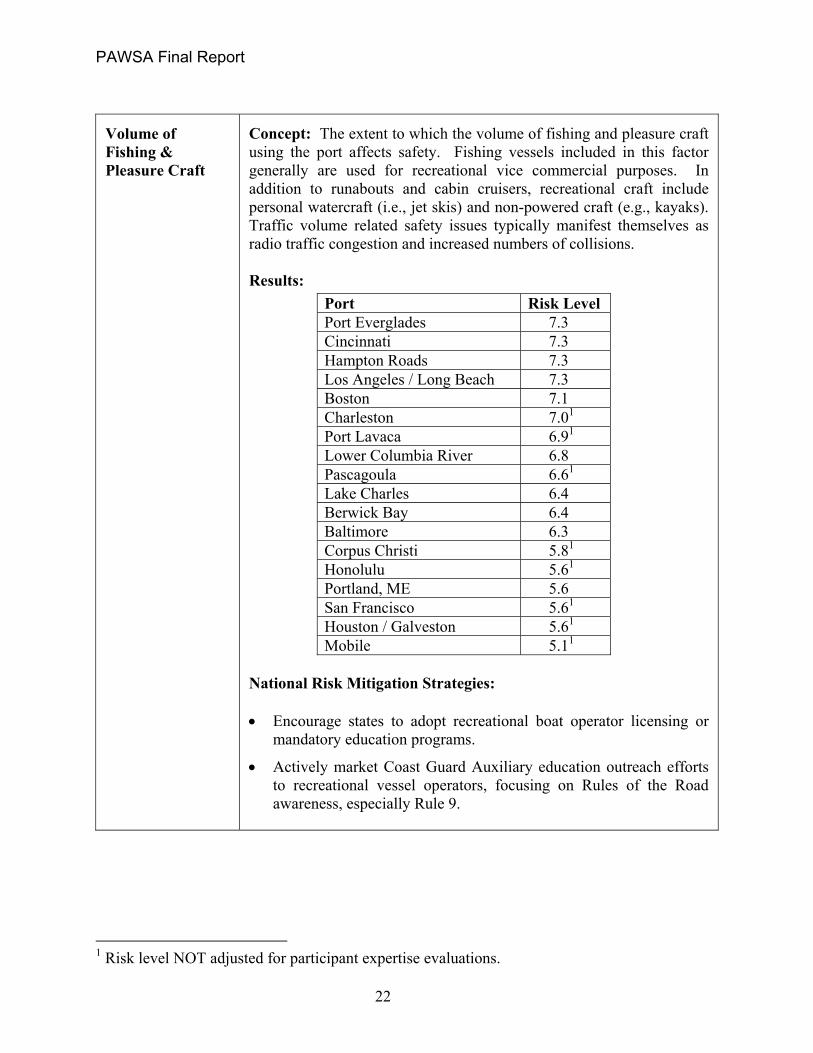
Concept: The extent to which the volume of fishing and pleasure craft using the port affects safety. Fishing vessels included in this factor generally are used for recreational vice commercial purposes. In addition to runabouts and cabin cruisers, recreational craft include personal watercraft (i.e., jet skis) and non-powered craft (e.g., kayaks). Traffic volume related safety issues typically manifest themselves as radio traffic congestion and increased numbers of collisions. Results:
Port Risk Level Port Everglades 7.3 Cincinnati 7.3 Hampton Roads 7.3 Los Angeles / Long Beach 7.3 Boston 7.1 Charleston 7.01 Port Lavaca 6.91 Lower Columbia River 6.8 Pascagoula 6.61 Lake Charles 6.4 Berwick Bay 6.4 Baltimore 6.3 Corpus Christi 5.81 Honolulu 5.61 Portland, ME 5.6 San Francisco 5.61 Houston / Galveston 5.61 Mobile 5.11
National Risk Mitigation Strategies: • Encourage states to adopt recreational boat operator licensing or
mandatory education programs.
• Actively market Coast Guard Auxiliary education outreach efforts to recreational vessel operators, focusing on Rules of the Road awareness, especially Rule 9.
1 Risk level NOT adjusted for participant expertise evaluations.
22

PAWSA Final Report
Traffic Density Concept: The extent to which congestion and the interaction between different vessel types using the port affect safety. Congestion can occur in specific locations, at specific times, or both. Traffic density related safety issues typically manifest themselves as apprehension by commercial vessel operators about recreational operator actions. Recreational craft maneuvers and apparent failure to appreciate commercial vessel operating constraints cause confusion, close calls, and waterway use conflicts. Results:
Port Risk Level Port Everglades 8.3 Pascagoula 7.51 San Juan 7.51 Port Fourchon 7.1 Berwick Bay 7.1 Lake Charles 7.1 Cincinnati 6.9 Los Angeles / Long Beach 6.8 Honolulu 6.81 Port Arthur 6.71 Texas City 6.5 Miami 6.4 Boston 6.3 Port Lavaca 6.11 Hampton Roads 6.1 Baltimore 5.9 Houston / Galveston 5.81 Lower Columbia River 5.8 Charleston 5.81 Portland, ME 5.4 San Francisco 5.41
National Risk Mitigation Strategies: • Establish / improve Vessel Traffic Services or Vessel Traffic
Information Services. • Apply domestic carriage requirements for Automatic Identification
Systems to all commercial vessels, regardless of length or tonnage. • Expand / actively market Coast Guard Auxiliary education outreach
efforts to commercial fishing vessel / recreational vessel operators, focusing on Rules of the Road awareness, especially Rule 9.
1 Risk level NOT adjusted for participant expertise evaluations.
23

PAWSA Final Report
Wind Conditions Concept: How often severe winds occur in the port and how well they are predicted. As frequency of severe winds increases and predictability decreases, risk increases. Most ports indicated that sustained winds above 20 to 25 knots substantially increase the risk for both commercial and recreational vessels. Results:
Port Risk Level Pascagoula 5.61 Mobile 5.21
National Risk Mitigation Strategies: • Provide support for installation of Physical Oceanographic Real-
Time System (PORTS) wind sensors and integrate output with AIS.
1 Risk level NOT adjusted for participant expertise evaluations.
24

PAWSA Final Report
Visibility Conditions
Concept: How often poor visibility occurs in the port and how well those conditions are predicted. As frequency of poor visibility increases and predictability decreases, risk increases. “Poor” visibility generally was defined as less than ½ nautical mile. The Visibility Conditions factor relates to natural causes which limit a mariner’s ability to visually detect other vessels or aids to navigation, e.g., fog, blowing snow, smoke. Simple dark of night is not included in this risk factor. Results:
Port Risk Level Berwick Bay 5.8 Coos Bay 5.8 Pascagoula 5.61
National Risk Mitigation Strategies: • Align U.S. and IMO standards for Electronic Chart Display
Information Systems (ECDIS).
• Provide incentives for all commercial vessels, regardless of length or tonnage, to install and use precision navigation equipment (e.g. DGPS, ECDIS).
• Apply domestic carriage requirements for Automatic Identification Systems to all commercial vessels, regardless of length or tonnage.
1 Risk level NOT adjusted for participant expertise evaluations.
25

PAWSA Final Report
Tide & River Currents
Concept: The strength of the currents in a port, whether they run parallel to or across the channel, and whether vessel transits have to be timed with the state of the tide. Strong currents generally were defined as being greater than 5 knots. Results:
Port Risk Level Berwick Bay 9.01 Port Everglades 7.8 Port Lavaca 7.31,2 Miami 5.6 Corpus Christi 5.51 Charleston 5.21 Ponce 5.11 Coos Bay 5.0
National Risk Mitigation Strategies:
• Align U.S. and IMO standards for Electronic Chart Display Information Systems (ECDIS).
• Provide incentives for all commercial vessels, regardless of length or tonnage, to install and use precision navigation equipment (e.g. DGPS, ECDIS).
• Provide support for installation of Physical Oceanographic Real-Time System (PORTS) water current sensors and integrate output with AIS.
• Include verification of U.S. Coast Pilot accuracy, particularly relating to expected tide and current conditions, as part of the Waterways Analysis and Management System (WAMS) process.
1 Risk level NOT adjusted for participant expertise evaluations. 2 Risk level measured using local, NOT national, scale.
26
PAWSA Final Report
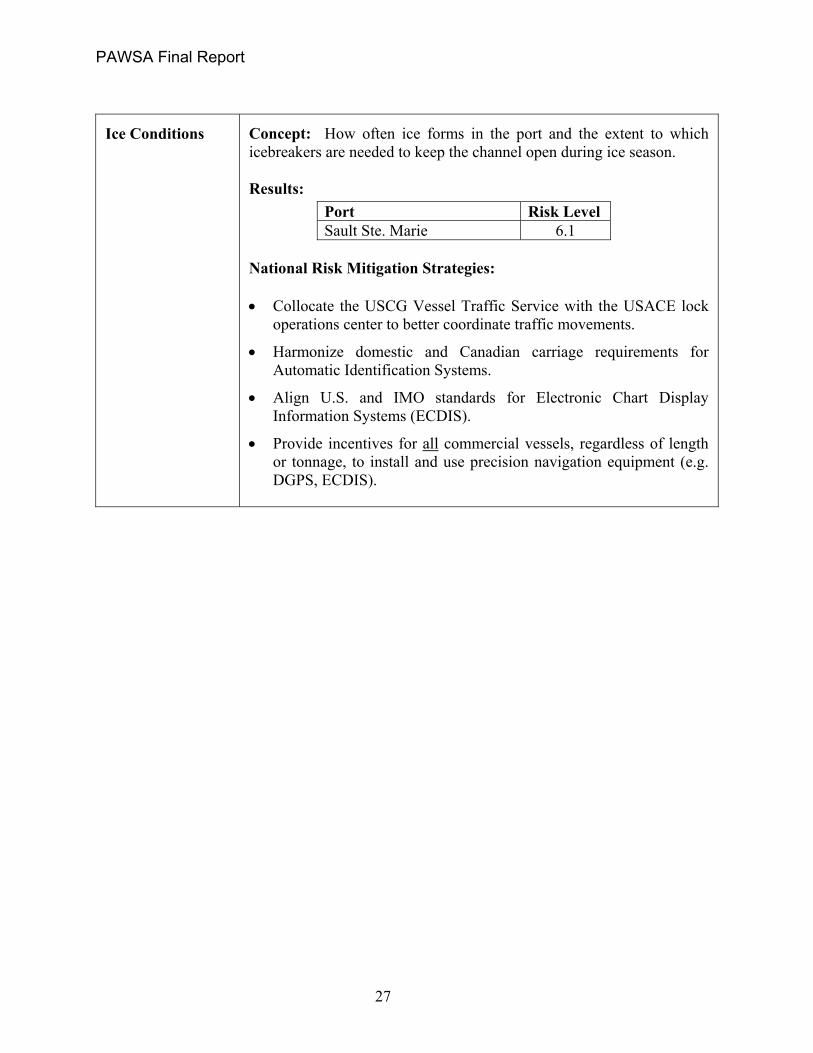
Ice Conditions Concept: How often ice forms in the port and the extent to which icebreakers are needed to keep the channel open during ice season. Results:
Port Risk Level Sault Ste. Marie 6.1
National Risk Mitigation Strategies: • Collocate the USCG Vessel Traffic Service with the USACE lock
operations center to better coordinate traffic movements.
• Harmonize domestic and Canadian carriage requirements for Automatic Identification Systems.
• Align U.S. and IMO standards for Electronic Chart Display Information Systems (ECDIS).
• Provide incentives for all commercial vessels, regardless of length or tonnage, to install and use precision navigation equipment (e.g. DGPS, ECDIS).
27

PAWSA Final Report
Visibility Obstructions
Concept: Whether there are blind turns or intersections in the port and whether radio communications are hampered by geography. The presence of man-made obstructions to visibility, e.g., high-rise condominiums, moored oil rigs, and bridges, also were included in this factor. The most commonly cited visibility “obstruction” was background lighting that hinders mariners’ ability to detect other vessels or aids to navigation, especially range lights. Results:
Port Risk Level Cincinnati 7.3 Berwick Bay 5.3 San Juan 5.21 Lake Charles 5.1
National Risk Mitigation Strategies: • Apply domestic carriage requirements for Automatic Identification
Systems to all commercial vessels, regardless of length or tonnage.
• Align U.S. and IMO standards for Electronic Chart Display Information Systems (ECDIS).
• Ensure that new port security requirements concerning shore facility lighting do not result in further impingement on the ability of vessels to safely navigate at night.
1 Risk level NOT adjusted for participant expertise evaluations.
28

PAWSA Final Report
Channel Width Concept: How much room there is for vessels to maneuver past each other. Results:
Port Risk Level Pascagoula 7.81 Berwick Bay 7.7 Texas City 7.5 San Juan 7.21 Miami 7.2 Charleston 6.91 Port Arthur 6.81 Port Everglades 6.7 Lake Charles 5.8 Portland, ME 5.6 San Francisco 5.61 Honolulu 5.41 Houston / Galveston 5.31,2 Port Fourchon 5.2 Lower Columbia River 5.2 Port Lavaca 5.11,2
National Risk Mitigation Strategies: • Establish / improve Vessel Traffic Services or Vessel Traffic
Information Services.
• Align U.S. and IMO standards for Electronic Chart Display Information Systems (ECDIS).
• Provide incentives for all commercial vessels, regardless of length or tonnage, to install and use precision navigation equipment (e.g. DGPS, ECDIS).
• Support widening / realignment of bridges constricting channels.
1 Risk level NOT adjusted for participant expertise evaluations. 2 Risk level measured using local, NOT national, scale.
29

PAWSA Final Report
Bottom Type Concept: How forgiving the bottom is if a vessel runs aground. Mud and silt can be a very forgiving situation; hard rock / coral comprising the channel bottom or close to the channel edges is much less so. Results:
Port Risk Level Port Everglades 9.0 Miami 8.3 Boston 6.7 Sault Ste Marie 5.8 Ponce 5.71 San Juan 5.21
National Risk Mitigation Strategies: • Align U.S. and IMO standards for Electronic Chart Display
Information Systems (ECDIS).
• Provide incentives for all commercial vessels, regardless of length or tonnage, to install and use precision navigation equipment (e.g. DGPS, ECDIS).
• Provide support for installation of Physical Oceanographic Real-Time System (PORTS) water depth sensors and integrate output with AIS.
• Continue implementation of double-bottom / double-side requirements for vessels using U.S. waterways.
1 Risk level NOT adjusted for participant expertise evaluations.
30

PAWSA Final Report
Waterway Complexity
Concept: How straight the waterways in the port are, whether converging waterways are present, and whether crossing traffic occurs within the port. A straight waterway is defined as having no bends over 15 degrees. Almost all ports have converging waterways. Typical crossing traffic situations are those involving ferry boats or where the Gulf Intercoastal Waterway crosses main ship channels.
Results: Port Risk Level Port Lavaca 9.01,2 Houston / Galveston 9.01,2
Honolulu 9.01 Lake Charles 8.8 Pascagoula 8.71 Miami 8.7 Port Everglades 8.6 Port Arthur 8.41 Hampton Roads 8.3 Cincinnati 8.3 Charleston 8.21 San Juan 8.11 Berwick Bay 8.0 Los Angeles / Long Beach 8.0 Mobile 8.01 Coos Bay 7.6 Corpus Christi 7.51 Portland, ME 6.8 San Francisco 6.81 Boston 6.7 Baltimore 5.8 Lower Columbia River 5.7 Texas City 5.4
National Risk Mitigation Strategies:
• Establish / improve VTS or VTIS. • Apply domestic carriage requirements for Automatic Identification
Systems to all commercial vessels, regardless of length or tonnage. • Provide incentives for all commercial vessels, regardless of length
or tonnage, to install and use precision navigation equipment (e.g., DGPS, Electronic Chart Display Information Systems).
1 Risk level NOT adjusted for participant expertise evaluations. 2 Risk level measured using local, NOT national, scale.
31

PAWSA Final Report
Number of People on Waterway
Concept: How many people would be exposed to death and injury and/or would have to be rescued in the worst case if a single vessel were involved in a marine accident in the port. As the number of people being carried in any one hull goes up, so does the risk. Most ports have some dinner cruise and other excursion boats, sometimes carrying more than 150 passengers per trip. Higher risk ports also have large cruise ships and/or casino boats calling. Results:
Port Risk Level Boston 8.7 Portland, ME 7.0 San Francisco 7.01 Los Angeles / Long Beach 6.9 Cincinnati 6.7 Miami 6.7 Honolulu 6.41 Houston / Galveston 6.31,2 San Juan 5.91 Port Everglades 5.8 Lake Charles 5.3
National Risk Mitigation Strategies: • Continue domestic and IMO efforts to improve primary lifesaving,
equipment, structural fire and flooding protection designs for large passenger carrying vessels.
• Continue efforts to identify / evaluate the effectiveness of mass rescue operation strategies.
• Review regulations and associated measures of effectiveness that target high capacity passenger vessels.
1 Risk level NOT adjusted for participant expertise evaluations. 2 Risk level measured using local, NOT national, scale.
32

PAWSA Final Report
Volume of Petroleum Cargoes
Concept: The amount of petroleum cargoes entering the port. As the amount of petroleum being carried in any one hull goes up, so does the risk. Results:
Port Risk Level Lake Charles 9.0 Port Arthur 9.01 Texas City 9.0 Berwick Bay 9.0 Los Angeles / Long Beach 8.8 Port Everglades 8.7 Boston 8.5 Pascagoula 8.51 Honolulu 8.41 Houston / Galveston 8.41,2 Portland, ME 8.4 San Francisco 8.41 San Juan 8.41 Port Lavaca 8.11,2 Corpus Christi 7.51 Cook Inlet 7.1 Ponce 6.51 Mobile 5.91 Cincinnati 5.8 Hampton Roads 5.6 Lower Columbia River 5.2
National Risk Mitigation Strategies: • Continue implementation of double-bottom / double-side
requirements for vessels using U.S. waterways.
• Review regulations and associated measures of effectiveness that target vessels carrying bulk petroleum products.
1 Risk level NOT adjusted for participant expertise evaluations. 2 Risk level measured using local, NOT national, scale.
33
PAWSA Final Report
Volume of Hazardous Chemical Cargoes
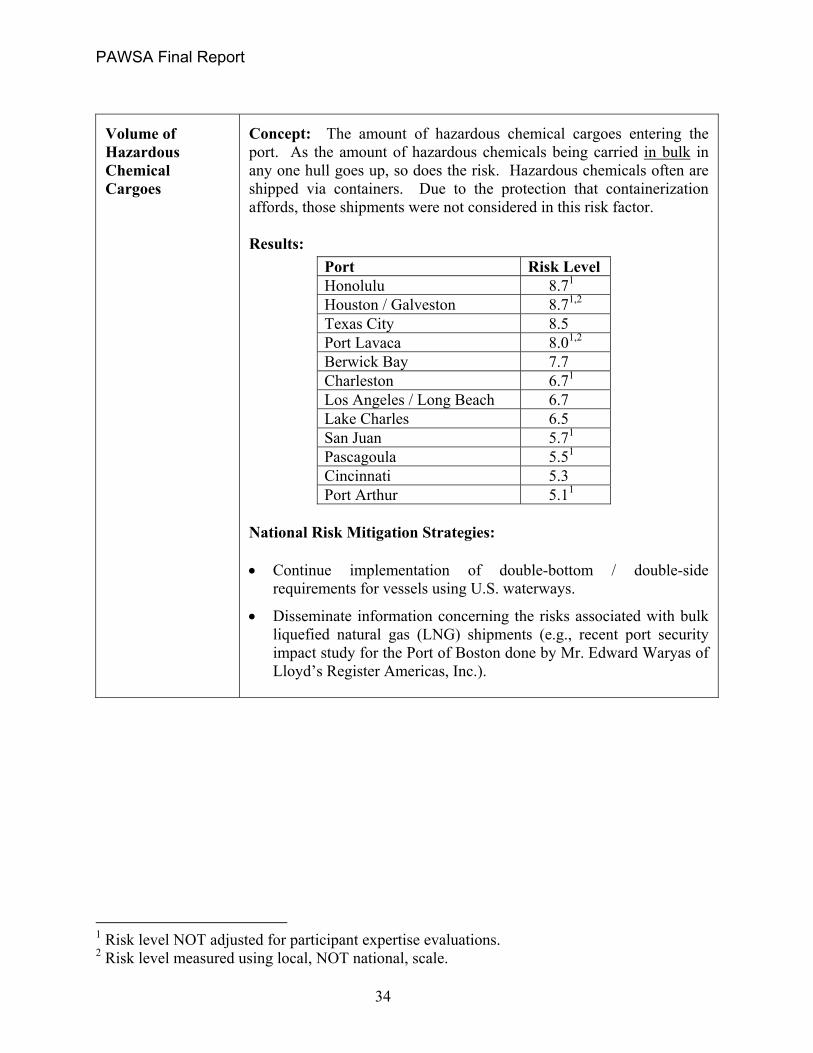
Concept: The amount of hazardous chemical cargoes entering the port. As the amount of hazardous chemicals being carried in bulk in any one hull goes up, so does the risk. Hazardous chemicals often are shipped via containers. Due to the protection that containerization affords, those shipments were not considered in this risk factor. Results:
Port Risk Level Honolulu 8.71 Houston / Galveston 8.71,2 Texas City 8.5 Port Lavaca 8.01,2 Berwick Bay 7.7 Charleston 6.71 Los Angeles / Long Beach 6.7 Lake Charles 6.5 San Juan 5.71 Pascagoula 5.51 Cincinnati 5.3 Port Arthur 5.11
National Risk Mitigation Strategies: • Continue implementation of double-bottom / double-side
requirements for vessels using U.S. waterways.
• Disseminate information concerning the risks associated with bulk liquefied natural gas (LNG) shipments (e.g., recent port security impact study for the Port of Boston done by Mr. Edward Waryas of Lloyd’s Register Americas, Inc.).
1 Risk level NOT adjusted for participant expertise evaluations. 2 Risk level measured using local, NOT national, scale.
34

PAWSA Final Report
Economic Impacts
Concept: The size of the population that is vulnerable to economic consequences should the port be closed for an appreciable amount of time. Also whether local fisheries would be affected. With just-in-time inventory management practices now the norm, most ports would start to feel economic impacts within a few days after an unexpected port closure. Those economic impacts may well extend regionally or nationally depending on the port. Results:
Port Risk Level Honolulu 8.71 Houston / Galveston 8.71,2 Hampton Roads 8.6 Portland, ME 8.3 San Francisco 8.31 Los Angeles / Long Beach 7.9 Lake Charles 7.7 Berwick Bay 7.5 Baltimore 7.1 Corpus Christi 7.11 Boston 7.1 Lower Columbia River 6.9 Port Fourchon 6.9 Mobile 6.71 Texas City 6.0 San Juan 5.81 Cincinnati 5.5 Coos Bay 5.5 Miami 5.4 Charleston 5.41 Port Lavaca 5.31,2
National Risk Mitigation Strategies: • None identified.
1 Risk level NOT adjusted for participant expertise evaluations. 2 Risk level measured using local, NOT national, scale.
35

PAWSA Final Report
Environmental Impacts
Concept: The extent to which environmentally sensitive areas, wetlands, endangered species, and local fisheries are present in the port. Note: the only two ports which did NOT rate themselves at high risk with respect to this factor were Boston and Cincinnati. Results:
Port Risk Level Hampton Roads 9.0 Berwick Bay 9.0 Lower Columbia River 8.8 Lake Charles 8.7 Port Fourchon 8.4 Coos Bay 8.1 Baltimore 7.9 Charleston 7.91 Miami 7.7 Port Everglades 7.6 Houston / Galveston 7.51,2 Honolulu 7.51 Pascagoula 7.41 Port Lavaca 7.21,2 Ponce 6.91 Cook Inlet 6.9 Mobile 6.41 San Juan 6.21 Texas City 6.2 Los Angeles / Long Beach 6.2 Corpus Christi 6.01 Portland, ME 5.8 San Francisco 5.81 Port Arthur 5.11 Sault Ste Marie 5.0
National Risk Mitigation Strategies: • Many implemented as a result of the Oil Pollution Act of 1990.
Same strategies as for Volume of Petroleum recommended.
1 Risk level NOT adjusted for participant expertise evaluations. 2 Risk level measured using local, NOT national, scale.
36
PAWSA Final Report
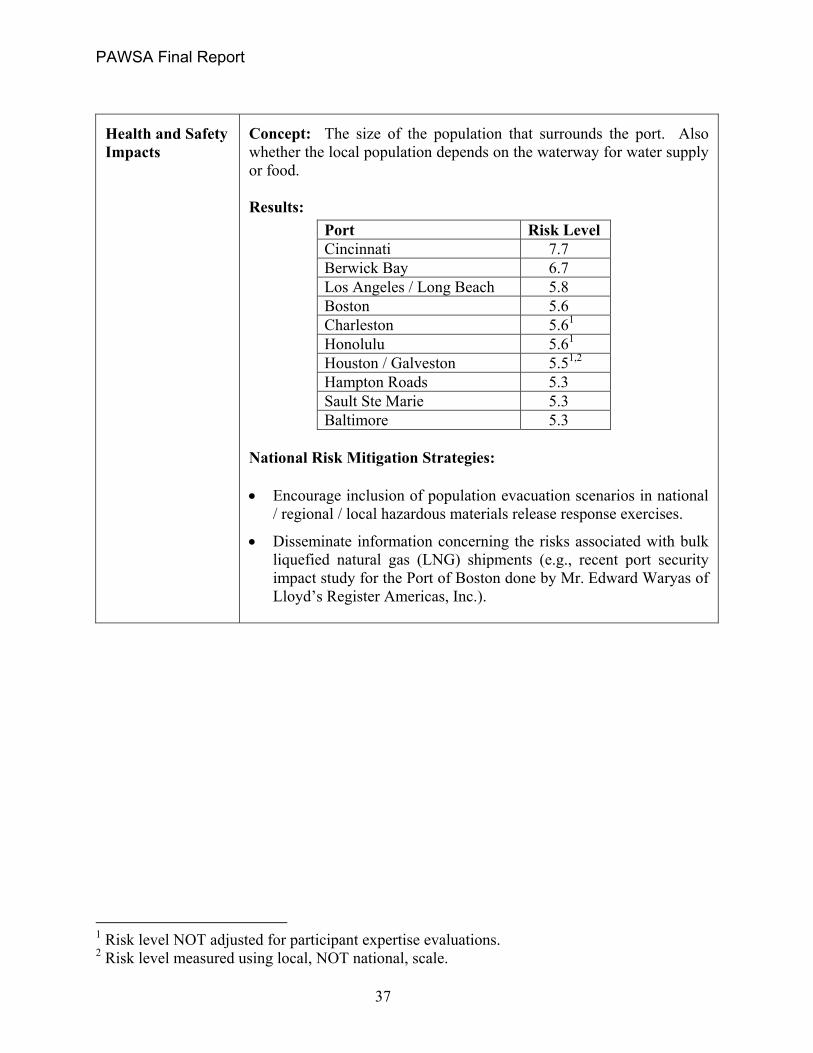
Health and Safety Impacts
Concept: The size of the population that surrounds the port. Also whether the local population depends on the waterway for water supply or food. Results:
Port Risk Level Cincinnati 7.7 Berwick Bay 6.7 Los Angeles / Long Beach 5.8 Boston 5.6 Charleston 5.61 Honolulu 5.61 Houston / Galveston 5.51,2 Hampton Roads 5.3 Sault Ste Marie 5.3 Baltimore 5.3
National Risk Mitigation Strategies: • Encourage inclusion of population evacuation scenarios in national
/ regional / local hazardous materials release response exercises.
• Disseminate information concerning the risks associated with bulk liquefied natural gas (LNG) shipments (e.g., recent port security impact study for the Port of Boston done by Mr. Edward Waryas of Lloyd’s Register Americas, Inc.).
1 Risk level NOT adjusted for participant expertise evaluations. 2 Risk level measured using local, NOT national, scale.
37
PAWSA Final Report
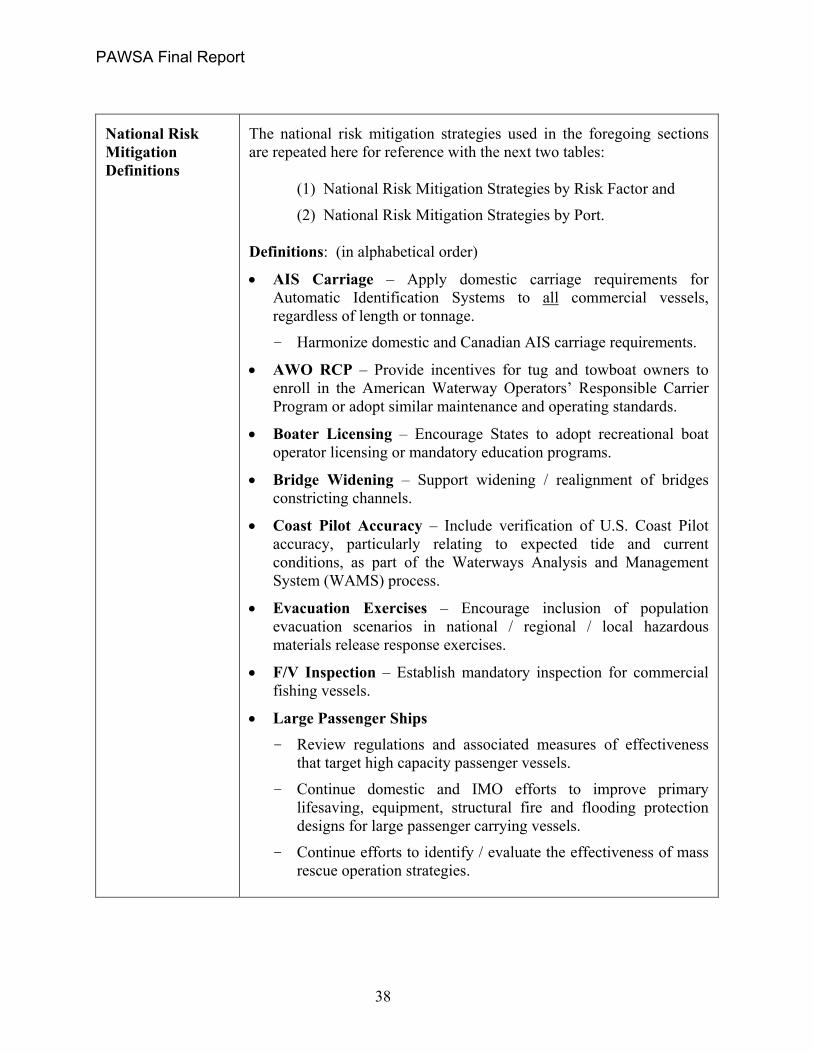
National Risk Mitigation Definitions
The national risk mitigation strategies used in the foregoing sections are repeated here for reference with the next two tables: (1) National Risk Mitigation Strategies by Risk Factor and
(2) National Risk Mitigation Strategies by Port. Definitions: (in alphabetical order)
• AIS Carriage – Apply domestic carriage requirements for Automatic Identification Systems to all commercial vessels, regardless of length or tonnage.
– Harmonize domestic and Canadian AIS carriage requirements.
• AWO RCP – Provide incentives for tug and towboat owners to enroll in the American Waterway Operators’ Responsible Carrier Program or adopt similar maintenance and operating standards.
• Boater Licensing – Encourage States to adopt recreational boat operator licensing or mandatory education programs.
• Bridge Widening – Support widening / realignment of bridges constricting channels.
• Coast Pilot Accuracy – Include verification of U.S. Coast Pilot accuracy, particularly relating to expected tide and current conditions, as part of the Waterways Analysis and Management System (WAMS) process.
• Evacuation Exercises – Encourage inclusion of population evacuation scenarios in national / regional / local hazardous materials release response exercises.
• F/V Inspection – Establish mandatory inspection for commercial fishing vessels.
• Large Passenger Ships – Review regulations and associated measures of effectiveness
that target high capacity passenger vessels.
– Continue domestic and IMO efforts to improve primary lifesaving, equipment, structural fire and flooding protection designs for large passenger carrying vessels.
– Continue efforts to identify / evaluate the effectiveness of mass rescue operation strategies.
38
PAWSA Final Report
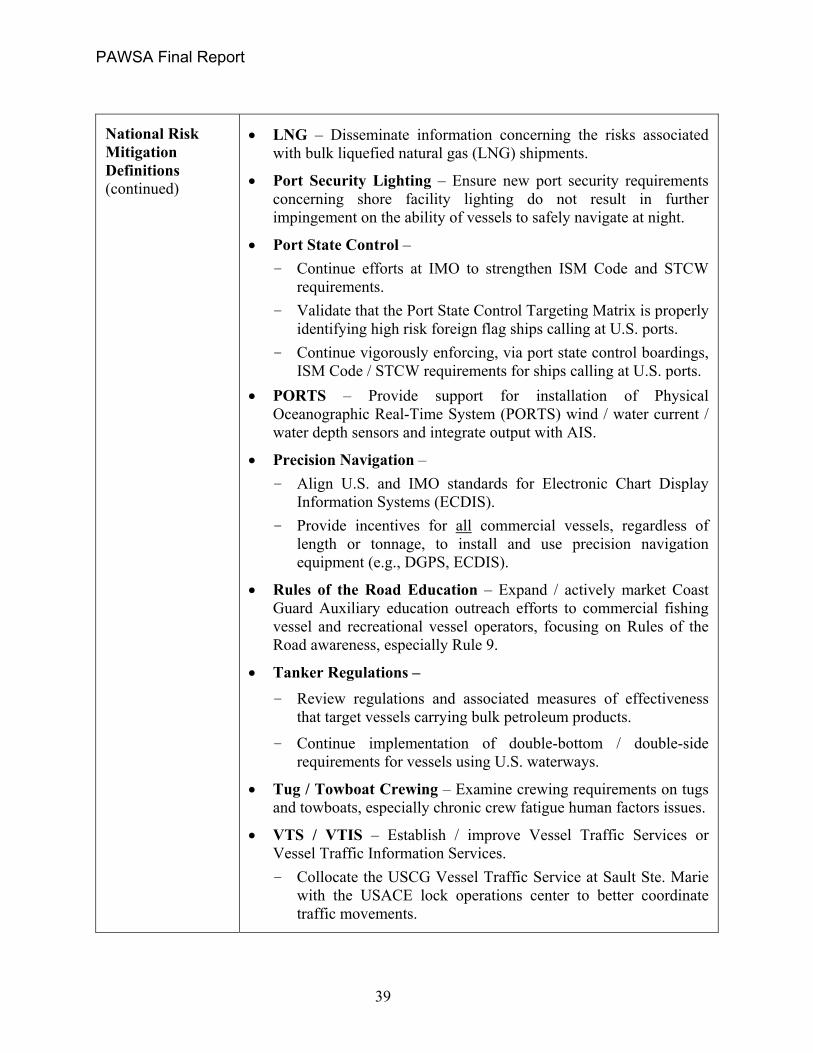
National Risk Mitigation Definitions (continued)
• LNG – Disseminate information concerning the risks associated with bulk liquefied natural gas (LNG) shipments.
• Port Security Lighting – Ensure new port security requirements concerning shore facility lighting do not result in further impingement on the ability of vessels to safely navigate at night.
• Port State Control – – Continue efforts at IMO to strengthen ISM Code and STCW
requirements. – Validate that the Port State Control Targeting Matrix is properly
identifying high risk foreign flag ships calling at U.S. ports. – Continue vigorously enforcing, via port state control boardings,
ISM Code / STCW requirements for ships calling at U.S. ports. • PORTS – Provide support for installation of Physical
Oceanographic Real-Time System (PORTS) wind / water current / water depth sensors and integrate output with AIS.
• Precision Navigation – – Align U.S. and IMO standards for Electronic Chart Display
Information Systems (ECDIS). – Provide incentives for all commercial vessels, regardless of
length or tonnage, to install and use precision navigation equipment (e.g., DGPS, ECDIS).
• Rules of the Road Education – Expand / actively market Coast Guard Auxiliary education outreach efforts to commercial fishing vessel and recreational vessel operators, focusing on Rules of the Road awareness, especially Rule 9.
• Tanker Regulations – – Review regulations and associated measures of effectiveness
that target vessels carrying bulk petroleum products.
– Continue implementation of double-bottom / double-side requirements for vessels using U.S. waterways.
• Tug / Towboat Crewing – Examine crewing requirements on tugs and towboats, especially chronic crew fatigue human factors issues.
• VTS / VTIS – Establish / improve Vessel Traffic Services or Vessel Traffic Information Services. – Collocate the USCG Vessel Traffic Service at Sault Ste. Marie
with the USACE lock operations center to better coordinate traffic movements.
39

National Risk Mitigation Strategies by Risk Factor
National Risk Mitigation Strategy
Risk Factor AIS
Car
riag
e
AW
O R
CP
Boa
ter
Lic
ensi
ng
Bri
dge
Wid
enin
g
Coa
st P
ilot A
ccur
acy
Eva
cuat
ion
Exe
rcis
es
F/V
Insp
ectio
n
Lar
ge P
asse
nger
Shi
ps
LN
G
Port
Sec
urity
Lig
htin
g
Port
Sta
te C
ontr
ol
POR
TS
Prec
isio
n N
avig
atio
n
Rul
es o
f the
Roa
d E
duca
tion
Tan
ker
Reg
ulat
ions
Tug
/ T
owbo
at C
rew
ing
VT
S / V
TIS
Percentage High Risk Deep Draft
X
Percentage High Risk Shallow Draft
X X X X X X
Volume of Deep Draft
X X
Volume of Shallow Draft
X X
Volume of Fishing & Pleasure Craft
X X
Traffic Density
X X X
Wind Conditions
X
Visibility Conditions
X X
Tide & River Currents
X X X
Ice Conditions
X X X
Visibility Obstructions
X X X
Channel Width
X X X
Bottom Type
X X X
Waterway Complexity
X X X
Number of People on Waterway
X
Volume of Petroleum Cargoes
X
Vol. of Hazardous Chemical Cargoes
X X
Economic Impacts
Environmental Impacts
X
Health & Safety Impacts
X X
The foregoing table shows which risk factors might be positively affected by each of the national risk mitigation strategies. Note that many of the national risk mitigation strategies (e.g., AIS Carriage, Precision Navigation, and VTS / VTIS) would affect multiple risks.
40
PAWSA Final Report
National Risk Mitigation Strategies by Port
National Risk Mitigation Strategy
Port AIS
Car
riag
e
AW
O R
CP
Boa
ter
Lic
ensi
ng
Bri
dge
Wid
enin
g
Coa
st P
ilot A
ccur
acy
Eva
cuat
ion
Exe
rcis
es
F/V
Insp
ectio
n
Lar
ge P
asse
nger
Shi
ps
LN
G
Port
Sec
urity
Lig
htin
g
Port
Sta
te C
ontr
ol
POR
TS
Prec
isio
n N
avig
atio
n
Rul
es o
f the
Roa
d E
duca
tion
Tan
ker
Reg
ulat
ions
Tug
/ T
owbo
at C
rew
ing
VT
S / V
TIS
Baltimore X X X X X X X X
Berwick Bay X X X X X X X X X X X X X X X X
Boston X X X X X X X X X X X
Charleston X X X X X X X X X X
Cincinnati X X X X X X X X X X
Cook Inlet X
Coos Bay X X X X X X
Corpus Christi X X X X X X X X
Hampton Roads X X X X X X X X X X X X
Honolulu X X X X X X X X X X X X X X
Houston / Galveston X X X X X X X X X X X X X
Lake Charles X X X X X X X X X
Los Angeles / LB X X X X X X X X X X X X X
Lwr Columbia River X X X X X X X
Miami X X X X X X X X X X X X X
Mobile X X X X X X X
Pascagoula X X X X X X X X X X X X
X X X X X X X
Port Arthur X X X X X X X X X X X
Port Everglades X X X X X X X X X X X X X
Port Fourchon X X X X X
Port Lavaca X X X X X X X X X X X X X
Portland, ME X X X X X X X X X X X
San Francisco X X X X X X X X X X X
San Juan X X X X X X X X X X X
Sault Ste. Marie X X X X X X X
Texas C ty i X X X X X X
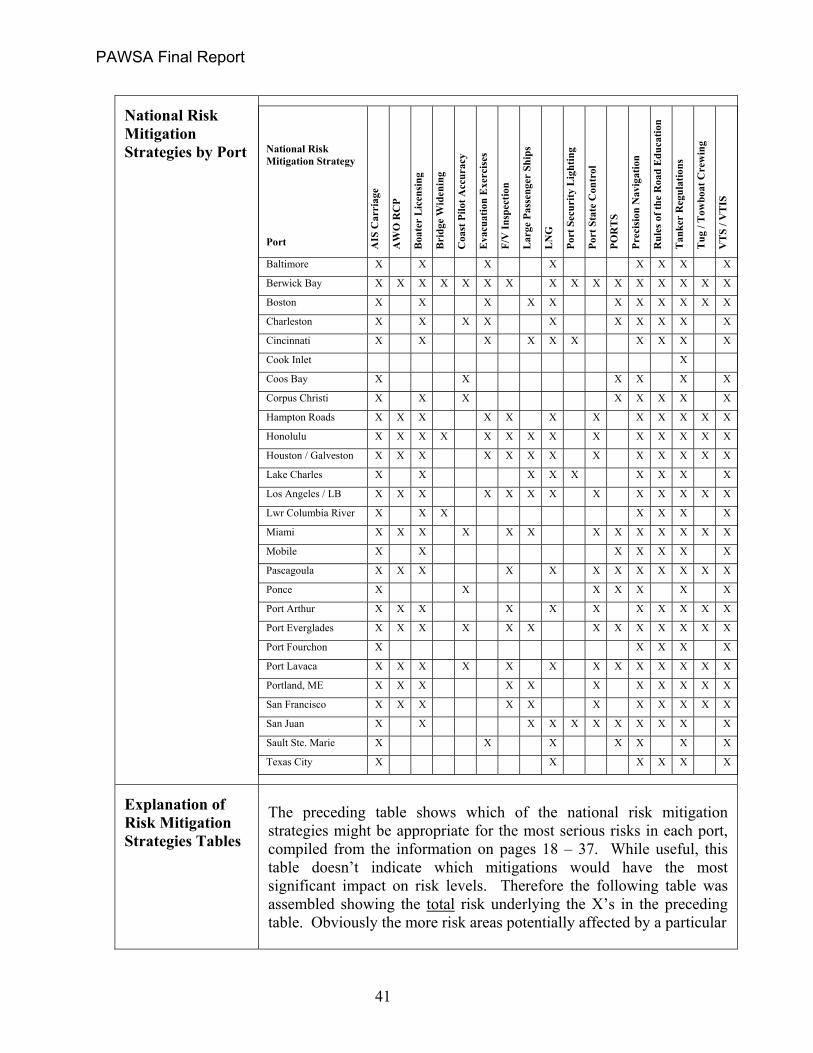
Explanation of Risk Mitigation Strategies Tables
The preceding table shows which of the national risk mitigation strategies might be appropriate for the most serious risks in each port, compiled from the information on pages 18 – 37. While useful, this table doesn’t indicate which mitigations would have the most significant impact on risk levels. Therefore the following table was assembled showing the total risk underlying the X’s in the preceding table. Obviously the more risk areas potentially affected by a particular
Ponce
41

PAWSA Final Report
Explanation of Risk Mitigation Strategies Tables (continued)
intervention (i.e., national risk mitigation strategy) and the higher the risk level for each of those risk areas, the more potential there is to achieve significant risk level reductions through that particular intervention. Eight of the sixteen national risk mitigation strategies only target a single risk factor. The maximum targeted risk level for any of those eight interventions is 9.0 because of the way the PAWSA algorithms were constructed. In order to fit into the report, the following table does not show those eight single-factor interventions.
National Risk Mitigation Strategies by Port (showing potential risk reductions)
National Risk Mitigation Strategy
Port AIS
Car
riag
e
Boa
ter
Lic
ensi
ng
LN
G
Port
Sta
te C
ontr
ol
POR
TS
Prec
isio
n N
avig
atio
n
Rul
es o
f the
Roa
d E
d
Tan
ker
Reg
ulat
ions
VT
S / V
TIS
Baltimore 28.4 10.3 9.3 23.0 16.2 19.5 26.9
Berwick Bay 35.8 12.9 14.4 8.2 17.6 40.9 20.0 29.7 32.3
Boston 29.6 12.0 7.9 12.6 29.8 18.3 22.5 28.2
Charleston 27.9 11.4 12.3 12.1 29.8 17.1 23.1 30.2
Cincinnati 34.7 12.3 13.0 32.8 19.1 19.7 29.1
Cook Inlet 21.5
Coos Bay 26.5 14.1 31.8 14.9 21.6
Corpus Christi 27.0 10.4 11.6 26.9 15.4 21.6 25.5
Hampton Roads 31.0 13.2 8.8 9.4 27.1 19.3 22.0 28.2
Honolulu 35.6 11.1 14.3 9.3 29.3 17.9 28.2 35.0
Houston / Galveston 34.4 11.0 14.2 9.3 28.7 16.8 28.1 34.0
Lake Charles 36.7 10.9 10.6 30.9 18.0 26.9 33.7
Los Angeles / Long Beach 36.0 12.6 12.5 11.8 25.3 19.4 26.1 32.7
Lwr Columbia River 29.2 9.6 30.8 15.4 21.2 26.0
Miami 30.4 14.4 10.3 16.8 35.6 20.8 20.4 32.7
Mobile 30.7 9.6 11.4 26.4 14.4 19.0 28.1
Pascagoula 35.9 12.8 7.0 10.2 12.2 32.5 20.3 24.8 35.2
Ponce 16.6 10.1 14.2 20.5 23.3 16.2
Port Arthur 36.4 9.0 8.1 10.3 28.1 15.7 21.6 36.7
Port Everglades 36.1 13.6 12.2 19.8 38.9 21.8 27.8 37.0
Port Fourchon 26.5 22.6 16.4 20.2 25.4
Port Lavaca 31.5 13.4 11.4 11.3 15.5 31.9 19.5 27.8 31.7 Portland, ME 31.1 11.0 10.3 29.5 16.4 20.0 30.6 San Francisco 31.1 11.0 10.3 29.5 16.4 20.0 30.6 San Juan 36.5 8.3 10.3 12.2 11.9 32.0 15.8 25.5 35.9 Sault Ste. Marie 26.7 6.9 11.8 30.7 15.2 23.7 Texas City 31.8 11.4 26.6 14.4 28.0 33.4
42

PAWSA Final Report
Table Color-Coding Explanation
In the preceding table, ports which already have a VTS or VTIS established are color-coded gold; all cells where the total risk level is greater than 35.0 are color-coded green; those where the risk level is greater than 30.0 are color-coded yellow. The green colored cells correspond to the fifteen port / mitigation strategy combinations with the greatest potential for risk reduction due to a particular intervention. The yellow colored cells correspond to the second set of fifteen. Note that all of the green and yellow cells are in just three intervention areas: AIS Carriage, Precision Navigation, and VTS / VTIS.
Recommended National Actions
Specific recommendations for national level actions appropriate to each risk factor in the Port Risk Model are identified on pages 18 – 37, along with ports which have particularly high risk levels for those factors. A summary of recommended national level mitigation strategies is on pages 38 – 39. Eight of the 16 national level risk mitigation strategies set forth on those pages potentially affect more than one risk factor. Consequently, potential benefits are enhanced by addressing those particular interventions on a priority basis. In particular, establishing requirements for commercial vessel AIS carriage, harmonizing standards and encouraging use of precision navigation equipment, and establishing a VTS or VTIS in certain ports can be particularly effective risk mitigations. Specifics for those particular interventions are set forth in the following three sections.
As the PAWSA process becomes more accepted and widely used by the maritime community, adaptation of the Port Risk Model to other arenas might further enhance the marine transportation system (MTS) initiative. Specifically, G-MWV should demonstrate to G-MP the benefits and ease with which the PAWSA process could be modified to address port security (vulnerability assessments) and mobility risks.
In the spirit of partnering, G-MWV should review the feasibility and cost/benefit of partially or fully funding AIS shore side infrastructure for those ports where there are high risks that could be effectively mitigated by either AIS or Physical Oceanographic Real Time System (PORTS) interventions. Priority for such interventions can be gleaned from the preceding table. Along those same lines, the Coast Guard should continue to support National Oceanographic and Atmospheric Administrations (NOAA) efforts towards obtaining funding for capital and annual operating costs required for installation of PORTS nationwide.
43

PAWSA Final Report
Recommended National Actions (continued)
A recurring theme expressed by session participants during every PAWSA workshop was a strong concern over perceived recreational boater incompetence, particularly with respect to interactions with commercial vessel traffic. There was overwhelming support for requiring that all recreational boaters be licensed and/or required to take boat operation and rules of the road training. Lack of knowledge about Rule 9 was a particularly sore point. Both the quantitative and qualitative data from every session supports the need for changes to current policy and enhancements in public outreach and education. These PAWSA results should be forwarded to the Office of Boating Safety (G-OPB) and the Coast Guard Auxiliary for appropriate action. The Coast Guard, at all organizational levels, should strongly support State efforts along these lines.
District Commanders (m and o) should review PAWSA results for ports within their geographic area of responsibility. Some of the recommendations that were generated by each PAWSA require action at the District level if they are to be successfully implemented. Specifically, several PAWSA workshops identified short range aids to navigation inadequacies, usually focused on background lighting obscuring range lights. PAWSA results may be important supporting documentation for future planning and resource proposals within the District. Recommended priorities beyond District resources should be forwarded to the Commandant for further review. PAWSA also provides the Districts with a tool with which to compare safety risk among ports, useful when prioritizing resource allocation.
With renewed emphasis on using risk based decision support tools, District Commanders should support the continued use of the PAWSA process for periodic re-evaluations of port and waterway risk levels. Re-evaluations will enable the COTP and Districts to measure the effectiveness of risk mitigation measures implemented within their respective areas of responsibility. Based on future findings, financial or other resource adjustments might be made to further address unmitigated risk.
44

PAWSA Final Report
AIS Carriage Intervention Recommendation
Recommendation: Apply domestic carriage requirements for Automatic Identification Systems to all commercial vessels, regardless of length or tonnage. In addition, harmonize domestic and Canadian AIS carriage requirements.
Risk Reduction Benefits: Implementation of AIS carriage requirements has the potential to reduce risk levels for multiple factors:
• Volume of Deep Draft • Volume of Shallow Draft • Traffic Density • Visibility Conditions • Ice Conditions • Visibility Obstructions • Waterway Complexity
Ports Most Benefited: Ports which have a particularly high level of risk for these risk factors are:
Port Total Risk
Lake Charles 36.7
San Juan 36.5
Port Arthur 36.4
Port Everglades 36.1
Los Angeles / Long Beach 36.0
Pascagoula 35.9
Berwick Bay 35.8
Honolulu 35.6
45
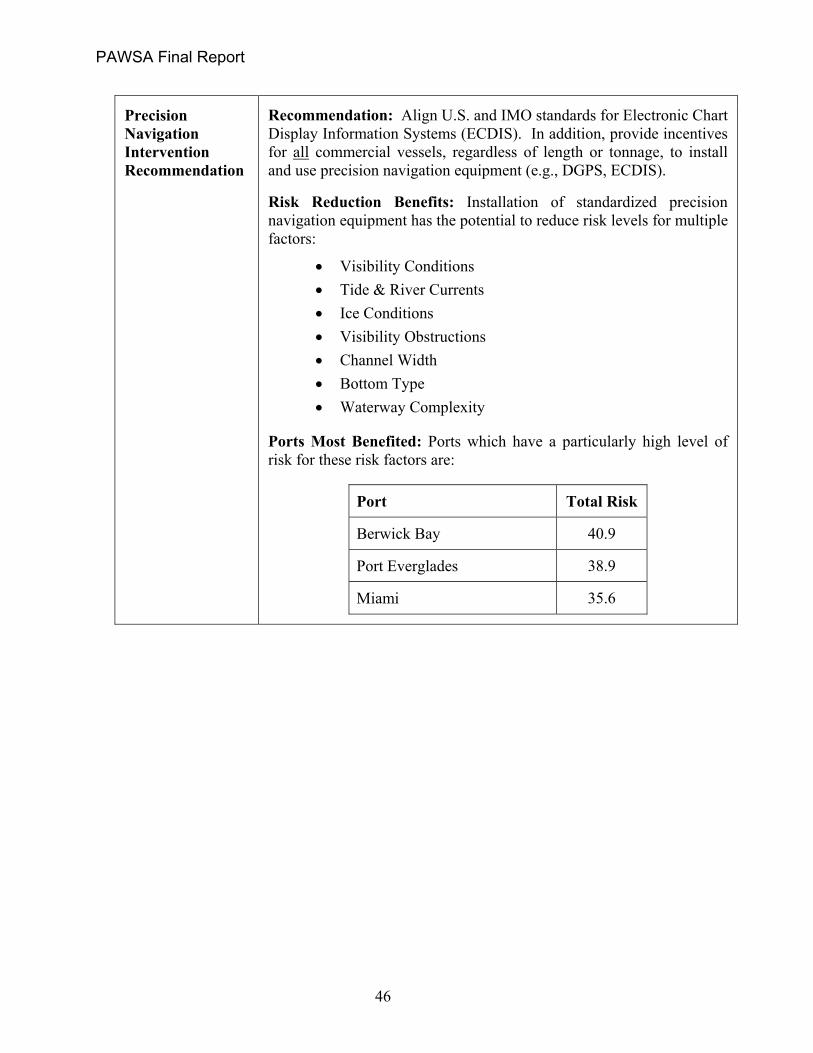
PAWSA Final Report
Precision Navigation Intervention Recommendation
Recommendation: Align U.S. and IMO standards for Electronic Chart Display Information Systems (ECDIS). In addition, provide incentives for all commercial vessels, regardless of length or tonnage, to install and use precision navigation equipment (e.g., DGPS, ECDIS).
Risk Reduction Benefits: Installation of standardized precision navigation equipment has the potential to reduce risk levels for multiple factors:
• Visibility Conditions • Tide & River Currents • Ice Conditions • Visibility Obstructions • Channel Width • Bottom Type • Waterway Complexity
Ports Most Benefited: Ports which have a particularly high level of risk for these risk factors are:
Port Total Risk
Berwick Bay 40.9
Port Everglades 38.9
Miami 35.6
46

PAWSA Final Report
VTS / VTIS Intervention Recommendation
Recommendation: Establish / improve Vessel Traffic Services or Vessel Traffic Information Services. Note: none of the ports listed below has an established VTS or formal VTIS, although the port authorities in Port Everglades, San Juan, and Honolulu already exercise some control over vessel movements in their respective waterways.
Risk Reduction Benefits: Establishing a VTS or VTIS has the potential to reduce risk levels for multiple factors:
• Volume of Deep Draft • Volume of Shallow Draft • Traffic Density • Ice Conditions • Channel Width • Waterway Complexity
Ports Most Benefited: Ports which have a particularly high level of risk for these risk factors are:
Port Total Risk
Port Everglades 37.0
Port Arthur 36.7
San Juan 35.9
Pascagoula 35.2
Honolulu 35.0
47

PAWSA Final Report
48
Conclusion The primary value of the PAWSA process is as a framework for the disciplined and systematic examination of risks. The PAWSA framework serves as foundation for considered thought and stimulus for further action. The time available for each of the initial PAWSA assessments permitted little more than exposure to the methodology, cataloging and rough evaluation of risks, and initial listing of possible mitigation strategies. As originally intended, the PAWSA workshops completed thus far are each a beginning rather than something complete in and of itself. A substantial amount of additional time will be required for each port community to isolate and agree upon specific risk factor causes, identify and prioritize the risks to be addressed, and reach consensus about what is necessary to ameliorate those risks.