ports services – industry profile - latest services – industry profile. 2 ... and is dominant in...
TRANSCRIPT

CENTRE FOR POLICY AND REGULATION
SAMSA
PORTS SERVICES – INDUSTRY PROFILE
2
OVERVIEW OF THE PORTS SERVICES INDUSTRY
South Africa's ports serve as conduits for trade between South Africa and its trading partners in the
Southern African region, but also as hubs for traffic to and from the rest of the world. The bulk of
international trade (approximately 98%) is moved by sea through the eight commercial ports
(Saldanha Bay, Cape Town, Mossel Bay, Port Elizabeth, East London, Ngqura, Durban, and Richards
Bay) of the country. Accordingly, the performance of ports regarding prices, reliability and speed of
cargo handling are crucial to the competitiveness of the country’s (and by extension regional)
international trade.
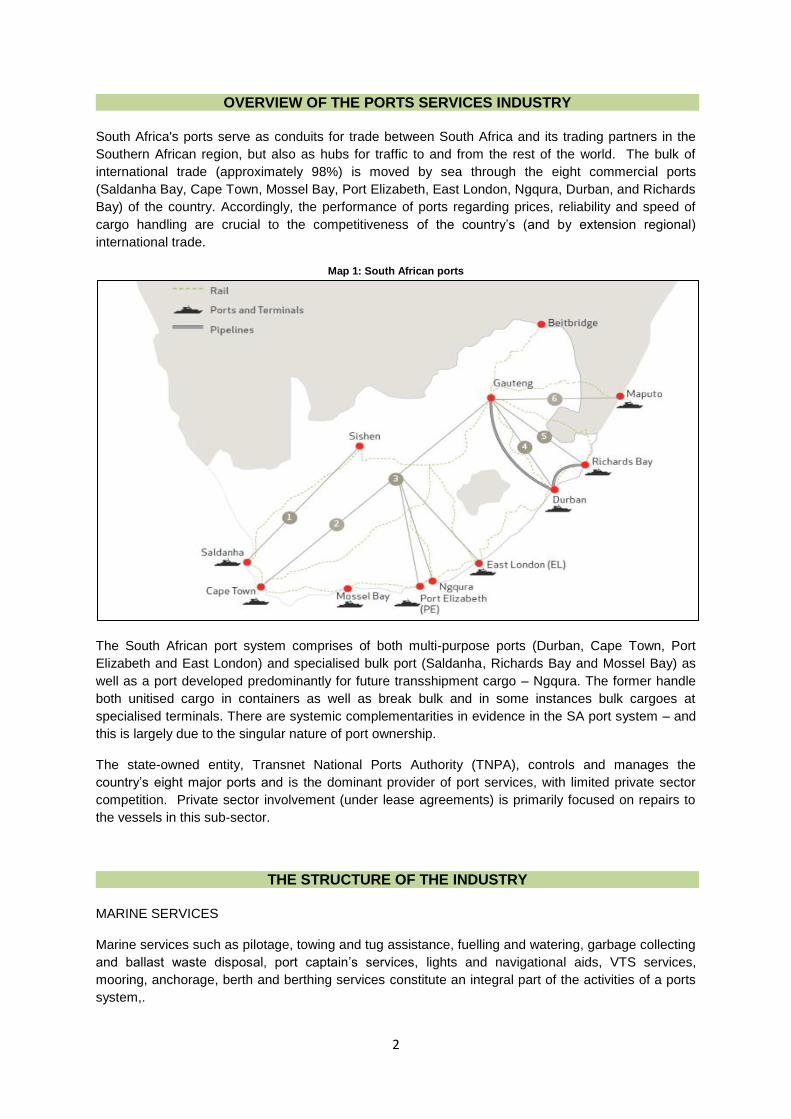
Map 1: South African ports
The South African port system comprises of both multi-purpose ports (Durban, Cape Town, Port
Elizabeth and East London) and specialised bulk port (Saldanha, Richards Bay and Mossel Bay) as
well as a port developed predominantly for future transshipment cargo – Ngqura. The former handle
both unitised cargo in containers as well as break bulk and in some instances bulk cargoes at
specialised terminals. There are systemic complementarities in evidence in the SA port system – and
this is largely due to the singular nature of port ownership.
The state-owned entity, Transnet National Ports Authority (TNPA), controls and manages the
country’s eight major ports and is the dominant provider of port services, with limited private sector
competition. Private sector involvement (under lease agreements) is primarily focused on repairs to
the vessels in this sub-sector.
THE STRUCTURE OF THE INDUSTRY
MARINE SERVICES
Marine services such as pilotage, towing and tug assistance, fuelling and watering, garbage collecting
and ballast waste disposal, port captain’s services, lights and navigational aids, VTS services,
mooring, anchorage, berth and berthing services constitute an integral part of the activities of a ports
system,.

3
The Port Authority is the sole provider of marine services within South African ports.
The provision of port services is characterised by monopolistic practices – high transaction costs and
inefficiencies. For example, total marine and infrastructure costs (including cargo dues) for an
average container vessel offloading or loading at Durban were US$182 151 on 1 April 2010. This is
between 80 per cent and 170 per cent higher than costs at major European ports and ten times more
than those charged by Taiwan’s Kaohsiung port 1
, for example. Part of the reason for the high costs
of port services in South Africa is the funding model used by the NPA, i.e. the end-user pay system in
order to fund infrastructure improvements. Nevertheless, these high costs are not accompanied by
high efficiency. The country’s ports have low container handling speeds and high container vessel
turnaround time as compared to other international ports. For example, in 2008 the Durban container
terminal achieved an average of 23 units of crane moves per hour, compared to 94 and 60 units of
crane moves per hour at Antwerp and Brazil’s Santos port, respectively. Durban also achieved an
average vessel turnaround time of 72 hours as compared to 12 hours of Thailand’s Laem Chabang
port and 24 hours of the US’s Long Beach port2.
Diagram 1: Ports services value chain
Source: UNCTAD, 1995. Strategic Port Pricing. UNCTAD/SDD/PORT/2 21 February 1995, with modifications
CARGO HANDLING SERVICES AND TERMINAL OPERATIONS
Cargo handling services, terminal operations and supporting services such as storage and
warehousing services, customs clearing, container station depot services, maritime agency services,
freight forwarding services are the source of up to two thirds of user expenditure in typical ports and
accounting for the bulk of port-related employment.
The market for these services is characterised by both public and private (including foreign) sector
participation. Transnet Port Terminals, a division of Transnet Limited, has a monopoly in car handling
and is dominant in container and break-bulk cargo handling. Private firms are allowed to rent port
assets from the landlord (National Ports Authority) in order to provide maritime auxiliary services.
1 Ports Regulator of South Africa, Port comparators for selected international ports, Ports Regulator of South
Africa: Durban. 2010 2 ibid
4
Barriers to entry in this market for both domestic and foreign private participation are very low.
Moreover, the auxiliary sector in South Africa is very well developed and the country is already
exporting these services to neighbouring countries.
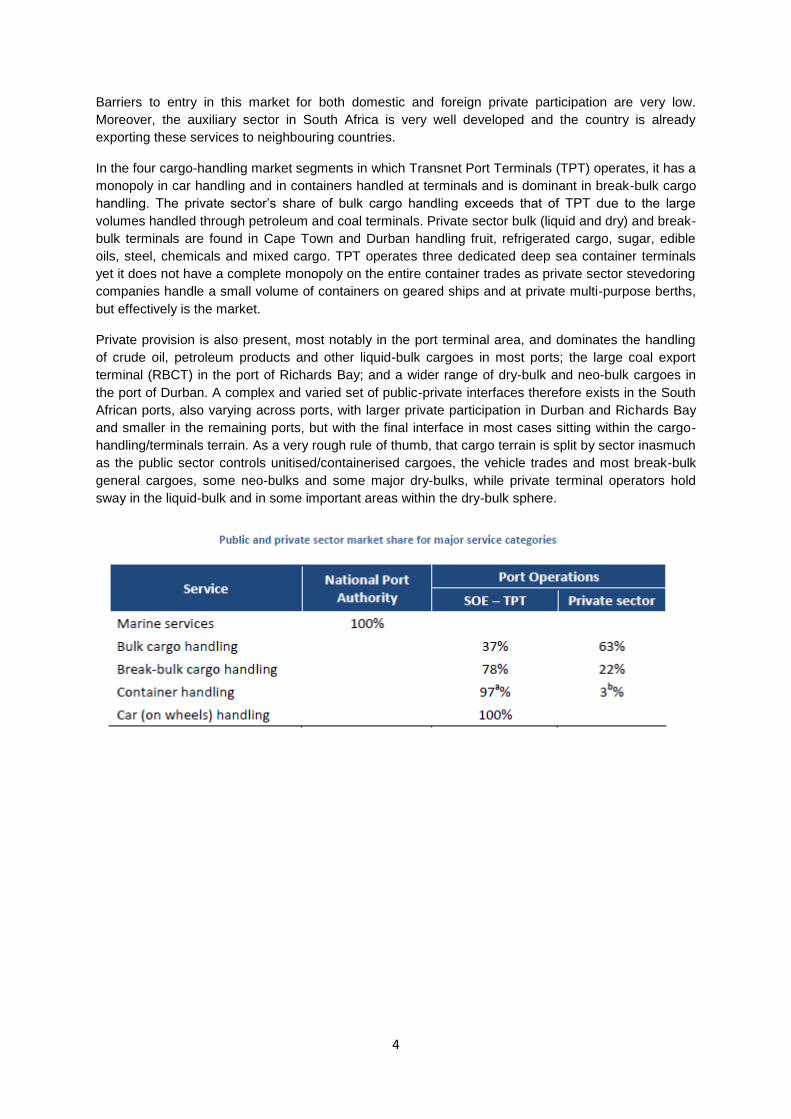
In the four cargo-handling market segments in which Transnet Port Terminals (TPT) operates, it has a
monopoly in car handling and in containers handled at terminals and is dominant in break-bulk cargo
handling. The private sector’s share of bulk cargo handling exceeds that of TPT due to the large
volumes handled through petroleum and coal terminals. Private sector bulk (liquid and dry) and break-
bulk terminals are found in Cape Town and Durban handling fruit, refrigerated cargo, sugar, edible
oils, steel, chemicals and mixed cargo. TPT operates three dedicated deep sea container terminals
yet it does not have a complete monopoly on the entire container trades as private sector stevedoring
companies handle a small volume of containers on geared ships and at private multi-purpose berths,
but effectively is the market.
Private provision is also present, most notably in the port terminal area, and dominates the handling
of crude oil, petroleum products and other liquid-bulk cargoes in most ports; the large coal export
terminal (RBCT) in the port of Richards Bay; and a wider range of dry-bulk and neo-bulk cargoes in
the port of Durban. A complex and varied set of public-private interfaces therefore exists in the South
African ports, also varying across ports, with larger private participation in Durban and Richards Bay
and smaller in the remaining ports, but with the final interface in most cases sitting within the cargo-
handling/terminals terrain. As a very rough rule of thumb, that cargo terrain is split by sector inasmuch
as the public sector controls unitised/containerised cargoes, the vehicle trades and most break-bulk
general cargoes, some neo-bulks and some major dry-bulks, while private terminal operators hold
sway in the liquid-bulk and in some important areas within the dry-bulk sphere.
5
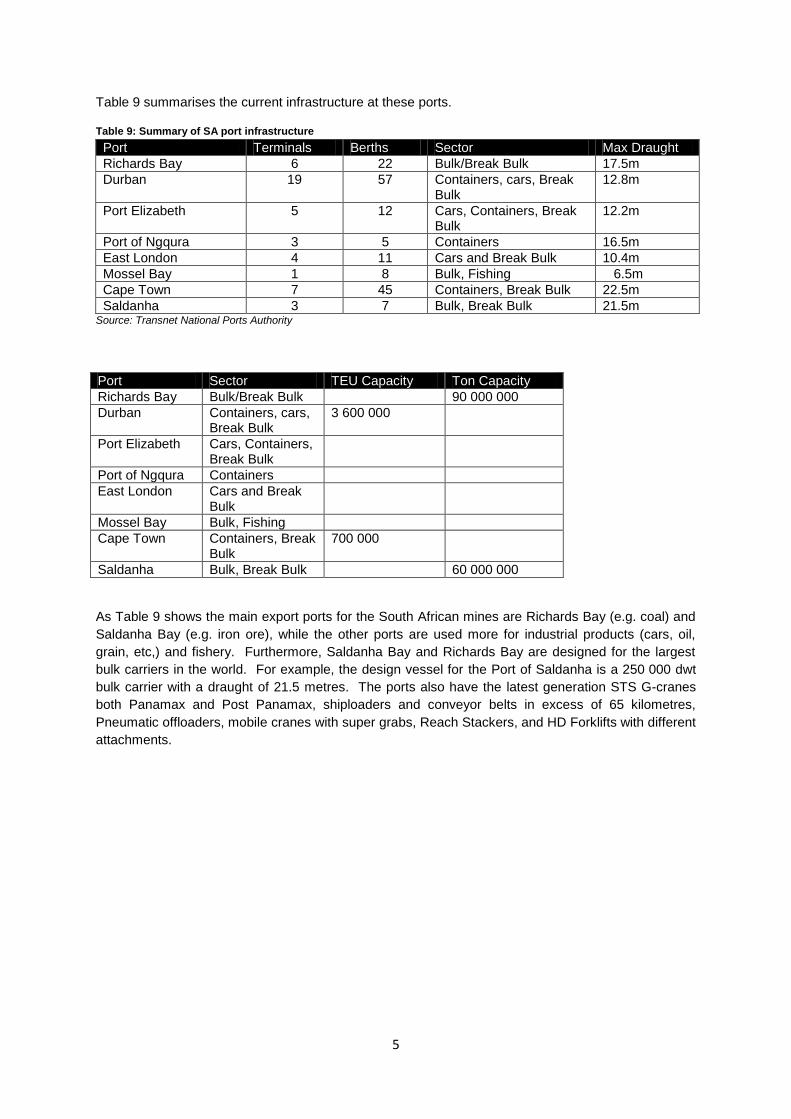
Table 9 summarises the current infrastructure at these ports.
Table 9: Summary of SA port infrastructure
Port Terminals Berths Sector Max Draught
Richards Bay 6 22 Bulk/Break Bulk 17.5m
Durban 19 57 Containers, cars, Break Bulk
12.8m
Port Elizabeth 5 12 Cars, Containers, Break Bulk
12.2m
Port of Ngqura 3 5 Containers 16.5m
East London 4 11 Cars and Break Bulk 10.4m
Mossel Bay 1 8 Bulk, Fishing 6.5m
Cape Town 7 45 Containers, Break Bulk 22.5m
Saldanha 3 7 Bulk, Break Bulk 21.5m Source: Transnet National Ports Authority
Port Sector TEU Capacity Ton Capacity
Richards Bay Bulk/Break Bulk 90 000 000
Durban Containers, cars, Break Bulk
3 600 000
Port Elizabeth Cars, Containers, Break Bulk
Port of Ngqura Containers
East London Cars and Break Bulk
Mossel Bay Bulk, Fishing
Cape Town Containers, Break Bulk
700 000
Saldanha Bulk, Break Bulk 60 000 000
As Table 9 shows the main export ports for the South African mines are Richards Bay (e.g. coal) and
Saldanha Bay (e.g. iron ore), while the other ports are used more for industrial products (cars, oil,
grain, etc,) and fishery. Furthermore, Saldanha Bay and Richards Bay are designed for the largest
bulk carriers in the world. For example, the design vessel for the Port of Saldanha is a 250 000 dwt
bulk carrier with a draught of 21.5 metres. The ports also have the latest generation STS G-cranes
both Panamax and Post Panamax, shiploaders and conveyor belts in excess of 65 kilometres,
Pneumatic offloaders, mobile cranes with super grabs, Reach Stackers, and HD Forklifts with different
attachments.

6
INDUSTRY PERFORMANCE
EMPLOYMENT AND TURNOVER
TRADE
Non-containerised Traffic
South Africa's ports handled 205 million tons of cargo in 2011. Compared to the preceding year, this
represented a growth of 5.42% of cargo handled. Figure 2 also shows that seaborne trade is a
derived demand, i.e. developments in the domestic economy drives developments in seaborne trade.
Therefore, in line with the positive economic growth, SA’s seaborne trade experienced similar
evolution with an upswing in demand in 2010 and 2011, and a positive turnaround in volumes.
Figure 2: SA Economic Growth vs. Seaborne Trade Growth
Source: Transnet National Ports Authority, SARB and African Economic Outlook estimates
Figure 3 shows that non-containerised traffic grew by 2.79% over the past five years. South African
exports grew by 5.87% whilst imports contracted by 1.72% over the same period. The figure further
illustrates that transit traffic has consistently declined from 8.4 million tonnes handled in 2007 to just
800 thousand tonnes handled in 2011 – an average decline of 40.5%. This is a dent on South
Africa’s aspirations to become South-South trade transshipment hub, especially for non-containerised
cargo.
2007 2008 2009 2010 2011
SA Growth Rate 5.5% 3.6% -1.5% 2.9% 3.6%
SA Seaborne Trade 1.8% 1.0% -1.3% 6.5% 5.4%
-2.0%
-1.0%
0.0%
1.0%
2.0%
3.0%
4.0%
5.0%
6.0%
7.0%
An
nu
al
Gro
wth
Rate

7
Figure 3: Non-containerised traffic (2007- 2011)
Source: Transnet National Ports Authority and SAMSA calculations
According to figure 4, the ports of Richards Bay, Durban and Saldanha Bay together accounted for
approximately 92.0% of total cargo handled in South Africa in 2011. Port Elizabeth and Saldanha Bay
experienced a significance increase in cargo handled in 2011 as compared to 2010, registering a
year-on-year growth of 11.49% and 10.98%, respectively.
Figure 4: Non-containerised traffic by ports (2010 vs. 2011)
2010 2011
Source: Transnet National Ports Authority and SAMSA calculations
Container Traffic
Container throughput stood at a combined total of 4.4 million TEUs in 2011. This represented a year-
on-year growth of 9.5% from 2010. Of the total containers handled in 2011, approximately 28% were
empties. Over the past five years container traffic grew on average by 3.72%. During this period
domestic container traffic registered an average decline of 5.56%. This rings alarm bells for the
2007 2008 2009 2010 2011
Total traffic 183.3 185.1 182.7 194.6 205.2
International traffic 168.2 176.0 173.7 186.5 197.5
Domestic traffic 6.7 7.2 6.1 6.8 6.9
Transit traffic 8.4 2.0 2.9 1.3 0.8
0.0
50.0
100.0
150.0
200.0
250.0
mil
lio
n t
on
ne
s
Richards Bay 44%
Durban 21%
East London
1%
PE 3%
Mossel Bay 1%
Cape Town 2%
Saldanha 28%
Richards Bay 42%
Durban 21%
East London
1%
PE 4%
Mossel Bay 1%
Cape Town 2%
Saldanha 29%
8
development of coastal shipping in South Africa and suggests that the country should rather focus its
efforts on regional trade arrangements for the development of this important mode of transport.
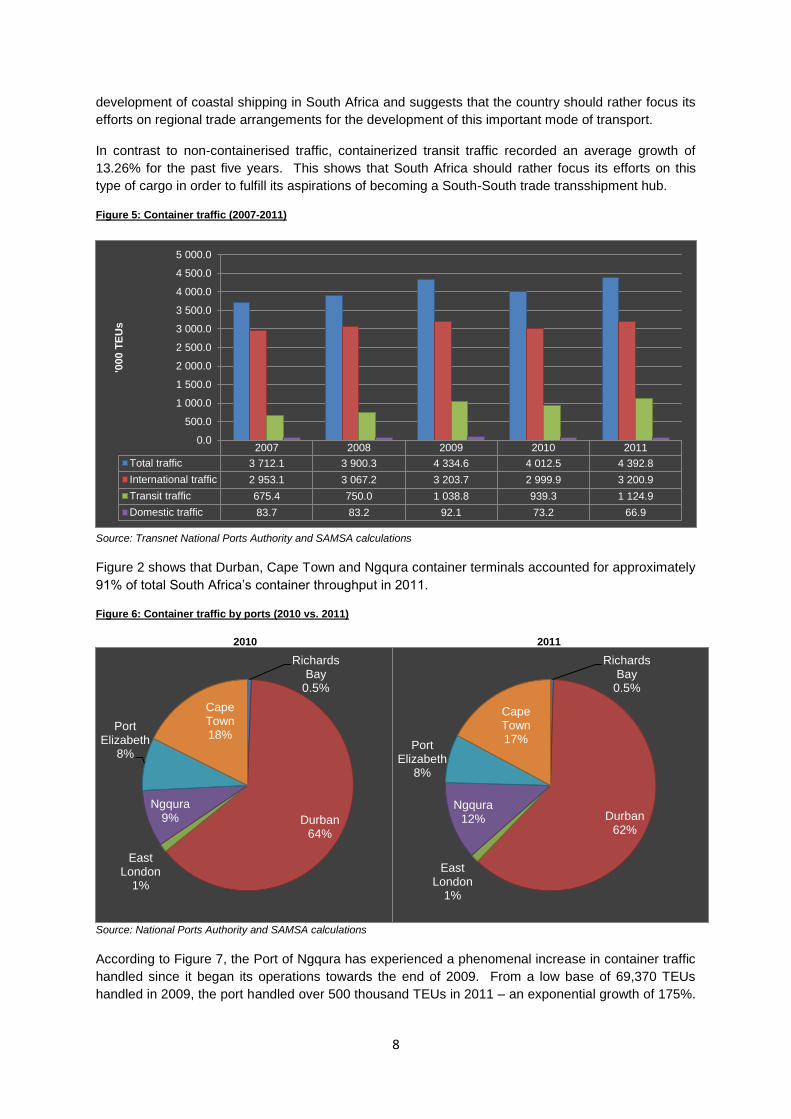
In contrast to non-containerised traffic, containerized transit traffic recorded an average growth of
13.26% for the past five years. This shows that South Africa should rather focus its efforts on this
type of cargo in order to fulfill its aspirations of becoming a South-South trade transshipment hub.
Figure 5: Container traffic (2007-2011)
Source: Transnet National Ports Authority and SAMSA calculations
Figure 2 shows that Durban, Cape Town and Ngqura container terminals accounted for approximately
91% of total South Africa’s container throughput in 2011.
Figure 6: Container traffic by ports (2010 vs. 2011)
2010 2011
Source: National Ports Authority and SAMSA calculations
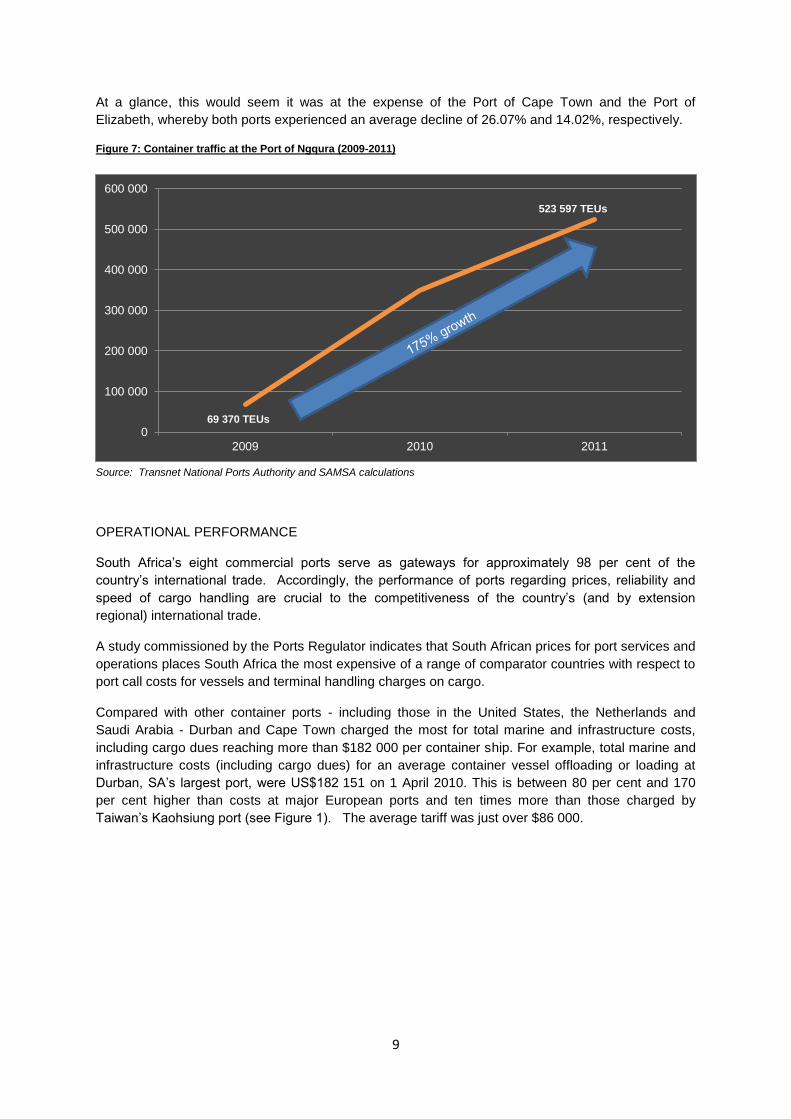
According to Figure 7, the Port of Ngqura has experienced a phenomenal increase in container traffic
handled since it began its operations towards the end of 2009. From a low base of 69,370 TEUs
handled in 2009, the port handled over 500 thousand TEUs in 2011 – an exponential growth of 175%.
2007 2008 2009 2010 2011
Total traffic 3 712.1 3 900.3 4 334.6 4 012.5 4 392.8
International traffic 2 953.1 3 067.2 3 203.7 2 999.9 3 200.9
Transit traffic 675.4 750.0 1 038.8 939.3 1 124.9
Domestic traffic 83.7 83.2 92.1 73.2 66.9
0.0
500.0
1 000.0
1 500.0
2 000.0
2 500.0
3 000.0
3 500.0
4 000.0
4 500.0
5 000.0
'000 T
EU
s
Richards Bay
0.5%
Durban 64%
East London
1%
Ngqura 9%
Port Elizabeth
8%
Cape Town 18%
Richards Bay
0.5%
Durban 62%
East London
1%
Ngqura 12%
Port Elizabeth
8%
Cape Town 17%
9
At a glance, this would seem it was at the expense of the Port of Cape Town and the Port of
Elizabeth, whereby both ports experienced an average decline of 26.07% and 14.02%, respectively.
Figure 7: Container traffic at the Port of Ngqura (2009-2011)
Source: Transnet National Ports Authority and SAMSA calculations
OPERATIONAL PERFORMANCE South Africa’s eight commercial ports serve as gateways for approximately 98 per cent of the
country’s international trade. Accordingly, the performance of ports regarding prices, reliability and
speed of cargo handling are crucial to the competitiveness of the country’s (and by extension
regional) international trade.
A study commissioned by the Ports Regulator indicates that South African prices for port services and
operations places South Africa the most expensive of a range of comparator countries with respect to
port call costs for vessels and terminal handling charges on cargo.
Compared with other container ports - including those in the United States, the Netherlands and
Saudi Arabia - Durban and Cape Town charged the most for total marine and infrastructure costs,
including cargo dues reaching more than $182 000 per container ship. For example, total marine and
infrastructure costs (including cargo dues) for an average container vessel offloading or loading at
Durban, SA’s largest port, were US$182 151 on 1 April 2010. This is between 80 per cent and 170
per cent higher than costs at major European ports and ten times more than those charged by
Taiwan’s Kaohsiung port (see Figure 1). The average tariff was just over $86 000.
0
100 000
200 000
300 000
400 000
500 000
600 000
2009 2010 2011
69 370 TEUs
523 597 TEUs

10
Figure 1: Total Port Authority tariffs for the unitary container vessel (2010)
Source: Ports Regulator of South Africa, Port comparators for selected international ports. Ports Regulator of South Africa:
Durban. 2010
Cargo dues contribute to the high total port costs in South Africa. Figure 2 shows that Durban and
Cape Town’s total port costs excluding cargo dues are relatively moderate when compared to other
international ports. Figure 2 shows that Cape Town’s total port costs excluding cargo dues were
US$24 702 compared to the global average tariff of US$26 427.
Figure 2: Total Port Authority tariffs excluding cargo dues for the unitary container vessel (2010)
Source: Ports Regulator of South Africa, Port comparators for selected international ports, Ports Regulator of South Africa:
Durban. 2010
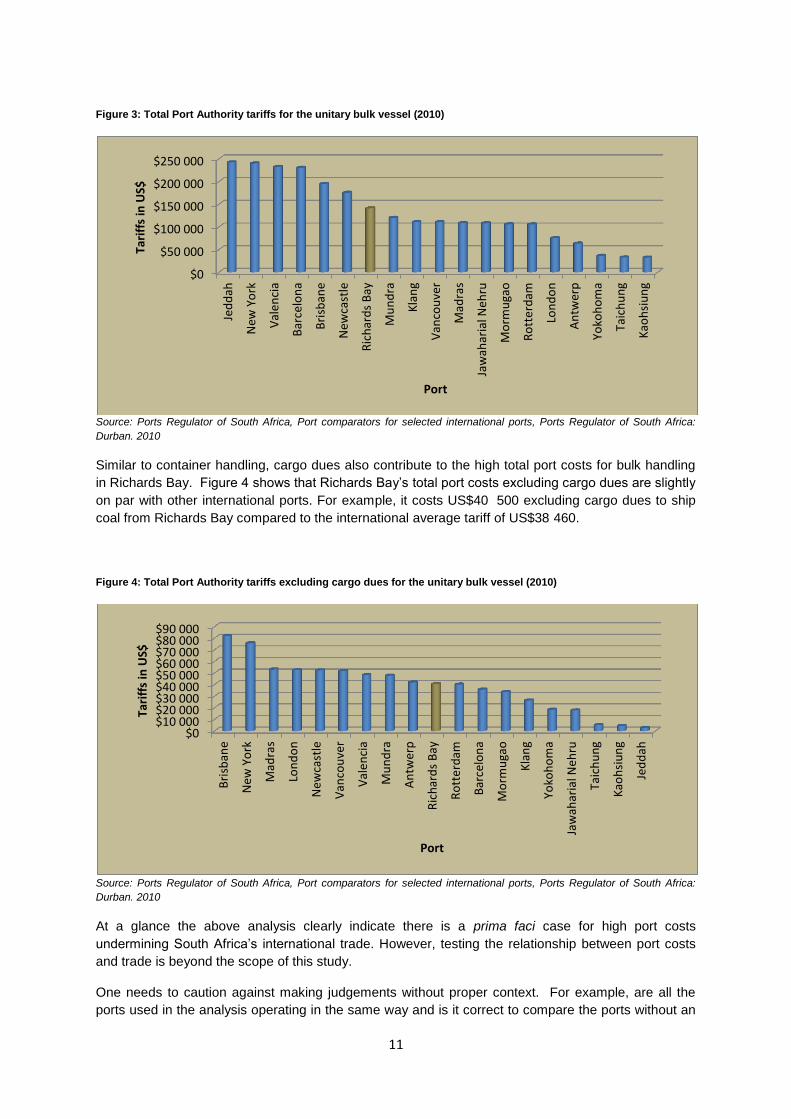
Richards Bay proved similarly expensive when compared with other bulk port terminals. To export
one shipment of coal from Richards Bay cost approximately $141 000 compared with an international
average of approximately $129 000 (see Figure 3).
$0
$50 000
$100 000
$150 000
$200 000
Du
rban
Cap
e T
ow
n
Du
bai
Po
rts
Me
lbo
urn
e
Val
par
aiso
Ho
ust
on
Kla
ng
San
tos
Po
rt L
ou
is
New
Yo
rk
Van
cou
ver
Ro
tte
rdam
Co
lom
bo
Lon
do
n
Kar
ach
i
Co
nst
antz
a
Ch
en
nai
Val
en
cia
Laem
Ch
aban
g
St. P
ete
rsb
urg
Nag
oya
An
twer
p
Kao
hsi
un
g
Joh
or
Sin
gap
ore
Tari
ffs
in U
S$
Port
$0$10 000$20 000$30 000$40 000$50 000$60 000$70 000$80 000$90 000
Val
par
aiso
San
tos
New
Yo
rk
Lon
do
n
Me
lbo
urn
e
Co
nst
antz
a
Ro
tte
rdam
Ho
ust
on
Val
en
cia
St. P
ete
rsb
urg
Kar
ach
i
Du
rban
Van
cou
ver
Ch
en
nai
Po
rt L
ou
is
Cap
e T
ow
n
Nag
oya
An
twer
p
Joh
or
Laem
Ch
aban
g
Kao
hsi
un
g
Co
lom
bo
Kla
ng
Du
bai
Po
rts
Sin
gap
ore
Tari
ffs
in U
S$
Port
11
Figure 3: Total Port Authority tariffs for the unitary bulk vessel (2010)
Source: Ports Regulator of South Africa, Port comparators for selected international ports, Ports Regulator of South Africa:
Durban. 2010
Similar to container handling, cargo dues also contribute to the high total port costs for bulk handling
in Richards Bay. Figure 4 shows that Richards Bay’s total port costs excluding cargo dues are slightly
on par with other international ports. For example, it costs US$40 500 excluding cargo dues to ship
coal from Richards Bay compared to the international average tariff of US$38 460.
Figure 4: Total Port Authority tariffs excluding cargo dues for the unitary bulk vessel (2010)
Source: Ports Regulator of South Africa, Port comparators for selected international ports, Ports Regulator of South Africa:
Durban. 2010
At a glance the above analysis clearly indicate there is a prima faci case for high port costs
undermining South Africa’s international trade. However, testing the relationship between port costs
and trade is beyond the scope of this study.
One needs to caution against making judgements without proper context. For example, are all the
ports used in the analysis operating in the same way and is it correct to compare the ports without an
$0
$50 000
$100 000
$150 000
$200 000
$250 000
Jed
dah
New
Yo
rk
Val
en
cia
Bar
celo
na
Bri
sban
e
New
cast
le
Ric
har
ds
Bay
Mu
nd
ra
Kla
ng
Van
cou
ver
Mad
ras
Jaw
ahar
ial N
ehru
Mo
rmu
gao
Ro
tte
rdam
Lon
do
n
An
twer
p
Yoko
ho
ma
Taic
hu
ng
Kao
hsi
un
g
Tari
ffs
in U
S$
Port
$0$10 000$20 000$30 000$40 000$50 000$60 000$70 000$80 000$90 000
Bri
sban
e
New
Yo
rk
Mad
ras
Lon
do
n
New
cast
le
Van
cou
ver
Val
en
cia
Mu
nd
ra
An
twer
p
Ric
har
ds
Bay
Ro
tte
rdam
Bar
celo
na
Mo
rmu
gao
Kla
ng
Yoko
ho
ma
Jaw
ahar
ial N
ehru
Taic
hu
ng
Kao
hsi
un
g
Jed
dah
Tari
ffs
in U
S$
Port

12
in-depth understanding of the environment of each port? In jurisdictions where port charges and dues
are determined by the budgetary needs of the tier of government that own the ports, price setting
outcomes will differ from South Africa. In this regard it is also important to point out that part of the
reason for the high costs of port services in South Africa is the funding model used by the NPA, i.e.
the end-user pay system in order to fund infrastructure improvements.
LEGAL AND POLICY REGULATORY ENVIRONMENT
POLICY FRAMEWORK
Commercial Ports Policy
South Africa’s Commercial Ports Policy recognises that there is a need to provide South African
importers and exporters with more efficient and higher quality of port services. The policy envisions a
“port system seamlessly integrated in the transport network that is jointly and individually self-
sustainable through the delivery of high levels of service and increasing efficiency for a growing
customer base, enhancing South Africa’s global competitiveness and facilitating the expansion of the
South African economy through socially and environmentally sustainable port development.”
According to the policy, the government, through Transnet, will reduce and phase out its direct
involvement in port operations where feasible. As the landlord, the NPA shall ensure that the
licensees and concessionaires provide adequate, efficient and affordable terminal operations and port
services to all port users. This also implies in a later phase, marine services such as tug services and
berthing services provided by the NPA could also be licensed out.
REGULATORY FRAMEWORK
The National Ports Act, No.12 of 2005 creates a dual role for the NPA whereby it is responsible for
the port regulatory function at the ports - i.e. controlling the provision of port services through licensing
or entering into agreements with port operators.
The National Ports Act also lays down the framework within which the NPA is obliged to operate in
the future. At the time of writing this paper, there was still a debate over whether NPA will remain a
division of Transnet or a separate private entity in the medium to long term. Whether this change will
benefit the maritime transport sector is open to debate – a subject which is beyond the scope of this
paper.
INSTITUTIONAL GOVERNANCE
Ports Regulator of SA
WTO issues
South Africa has not made offers in maritime transport services. The only restrictions which exist
relate to Mode IV services where they are unbound and apply horizontally. This implies that South
Africa retains full freedom to act as it may desire, however, temporary presence for a period of up to
three years is allowed, unless otherwise specified, without requiring compliance with an economic
needs test, of three categories of natural persons providing services. These are services of
salespersons, intra-corporate transferees (executives, managers, specialists and professionals), and
personnel engaged in establishment.
13
SECTOR CHALLENGES
Perceived Inefficiencies
High logistics costs
South Africa is not on the busiest trading routes of the world (the country had a lower Liner Shipping
Connectivity of 32 compared to Egypt and China’s connectivity of 52 and 132, respectively in 2009)3
and geographically the country is distant from its major markets such as the EU, China, US and
Japan. Given the distances to markets, high transport costs (see Table 2) make South Africa’s goods
uncompetitive.
SECTOR OPPORTUNITIES
INDUSTRY ASSOCIATIONS
SA Shippers Council
SKILLS DEVELOPMENT
INDUSTRY CAREERS
Table 6: Career path mapping in the ports services industry
Career Path Level Specialisation Qualifications NQF Level
Years Exp
Strategic Management
Senior Management
Middle Management
Supervisory
Work Group
3 UNCTAD, Review of Maritime Transport, 2009: Report by the UNCTAD Secretariat, United Nations: Geneva.
2010

14
CONTACTS AT SAMSA
Centre for Policy and Regulation
Office: +27 12 366 2600|Fax: +27 12 366 2601
161 Lynwood Road | Cnr Duncan Street and Lynnwood Road | Brooklyn 0181
www.samsa.org.za