portuguese economy may 2010 (2)
TRANSCRIPT
8/9/2019 Portuguese Economy May 2010 (2)
http://slidepdf.com/reader/full/portuguese-economy-may-2010-2 1/57
Economic Research
Portuguese Economy
May 2010
This document was produced with information available up to May 03 , 2010 .

8/9/2019 Portuguese Economy May 2010 (2)
http://slidepdf.com/reader/full/portuguese-economy-may-2010-2 2/57
. 1 .Portuguese Economy April 2010Economic Research
Executive Summary
• Portuguese financial assets have been under pressure in recent months, with a widening in sovereign and credit
spreads, a year-to-date retreat in the PSI-20 stock index and a downgrading of the sovereign rating by S&P, from A+to A-. However, this pressure does not reflect any deterioration in the Portuguese economy’s fundamentals in thisperiod. Instead, it should be mainly seen as a result of a contagion effect from market worries with Greece.
• Portugal is not Greece. Portugal’s public deficit and debt are lower as a percentage of GDP. In 2009, Portugal’s deficitreached 9.4% of GDP, mainly as a result of a decrease in revenues, as the economy face the deepest recession in
several decades. This compares with a reading of close to 14% in Greece. In turn, Portugal’s public debt should reach86% of GDP in 2010, which compares with close to 130% in Greece. This means that the adjustment needed to bringthe deficit closer to 3% of GDP is smaller in Portugal.
• Portugal does not face issues of (lack of) credibility in public finances. Also, it has a favourable track record in deficitreduction efforts. Prior to the global crisis, Portugal had lowered the deficit to 2.8% of GDP, in an environment of
moderate growth. Most importantly, Portugal is not facing any liquidity risks. Around 40% of Government bondfinancing needs (out of a total of around EUR 22 billion) had been fulfilled by the end of April.
• The Government has stepped-up efforts to lower the deficit in 2010. Besides a freeze in civil servants’ nominal wages,it has announced a freeze in public sector hiring, cuts in public investment, reductions in social spending, tax increases
and the introduction of new tolls in highways. Further measures, that have been presented in the Growth and StabilityProgram 2011-2013, should be implemented in the years ahead, in an environment of social and political stability.
• Activity indicators are suggesting an exports-based recovery in 2010-2011. GDP could rise close to 0.6% in 2010(after -2.7% in 2009). We admit some negative short-term risks to this forecast but, going forward, growth should besupported by favourable fundamentals, including the expansion of the economy’s relevant market (ex. to fast growing
economies in Africa and Latin America) and the effects of structural reforms underway (ex. social security, publicadministration, energy, etc.).

8/9/2019 Portuguese Economy May 2010 (2)
http://slidepdf.com/reader/full/portuguese-economy-may-2010-2 3/57
. 2 .Portuguese Economy April 2010Economic Research
1. Background and Main Financial Stabi li ty Data
2. Economic Activity
3. Recent Developments in Publ ic Finances
4. Poli tica l and Social Environment
5. Where Wil l Growth Come From? Rat ionale and
Main Forecasts.

8/9/2019 Portuguese Economy May 2010 (2)
http://slidepdf.com/reader/full/portuguese-economy-may-2010-2 4/57
. 3 .Portuguese Economy April 2010Economic Research
-10
-8
-6
-4
-2
0
2
4
6
8
10
1965 1970 1975 1980 1985 1990 1995 2000 2005 2010
Portugal
Euro Area
Portuguese economy’s business cycles (Gap between actual and potential GDP, as % of potential GDP).
Portugal’s business cycle has been typically aligned w ith Europe’s.
The Portuguese economy has overcome important negative shocks in the
past.
Change of political regime and
return of population from overseasterritories, 1st Oil Shock
2nd Oil Shock
Nominal convergence
with EMU, Global
Recession
Dot combubble burst
Global credit
crisis
Sources: AMECO, ES Research.

8/9/2019 Portuguese Economy May 2010 (2)
http://slidepdf.com/reader/full/portuguese-economy-may-2010-2 5/57
. 4 .Portuguese Economy April 2010Economic Research
Average Interest Rates in Loans to Households and Firms (% ).
Contributions to GDP Grow th from Exports and Fixed Investment (p.p.).
The process of nominal convergence with EMU allowed for an upgrading in Portuguese standards of living from the1990s onwards, mainly through higher household investment in housing. A rapid decline in interest rates led to strongerinvestment spending and to an increase in households’ and firms’ indebtedness levels. In the beginning of the currentdecade, an adjustment of private domestic spending, efforts to reduce the budget deficit and a global recession led to arecession (in 2003). The recovery from that recession was made mainly through stronger exports growth, and notthrough higher consumption or rising house prices.
Convergence w ith EMU gave way to an upgrading in standards of livingfrom 1990s onwards.
-3.0
-2.0
-1.0
0.0
1.0
2.0
3.0
4.0
5.0
1990 1992 1994 1996 1998 2000 2002 2004 2006 2008
0
5
10
15
20
25
1990 1992 1994 1996 1998 2000 2002 2004 2006 2008
%
H o u s e h o l d s
No n F i n a n c i a l Co r p o r a t i o n s
Exports
Fixed Investment
Sources: Bank of Portugal, AMECO, ES Research.

8/9/2019 Portuguese Economy May 2010 (2)
http://slidepdf.com/reader/full/portuguese-economy-may-2010-2 6/57
. 5 .Portuguese Economy April 2010Economic Research
-24.1 -20.7 -19.1 -22.8 -28.4 -27.6 -24.1 -28.8 -30.3 -27.2 -32.3
-14.0 -25.1-34.4
-39.1-34.7 -39.7 -50.0
-56.1-66.4 -76.6
-85.2
5.84.9 4.7 4.8 4.6 4.0 3.3 3.9 3.8 4.3 4.6
-110
-90
-70
-50
-30
-10
10
1999 2000 2001 2002 2003 2004 2005 2006 2007 2008 2009
Direct investment, shares and other equit iy Monetary gold Debt
%
Increase in indebtedness levels should be seen under the light of Portugal’s membership of a larger monetary union, the Euro Area.
Net Externa l L iabi li ties (% GDP). Net Externa l L iabi li ties by Inst rument (% GDP).
The increase in Portugal’s indebtedness levels should be seen as a natural result of Euro Area membership, whichimplied the access to financing at more favourable conditions by an economy in a process of adjustment to a newenvironment. Typically, most of this financing has been intermediated by the banking sector. External investors do notface any 1970s style exchange rate risk and financial inflows benefit from the credibility of Euro Area rules of monetaryand fiscal policy, as well as from the political commitment to build a strong European Union and currency union.
Sources: Bank of Portugal, ES Research.
17.529.2
40.7 43.6 46.0 38.9 37.8 50.7 57.1 45.3 46.015.6
11.9
8.113.7 13.2 25.1 32.4
30.435.3 54.0
65.6
0
20
40
60
80
100
120
1999 2000 2001 2002 2003 2004 2005 2006 2007 2008 2009
Banking Sector Other Sectors
%
33.141.1
48.857.3 59.2
64.070.2
81.1
92.499.3
111.7

8/9/2019 Portuguese Economy May 2010 (2)
http://slidepdf.com/reader/full/portuguese-economy-may-2010-2 7/57
. 6 .Portuguese Economy April 2010Economic Research
0
100
200
300
400
500
600
700
1 9 9 3 1 9 9 4 1 9 9 5 1 9 9 6 1 9 9 7 1 9 9 8 1 9 9 9 2 0 0 0 2 0 0 1 2 0 0 2 2 0 0 3 2 0 0 4 2 0 0 5 2 0 0 6 2 0 0 7 2 0 0 8
2 0 0 9
H 1
I n d e x
-20
-10
0
10
20
30
40%Price index Portugal (lhs)
Price index Spain (lhs)
Nominal change Spain (rhs)
Nominal change Portugal (rhs)
Sources: Confidencial Imobiliário, Bank of Spain.
House Pr ices, Portugal vs. Spain
(1988=100 and % annual nominal change)
Having had its period of stronger expansion in the 1990s, the Portuguese housing market faced the recent globalfinancial crisis in a very different cyclical position from those in economies such as the US, UK, Ireland or Spain. Houseprice growth has been moderate over the last years, essentially reflecting macroeconomic developments andfundamentals. The lack of evidence of overvaluation in house prices mitigates any potential credit risks.
No Spanish-style bubble in house prices.

8/9/2019 Portuguese Economy May 2010 (2)
http://slidepdf.com/reader/full/portuguese-economy-may-2010-2 8/57
. 7 .Portuguese Economy April 2010Economic Research
0
10
20
30
40
50
60
Germany Greece Spain Italy Netherlands Portugal
Q1 Q2 Q3 Q4
%
Households’ Mortgage Debt Service by Income Quartile (% of Disposable Income) Household Financial Indebtedness (% of Disposable Income)
Aggregate household indebtedness has reached slightly above 130% of disposable income (or 95% of GDP). But thishas mainly reflected an increase in the number of households with access to mortgage loans, and not any significantincrease in individual situations of heavy debt burdens. In average, mortgage debt service ratios remain containedacross all income quartiles. Vulnerability to interest changes is higher among lower income households.
-10
10
30
50
70
90
110
130
150
1995 1996 1997 1998 1999 2000 2001 2002 2003 2004 2005 2006 2007 2008 0
1
2
3
4
5
6
7
8Housing indebtedness (left scale)
Consumption indebtebdness (left scale)
Interest payments (right scale)
% %
Source: Bank of Portugal.
Household indebtedness has increased, but debt service remains contained.

8/9/2019 Portuguese Economy May 2010 (2)
http://slidepdf.com/reader/full/portuguese-economy-may-2010-2 9/57
. 8 .Portuguese Economy April 2010Economic Research
887 922 960 997
1034 1072 1097
261 269 273 309 344 369253
0
200
400
600
800
1000
1200
2003 2004 2005 2006 2007 2008 2009
E U R
Average Mo nth ly Earn ings
Average Month ly Mor tgage Paym ent
Sources: Bank of Portugal, INE, Ministry of Labour and Social Security.
Average Labour Monthly Earnings vs. Average Monthly Mortgage Payment (EUR)
Households – Wealth to Debt Ratio (%)
Households’ aggregate debt remains low (close to 25%) as a proportion of total wealth. Lack of significant correctionsin housing valuations should protect the current solidity of households’ wealth condition. Also, the average monthlymortgage payment only represents 23% of gross average labour monthly earnings.
0
100
200
300
400
500
600
2000 2001 2002 2003 2004 2005 2006 2007 2008
Non-Financial Wealth
Financial Wealth
%
Households’ wealth condition is solid.

8/9/2019 Portuguese Economy May 2010 (2)
http://slidepdf.com/reader/full/portuguese-economy-may-2010-2 10/57
. 9 .Portuguese Economy April 2010Economic Research
Sources: Confidencial Imobiliário, INE.
Average Mortgage Loan Rate (%)
Index of Housing Affordability (Ratio of household nominal disposable income to
the nominal house price index, 2000=100)
Housing affordability, as measured by the ratio of household nominal disposable income to the nominal house priceindex, has remained relatively stable and supported over the last years (in contrast with the euro area average, whereit has declined more visibly until 2007, improving slightly after that). This has mainly resulted from a combinationbetween low interest rates (benefiting disposable income) and moderate house price growth.
0.0
1.0
2.0
3.0
4.0
5.0
6.0
7.0
Nov.
2003
Mai.
2004
Nov.
2004
Mai.
2005
Nov.
2005
Mai.
2006
Nov.
2006
Mai.
2007
Nov.
2007
Mai.
2008
Nov.
2008
Mai.
2009
Nov.
2009
%
90
95
100
105
110
115
120
125
2003 2004 2005 2006 2007 2008 2009
Moderate price growth and low interest rates support housing affordability.

8/9/2019 Portuguese Economy May 2010 (2)
http://slidepdf.com/reader/full/portuguese-economy-may-2010-2 11/57
. 10 .Portuguese Economy April 2010Economic Research
0
20
40
60
80
100
120
S p a i n
I r e l a n d
G r e e c e
B e l g i u m
G e r m a n y
F r a n c e
I t a l y
N e t h e r l a n d s
P o r t u g a l
F i n l a n d
M a l t
C y p r u s
S l o v e n i a
L u
x e m b u r g
A u s t r i a
E u r o Z o n e
%
0
10
20
30
40
50
60
70
80
90
B e l g i u m
G e r m a n y
I r e l a n d
G r e e c e
S p a i n
F r a n c e
I t a l y
C y p r u s
L u x e m b o u r g
M a l t a
N e t h e r l a n d s
A u s t r i a
P o r t u g a l
S l o v e n i a
F i n l a n d
O
w n e r O c c u p a t i o n r a t e
0
500
1 000
1 500
2 000
2 500
3 000
3 500
4 000
4 500
2000 2001 2002 2003 2004 2005 2006 2007 2008
25
30
35
40
45
50
55
60
Number of contracts (rhs)
EUR mil l ion ( lhs)
0
1
2
3
4
5
6
1991 1996 2001 2006 2007
Sources: DGT, Bank of Portugal, INE, ECB.
Number of Dwellings (Million) Owner-Occupation Ratio (%)
Mortgage Production Loan-to-Value Ratio (%)
Relatively high ow ner-occupation ratio, relatively low LTVs.

8/9/2019 Portuguese Economy May 2010 (2)
http://slidepdf.com/reader/full/portuguese-economy-may-2010-2 12/57
. 11 .Portuguese Economy April 2010Economic Research
1. Background and Main Financial Stabi li ty Data
2. Economic Activity
3. Recent Developments in Publ ic Finances
4. Poli tica l and Social Environment
5. Where Wil l Growth Come From? Rat ionale andMain Forecasts.

8/9/2019 Portuguese Economy May 2010 (2)
http://slidepdf.com/reader/full/portuguese-economy-may-2010-2 13/57
. 12 .Portuguese Economy April 2010Economic Research
-4.0
-3.0
-2.0
-1.0
0.01.0
2.0
3.0
4.0
5.0
2000 2001 2002 2003 2004 2005 2006 2007 2008 2009 2010
%
Q-o-Q
Y-o-Y
Gradual and moderate recovery under way since 2Q 2009.
GDP and Components (% , y-o-y).
GDP and Components (% , q-o-q).
GDP growth (% , q-o-q and y-o-y).
• Portugal was one of the first EU economies to postpositive GDP growth rates (q-o-q) in 2009, as early as
the 2nd quarter. And in 2009 as a whole, its growthperformance was much less unfavourable than the onesfrom its main partners in the EU, with GDP falling by2.7%, which compares with readings of -3.6% in Spain,-5.0% in Germany, -8% in Ireland and -4.5% in the UK.
• This comes from the fact that Portugal was neitheraffected by negative wealth effects related to housingsector corrections, nor by financial sector instability, inthe way other economies were.
Source: INE.
Year Quarter PrivateConsumption
PublicConsumption
Investment Exports Imports GDP
1Q 0.5 0.1 3.1 4.7 3.8 1.0
2Q 0.7 0.2 0.1 0.3 0.7 0.3
3Q -0.1 0.2 4.5 0.0 2.4 -0.12007
4Q 0.8 0.1 0.9 0.8 1.2 0.5
1Q 0.8 0.1 -0.4 2.9 2.9 0.1
2Q -0.3 0.2 -0.4 -1.6 -2.2 0.23Q 1.0 0.4 -0.2 -1.2 1.4 -0.5
2008
4Q -0.3 1.2 -6.1 -8.8 -6.4 -1.7
1Q -1.7 1.9 -7.9 -8.4 -7.7 -1.9
2Q 0.2 -0.7 -4.1 2.7 -1.5 0.6
3Q 0.8 1.7 9.1 5.2 9.3 0.52009
4Q 0.9 0.7 -5.5 -0.4 -0.9 -0.2
Year QuarterPrivate
Consumption
Public
ConsumptionInvestment Exports Imports GDP
1Q 1.4 -1.0 -2.0 10.6 3.8 2.1
2Q 1.8 -0.1 1.5 8.4 5.7 1.9
3Q 1.5 0.5 5.6 6.5 6.7 1.72007
4Q 1.9 0.7 8.7 5.8 8.4 1.81Q 2.3 0.7 5.1 3.9 7.5 0.9
2Q 1.2 0.7 4.6 2.1 4.5 0.7
3Q 2.2 0.9 -0.1 0.9 3.4 0.42008
4Q 1.1 1.9 -7.1 -8.8 -4.4 -1.8
1Q -1.4 3.7 -14.1 -18.8 -14.3 -3.8
2Q -0.9 2.7 -17.3 -15.3 -13.7 -3.4
3Q -1.0 4.0 -9.6 -9.8 -7.0 -2.5
2009
4Q 0.2 3.5 -9.0 -1.4 -1.5 -1.0
Forecast 1Q 2010

8/9/2019 Portuguese Economy May 2010 (2)
http://slidepdf.com/reader/full/portuguese-economy-may-2010-2 14/57
. 13 .Portuguese Economy April 2010Economic Research
-4
-2
0
2
4
6
8
10
1990 1992 1994 1996 1998 2000 2002 2004 2006 2008 2010
%
Coincident indicator of
activity
GDP
-30
-25
-20
-15
-10-5
0
5
10
15
20
2006 2007 2008 2009 2010
%
7.5%
Exports-based recovery under way, w ith a favourable impact on industrialactivity.
Coincident indicator of economic act iv i ty vs. GDP (% , y-o-y). Expor ts y-o-y growth (nominal change, 3MM A, % ).
Effect ive exchange rate index (% , y-o-y)*.
Exports order books (net balances) vs.Industrial production (% , y-o-y).
Sources: INE, Bank of Portugal, European Commission. * Avarege between the exchange rates of Portugal’s main trade partners; the real index is adjusted by the inflation differential.
Appreciation
Depreciation

8/9/2019 Portuguese Economy May 2010 (2)
http://slidepdf.com/reader/full/portuguese-economy-may-2010-2 15/57
. 14 .Portuguese Economy April 2010Economic Research
-3-2-101234
5678
1990 1992 1994 1996 1998 2000 2002 2004 2006 2008 2010
%
Recent indicators also suggest a stabil isation trend in domestic demand.
Demand expectations in manufacturing and services (net balances).
Machinery and equipment – imports and domestic sales (% , y-o-y, 3-month MA).
Cement and commercial vehicle sales (y-o-y, % ).
Coincident indicator of private consumption (% , y-o-y).
Sources: INE, Bank of Portugal, European Commission.

8/9/2019 Portuguese Economy May 2010 (2)
http://slidepdf.com/reader/full/portuguese-economy-may-2010-2 16/57
. 15 .Portuguese Economy April 2010Economic Research
Source: Bank of Portugal.
Non-Performing Loans (% of total)
Household Loan Growth (%, y-o-y)
Mortgage loans decelerated gradually, from the high growth rates of the 1990s and, more recently, reflecting theimpact of the global financial crisis. Recent data shows a stabilisation – or slight increase – in y-o-y growth rates, atclose to 3%. Non-performing mortgage loans have increased recently, as economic activity declined in 2H2008-1H2009 and unemployment increased, but they remained well contained, below 2% of total mortgage loans.Consumption non-performing loans have shown a more visible increase, but they represent a small share of totalhousehold loans (around 20%).
Mortgage loan growth has stabil ised. Housing NPLs remain contained.
-5
05
10
15
20
25
30
35
40
1999 2000 2001 2002 2003 2004 2005 2006 2007 2008 2009 2010
%
Mor tgage
Consumpt ion2. 92. 3
P e r c e n t

8/9/2019 Portuguese Economy May 2010 (2)
http://slidepdf.com/reader/full/portuguese-economy-may-2010-2 17/57
. 16 .Portuguese Economy April 2010Economic Research
Unemployment rate (% of labour force). Households’ savings rate (% of disposable income).
Higher unemployment and higher households’ savings rate.
Unemployment has increased to 10.1% of the labour force in 4Q 2009 (annual average of 9.5% in 2009), as a resultof the retreat in GDP. The unemployment rate should increase a little further in 2010, stabilising by year-end andstarting to decline in 2011, as activity growth gradually strengthens.Household savings have increased to 8.8% of disposable income, benefiting from a higher disposable income and an
increased sense of precaution on the part of individuals.
3.5
4.5
5.5
6.5
7.5
8.5
9.5
10.5
1 9 9 7
1 9 9 8
1 9 9 9
2 0 0 0
2 0 0 1
2 0 0 2
2 0 0 3
2 0 0 4
2 0 0 5
2 0 0 6
2 0 0 7
2 0 0 8
2 0 0 9
10.1%
Source: INE.
4
5
6
7
8
9
10
11
12
2000 2001 2002 2003 2004 2005 2006 2007 2008 2009
8.8%
%

8/9/2019 Portuguese Economy May 2010 (2)
http://slidepdf.com/reader/full/portuguese-economy-may-2010-2 18/57
. 17 .Portuguese Economy April 2010Economic Research
92 97 95 99 96 96 97 101 110
1011 12 11 12 16 18
21
24
98 7 8 8
8 88
6
0
20
40
60
80
100
120
140
160
2000 2001 2002 2003 2004 2005 2006 2007 2008
Loans Securities Other
140
116118114116111
120 123130
Decelerating but resilient corporate loan grow th.
Non-Financial Corporations’ Indebtedness
(% of GDP)
Loans to Non-Financial Corporations (% , y-o-y). Corporate Overdue Loans Ratio (% of Total).
Corporate indebtedness has also increased following
EMU membership. Non-financial corporation’sindebtedness has reached 140% of GDP in 2008. Bank loans are the biggest part of corporate indebtedness,followed by the issue of debt securities.
Loan growth has been decelerating since 2008, as a
result of lower investment, but have shown resiliencein the face of the recent recession. A future recoveryin loan growth should be associated withinternationalisation efforts of firms. Overdue loanshave increased, but remain contained as a percentageof total corporate loans.
Source: Bank of Portugal..
0
5
10
15
20
25
30
35
1999 2000 2001 2002 2003 2004 2005 2006 2007 2008 2009 2010
%
1. 6
8/9/2019 Portuguese Economy May 2010 (2)
http://slidepdf.com/reader/full/portuguese-economy-may-2010-2 19/57
. 18 .Portuguese Economy April 2010Economic Research
1. Background and Main Financial Stabi li ty Data
2. Economic Activity
3. Recent Developments in Publ ic Finances
4. Poli tica l and Social Environment
5. Where Wil l Growth Come From? Rat ionale andMain Forecasts.

8/9/2019 Portuguese Economy May 2010 (2)
http://slidepdf.com/reader/full/portuguese-economy-may-2010-2 20/57
. 19 .Portuguese Economy April 2010Economic Research
Portugal suffered the negat ive impact of the “Greece effect”.
10-year Government Bond spread vs. Germany (bps). 5-year Sovereign CDS Spreads (bps).
Following a sharp deterioration in Greece’s public accounts in the context of high global risk aversion, financial assets inthe Euro Area’s periphery were put under pressure, as a result of market speculation. Portugal has suffered thecontagion effect of market worries with Greece. The widening in spreads has not resulted from any deterioration in
Portuguese economy’s fundamentals.
Source: Bloomberg. NOTE: Data from April 29h.
0
100
200
300
400
500
600
700
Jun. 2009 Ago. 2009 Out. 2009 Dez. 2009 Fev. 2010 Abr. 2010
B a s i s P o i n t s
Grécia
IrlandaPortugal
Espanha
102
209
206
568
97
Itál ia
0
100
200
300
400
500
600
700
800
900
Jan.
2008
Abr.
2008
Jul.
2008
Out.
2008
Jan.
2009
Abr.
2009
Jul.
2009
Out.
2009
Jan.
2010
Abr.
2010
B a s i s P o i n t s
Ireland
Greece
Portugal
Italy
Spain
183
673
282
153137
8/9/2019 Portuguese Economy May 2010 (2)
http://slidepdf.com/reader/full/portuguese-economy-may-2010-2 21/57
. 20 .Portuguese Economy April 2010Economic Research
0
2
4
6
8
10
12
14
I r e l a n d
G
r e e c e U K
S p a i n
P o
r t u g a l
L a t v i a
L i t h
u a n i a
R o m a n i a
F
r a n c e
P
o l a n d
S l o
v a k i a
C
y p r u s
B e
l g i u m
C z e c h
R e p .
S l o
v e n i a
I t a l y
N e t h e r l a n d s
H u
n g a r y
B u
l g a r i a
M a l t a
A
u s t r i a
G e r m a n y
D e n m a r k
F i n l a n d
E s t o n i a
L u x e m
b o u r
S w
e d e n
% o
f G D P
0
20
40
60
80
100
120
I t a l y
G r e e c e
B e l g i u m
H u n g a r y
F r a n c e
P o r t u g a l
G e r m a n y
U K
M a l t a
A u s t r i a
I r e l a n d
N e t h e r l a
C y p r u s
S p a i n
P o l a n d
F i n l a n d
S w e d e n
D e n m a r k
L a t v i a
S l o v e n i a
S l o v a k i a
C z e c h
L i t h u a n i a
R o m a n i a
B u l g a r i a
L u x e m b o
E s t o n i a
% o f G D P
2.8 2.93.4
6.1
3.9
2.6 2.8
9.4
8.3
0.0
1.0
2.0
3.0
4.0
5.06.0
7.0
8.0
9.0
10.0
2002 2003 2004 2005 2006 2007 2008 2009 2010
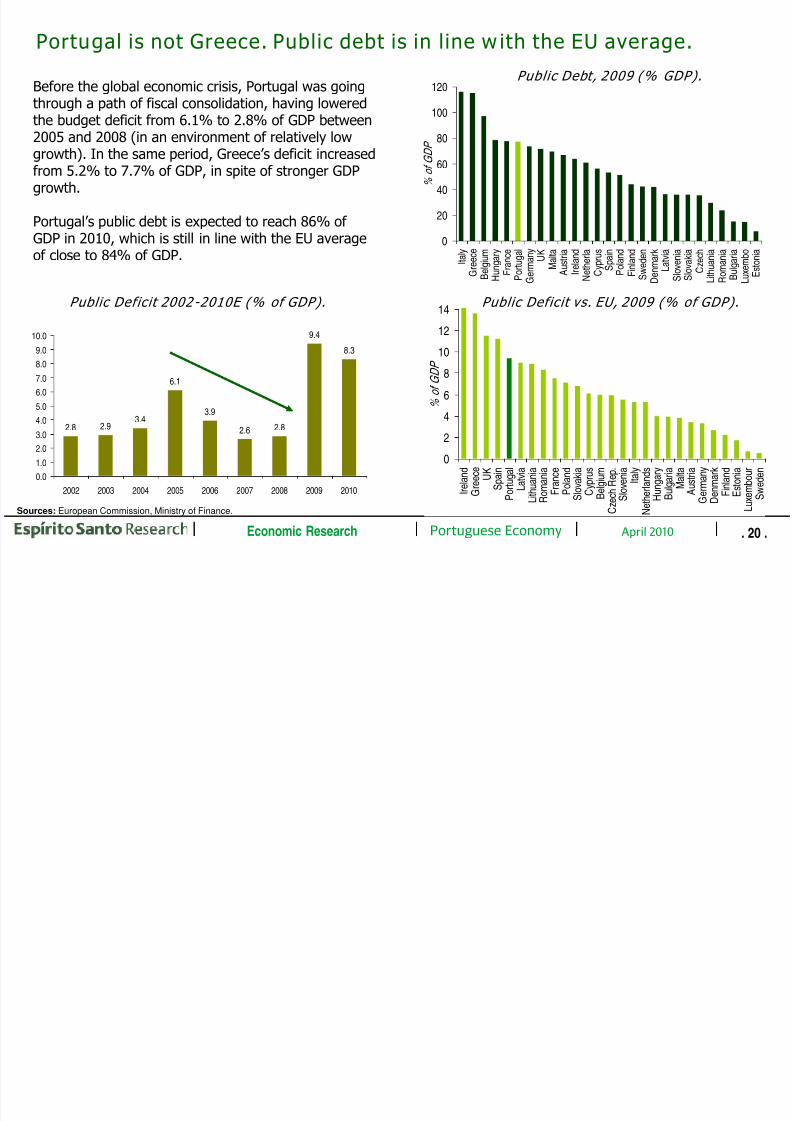
Portugal is not Greece. Public debt is in line w ith the EU average.
Public Deficit 2002-2010E (% of GDP). Public Deficit vs. EU, 2009 (% of GDP).
Before the global economic crisis, Portugal was going
through a path of fiscal consolidation, having loweredthe budget deficit from 6.1% to 2.8% of GDP between2005 and 2008 (in an environment of relatively lowgrowth). In the same period, Greece’s deficit increasedfrom 5.2% to 7.7% of GDP, in spite of stronger GDPgrowth.
Portugal’s public debt is expected to reach 86% of GDP in 2010, which is still in line with the EU averageof close to 84% of GDP.
Sources: European Commission, Ministry of Finance.
Public Debt, 2009 (% GDP).
8/9/2019 Portuguese Economy May 2010 (2)
http://slidepdf.com/reader/full/portuguese-economy-may-2010-2 22/57
. 21 .Portuguese Economy April 2010Economic Research
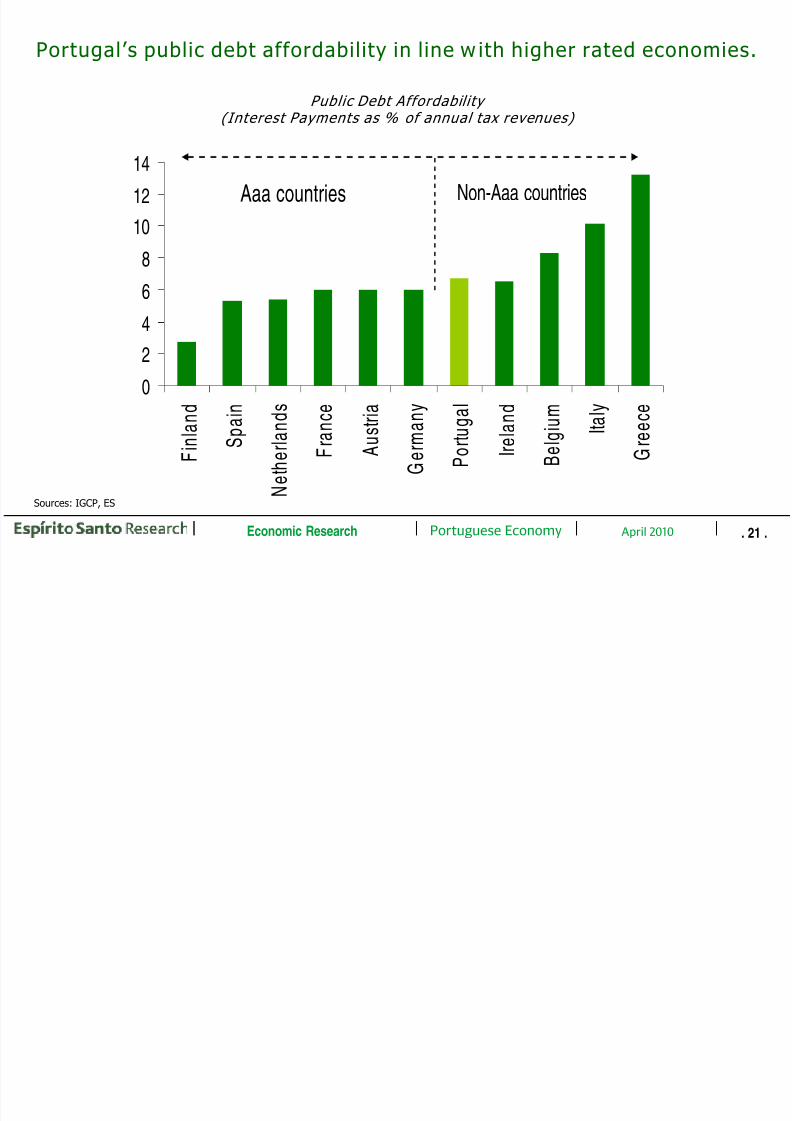
Portugal’s public debt affordability in line w ith higher rated economies.
Sources: IGCP, ES Research.
Public Debt Affordability (Interest Payments as % of annual tax revenues)
0
2
46
8
1012
14
F i n l a n d
S p a i n
N
e t h e r l a n d s
F r a n c e
A u s t r i a
G e r m a n y
P o r t u g a l
I r e l a n d
B e l g i u m
I t a l y
G r e e c e
Aaa countries Non-Aaa countries

8/9/2019 Portuguese Economy May 2010 (2)
http://slidepdf.com/reader/full/portuguese-economy-may-2010-2 23/57
. 22 .Portuguese Economy April 2010Economic Research
0
2
4
6
8
10
12
14
16
L u x e m b o u r g
G r e e c e
C y p r u s
S l o v e n i a
I r e l a n d
N e t h e r l a n d s
S p a i n
M a l t a
B e l g i u m
F i n l a n d
R o m a n i a
G e r m a n y
E u r o A r e a
C z e c h R e p .
A u s t r i a
U K
E U
L i t h u a n i a
S l o v a k i a
H u n g a r y
I t a l y
S w e d e n
P o r t u g a l
F r a n c e
B u l g a r i a
L a t v i a
D e n m a r k
P o l a n d
E s t o n i a
02468
1012141618
G r e e c e
N e t h e r l a n d s
I r e l a n d
S p a i n
B e l g i u m
F i n l a n d
S l o v a k i a
E u r o A r e a
G e r m a n y
U K
E U
2 7
A u s t r i a
P o r t u g a l
F r a n c e
I t a l y
Adjustments in social security rules have improved public debtsustainability.
Estimated increase in age-related expenditure (2010-2060, % GDP).
Average 2011-2015 primary balance required to achieve long term public debt sustainability (1 )
(% GDP).
According to European Commission estimates, Portugal will face an increase in ageing-related expenditure equivalent to2.9% of GDP in the period 2010-2060, which compares with a Euro Area average of 5.1% (with 16% in Greece, 8.3% inSpain and 5.1% in Germany, for example). This is the result of recent changes in social security rules, including theincrease in the retirement age of civil servants and the introduction of a “sustainability coefficient” in determining
pensions, and has improved the long term sustainability of Portugal’s public debt.
Source: European Commission. (1) Public debt ratio of 60% of GDP.

8/9/2019 Portuguese Economy May 2010 (2)
http://slidepdf.com/reader/full/portuguese-economy-may-2010-2 24/57
. 23 .Portuguese Economy April 2010Economic Research
0
500
1000
1500
2000
2500
3000
3500
Jan 13th Feb 10th Feb 24th Mar 10th Mar 18th Apr 14th Apr 14th
Estimated 2010 Bond Financing NeedsEUR 22 billion (of which one EUR 5.6 billion repayment in May)
YTD Bond IssuesEUR 9 billion
(2.0)
(4.3)
(1.8) (1.6)(2.5)
(1.6)(n.a.)
1000
3000
1000 990 8051195USD
1250
2010 Government Bond issues (Jan-Apr), EUR mil lion.
Source: IGCP.
( ) Bid-to-Cover Ratio
Public financing needs are being fulfil led w ith no particular stress.
By April, Portugal had fulfilled around 40% of 2010’s Government Bond financing needs.
Po t gal hasn’t been facing an liq idit isk

8/9/2019 Portuguese Economy May 2010 (2)
http://slidepdf.com/reader/full/portuguese-economy-may-2010-2 25/57
. 24 .Portuguese Economy April 2010Economic Research
2010 Publ ic Debt Issues
Portugal hasn’t been facing any liquidity risk.
Sources: IGCP, Bloomberg.1. Furthermore, there was also (on March 18th) a 5-year debt issue in USD, of USD 1.25 billion, with a 97 bps vs. mid-swap spread.
Bid-to-Cover
Auction Date Amount (EUR Million) Term Ratio Yield (%) Spread
Government Bonds 1
OT 4.95% 25 Oct 2023 Jan 13th 1000 13 years 2.0 4.416 83 bps vs. mid-swap
OT 4.8% 15 Jun 2020 Feb 10th 3000 10 years 4.3 4.823 140 bps vs. mid-swap
OT 3.35% 15 Oct 2015 Feb 24th 1000 5 years 1.8 3.498 105 bps vs. mid-swap
OT 3.85% 15 Apr 2021 Mar 10th 990 11 years 1.6 4.171 73 bps vs. mid-swap
OT 5% 15 Jun 2012 Apr 14th 805 2 years 2.5 1.715 15 bps vs. mid-swap
OT 4.8% 15 Jun 2020 Apr 14th 1195 10 years 1.6 4.340 104 bps vs. mid-swap
Treasury Bills
BT 23 Jul 2010 Jan 6th 600 6 months 4.8 0.592 -40 bps vs. Euribor 6 months
BT 21 Jan 2011 Jan 20th 1250 1 year 2.2 0.928 -30 bps vs. Euribor 12 months
BT 21 Jan 2011 Feb 3rd 300 1 year 4.0 1.379 15 bps vs. Euribor 12 months
BT 18 Feb 2011 Feb 17th 1000 1 year 2.2 1.173 -5 bps vs. Euribor 12 months
BT 17 Sep 2010 Mar 3rd 544 6 months 3 0.739 -22 bps vs. Euribor 6 months
BT 18 Feb 2011 Mar 3rd 630 1 year 3.1 1.097 -12 bps vs. Euribor 12 months
BT 18 Mar 2011 Mar 17th 1250 1 year 3.2 1.036 -18 bps vs. Euribor 12 months
BT 18 Mar 2011 Apr 7th 500 1 year 2.8 1.046 -18 bps vs. Euribor 12 months
BT 23 Jul2010 Apr 21st 575 3 months 2.4 0.476 -17 bps vs. Euribor 3 months
BT 21 Jan2011 Apr 21st 500 9 months 1.8 1.079 -1 bp vs. Euribor 9 months

8/9/2019 Portuguese Economy May 2010 (2)
http://slidepdf.com/reader/full/portuguese-economy-may-2010-2 26/57
. 25 .Portuguese Economy April 2010Economic Research
Public Debt Repayments Schedule, 2010 (EUR Billion).
Public Debt Repayments Schedule,Med ium and Long Term Debt (EUR B il lion).
No heavy redemption schedule in 2010.
Sources: IGCP, Bloomberg. As of May 3rd.
0
2000
4000
6000
8000
10000
12000
2 0 1 0
2 0 1 2
2 0 1 4
2 0 1 6
2 0 1 8
2 0 2 0
2 0 2 2
2 0 2 4
2 0 2 6
2 0 2 8
2 0 3 0
2 0 3 2
2 0 3 4
2 0 3 6
E
U R M l n
0
1000
2000
3000
4000
5000
6000
7000
M a y - 1 0
J u n - 1 0
J u
l - 1 0
A u g - 1 0
S e
t - 1 0
O c
t - 1 0
N o v - 1 0
D e c - 1 0
J a n - 1 1
F e b - 1 1
M a
r - 1 1
A p
r - 1 1
M a y - 1 1
E U
R M i l l i o n
Bonds
T-Bills

8/9/2019 Portuguese Economy May 2010 (2)
http://slidepdf.com/reader/full/portuguese-economy-may-2010-2 27/57
. 26 .Portuguese Economy April 2010Economic Research
0
10
20
30
40
50
60
70
1999 2000 2001 2002 2003 2004 2005 2006 2007 2008
Non-Residents Domestic Banks Other Financial Institutions Other Residents
Public Debt by Holders (% GDP).
Domestic banks have a low exposure to Portuguese public debt.
Less than 9% of Portuguese public debt is held by the Portuguese banking sector. Non-residents hold close to 80% of Portuguese public debt. But these are, essentially, euro area institutions, which are not subject to any exchange rate risk
in these investments.
Source: Bank of Portugal..
77% of total
8.5% of total

8/9/2019 Portuguese Economy May 2010 (2)
http://slidepdf.com/reader/full/portuguese-economy-may-2010-2 28/57
. 27 .Portuguese Economy April 2010Economic Research
Central Bank l iquidity provision (% of banks’ assets) .
Portugal’s banking sector remains solid.
0
2
4
6
8
10
12
G r e e
c e
I r e l a n
d
B e l g i u m
G e r m
a n y
A u s t r i a
N e t h e
r l a n d
s S p
a i n
F r a n
c e
P o r t u
g a l
I t a l y
F i n l a n
d
Central Bank liquidity provision (EUR bill ion).
The stability and soundness of Portugal’s banking sector favour the Portuguese economy’s outlook. Portuguese banks’ borrowings from the central bank amount to less than 2% of banks’ assets. This is below the levels observed, forexample, in France, Spain, Germany and Greece. The IMF report released in January 2010 stated that “The (Portuguese)banking system has weathered the global financial crisis relatively well, reflecting pre-existing strengths.”
Sources: Bloomberg, National Central Banks.
0
20
40
60
80
100
120
Jan.
2007
May Sep. Jan.
2008
May Sep. Jan.
2009
May Sep. Jan.
2010
E U R B i l l i o n
Portugal
Spain
Greece
Italy

8/9/2019 Portuguese Economy May 2010 (2)
http://slidepdf.com/reader/full/portuguese-economy-may-2010-2 29/57
. 28 .Portuguese Economy April 2010Economic Research
2009 Publ ic Debt (% GDP) vs .Sovereign Rating
Portugal public finances are in no worse shape than in other higher ratedeconomies.
Source: FT, Bloomberg.
0 50 100 150 200
Japan
Italy
Greece
USA
Portugal
UK
Ireland
Spain
India
Brazil
Turkey
Mexico
Indonesia
China
Russia BBB/Stable
A+/Stable
BB+/Pos.
BBB/Stable
BB/Pos.
BBB-/Stable
BBB-/Stable
AA/Neg.
AA/Neg.
AAA/Neg.
A-/Neg.
AAA/Stable
BB-/Neg.
A+/Stable
AA/Neg.
Sovereign Ratings
Investmentgrade
Moody'sInvestment
gradeStandard &
Poor'sFitch
Aaa Spain AAA Spain
Aa1 Ireland AA+
Aa2 Portugal/Italy AASpain/ Ireland
Aa3 AA-Ireland/Italy
Portugal
A1 A+ ItalyA2 A
A3 Greece A- Portugal
Baa1 BBB+
Baa2 BBB
Baa3 BBB- Greece
Ba1 BB+ Greece
St bilit d G th P 2010 2013 ll i d b th EU th
8/9/2019 Portuguese Economy May 2010 (2)
http://slidepdf.com/reader/full/portuguese-economy-may-2010-2 30/57
. 29 .Portuguese Economy April 2010Economic Research
-2.7
0.70.9
1.3
1.7
-3
-2.5
-2
-1.5
-1
-0.5
0
0.5
1
1.5
2
2009 2010 2011 2012 2013
76.6
85.4
88.990.1 89.3
65
70
75
80
85
90
95
2009 2010 2011 2012 2013
Stab il it y and Growth Program – Budget Defici t (% GDP)
S tab il it y and Growth Program – Externa l Deficit (% GDP)
Stab ili ty and Growth Program – GDP Growth Forecasts (% )
Stability and Growth Program – Public Debt (% GDP)
8.4
8.8
8.2 8.2
7.9
8
8.1
8.2
8.3
8.4
8.5
8.6
8.7
8.8
8.9
2010 2011 2012 2013
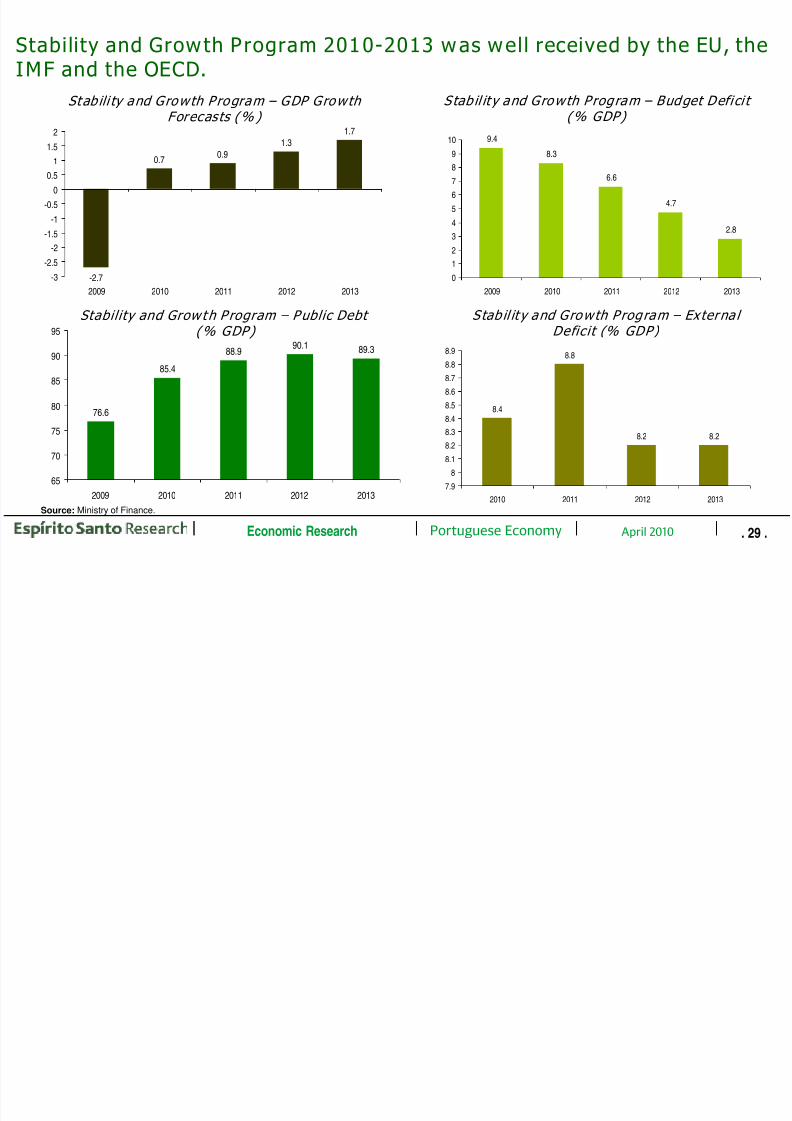
Stability and Growth Program 2010-2013 was well received by the EU, theIMF and the OECD.
Source: Ministry of Finance.
9.4
8.3
6.6
4.7
2.8
0
1
2
3
4
5
6
7
8
9
10
2009 2010 2011 2012 2013
Several GSP measures are being anticipated to reinforce deficit reduction
8/9/2019 Portuguese Economy May 2010 (2)
http://slidepdf.com/reader/full/portuguese-economy-may-2010-2 31/57
. 30 .Portuguese Economy April 2010Economic Research
Several GSP measures are being anticipated to reinforce deficit reductionefforts in 2010.
Highlights of the 2010-2013 Stability and Growth P rogram:
•According to the Program, cuts in public spending should contribute to close to 50% of the deficit reduction. Around 15% should come from higher revenues and 35% should come from the effects of higher activity growth.
•The main measures on the side of spending include: (i) a freeze in nominal wages in 2010 and a fall in real wages
in 2011-2013 (i.e. wage increases below inflation); (ii) hiring in the civil service limited by the “1-for-2” rule (1 admissiononly when 2 other civil servants leave); this rule becomes law; (iii) cuts in health-related spending and in all socialbenefits that are not linked to contributions; (iv) cuts in public investment, including the postponement of 2 projectedhigh-speed train lines (Lisbon-Porto and Porto-Vigo) and a 40% reduction in military spending; (v) extra penalties inpensions in the case of early retirements; (vi) phasing out of the extraordinary stimulus measures implemented during thefinancial crisis; (vi) reduction in intermediate consumption spending; (vii) zero net indebtedness in regional and local
Government until 2013 and new limits to public companies’ indebtedness.
•The main measures on the side of revenue include: (i) lower tax benefits, including the creation of progressiveceilings on deductions in the Personal Income Tax; (ii) an increase in the tax on capital gains; (iii) a new 45% personalincome tax rate on incomes above EUR 150000 (until 2013); (iv) new highway tolls. The Government expects revenuesfrom privatisations to reach EUR 6 billion in the period 2010-2013 (these revenues contribute directly to a reduction inpublic debt).
•Initial deficit reduction measures in 2010 included a freeze in civil servants’ nominal wages, a freeze in public sector hiringand cuts in public investment. The Government has now announced a step-up in the efforts of deficit reduction in2010, anticipating several GSP measures that should be in place only in 2011. These include reductions in social
spending, an increase in the capital gains tax, the introduction of a new 45% bracket in the personal income tax and newhighway tolls.

8/9/2019 Portuguese Economy May 2010 (2)
http://slidepdf.com/reader/full/portuguese-economy-may-2010-2 32/57
. 31 .Portuguese Economy April 2010Economic Research
1. Background and Main Financial Stabi li ty Data
2. Economic Activity
3. Recent Developments in Publ ic Finances
4. Poli tica l and Social Environment
5. Where Wil l Growth Come From? Rat ionale andMain Forecasts.

8/9/2019 Portuguese Economy May 2010 (2)
http://slidepdf.com/reader/full/portuguese-economy-may-2010-2 33/57
. 32 .Portuguese Economy April 2010Economic Research
World Bank Governance Indicators, 2008 (Percenti les for Selected Countries)
Voice and Political Gove rnment Regu latory Rule Control of
Accountability Stability Effectiveness Quality of Law Corrup tion
Sweden 99 88 99 99 98 98
Germany 92 86 93 91 94 93
France 91 67 90 87 90 91
Portugal 88 84 82 84 84 83
Spain 87 43 80 88 85 85
Italy 76 60 66 79 62 62
Greece 74 57 71 75 73 61
OECD 91 82 89 91 90 90
Above average social cohesion and political stability w ill be important in
the years ahead.
Source: World Bank.

8/9/2019 Portuguese Economy May 2010 (2)
http://slidepdf.com/reader/full/portuguese-economy-may-2010-2 34/57
. 33 .Portuguese Economy April 2010Economic Research
0
50
100
150
200
250
300
350
400
450
1
9 9 2
1
9 9 3
1
9 9 4
1
9 9 5
1
9 9 6
1
9 9 7
1
9 9 8
1
9 9 9
2
0 0 0
2
0 0 1
2
0 0 2
2
0 0 3
2
0 0 4
2
0 0 5
2
0 0 6
2
0 0 7
Number of workdays lost due to strikes* (per 1000 employees)
Number of strikes in Portugal
0
50
100
150200
250
300
350
G e r m a
n y
N e t h e r l a n
d s
P o r t u g a l
S w e d
e n
U K
I r e l a
n d
U S
D e n m a
r k
I t a l y
A u s t r i a
F r a n
c e
B e l g i u
m
S p a i n
F i n l a
n d
G r e e
c e
Sources: Morgan Stanley Research, Pordata.* 2000-2007 averages, except Greece (1991-2000 average).
Above average social cohesion and political stability w ill be important inthe years ahead.
Pol it ical environment: Clear majori ty of market fr iendly parties
8/9/2019 Portuguese Economy May 2010 (2)
http://slidepdf.com/reader/full/portuguese-economy-may-2010-2 35/57
. 34 .Portuguese Economy April 2010Economic Research
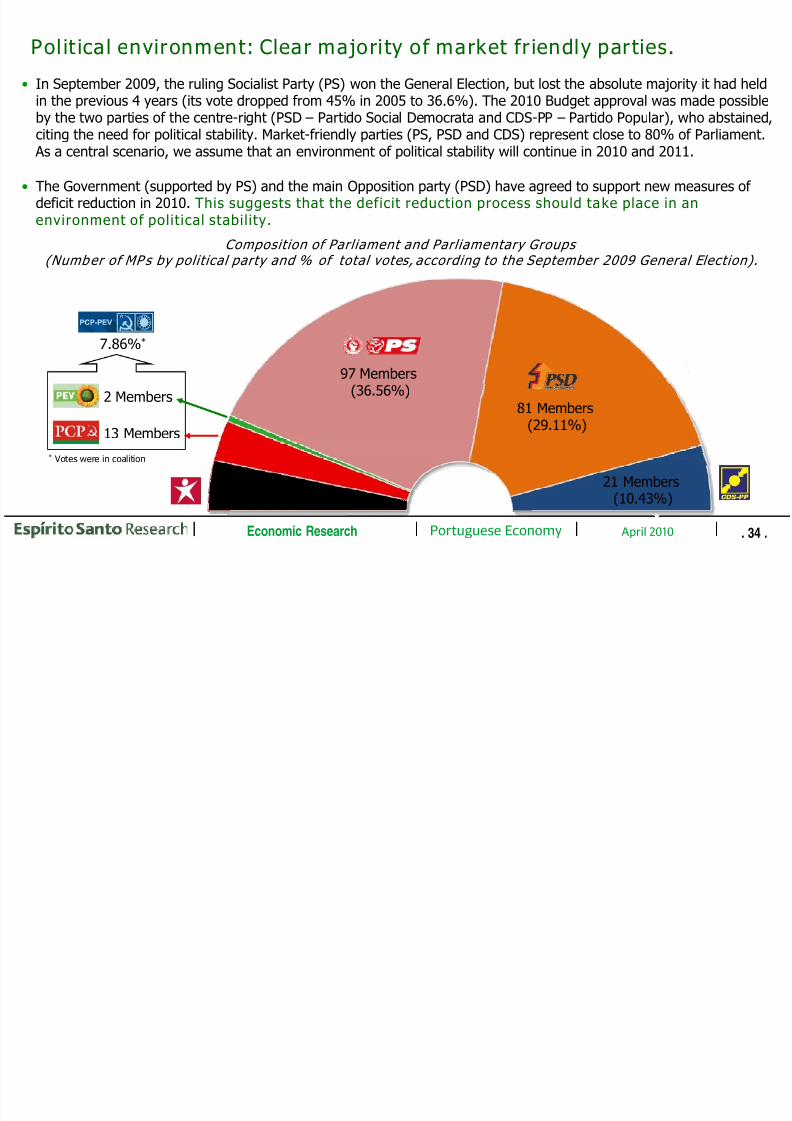
Pol it ical environment: Clear majori ty of market fr iendly parties.
• In September 2009, the ruling Socialist Party (PS) won the General Election, but lost the absolute majority it had held
in the previous 4 years (its vote dropped from 45% in 2005 to 36.6%). The 2010 Budget approval was made possibleby the two parties of the centre-right (PSD – Partido Social Democrata and CDS-PP – Partido Popular), who abstained,citing the need for political stability. Market-friendly parties (PS, PSD and CDS) represent close to 80% of Parliament.
As a central scenario, we assume that an environment of political stability will continue in 2010 and 2011.
• The Government (supported by PS) and the main Opposition party (PSD) have agreed to support new measures of
deficit reduction in 2010. This suggests that the deficit reduction process should take place in anenvironment of polit ical stability.
Composition of Parliament and Parliamentary Groups (Number of MPs by political party and % of total votes, according to the September 2009 General Election).
97 Members
(36.56%) 81 Members(29.11%)
21 Members
(10.43%)BE: 21 Members (9.81%)
13 Members
2 Members
7.86%*
* Votes were in coalition
Political st ress scenarios in the year ahead.

8/9/2019 Portuguese Economy May 2010 (2)
http://slidepdf.com/reader/full/portuguese-economy-may-2010-2 36/57
. 35 .Portuguese Economy April 2010Economic Research
September
27 th , 2009
April 15 th ,
2010
September
8 th , 2010
January,
2011
President dismisses the Government
President requests the Socialist Party to form a new Government with a new PM
President calls the Opposition parties to form a new Government
President directly sponsors a new Government, naming a new PM
President dissolves the Parliament and calls
for new elections
Government resigns
OR
President dismisses the Government
Government resigns Government resigns
OR OR
New composition of Parliament and new
Government
Until the 2nd quarter of 2011, the Parliament could only be dissolved in the period between 15th April and 8th September2010. Out of this period, potential new Government solutions would have to be found within the current parliamentaryframework. We see a 0% probability of the Government resigning or being dismissed in the period considered.
General Elections Presidential Elections
President dismisses government
OR
Political st ress scenarios in the year ahead.

8/9/2019 Portuguese Economy May 2010 (2)
http://slidepdf.com/reader/full/portuguese-economy-may-2010-2 37/57
. 36 .Portuguese Economy April 2010Economic Research
1. Background and Main Financial Stabi li ty Data
2. Economic Activity
3. Recent Developments in Publ ic Finances
4. Poli tica l and Social Environment
5. Where Wil l Growth Come From? Rat ionale andMain Forecasts.
Where will growth come from? From higher confidence levels as public

8/9/2019 Portuguese Economy May 2010 (2)
http://slidepdf.com/reader/full/portuguese-economy-may-2010-2 38/57
. 37 .Portuguese Economy April 2010Economic Research
Changes in Prim ary Cyclically Adjusted Budget Deficit vs. Business Confidence.*
g g pfinances improve.
Periods of fiscal consolidation (involving discretionary policy measures) tend to give way to improvements in businessconfidence levels. This is because lower budget deficits and lower public debt ratios tend to increase the prospects of
sustained activity growth.
Source: Reuters Ecowin, ES Research. * 2-year changes in the budget deficit. Business confidence advanced 1 year. 12 month MA.
1988 1990 1992 1994 1996 1998 2000 2002 2004 2006 2008 2010 2012
I n d e x
-35
-30
-25
-20
-15
-10
-5
0
5
10
P e r c e n t a g e P o i n t s
-0.5
-0.4
-0.3
-0.2
-0.1
0.0
0.1
0.2
0.3
0.4
Where will growth come from? From an expansion in the relevant market

8/9/2019 Portuguese Economy May 2010 (2)
http://slidepdf.com/reader/full/portuguese-economy-may-2010-2 39/57
. 38 .Portuguese Economy April 2010Economic Research
Where wil l growth come from? From an expansion in the relevant marketof the Portuguese economy.
0
2
4
6
8
10
12
2002 2003 2004 2005 2006 2007 2008 2009(Nov.)
0.0
0.5
1.0
1.5
2.0
2.5
AFRICA (LHS)
ASIA (LHS)
LATIN AMERICA (RHS)
Weight in total Por tuguese exports (% ).*
Sources: INE, Eurostat,ES Research. * Merchandise.

8/9/2019 Portuguese Economy May 2010 (2)
http://slidepdf.com/reader/full/portuguese-economy-may-2010-2 40/57
. 39 .Portuguese Economy April 2010Economic Research
10.0
5.0
-0.6
4.5
2.0
12.0
4.2
5.5
0.7
2.6
0.6
Angola Brazil Spain Lybia Morocco Egypt Tun isia Alger ia Euro Area US Portugal
0
10
20
30
40
50
1996 1998 2000 2002 2004 2006 2008
( € b n )
Mediterranean Basin
14.319.4
37.1
18.7 12.0
35.8
7.03.3 5.5
1996 2001 2008
Latin America Africa Asia
CAGR 96-08 11.4%
CAGR 05-08 15.4%
StrategicTriangle
GDP growth est imates 2010, (% ) Total t rade f lows between Portugal, Spain,
Angola and Brazi l (EUR bi l l ion).
Portuguese exports annual growth, by geography (% )
Where wil l growth come from? From an expansion in the relevant marketof the Portuguese economy.
Sources: IMF, Bloomberg, INE, Eurostat.
Angola: Strong grow th potential w ith increasing contributions from

8/9/2019 Portuguese Economy May 2010 (2)
http://slidepdf.com/reader/full/portuguese-economy-may-2010-2 41/57
. 40 .Portuguese Economy April 2010Economic Research
5
7
9
11
1315
17
19
21
Jan. Mar. May Jul. Sep. Nov. Jan. Mar. May Jul. Sep. Nov. Jan.
1.6
1.7
1.7
1.8
1.8
1.9
1.9
2.0
2.0
2.1
2008 2009
U S D b i l l i o n s m
b / d i a
Oil production
(RHS)
Net ext ernal reserves
(LHS)
non-oil sectors.
Sources: IMF, OPEC, BNA, Bloomberg, Reuters EcoWin, ES Research.
Lower oil revenues in1H2009 have contributedto lower USD liquidity inthe economy, leading to aslowdown in activity andforcing a kwanza
depreciation. But therecovery in oil output, theresilience of non energysectors, and theenvironment of macroeconomic stability
are contributing to areacceleration in growth.Over the medium and longterm, Angola shows stronggrowth potential, based onrising income per capitaand domestic consumption,continued infrastructureinvestment and furtherdevelopment of primarysectors (ex. agriculture,
mining) and energy.
External reserves (USD billion) and Oil Production (mb/ day).
Kw anza exchange rate vs. USD and EUR.
GDP Grow th, Africa vs. World (% ).
Angola – GDP Grow th Forecasts (% ).
-2
-1
0
12
3
4
5
6
7
8
2003 2004 2005 2006 2007 2008 2009F 2010F
World Economy Sub-Saharan Africa% Africa
10.0
8.5
6.0 6.3
0
2
4
6
8
10
12
2010 2011 2012 2013
0
20
40
60
80
100
120
140
2000 2001 2002 2003 2004 2005 2006 2007 2008 2009 2010
E U R / A O
A a n d U S D / A O A
127.8
94.1
EUR/AOA
USD/AOA
Brazil: A booming economy.

8/9/2019 Portuguese Economy May 2010 (2)
http://slidepdf.com/reader/full/portuguese-economy-may-2010-2 42/57
. 41 .Portuguese Economy April 2010Economic Research
Sources: Bloomberg, IBGE, BACEN, ES Research.
The impact of the globalfinancial crisis on Brazil hasbeen very low by historicalstandards, as the economyremained structurallysound, with ample external
reserves, disciplined publicaccounts and containedinflation expectations.
Beyond strong exports,growth is being mainlydriven by domestic
demand, as a result of favourable developmentsin income and in financialconditions (average GDPgrowth close to 5% in the
near term). With theeconomy’s increasingattractiveness forinvestment, we expect anincrease in Brazil’spotential growth over the
medium and long term.
Brazi l – Retai l sales (12-month growth, % ).
Braz il – Trade and Current Account Balances (% GDP).
Brazi l – Industr ial production (% , y-o-y).
Brazi l – GDP Grow th Forecasts (% ).
5.0
4.0
4.5 4.5
0
1
2
3
4
5
6
2010 2011 2012 2013
-30
-20
-10
0
10
20
30
Abr. 2007 Out. 2007 Abr. 2008 Out. 2008Abr. 2009 Out. 2009
%
35
40
45
50
55
60
I n d e
x ( P o i n t s )
Industrial production
(LHS)
PM I
(RHS)
Where w il l growth come from? From an improvement in the value of
8/9/2019 Portuguese Economy May 2010 (2)
http://slidepdf.com/reader/full/portuguese-economy-may-2010-2 43/57
. 42 .Portuguese Economy April 2010Economic Research
-600000
-500000
-400000
-300000
-200000
-100000
0
100000
200000
300000
1997 1998 1999 2000 2001 2002 2003 2004 2005 2006 2007 2008 2009
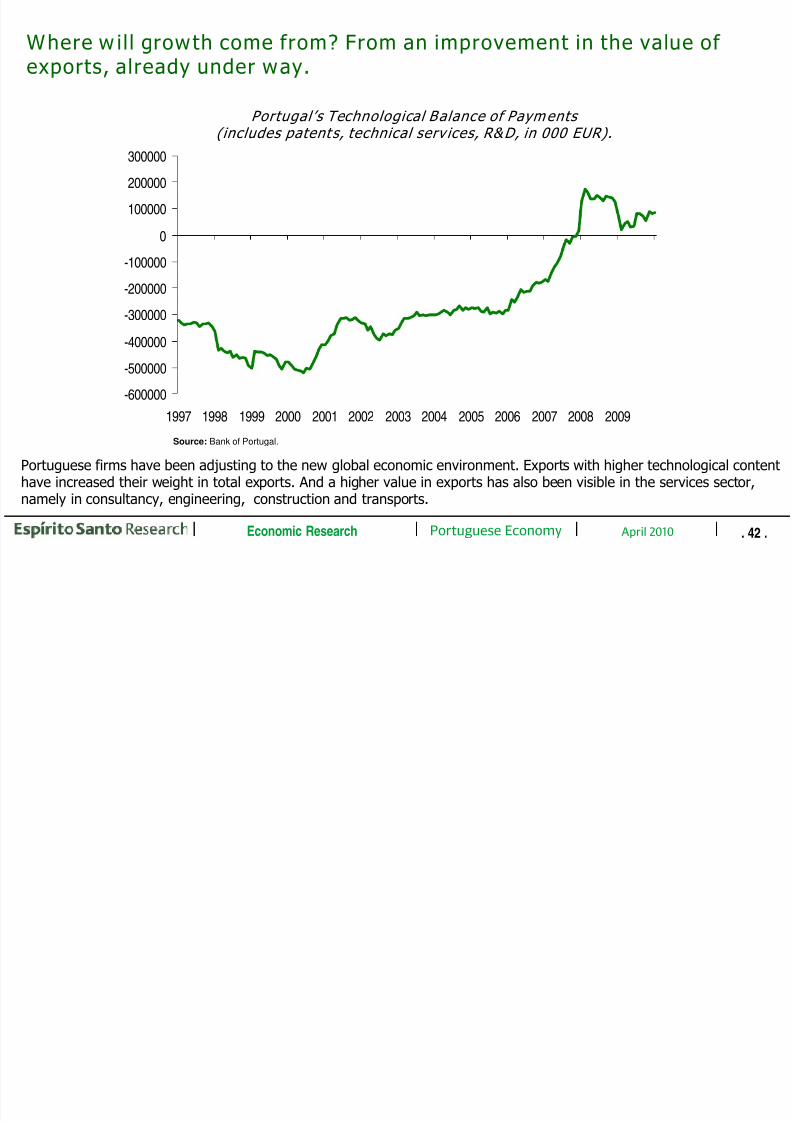
Portugal’s Technological Balance of Payments (includes patents, technical serv ices, R&D, in 000 EUR).
exports, already under way.
Portuguese firms have been adjusting to the new global economic environment. Exports with higher technological contenthave increased their weight in total exports. And a higher value in exports has also been visible in the services sector,
namely in consultancy, engineering, construction and transports.
Source: Bank of Portugal.
Where w ill growth come from? From further improvements in
8/9/2019 Portuguese Economy May 2010 (2)
http://slidepdf.com/reader/full/portuguese-economy-may-2010-2 44/57
. 43 .Portuguese Economy April 2010Economic Research
35
40
45
50
55
60
65
70
1960 1965 1970 1975 1980 1985 1990 1995 2000 2005 2010
Z o n
a E u r o = 1 0 0
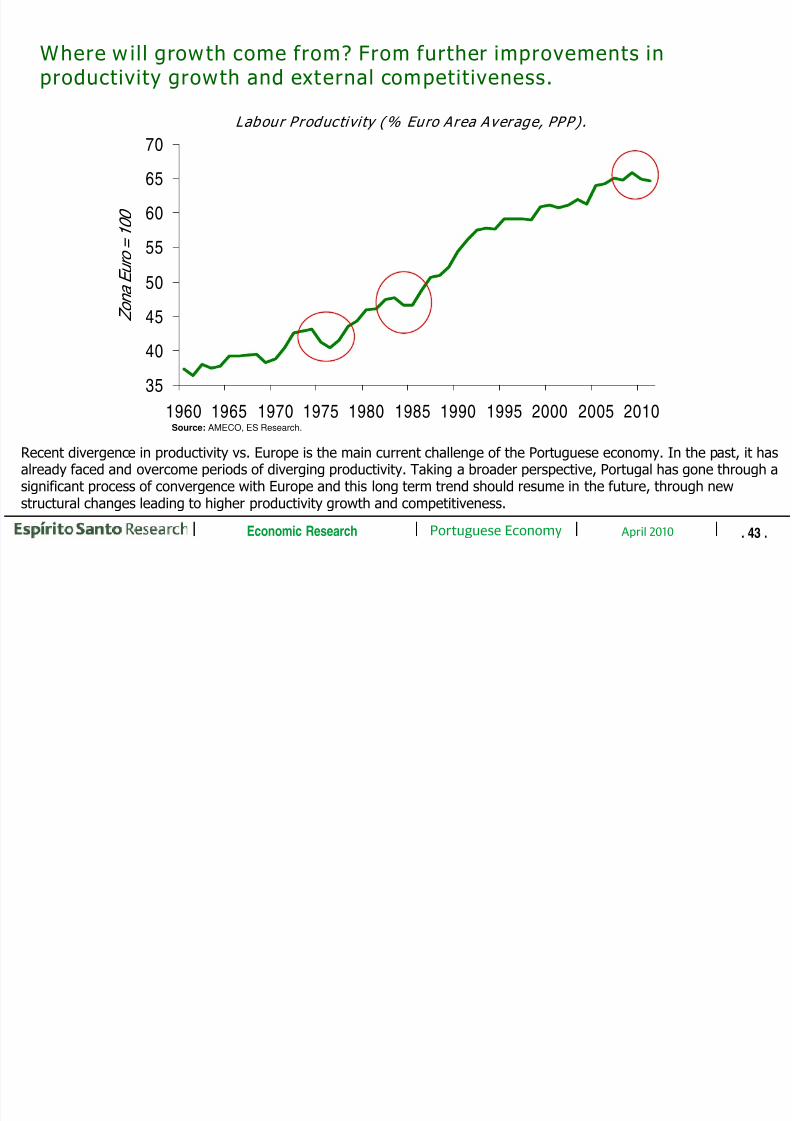
Labour Productivi ty (% Euro Area Average, PPP).
Where w il l growth come from? From further improvements inproductivity growth and external competitiveness.
Recent divergence in productivity vs. Europe is the main current challenge of the Portuguese economy. In the past, it hasalready faced and overcome periods of diverging productivity. Taking a broader perspective, Portugal has gone through asignificant process of convergence with Europe and this long term trend should resume in the future, through new
structural changes leading to higher productivity growth and competitiveness.
Source: AMECO, ES Research.
Where will growth come from? There is scope for improvements in

8/9/2019 Portuguese Economy May 2010 (2)
http://slidepdf.com/reader/full/portuguese-economy-may-2010-2 45/57
. 44 .Portuguese Economy April 2010Economic Research
World Bank Doing Business Survey 2009 (Percentile)
Index of Product Market Regulation (0-6, from less to more restrictive regulation in terms of
competition)
Source: OECD, Bank of Portugal, World Bank.
g p pdomestic market competition and in the business environment.
0.0
0.5
1.0
1.5
2.0
2.5
3.0
U S
U K
C a n a d a
N e t h e r l a n d s
D e n m a r k
S p a i n
J a p a n
F i n l a n d
H u n g a r y
S e w d e n
G e r m a n y
I r e l a n d
O E C D
A u s t r i a
I t a l y
B e l g i u m
P o r t u g a l
F r a n c e
S l o v a k i a
C z e c h R e p .
G r e e c e
T u r k e y
P o l a n d
0
20
40
60
80
100
120
I r e l a n d
F i n l a n d
B e l g i u m
G e r m a n y
A u s t r i a
N
e t h e r l a n d s
F r a n c e
S l o v a k i a
P o r t u g a l
S l o v e n i a
S p a i n
L u x e m b o u r g
I t a l y
G r e e c e
Higher productivity and competitiveness can be reached through further deregulation and increased competition indomestic markets of goods and services, as well as through further improvements in the business environment. Indicatorssuggest that there is scope for improvements in this respect.
Where will growth come from? From reducing the external dependence
8/9/2019 Portuguese Economy May 2010 (2)
http://slidepdf.com/reader/full/portuguese-economy-may-2010-2 46/57
. 45 .Portuguese Economy April 2010Economic Research
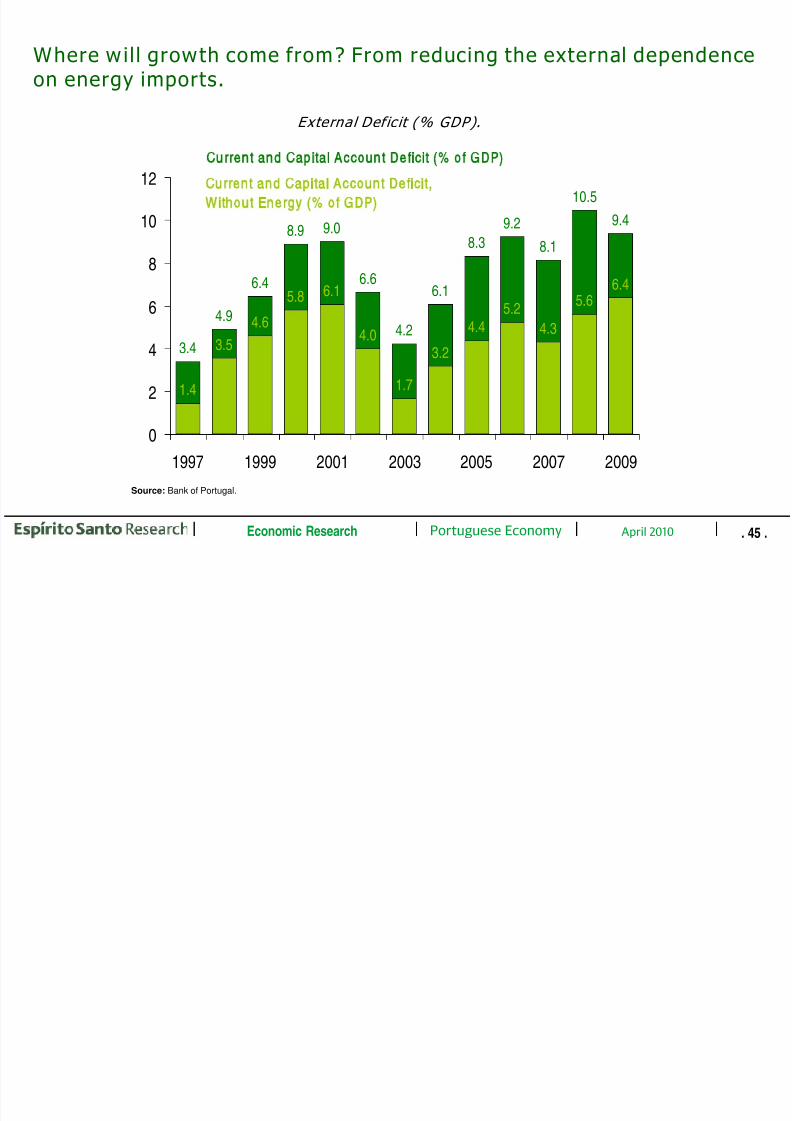
External Def ic it (% GDP).
Where wil l growth come from? From reducing the external dependenceon energy imports.
Source: Bank of Portugal.
3.4
4.9
6.4
8.9 9.0
6.6
4.2
6.1
8.3
9.2
8.1
10.5
9.4
1.4
3.5
4.65.8
6.1
4.0
1.7
3.2
4.45.2
4.3
5.6
6.4
0
2
4
6
8
10
12
1997 1999 2001 2003 2005 2007 2009
Cu r re n t a n d Ca p i ta l A cco u n t De f ic i t (% o f GDP )
Cu r re n t a n d C a p it a l A cco u n t De f ic i t,
W it h o u t E n e r g y (% o f G D P )
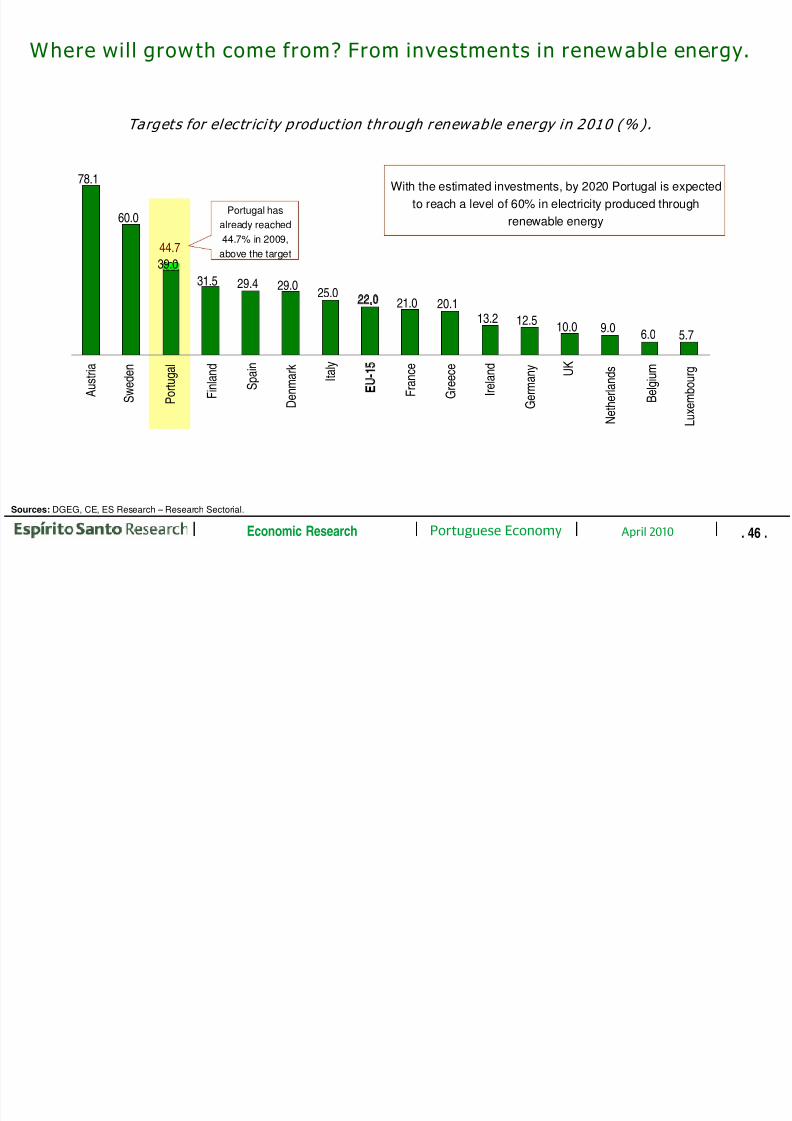
1Where wil l growth come from? From investments in renewable energy.
8/9/2019 Portuguese Economy May 2010 (2)
http://slidepdf.com/reader/full/portuguese-economy-may-2010-2 47/57
. 46 .Portuguese Economy April 2010Economic Research
Sources: DGEG, CE, ES Research – Research Sectorial.
Portugal has
already reached
44.7% in 2009,
above the target
78.1
60.0
39.0
31.5 29.4 29.025.0
22.0 21.0 20.113.2 12.5
10.0 9.06.0 5.7
A u s t r i a
S
w e d e n
P
o r t u g a l
F i n l a n d
S p a i n
D e n m a r k
I t a l y
EU-1
F r a n c e
G r e e c e
I r e l a n d
G e r m a n y
U K
N e t h e
r l a n d s
B
e l g i u m
L u x e m
b o u r g
44.7
With the estimated investments, by 2020 Portugal is expected
to reach a level of 60% in electricity produced throughrenewable energy
Targets for electr ici ty product ion through renewable energy in 2010 (% ).
Where will growth come from? From a comparative advantage in tourism
8/9/2019 Portuguese Economy May 2010 (2)
http://slidepdf.com/reader/full/portuguese-economy-may-2010-2 48/57
. 47 .Portuguese Economy April 2010Economic Research
Source: INE, Turismo de Portugal, ES Research-Research Sectorial. * Weight of Tourism’s Gross Added Value (GAV) in the GAV of the Economy.
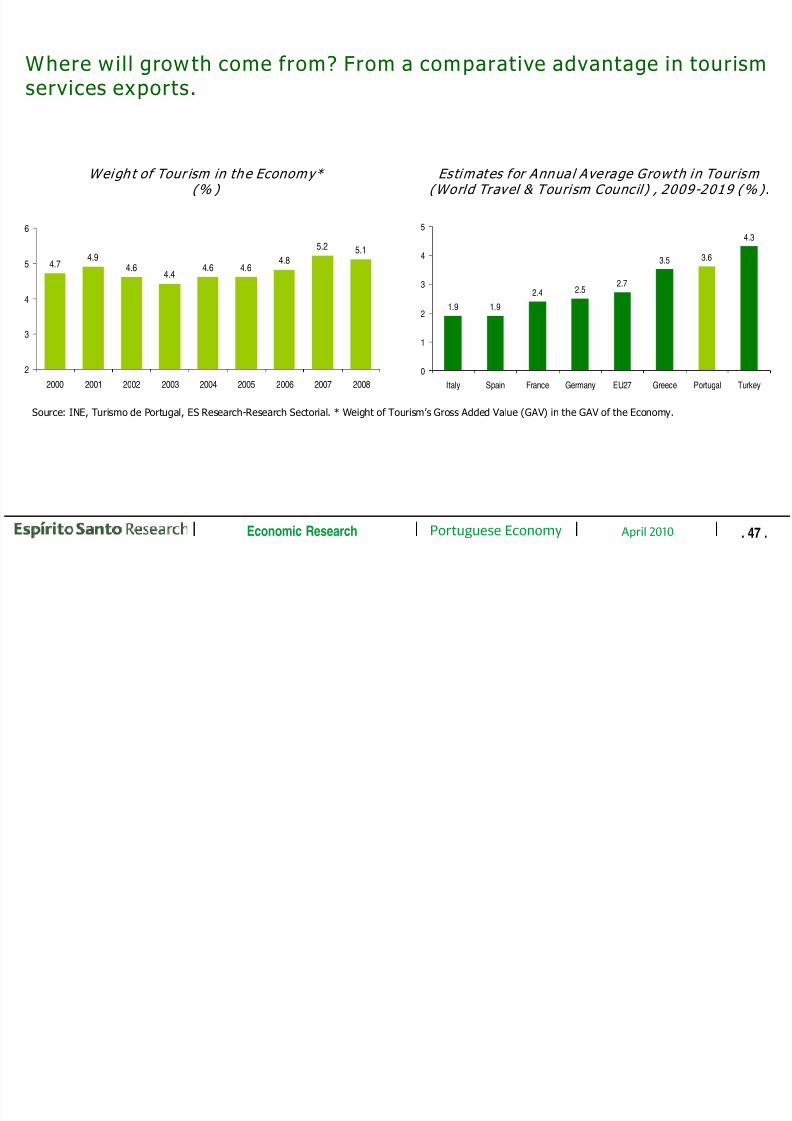
Weigh t of Tour ism in the Economy* (% )
Where wil l growth come from? From a comparative advantage in tourismservices exports.
4.74.9
4.64.4
4.6 4.64.8
5.2 5.1
2
3
4
5
6
2000 2001 2002 2003 2004 2005 2006 2007 2008
1.9 1.9
2.4 2.52.7
3.5 3.6
4.3
0
1
2
3
4
5
Italy Spain France Germany EU27 Greece Portugal Turkey
Estimates for Annual Average Growth in Tour ism (World Travel & Tourism Council) , 2009-2019 (% ).
Conclusion

8/9/2019 Portuguese Economy May 2010 (2)
http://slidepdf.com/reader/full/portuguese-economy-may-2010-2 49/57
. 48 .Portuguese Economy April 2010Economic Research
• The Portuguese economy faces important challenges in the years ahead. These include the need to contain the public
debt and the need to accelerate GDP growth, through higher productivity growth and improved externalcompetitiveness. Domestic savings will have to increase.
• Nevertheless, economic and fiscal fundamentals do not justify recent market worries. Portugal is not facing anyliquidity risks, as financing needs are being fulfilled in the market with no particular stress. Although it should increase
in the near future, public debt remains in line with the EU average. In the EU context, Portugal is well placed in whatconcerns public debt affordability and sustainability.
• Aggregate household indebtedness has increased in the last 15 years. This was the result of an upgrading in thestandards of living in the context of improved financing conditions, as Portugal joined the European Monetary Union.Household debt service remains contained and household wealth condition is solid. Portugal did not face any Spanish-
style bubble in the housing sector. Neither households nor the financial sector are subject to the risk of sharp negativewealth effects through significant property devaluations.
• According to the IMF, the Portuguese banking system has weathered the global financial crisis relatively well,reflecting pre-existing strengths. Portuguese banks’ borrowings from the Central Bank amount to less than 2% of banks’ assets. This is below the levels observed in France, Spain, Germany and Greece.
• Higher growth in the future should come from: improved confidence from fiscal consolidation; an expansion of therelevant market of the economy, mainly to Africa and Latin America, taking advantage of historical and cultural ties,as well as of geographic proximity (and acting as a bridge to these emerging economies); investments in reducingenergy dependence; exploring the competitive advantage of tourism; benefiting from an environment of socialcohesion and political stability.
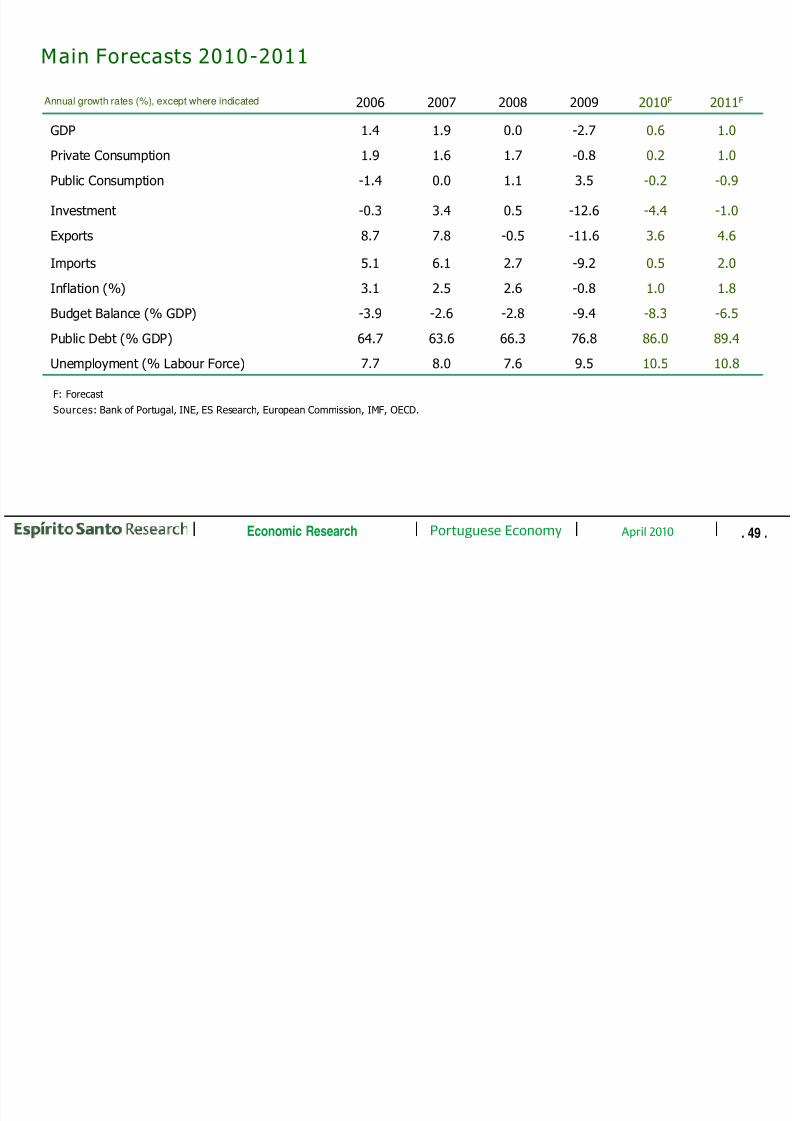
Main Forecasts 2010-2011
8/9/2019 Portuguese Economy May 2010 (2)
http://slidepdf.com/reader/full/portuguese-economy-may-2010-2 50/57
. 49 .Portuguese Economy April 2010Economic Research
Annual growth rates (%), except where indicated
10.810.59.57.68.07.7Unemployment (% Labour Force)
89.486.076.866.363.664.7Public Debt (% GDP)
-6.5-8.3-9.4-2.8-2.6-3.9Budget Balance (% GDP)
1.81.0-0.82.62.53.1Inflation (%)
2.00.5-9.22.76.15.1Imports
4.63.6-11.6-0.57.88.7Exports
-1.0-4.4-12.60.53.4-0.3Investment
-0.9-0.23.51.10.0-1.4Public Consumption
1.00.2-0.81.71.61.9Private Consumption
1.00.6-2.70.01.91.4GDP2011
F
2010F
2009200820072006
F: Forecast
Sources: Bank of Portugal, INE, ES Research, European Commission, IMF, OECD.
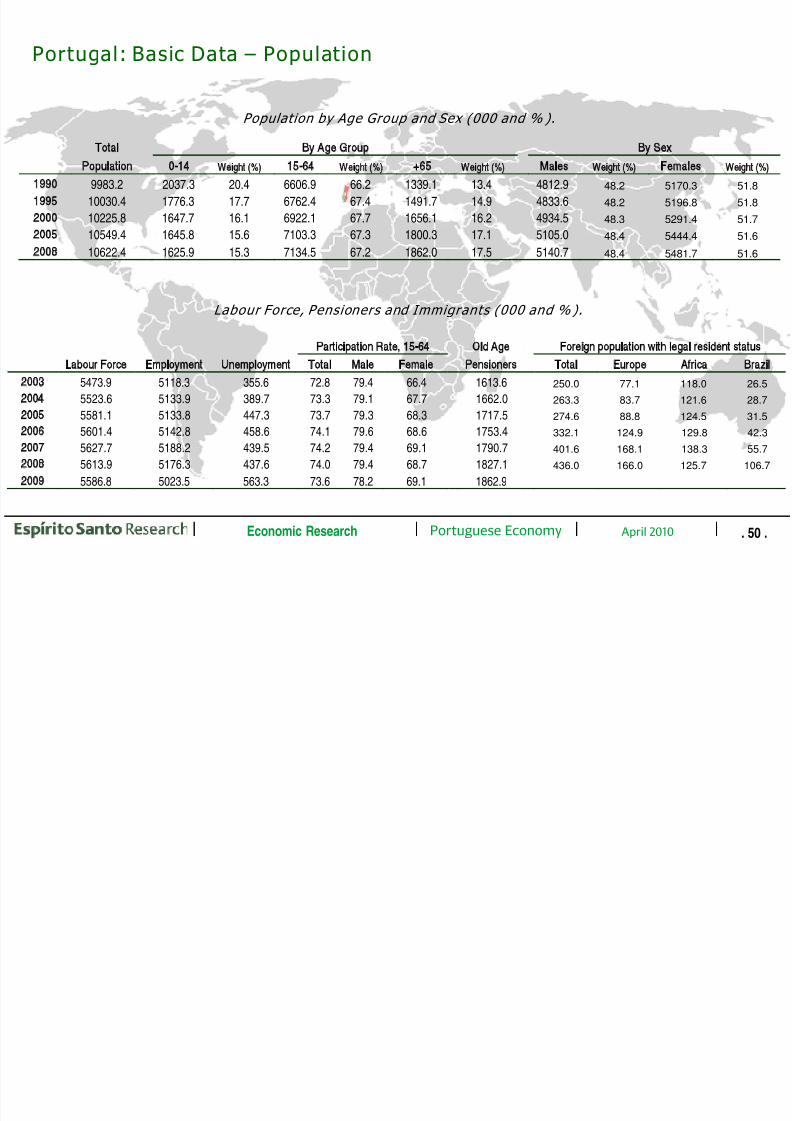
Portugal: Basic Data – Population
8/9/2019 Portuguese Economy May 2010 (2)
http://slidepdf.com/reader/full/portuguese-economy-may-2010-2 51/57
. 50 .Portuguese Economy April 2010Economic Research
Population by Age Group and Sex (000 and % ).
Total By Age Group By Sex
Population 0-14 Weight (%) 15-64 Weight (%) +65 Weight (%) Males Weight (%) Females Weight (%)
1990 9983.2 2037.3 20.4 6606.9 66.2 1339.1 13.4 4812.9 48.2 5170.3 51.8
1995 10030.4 1776.3 17.7 6762.4 67.4 1491.7 14.9 4833.648.2 5196.8 51.8
2000 10225.8 1647.7 16.1 6922.1 67.7 1656.1 16.2 4934.5 48.3 5291.4 51.7
2005 10549.4 1645.8 15.6 7103.3 67.3 1800.3 17.1 5105.0 48.4 5444.4 51.6
2008 10622.4 1625.9 15.3 7134.5 67.2 1862.0 17.5 5140.7 48.4 5481.7 51.6
Participation Rate, 15-64 Old Age Foreign population with legal resident status
Labour Force Employment Unemployment Total Male Female Pensioners Total Europe Africa Brazil
2003 5473.9 5118.3 355.6 72.8 79.4 66.4 1613.6 250.0 77.1 118.0 26.5
2004 5523.6 5133.9 389.7 73.3 79.1 67.7 1662.0 263.3 83.7 121.6 28.7
2005 5581.1 5133.8 447.3 73.7 79.3 68.3 1717.5 274.6 88.8 124.5 31.5
2006 5601.4 5142.8 458.6 74.1 79.6 68.6 1753.4 332.1 124.9 129.8 42.3
2007 5627.7 5188.2 439.5 74.2 79.4 69.1 1790.7 401.6 168.1 138.3 55.7
2008 5613.9 5176.3 437.6 74.0 79.4 68.7 1827.1 436.0 166.0 125.7 106.7
2009 5586.8 5023.5 563.3 73.6 78.2 69.1 1862.9
Labour Force, Pensioners and Immigrants (000 and % ).
Portugal: Basic Data – GDP

8/9/2019 Portuguese Economy May 2010 (2)
http://slidepdf.com/reader/full/portuguese-economy-may-2010-2 52/57
. 51 .Portuguese Economy April 2010Economic Research
GDP and Expenditure Components (EUR M illion and % ).
Gross Added Value by Sector of Activity (Weight in Total, % ).
Manufacturing Comm erce, Hotels Transports and Financial
Agriculture and Electricity Cons truction and Restaurants Com mun ications Activities Other Services
1995 5.8 21.9 6.4 17.8 6.5 13.8 27.9
2000 3.8 20.0 7.6 17.5 6.6 13.8 30.8
2005 2.8 17.7 6.9 17.4 6.9 14.4 33.9
2006 2.8 17.7 6.6 17.3 7.0 15.0 33.5
2007 2.5 18.0 6.5 17.4 6.9 15.2 33.5
2008 2.3 17.5 6.4 17.6 6.7 15.6 33.9
Private Consumption Public Consumption Fixed Investment Exports Imports
GDP EUR Million Weight (%) EUR Million Weight (%) EUR Million Weight (%) EUR Million Weight (%) EUR Million Weight (%)
1995 85 137.9 55 581.7 65.3 15199.7 17.9 19 798.1 23.3 24 356.4 28.6 29 798.0 35.0
2000 122 270.1 78 100.5 63.9 23623.4 19.3 33 860.7 27.7 36 386.7 29.8 49 701.2 40.6
2005 149 123.5 96 706.8 64.9 31974.0 21.4 33 649.6 22.6 42 567.1 28.5 55 774.0 37.4
2006 155 446.1 101 599.1 65.4 32132.7 20.7 34 481.1 22.2 48 204.3 31.0 60 971.1 39.2
2007 163 051.3 106 059.7 65.0 33050.2 20.3 36 197.6 22.2 53 430.6 32.8 65 686.8 40.3
2008 166 435.3 110 689.2 66.5 34516.3 20.7 37 128.7 22.3 54 878.3 33.0 70 777.2 42.5
2009 163 595.4 107 864.1 65.9 36875.8 22.5 31 282.2 19.1 46 218.0 28.3 58 644.7 35.8
Portuguese merchandise exports, 2009 (% of total).

8/9/2019 Portuguese Economy May 2010 (2)
http://slidepdf.com/reader/full/portuguese-economy-may-2010-2 53/57
. 52 .Portuguese Economy April 2010Economic Research
Sources: INE, Eurostat, ES Research.
Textiles, Leather, Fur
and artificial skins (4.6%)
Mineral fuels, Mineral oils (5.1%)
Wood, Cork and Paper (8.7%)
Miscellaneous FinishedProducts (9.5%)
Ore and Metals (9.8%)
Clothing and Footwear (10.9%)Chemicals (11.0%)
Food and Drinks (12.5%)
Transportation Vehicles (11.8%)
Machinery (16.2%)
Portuguese service exports, 2009 (% of total).

8/9/2019 Portuguese Economy May 2010 (2)
http://slidepdf.com/reader/full/portuguese-economy-may-2010-2 54/57
. 53 .Portuguese Economy April 2010Economic Research
Sources: Banco de Portugal, ES Research.
Construction services (3.1%)
Other Business Services (19.8%)
Transportation (25.4%)
Travel (42.5%)
Communications services (3.0%)
Insurance services (0.7%)
Personal, cultural and recreational services (1.4%)
Royalties and license fees (0.7%)
Financial services (0.9%)
Government services (1.0%)
Computer and information services (1.6%)
Merchanting (Comm ercial intermediation)
and other trade-related services
Merchanting (Comércio triangular)
Other Commercial intermediation and trade-related services
Operational leasing
Technical services
Legal, accounting, management and public relations services
Advertising, market research and public opinion polling Research and development services
Architectural, engineering and other technical services
Agricultural, mining and manufacturing services
Services between affiliated enterprises
Other services

8/9/2019 Portuguese Economy May 2010 (2)
http://slidepdf.com/reader/full/portuguese-economy-may-2010-2 55/57
Public Spending and Revenues – Main Indicators (% of GDP)

8/9/2019 Portuguese Economy May 2010 (2)
http://slidepdf.com/reader/full/portuguese-economy-may-2010-2 56/57
. 55 .Portuguese Economy April 2010Economic Research
2002 2003 2004 2005 2006 2007 2008 2009e 2010F
1. Tax Revenue (2+3) 23.5 23.4 22.7 23.4 24.2 24.8 24.5 22.2 22.2
2. Taxes on Production and Imports 14.2 14.8 14.2 15.0 15.4 15.0 14.6 13.1 13.4
3. Taxes on Income and Property 9.3 8.6 8.5 8.4 8.8 9.8 9.9 9.1 8.9
4. Social Contributions 11.7 12.2 12.2 12.5 12.5 12.7 12.9 11.4 11.0
5. Other Current Revenues 4.4 4.2 4.7 4.1 4.5 4.8 4.8 4.9 5.5
6. Total Current Revenues (1+4+5) 39.6 39.8 39.6 40.1 41.2 42.3 42.3 38.5 38.7
7. Intermediate Concumption 4.2 3.8 4.0 4.2 4.1 4.1 4.4 4.4 4.78. Compensation of Civil Servants 14.7 14.1 14.1 14.4 13.6 12.9 12.9 11.5 11.2
9. Social Payments 14.6 17.0 17.6 18.5 18.8 19.2 19.9 21.8 22.0
10. Interest Payments 2.8 2.7 2.6 2.6 2.7 2.8 2.9 2.9 3.2
11. Subsidies 1.5 1.8 1.5 1.6 1.4 1.2 1.2 1.5 1.7
12. Other Current Spending 2.0 1.8 2.1 2.1 2.2 2.0 2.0 2.7 2.5
13. Total Current Spending (7+...+12) 39.9 41.2 42.0 43.4 42.9 42.3 43.2 44.9 45.214. Gross Savings (6-13) -0.3 -1.3 -2.4 -3.2 -1.6 0.0 -0.9 -6.4 -6.4
15. Capital Revenues 1.7 2.7 3.6 1.4 1.1 0.9 0.9 1.2 1.4
16. Total Revenues (6+15) 41.4 42.5 43.1 41.6 42.3 43.2 43.2 39.7 40.2
17. Fixed Investment 3.5 3.1 3.1 2.9 2.4 2.3 2.2 2.6 2.7
18. Other Capital Spending 0.7 1.2 1.4 1.4 1.0 1.2 0.5 1.6 0.7
19. Total Capital Spending (17+18) 4.3 4.3 4.5 4.3 3.4 3.5 2.7 4.2 3.320. Total Spending (13+19) 44.2 45.4 46.5 47.7 46.3 45.7 45.9 49.1 48.5
21. Budget Balance -2.8 -2.9 -3.4 -6.1 -3.9 -2.6 -2.7 -9.3 -8.3
22. Revenues from Taxes and Contributions 34.3 34.5 33.8 34.8 35.6 36.5 36.4 32.6 32.6
23. Current Primary Spending (13-10) 37.1 38.5 39.3 40.8 40.1 39.4 40.3 42.0 42.0
24. Total primary Spending (20-10) 41.4 42.7 43.8 45.1 43.5 42.9 43.0 46.2 45.3
25. Primary Balance (16-24) 0.0 -0.2 -0.7 -3.5 -1.2 0.2 0.2 -6.4 -5.2Source: Ministry of Finance.

8/9/2019 Portuguese Economy May 2010 (2)
http://slidepdf.com/reader/full/portuguese-economy-may-2010-2 57/57
. 56 .Portuguese Economy April 2010Economic Research
General ManagerMiguel Frasquilho [email protected]
Economic Research
Department
Carlos Almeida Andrade
Pedro Matos Branco
Maria Amélia Valverde
Henrique Sanchez
Tiago Lavrador
Ivo Banaco
Paulo Talhão Paulino
João Pereira Miguel
Economic Research Brazil Jankiel Santos [email protected]