positional accuracy of airborne integrated global ... accuracy of airborne integrated global...
TRANSCRIPT
Positional Accuracy of Airborne Integrated Global Positioning and Inertial Navigation Systems
for Mapping in Glen Canyon, Arizona
Open-File Report 02-222
by
Richard D. Sanchez and Larry D. Hothem
__________________________
Any use of trade, product, or firm names is for descriptive purposes only and does not imply endorsement by the U.S. Government.
ABSTRACT High-resolution airborne and satellite image sensor systems integrated with onboard data collection based on the Global Positioning System (GPS) and inertial navigation systems (INS) may offer a quick and cost-effective way to gather accurate topographic map information without ground control or aerial triangulation. The Applanix Corporation’s Position and Orientation Solutions for Direct Georeferencing of aerial photography was used in this project to examine the positional accuracy of integrated GPS/INS for terrain mapping in Glen Canyon, Arizona. The research application in this study yielded important information on the usefulness and limits of airborne integrated GPS/INS data-capture systems for mapping.
INTRODUCTION Over the past decade, several publications have confirmed the potential of utilizing the Global Positioning System (GPS) and inertial navigation system (INS) technology for the direct observation of exterior orientation data (Schwarz, 1993; Ackerman, 1995; Skaloud, 1996). Increasingly, onboard GPS/INS data collection is part of the service offered by aerial companies. Many software systems can now access such data to reduce or eliminate the need for ground control points. In many cases, it is the enabling technology for the collection of light detection and ranging (lidar), synthetic aperature radar, and multibeam sonar data. It was not until recently that the remote sensing and photogrammetric mapping community gave serious attention to using integrated GPS/INS technology to measure camera attitude to an accuracy that permits photogrammetric mapping without conventionally determining the camera exterior orientation parameters from aerial triangulation. The process of direct observation of exterior orientation data with airborne integrated GPS/INS is often referred to as “direct measurement,” “direct sensor orientation,” “direct exterior orientation,” and “direct geocoding.” However, throughout this paper, the authors will refer to this process by the more widely used term “direct georeferencing.” Many earth science mapping applications, especially in rural or remote areas, can be realized more efficiently and economically with the reduction of ground control and tie point data. This can be achieved by direct georeferencing of the exterior orientation of an imaging sensor using an integrated system comprising a GPS receiver and an INS component. The GPS produces precise positions that are subject to errors arising from loss of satellite lock and resolution of phase ambiguities. Information from the INS can be used to correct these errors while the GPS data are used to continuously calibrate the INS. Hence, when used together, the two components may provide an appealing solution to positioning and orientation problems in mapping applications. Nevertheless, the use of this technology is not without its own technical problems, and an understanding of its limits and usefulness is critical for addressing mapping applications. A crucial issue to mapping applications and direct georeferencing is the accuracy, scale, and consistency achievable by an integrated system.
2
Numerous documented GPS/INS-related field tests have been conducted over the years (Cramer, 1999; Cramer, Stallmann, and Haala, 2000). These tests were flown over well-surveyed sites and were carefully evaluated by private and public institutions in collaboration with Applanix Corp. The results from these tests, which measured the difference between the Applanix
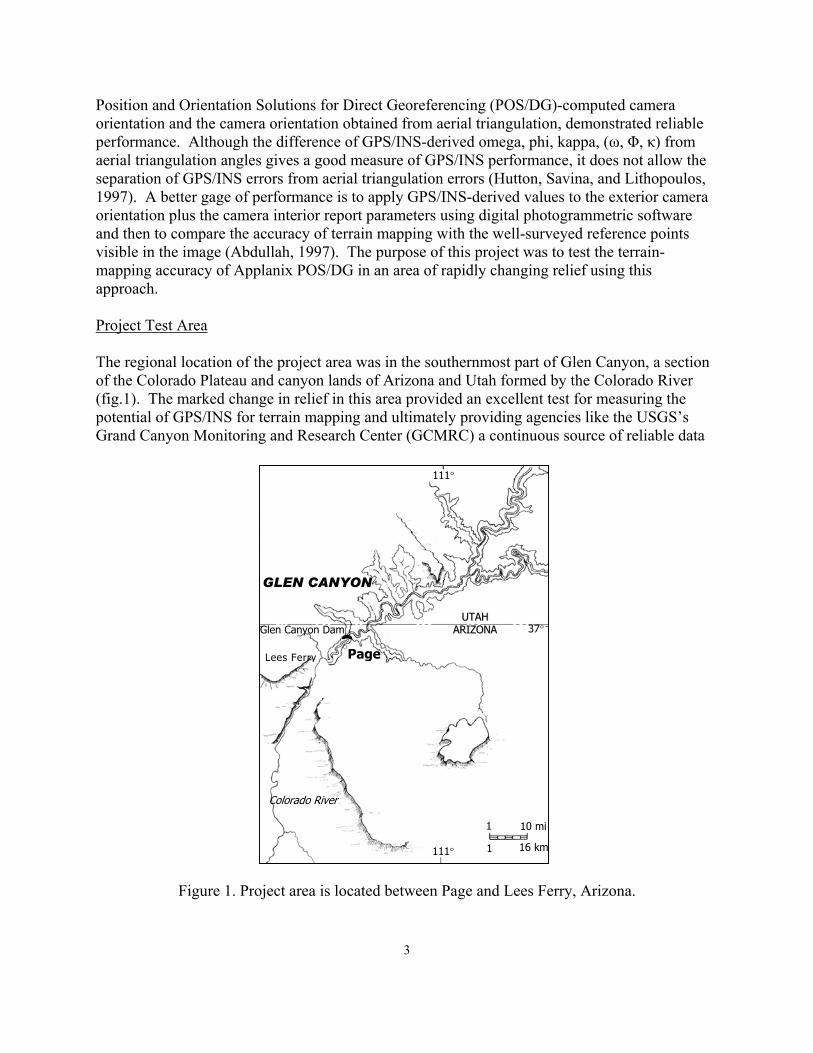
Position and Orientation Solutions for Direct Georeferencing (POS/DG)-computed camera orientation and the camera orientation obtained from aerial triangulation, demonstrated reliable performance. Although the difference of GPS/INS-derived omega, phi, kappa, (ω, Φ, κ) from aerial triangulation angles gives a good measure of GPS/INS performance, it does not allow the separation of GPS/INS errors from aerial triangulation errors (Hutton, Savina, and Lithopoulos, 1997). A better gage of performance is to apply GPS/INS-derived values to the exterior camera orientation plus the camera interior report parameters using digital photogrammetric software and then to compare the accuracy of terrain mapping with the well-surveyed reference points visible in the image (Abdullah, 1997). The purpose of this project was to test the terrain-mapping accuracy of Applanix POS/DG in an area of rapidly changing relief using this approach. Project Test Area The regional location of the project area was in the southernmost part of Glen Canyon, a section of the Colorado Plateau and canyon lands of Arizona and Utah formed by the Colorado River (fig.1). The marked change in relief in this area provided an excellent test for measuring the potential of GPS/INS for terrain mapping and ultimately providing agencies like the USGS’s Grand Canyon Monitoring and Research Center (GCMRC) a continuous source of reliable data
r
Lees Ferry
Colorado Rive
Glen Canyon Dam
GLEN CANYON
1 16 km
10 mi1
111°
111°
37°
Page
UUTTAAHH AARRIIZZOONNAA
Figure 1. Project area is located between Page and Lees Ferry, Arizona.
3

to study landscape and habitat changes along the Colorado River corridor. The canyon lands, which date back nearly 2 billion years on the bottom and 250 million years at the top, are a rough succession of resistant beds forming deep, narrow gaps with vertical and overhanging cliffs separated by slopes and valleys carved out by the Colorado River beginning 5 to 6 million years ago (Zimmer, 2001). During 1869 to1872, U.S. Army Major John Wesley Powell explored the Glen Canyon as part of the expedition of the Colorado River (Powell, 1875). As many a fisherman and passer-by will affirm, the cliffs, riverbanks, and sandbars of the canyon offer nesting places to rock wrens, canyon wrens, peregrine falcons, ravens, and high-flying condors. Since the completion of the Glen Canyon Dam in 1963, the water temperature downriver averages 46º F (8º C) year round. This constant flow of clear, cold tail water, along with the introduction of trout and shrimp-like scuds, eliminated most of the native fish, such as the Colorado squawfish and the humpback chub (Ray Hall, U.S. Park Ranger, oral commun., September 26, 2001). The dam-regulated flows decreased the sediment supply and have affected the habitats of the endangered willow fly-catcher and Kanab ambersnail. The canyon’s ecosystem and desert environment are also home to deer mice, pocket mice, packrats, spotted skunks, ringtail cats, gray foxes, beavers, bobcats, coyotes, jackrabbits, antelopes, squirrels, badgers, and mule deer. Seasonal wildlife includes a large population of ducks and some Canadian Geese. Plants such as joint-fir or Mormon Tea (Ephedra), Horsetail (Equisetum L.), salt cedar or Tamarix (Tamarix gallica), and varieties of cacti dominate the canyon ecosystem (Gaines, 1957).
DIRECT GEOREFERENCING CONCEPT
The determination of the exterior orientation parameters is a fundamental requirement for the geometric evaluation of terrestrial and remotely sensed images. Conventionally, this is accomplished by an indirect approach of applying a number of known ground control points and their corresponding image coordinates. Using a mathematical model for the transformation between object and image space, we can calculate the exterior orientation to relate the local image coordinates to the global reference coordinate system. This process is accomplished with the spatial resection of single images, a method that is generalized to an aerial triangulation of multiple frames or images (Skaloud and others, 1996). The photogrammetric collinearity equations are applied to connect overlapping images by means of tie points and to relate the local model coordinates to the global reference coordinate system through control points. Consequently, exterior orientation parameters for the perspective center of each image can be estimated as one group of the unknown parameters within a least squares adjustment. In the direct approach, the GPS and the inertial measurement unit (IMU) provides measurement of the true physical position and orientation of the camera or sensor (Schwarz and others, 1993). Unlike the indirect approach of aerial triangulation, the exterior orientation parameters are determined independently of the camera or sensor. Before using the position and orientation components (GPS antenna and IMU) for sensor orientation, we must determine the correct time, spatial eccentricity, and boresight alignment between the camera coordinate frame and IMU. The calibration of the GPS/IMU and camera is vital since minor errors will cause major inaccuracies in object point determination.
4

SYSTEM CONFIGURATION AND CALIBRATION Sensor Configuration The commercial airborne integrated GPS/INS used in this project is the POS AV 310 from Applanix Corp., Richmond Hill, Ontario, Canada. The POS AV-DG package comprises four main components: (1) a dual-frequency L1/L2 carrier phase embedded GPS receiver (NovAtel MiLLennium), (2) a POS IMU, (3) the POS computer system, and (4) the POS/DG postprocessing software. Several occupied geodetic monuments (Airport, T96, Davian, Signal Hill, Navajo Point, Flagstaff NCMN, and L404) along the canyon rim served as base stations. In addition, 11 aerial panel points with documented horizontal and vertical coordinates were placed along the flight corridor to test the accuracy of the POS/DG position and height information later. For the test, the POS IMU was rigidly mounted on a Wild RC30 aerial camera. The GPS antenna was centered above the camera on top of the fuselage of the National Oceanic and Atmospheric Administration’s (NOAA) Cessna Citation jet. The integration of the collected POS/DG raw data was computed at the camera perspective center using the Applanix POS/DG Post Processing software. Boresight Calibration The spatial offsets between the different sensor components have to be identified to relate the position and orientation information provided by the GPS/IMU to the perspective center of the camera. The angular and linear misalignments between the POS IMU body frame and the imaging sensor are referred to as “boresight” components. Immediately after the actual fly-over of the Glen Canyon project area, the test flight for the boresight calibration was carried out over a well-surveyed range in the nearby Hopi Reservation. Aerial photographs were collected at a flying height of 1,524 m (5,000 ft) and a photographic scale of 1:10,000. Three rows of 7 targets consisting of 21 photographs with 60 percent forward and 30 percent side overlap were collected. The test range covered a 4.5- x 14.8-km (2.8- x 9.2-mi) area. Static GPS data were collected using several base stations (Airport, T96, Davian, Signal Hill, Navajo Point, Flagstaff NCMN, and L404) located near the test range to check for any systematic errors caused by different baseline length. To resolve the boresight transformation, the National Geodetic Survey (NGS) compared the GPS/IMU positioning/orientation results with the aerial triangulation solution. The NGS then used data from the POS/DG and aerial triangulation from the flight to resolve the fixed misalignment angles between the IMU and the camera.
TERRAIN MAPPING
The NOAA carried out the overflight of the project area on September 6, 1999, at altitudes between 3,200 to 3,500 meters (10,500 to 11,500ft). The acquired misalignment angles from the Hopi Range test flight were applied to the POS/DG data, and the camera perspective center coordinates (in easting, northing, and elevation) and the camera orientation parameters (in angles ω, Φ, κ) were computed by Applanix. The POS/DG-computed data at camera perspective center, as well as the camera’s internal geometry and lens characteristics, were then applied by the USGS to geometrically correct the scanned aerial frames (4027 through 4032, see fig. 2) using
5

the Softcopy Exploitation Tool Set (Socet Set) software (Socet Set ® is a trademark of BAE Systems Solutions, Inc.).
Figure 2. Coverage of aerial frames applied in the evaluation.
Surveyed Reference Points To synchronize with the POS/DG data collection and to know the precise grid coordinate of any point in the project area, a field team directed by the GCMRC placed 15 aerial panels along the corridor of the Glen Canyon before the overflight. Many of these panels were placed over old survey markers. To validate the positional accuracy of the panels, the U.S. Geological Survey (USGS) conducted static surveys of these old monuments in September 2001. The selected points were occupied for over 30 minutes at 5-second intervals using two Ashtech Z-12 receivers. Simultaneous collection from the Flagstaff (FST1) Continuous Operating Reference Station (CORS) at 5-second intervals provided the RINEX files (range and carrier phase or binary measurements, predicted orbital coordinates or ephemeris data, and site information files) used in the postprocessing with Ashtech Solutions version 2.5. Traditional setup of the antenna over the survey marker was used in these static surveys. For geodetic coordinates and details about each survey marker revisited, see appendix A of this report. In addition to their use as panel points, the survey markers in the Lees Ferry area proved invaluable for checking the accuracy of auxiliary GPS instruments. The Ashtech Z12 GPS rover and the simultaneous collection of FST1 CORS produced postprocessed differentially corrected 6

positions that were used in determining the horizontal and vertical accuracy levels of the auxiliary GPS instruments. Experimentation with an OmniSTAR Model 3000LR12 (an integrated RT-DGPS system for GPS observations and reception of broadcast range correction) produced differentially corrected positions with horizontal and vertical accuracies at the submeter level. The Rockwell PLGR II with PPS for point positions determined by autonomous methods produced horizontal and vertical accuracies in the decimeter-to-meter range. (See appendix B). Comparison with Survey Reference Points Three stereoscopic models were generated with Socet Set photogrammetric software using the POS/DG computed data and the camera’s report parameters (fig. 3).
t
Model Setup (Y-parallax removal)
Stereo Model Generation
Exterior Orientation(removal of
elevation distortions)
Comparison of X,Y,Z, coordinates of known aerial
panel points with image values
Interior Orientation(removal of
optical dis ortions)
Mapping AccuracyAssessment
Documentation
Image processed inLocal Space Rectangular coordinates system (Cartesian), WGS84 Datum, ellipsoid heights, and meter units
GPS/IMU derived EO (X, Y, Z, ω, ϕ, κ)
output provided by Applanix in UTM
POS/DG COMPUTED DATA
AT CAMERA PERSPECTIVE
AERIAL CAMERA REPORT
Camera Calibration Data(focal length, lens distortions, fiducial coordinates, etc.)
Scanned Aerial Photo
Figure 3. The flow process applied in this study for generating the stereomodels for testing the accuracy of Position and Orientation Solutions for Direct Georeferencing of aerial photographs. 7

In each stereomodel, a thorough examination for undesirable y-parallax or disparity was conducted by moving between the river corridor and the canyon rim of the interior and corners of the stereomodel, respectively. The results varied from negligible to excessive. In one model the effect of y-parallax made it difficult to perform reliable measurements. Absolute orientation was then examined using the horizontal and vertical coordinates of the visible panel point in the three models and the values of their corresponding surveyed reference positions. The difference between the logged surveyed reference positions and corresponding panel points displayed in the stereoimage were measured on the digital photogrammetric workstation. The difference was determined by subtracting the values of the panel point from the surveyed reference position. The measured panel point values in the stereoimage were roughly parallel to the ground level at an average vertical positional bias of +2.59 m. Figure 4 and table 1 show the results of the comparison of the panel point coordinates in the stereoimages against the values of the logged survey referenced positions.
2.00
4.00
Delta Z
-0.60
-0.40
-0.20
0.00
0.20
0.40
0.60
Delta Y
Delta X
D i f f e r e n c e in me t e r s
1 5 6 7 8 2 3 4
Survey Reference Point Figure 4. Difference, in meters, between coordinate values of ground-surveyed reference points
and corresponding panel points measured on the digital photogrammetric workstation.
8

+2.58 - 0.03- 0.02G307B 7
+1.78 +0.35 +0.19 214 6
+1.88 +0.08+0.16212 5 +3.11 +0.16+0.56211 4 +3.02 +0.24+0.19115 3
+3.28 - 0.05 - 0.02114 2
+2.48 +0.19 +0.07 6BC 1
Delta Z Delta Y Delta X PANEL # REF.
+2.59 m +0.14 m +0.16 m Average
Table 1. Statistical rundown of the difference between the ground-surveyed reference points and
corresponding panel points measured on the digital photogrammetric workstation.
A comparison using the same ground-surveyed reference points shown above with Aeroscan ALMS lidar data collected by the GCMRC in late March 2000 at a flight altitude of 3,048 m (10,000 ft), with a pulse rate of 15 kHz and a scan rate of 13 Hz, showed a lower vertical positional bias (0.21 m to 0.55 m) than those found in the processed POS/DG of aerial photographs. Although there was some improvement in the vertical accuracy of the DG lidar system measurements, the lower vertical positional bias of the lidar data still does not meet accuracy standards for large-scale mapping and could result in significant errors in studies related to volume determination.
DISCUSSION OF RESULTS Although the horizontal positioning results proved accurate, the higher than normal vertical positional bias results of this study do not meet National Mapping Accuracy Standards (NMAS) or American Society of Photogrammetry and Remote Sensing (ASPRS) accuracy standards for large-scale mapping. Other authors made comparable findings (for example, Cramer, 1999; Colomina, 1999; and Greening and others, 2000). Greening suggested 1:8,000 scale as the “lower limit below which airborne GPS errors can become relatively dominant to the point where a significant reduction in the number of ground control is not possible.” Several factors may have contributed to the higher than normal vertical positional bias between the coordinate values of surveyed reference points and corresponding aerial panel positions in the image. The most demanding applications of large-scale airborne mapping, with required mapping accuracy at the 10- to 20-cm range, call for higher precision of the exterior orientation, which is largely dependent on the imaging sensor and flight altitude. In this study, a 153-mm calibrated focal length of the Wild RC30 and high-flying height of 3,200 to 3,500 m (10,500 to 11,500 ft) was used. In accordance with a typical soft C-factor (Light, 1999), a suggested minimum of 1,000 m (3,300 ft) flight altitude with the 153-mm focal length camera may have
9
resulted in lower RMS values and achieved a higher precision desirable in large-scale mapping. Further, the aerial photographs flown separately for the boresight calibration were collected with the same camera, but at a flying height of 1,524 m (5,000 ft), which may have caused a shift in the Z value. The influence of ground position errors resulting from imaging sensors and flight altitudes have been dealt with in detail (Grejner-Brzezinska, 1999). Another problematic concern of GPS/INS-derived position orientation data is the stereo-model residual parallax issue. During the setup of the stereomodels, it was found that the y-parallax varied significantly. In one of the models, the effect of y-parallax made it awkward to take reliable measurements. The y-parallax disparity took the form of an unusually high average difference between the coordinate values of surveyed reference points and corresponding panel points, as well as imperfect, out-of-focus three-dimensional images in the display of the digital photogrammetric workstation. Several geodetic factors also may have contributed to the high RMS values in the exterior orientation solution. Because of the marked difference in canyon relief and changes in bedrock Densities, there exists a “deflection of the vertical” (that is, an angle of departure of the gravity vector from the corresponding ellipsoidal normal). In the canyon area where there are marked geoidal undulations, the separation between the geoid and ellipsoid can vary rapidly and in a nonlinear manner. Although the lidar data results were lower in vertical positional bias than those found in the processed POS/DG of aerial photographs, several factors may have played a part in their high elevation measurement. These factors range from the lidar processing algorithms to the source of beam. Factors originating from the source of the beam include problems with the 1) lever arm and GPS position, 2) INS gyros (drift and alignment), 3) laser frame (misalignment in INS), 4) scanning (mirror), and 5) range (timing, bias, noise). Any of these factors not being adjusted properly may have resulted in mismatched profiles and introduced elevation errors.
RECOMMENDATIONS The higher than normal vertical positional bias results of this study did not meet large-scale mapping accuracy standards. It is important to keep in mind the limitations of airborne integrated GPS/INS mapping technology and to balance the criteria for its use against practical considerations of large-scale mapping in canyon-like or mountainous terrain. For the time being, precision large-scale mapping of 1:8,000 scale or better will require a combination of airborne GPS/INS and aerial triangulation to exploit the benefits offered by direct external orientation data and minimize potential mapping accuracy limitations. Additional research is needed to examine the (1) influence on mapping accuracy of geodetic complexities in areas of marked changes in relief and the relationship of IMU performance to significant gravity anomalies and deflection of the vertical; (2) output of POS/DG computed data at camera perspective center in a Cartesian coordinate system to replicate the true spatial geometry of the object space; (3) large scale mapping application of the “Total Orientation Procedure” concept (Colomina, 2000) for optimal sensor orientation using a combination GPS/INS and aerial triangulation; (4) adequate rigidity in the relationship between IMU and 10

camera reference frame; and (5) accuracy limits of GPS-aided INS of LiDAR data for meeting NMAS and ASPRS standards
ACKNOWLEDGMENTS The authors would like to thank Herb Grossman, USGS-WRD (retired), who generously provided his time to help in conducting the fieldwork, and Raymond M. Hall, National Park Service, whose cooperation at Lees Ferry was outstanding. Also thanks for the offsite support provided by Mike Liszewski, GCMRC, Flagstaff, Ariz., Fidel Paderes, BAE, San Diego, Calif., and Mike Aslaksen, NGS-NOAA, Silver Spring, Md. The USGS provided the funding for this research project.
REFERENCES Abdullah, Q., 1997, Evaluation of GPS-Inertial Navigation System for airborne photogrammetry: ASPRS/MAPPS Softcopy Conference, Arlington, Va. Ackerman, F., 1995,. Sensor and data integration - The new challenge: Integrated Sensor Orientation ISPRS Workshop, Germany. Colomina, Ismael, 1999, GPS, INS and aerial triangulation: What is the best way for the operational determination of photogrammetric image orientation?: ISPRS 2000, v. 32, Muchen. Colomina, Ismael, 2000, T.O.P. concepts for sensor orientation, ISPRS 2000, v. 33, Amsterdam. Cramer, Michael, 1999, Direct geocoding: Is aerial triangulation obselete; Fritsch/Spiller (eds.), Photographic Week 1999, Heidelberg, Germany, Wichmann Verlag, p. 59-70. Cramer, M., Stallmann, D. and Haala, N., 2000, Direct georeferencing using GPS/Inertial exterior orientations for photogrammetric applications; International Archives of Photogrammetry and Remote Sensing, v. 33, part B3, p. 198-205. Gaines, Xerpha, 1957, Plants of the Glen Canyon: Plateau Technical Series, Museum of Northern Arizona, v. 30., no. 2, p. 31-34. Greening, W.J. Trevor, Schickler, Wolfgang, and Thorpe, Anthony J. 2000, The proper use of directly observed orientation data: Aerial Triangulation Is Not Obsolete, ASPRS 2000 Proceedings, Washington, D.C. Grejner-Brzezinska, Dorota A., 1999, Direct exterior orientation of airborne imagery with GPS/INS system: Performance analysis, navigation: Journal of the Institutute of Navigation, v. 46, no. 4, Winter 1999-2000, p. 261-270.
11

Hutton, J. Savina, T., Lithopoulos, L., 1997, Photogrammetric applications of applanix’s position and orientation system; ASPRS/MAPPS Softcopy Conference, Arlington, Va. Light, Donald L., 1999, C-Factor for softcopy photogrammetry; Photogrammetric Engineering & Remote Sensing, v. 65, no. 6, p. 667-669. Powell, J.W., 1875, Exploration of the Colorado River of the West: 1869-72, Washington, D.C., Government Printing Office. Schwarz, K.P., Chapman, M.A., Cannon, M.E., and Gong P., 1993, An integrated INS/GPS approach to the georeferencing of remotely sensed data: Photogrammetric Engineering & Remote Sensing, v. 59, no. 11, p. 1667-1674. Skaloud, J., Cramer, M., Schwarz, K.P., 1996, Exterior orientation by direct measurement of camera position and attitude: ISPRS International Archives of Photogrammetry, v. XXXI, part B3, Vienna, Austria. Zimmer, Carl, 2001, How old is it?: Journal of the National Geographic Society, v. 200, no. 3, Washington, D.C., p. 78-102.
12

APPENDIX A
FIELD RECORD SUMMARY – GLEN CANYON 9/24-27/01 SITE NAME
COORDINATES1 SURVEY MARKER STAMP MARKING
GCP 6BC LAT: 36° 52' 28.66827" N. LON: 111° 33' 27.78332" W. ELLIP. HT: 939.401 meters MSL: 962.824 meters
92.5 mm in diameter brass survey marker
BUREAU OF RECLAMATION
GCP 211 LAT: 36° 51' 48.14314" N. LON: 111° 34' 37.31705" W. ELLIP. HT: 936.652 meters MSL: 960.055 meters
92.5 mm in diameter brass survey marker
U.S. COAST & GEODETIC SURVEY
GCP 212 LAT: 36° 51' 57.56024" N. LON: 111° 35' 12.31421" W. ELLIP. HT: 930.269 meters MSL: 953.664 meters
60 mm in diameter aluminum survey marker
BANNER INC.
GCP 214 LAT: 36° 51' 48.23613" N. LON: 111° 35' 55.43807" W. ELLIP. HT: 939.976 meters MSL: 963.352 meters
12.7 mm in diameter unthreaded rebar
NO STAMP MARKING
GCP 114 LAT: 36° 53' 11.18031" N. LON: 111° 31' 51.77007" W. ELLIP. HT: 951.340 meters MSL: 977.784 meters
92.5 mm in diameter brass survey marker
BUREAU OF RECLAMATION
GCP 115 LAT: 36° 53' 10.41023" N. LON: 111° 31' 10.30107" W. ELLIP. HT: 947.940 meters MSL: 971.383 meters
No survey marker; X 10x10 Bldr RL 9- mile
NO STAMP MARKING
GCP G307B LAT: 36° 52' 28.89023" N. LON: 111° 34' 00.98043" W. ELLIP. HT: 935.380 meters MSL: 958.799 meters
No survey marker; photo location RL
NO STAMP MARKING
¹ NAD83/GRS80; mean sea level (MSL) heights derived from NAVD88 values (NAD83+Geoid99)
13

APPENDIX B POSITIONAL COMPARISON
OF GROUND CONTROL POINT #214 (NAD83/GRS-80)
Difference,
in meters OmniSTAR LR12
(RT-DGPS)Ashtech Z-12* (STATIC SURVEY)
0.662 36° 51′ 48.195″ NLat: 36° 51′ 48.23613″ N
Long: 111°35′ 55.43807″W. -0.583 111° 35′ 55.463″ W. Ellip. Height: 939.976 m 939.692 m -0.284 PLGR II
(PPS)
36° 51′ 48.15″ N. 1.386 111° 35′ 55.60″ W. -3.779
945 m -5.024
GCP #214 Old Coordinates
(Unknown method) GCP #214
36° 51′ 48.23″ N 0.099 111° 35′ 55.44″ W. -0.045
939.280 m -0.684
Processed Image Display Coordinates(Socet Set Workstation)
36° 51′ 48.258″ N -0.354 111° 35′ 55.446″ W. -0.187 941.760 m -1.784
* GPS static data collected at 5-second data rate on September 25, 2001; post-processed with corresponding RINEX file downloaded from NGS National FTS1 CORS Web Site
14