positioning capability of anchor handling vessels in deep ... · original article positioning...
TRANSCRIPT

ORIGINAL ARTICLE
Positioning capability of anchor handling vessels in deep waterduring anchor deployment
Xiaopeng Wu • Giri Raja Sekhar Gunnu •
Torgeir Moan
Received: 8 March 2014 / Accepted: 29 November 2014 / Published online: 3 January 2015
� The Author(s) 2014. This article is published with open access at Springerlink.com
Abstract The aim of this paper is to study anchor han-
dling vessel (AHV) thrust capacity during anchor deploy-
ment, especially in a deep water situation when high
external forces are expected. The focus is on obtaining
realistic external forces and evaluating the positioning
capability of an AHV. Wind, wave and current loads on the
AHV are considered. Current load on the mooring line,
which is usually excluded in practice, is included in the
model as well. The thrust utilisation plot, a concept widely
used in the Dynamic Positioning system, is proposed to
illustrate the positioning capability of an AHV. The
Bourbon Dolphin accident was investigated as a case study
using the proposed model and methodology. First, load
analysis was performed. The results indicated the impor-
tance of applying a reasonable current profile and taking
the mooring line effect into account. Then, thrust utilisation
plots for normal and accident conditions were compared.
The comparison showed that the Bourbon Dolphin might
have been in the most unfavourable weather direction in
terms of position capability during the accident event.
Finally, the effect of mooring line configuration was
studied. The results signified that a very long mooring line
might challenge the propeller thrust capacity and the pro-
peller thrust loss due to lateral thrust usage needs to be
considered. Such an analysis and documentation prior to
the commencement of the operation can be used for
defining vessel specific limitations and selecting the proper
vessel for a specific task.
Keywords Anchor handling � Drifting � Positioningcapability � Thrust utilisation plot � Current profile
1 Introduction
Anchor handling operation (AHO) is considered to be one
of the potentially most hazardous and demanding marine
operations in the offshore industry. Characterised by bad
weather, long working hours and high-tension load, AHOs
are inherently dangerous, especially in a deep water situa-
tion when high external forces are expected. Meanwhile, the
AHOs have a significant economical influence on the off-
shore projects. According to Saasen et al. [1], AHOs may
carry 10–20 % of the total well exploitation cost because
hiring the anchor handling vessel (AHV) is expensive.
Considering daily hire rates on the spot market, costs may
be as high as 900,000 Norwegian krones. The safety and
economic factors make the AHO even more important.
The planning and execution of AHO are of significance.
Skilled crew and well-designed vessels are needed to fulfil
the tasks. Any miscalculation or misjudgment prior or
during the operation might lead to project delay and eco-
nomic loss. In the extreme cases, miscalculation or mis-
judgment can lead to casualties. The risk associated with
AHO was recently demonstrated by the Bourbon Dolphin
accident in 2007 [2], which claimed eight lives. The vessel
lost stability due to a series of complex circumstances
during the job in the Rosebank oilfield. Another loss of
AHV was reported in 2003 [3]. The Danish vessel ‘‘Stevns
Power’’ lost stability during an anchor retrieval operation.
Eleven people died in this accident. Both of the above
X. Wu (&) � G. R. S. Gunnu � T. Moan
Centre for Ships and Ocean Structures (CeSOS), NTNU,
Trondheim, Norway
e-mail: [email protected]
G. R. S. Gunnu
Global Maritime AS, Stavanger, Norway
123
J Mar Sci Technol (2015) 20:487–504
DOI 10.1007/s00773-014-0301-2

accidents were characterised by a short time window
before the vessel capsized. Despite only two instances of
capsizing AHVs in the past decade, the consequences are
fatal. How to enhance the safety level of the AHOs remains
a challenging topic for all relevant societies, companies
and research institutes.
To date, the AHVs are still treated as normal supply
vessels with respect to stability requirements. These
requirements are not sufficient to address the complexity
and the forces involved in the AHOs. Due to huge mooring
loads and the constraint of the mooring line hanging over
the stern, these vessels face a high risk of capsizing. Taking
the mooring line effect into account is indeed necessary,
and how to modify the existing rules and regulations or
establish related criteria would be of interest. For example,
Gunnu and Moan [4] proposed a modified stability criterion
for AHVs in the operational phase, in which the initial heel
of the vessel due to mooring load was considered.
Situation awareness can also help to reduce the risk
level. The AHOs are usually under tight schedules. The
desire to be on schedule could hamper the safety of the
operations. Both of the two notable accidents mentioned
had shown such a desire, which might be one cause of the
misjudgement. The master on board needs condensed and
easily understood information about the situation to make
good decisions. Hukkelas [5] proposed a new anchor
handling concept to increase the safety. Situation aware-
ness is the key in this concept. The stability margin is
calculated and visualised in real time, which provides the
master much more information about the vessel stability
than before. Therefore, the master has a higher chance of
making rational decisions.
Because the AHO is a series of complex activities, it
would be difficult to secure safety for just one or two
measures. More risk-mitigation measures need to be
developed and added into the overall picture of the oper-
ation. For example, the risk influencing factors associated
with the Bourbon Dolphin accident have been addressed by
Gunnu et al. [6]. The considerable vessel drift during the
AHO is considered as an initiating event for this accident.
The track plot for the Bourbon Dolphin before the accident
is shown in Fig. 1. The red line in the figure indicates the
track for the Bourbon Dolphin from the commencement of
deploying mooring line no. 2 until the accident. It is shown
that in the early stage the vessel was capable of following
the planned path of the mooring line. However, the vessel
began to drift gradually and continually, paying out more
mooring line under unfavourable weather conditions. The
blue line shows the track for another AHV at the site that
tried to help the Bourbon Dolphin. The black arrows are
added by the authors to indicate the mooring line orienta-
tion and weather direction. This information will be
explained further in the paper.
Extensive drift for the AHV can be unfavourable and
even hazardous. First, extensive drift compromises the
functionality requirement of the vessel, which is to deliver
the mooring line in the desired position. Moreover,
extensive drift could compromise safety, which requires
maintaining the stability of the vessel. When the master
tries to regain the correct course from an extensive drifting
condition, it will be very tempting for him to manoeuvre
the vessel in a way that develops a large angle of attack (b,the angle between the mooring line and the ship centre
line). A plan view of an AHV drifting off course and trying
to get back to course is illustrated in Fig. 2. A larger angle
of attack means a larger lever arm for the vertical com-
ponent of the morning load and a larger transverse com-
ponent of the morning load. The combination of these two
leads to larger overturning moment on the vessel which can
be hazardous from the vessel stability perspective. There-
fore, it is crucial to prevent significant drift and a large
angle of attack during AHO, especially in deep water
operations due to higher external loads and mooring loads
are expected in these operations.
The hazardous conditions related to vessel stability can
be averted by means of taking proper decisions and by
executing appropriate ship handling skills. In practice,
according to the opinions expressed by AHV masters, the
hazardous misaligned mooring load can be handled either
Fig. 1 Track plot of the Bourbon Dolphin (red line) [2] (colour figure
online)
Phase 1:On course
Phase 2:Slightlyoff course
Phase 3:Continuelyoff course
Phase 4:Manoeuvre back to course
βAngle ofAttack
Drift
Mooring line courseAHV
Fig. 2 Off course
488 J Mar Sci Technol (2015) 20:487–504
123

by means of reducing the angle of attack (the vessel
heading is adjusted such that the misaligned mooring line is
in line with vessel heading) or by reducing the mooring line
tension. Usually, the master will give priority to the former
one because this is an optimised solution at this phase to
fulfil both functional and safety requirements. This is
achieved by correcting AHV heading first so that the angle
of attack will be small and the AHV will be in the phase 1
condition in Fig. 2 in a normal operation. However, lack of
ship handing capacity (poor ship positioning capability), or
poor ship handling skills (incorrect maneuvering action), or
a combination of these two can lead to an extensive drift
condition. This might subsequently lead to the phase 4
condition in Fig. 2 when the master try to regain the correct
course. The safety, i.e. the stability of the AHV, will then
become more important at this stage and the functionality
requirement shall become less significant. In such a haz-
ardous situation, the master might reduce the propulsion
thrust to reduce the mooring line tension, or even release
the mooring line (by activating emergency releasing or
quick releasing system) so that the AHV capsize situation
can be avoided.
To prevent the unfavourable consequence or hazardous
situation caused by the extensive drift, it is essential to
have an awareness on the vessel positioning capability.
When selecting the proper vessel for an anchor handling
task, however, the major concern is normally put on
available bollard pull (the maximum pulling force that a
vessel can exert on another vessel or object), winch
capacity and deck storage space. It seems that the posi-
tioning capability is not treated with enough care. The
possible consequence is demonstrated in the Bourbon
Dolphin accident. If the positioning capability of the vessel
was well understood before the operation commenced, the
master might have decided to delay the operation until
more favourable weather condition came. As a result, there
is a need to study the positioning capability of the AHV
during anchor deployment. A method needs to be devel-
oped to evaluate the positioning capability of the AHV to
help all parties involved in the operation gain a better
picture before the operation commences. Useful informa-
tion about the vessel position capability can then be gen-
erated, and operation limitation can be obtained. On the
basis of this information, critical scenarios can be estab-
lished as an input to simulator training.
The aim of this paper is to establish and use a detailed
numerical model to study AHO during anchor deployment.
Focus is put on obtaining realistic external forces on the
vessel and evaluating the positioning capability of an AHV.
The thrust utilisation plot is proposed to demonstrate the
AHV positioning capability. The remainder of the article is
organised as follows. The next section gives a detailed
description of the main scenario and the flow chart in this
work. In Sect. 3, the numerical methodology involved are
addressed. Then the Bourbon Dolphin is studied as a case.
Analysis and results are presented in Sect. 4. Finally, some
conclusions are drawn in Sect. 5.
2 Scenario description and flow chart
There are various types of AHOs, depending on location,
equipment on vessel, mooring methods, etc. The practical
aspects of AHOs are discussed extensively by Ritchie [7]
and Gibson [8]. Among different practical means, one
basic method uses the permanent chaser pendant (PCP)
system which mainly includes a wire hanging permanently
attached to the rig used for chasing out anchors, and a ring
fitted over the anchor line connected to the pendant wire.
The mooring line can be handled by the rig or by the
anchor handling vessel through this system. This method is
the least complex method in anchor handling.
Within a PCP anchor handling operation, one common
scenario is that the AHV delivers the mooring line to the
desired location while the rig pays out the mooring line.
This basic but important scenario is illustrated in Fig. 3.
During this phase, the vessel is subjected to environmental
forces coming from wind, swell, wave and current. In
addition, the vessel carries mooring load coming from the
mooring line. The magnitude and orientation of the
mooring load vary during the whole operation, based on the
total pay-out length of the line, the shape of the line, the
speed of the vessel and the environmental conditions. The
more mooring line has been paid out, the higher the force
that will be exerted on the vessel. The vessel should have
sufficient bollard pull to counteract the mooring load and
provide propulsion forward. To maintain the desired
heading, the lateral forces should be balanced by the
thrusters and azimuth.
The Bourbon accident happened in this scenario, which
makes the scenario very typical and worth studying.
According to the accident report, there were several defi-
ciencies in the rig move procedure relevant to this scenario.
First, the current load on the mooring line was not included
when estimating the static loads on the vessel, resulting in
the underestimation of the static loads on the vessel and
might be leading to the considerable drift. In fact, the
vertical current profile, as will be discussed in this paper,
αD
AHVRig
Fig. 3 Typical anchor handling operation
J Mar Sci Technol (2015) 20:487–504 489
123

has a significant influence on the mooring line loads.
Second, when the side thrusts are running at full capacity,
the vessel bollard pull would show a significant drop. The
vessel could then be pulled backward by the huge mooring
load and could not finish the task. To overcome the defi-
ciencies mentioned above, the thrust utilisation plot which
is a concept in the Dynamic Positioning (DP) system, is
introduced in this study.
DP capability analysis is an important part in the design
of DP vessels as well as DP-related operations. The results
are usually presented in the form of capability plots, which
are polar plots indicating the limiting mean wind speed
envelope for the vessel. More details about the basics of DP
capability plots can be found in [9]. When the design sea
state is predefined, the DP capability can be presented by
means of a thrust utilisation plot, which shows the ratio
envelope between the required thrust and the maximum
available thrust [10]. The purpose of the DP capability
plots and the thrust utilisation plots is to determine the
position keeping ability of the vessel under various envi-
ronmental conditions. In the guidelines for the safe oper-
ation of DP vessels, it is mentioned that the DP capability
plots should be used in the risk assessment process to
determine the safe working limits at offshore installations
(see [11]). Because in AHO, the operation weather limit is
usually predefined, the thrust utilisation plot is more suit-
able in this study.
The DP function, except when very small tolerance of
positioning is required, is normally not activated by mas-
ters during anchor deployment, possibly due to that the
vessel being in constant motion and the continued com-
munication between different parties. The masters are
normally controlling the vessel manually or keeping the
auto head condition. However, every master has his own
experience and consequently different control strategy. As
a result, it will be difficult to propose a general model to
simulate the actions of the masters. The aim of the thrust
utilisation plot in this paper, is to propose a reasonable
measurement to estimate the capacity of the AHV in the
planning stage, but not to look into details of a specific
control strategy of a specific master.
In general, the typical AHV forward speed during
anchor deployment is about 2–5 knots. Such a speed is
considered to be quite low. In an unfavourable weather
condition, when maintaining vessel position becomes the
main task, the speed could be even lower. Moreover, as
mentioned, the master will try to keep the AHV heading in
line with the mooring orientation to avoid large angle of
attack in a normal operation. Based on these two facts, the
forward speed effect is therefore neglected and the angle of
attack is assumed to be zero.
The flow chart of the proposed method is presented in
Fig. 4. First, based on the given environmental conditions,
which are normally given by sea-keeping analysis of the
AHV, the mean environmental loads on the AHV can be
estimated. Current-induced mooring loads, which can be
influenced by current profiles and mooring line configura-
tion, should also be considered. Then the resultant static
external force on the vessel in the horizontal plane (surge,
sway and yaw) can be obtained. The resultant lateral forces
in sway and the resultant yaw moment are supposed to be
balanced by the side tunnel thrusters and azimuth thrusters.
The resultant longitudinal force in surge is supposed to be
withstood by the main propellers. A thrust allocation
method should then be applied to obtain the required thrust
of the tunnel thrusters and azimuth thrusters, based on the
lateral force and yaw moment. Comparing the required
thrust with the available thrust, the tunnel and azimuth
thrust utilisation plot can be established. The propeller
thrust utilisation plot can be generated in a similar manner,
except that the available bollard pull will be affected by
side thrust usage and needs to be adjusted. Finally, the total
thrust utilisation plot can be obtained by combining both
the tunnel and azimuth thrust utilisation plot and the pro-
peller thrust utilisation plot.
The main aim of this paper is to:
• Develop a numerical model suitable to simulate the
anchor handling scenario in static analysis
Vessel properties
Environment model
Wind: mean wind speed &
direction
Wave: spectrum, significant wave height, peak period & direction
Current: surface velocity, profile &
direction
Mooring line configuration:
properties, length & alpha
Propeller thrust utilisation plot
Requiredtunnel thruster &
azimuth thrust
Required propeller thrust
Thrust allocation method
Available bollard pullTunnel thruster
& azimuth thrust utilisation plot
Mean wind loads
Mean drift loads
Mean current loads
Mooring loads
Resultant force in sway and yaw
Resultant force in surge
Total thrust utilisation plot
Fig. 4 Flow chart of the proposed method
490 J Mar Sci Technol (2015) 20:487–504
123

• Estimate forces acting on the vessel and establish the
thrust utilisation plot
• Apply the proposed method to the Bourbon Dolphin
accident as a case study.
3 Theory background
Thrust utilisation plots represent the analysis of the equi-
librium of the steady-state forces and moments of an AHV
during anchor deployment in this study. The main concern
is to estimate the external loads acting on the AHV cor-
rectly. The forces and moments in the horizontal plane are
of interest. Components that have a high influence on the
static external loads on the AHV are mean wave drift load,
mean wind drift load, current load on the vessel and
mooring load (see Fig. 4). Among these loads, the current
load on the mooring line are not studied in previous limited
open publications on an AHV. Augusto and Andrade [12]
proposed a planning methodology for deep-water anchor
deployment aimed at operational resource optimisation.
Wennersberg [13] developed and implemented an anchor
handling simulator based on the MSS toolbox [14]. The
mooring line model in both studies was based on the cat-
enary equation, which did not take the current forces acting
on the mooring line into account. In practice, the current
effect on the mooring line is usually not accounted for in a
rig move procedure. Gunnu et al. [15] analysed the
behaviour of an AHV in the horizontal plane in a uniform
current field. The drifting behaviour of the vessel under
different control forces (failure modes) was illustrated.
However, the current loads on the mooring line were not
studied explicitly. Moreover, wind and wave effects were
not included. In this paper, a detailed model including
wind, wave and current loads on both vessel and mooring
line was established. In this way, more realistic external
forces acting on the vessel can be estimated.
The SIMO [16] and the Riflex [17] are used as tools to
perform steady-state analysis. Environmental loads on the
vessel are obtained through SIMO, while mooring line
loads are calculated from Riflex and added as external
loads to the vessel. In the following section, the theory
background applied will be addressed. The adopted thrust
allocation method will be addressed as well.
3.1 Coordination system
The plain view of the coordinate systems applied is illus-
trated in Fig. 5. Two coordinate systems are used. Vessel
position, mooring line configuration and environmental
load direction are defined in the global coordinate system,
(XG; YG; ZG). The global coordinate system is earth-fixed
and the origin is defined at the rig end of the mooring line
on the water plane. The vessel has its own local coordinate
system, (xB; yB; zB), which is at the projection of the centre
of gravity on the water plane. The loads on the AHV are
referred to the local coordinate system. The mooring line
orientation is in line with the AHV heading because zero
angle of attack is assumed in a normal operation.The
direction definitions of wind (u), wave (w) and current (c)are also shown in Fig. 5. A value of 0� means that the
weather is coming along the mooring line orientation, from
stern to bow of the AHV, while a value of 90� indicates
that the weather is coming perpendicularly to the mooring
line orientation, from starboard to port of the AHV. The rig
is not numerically modelled so that it is illustrated with
dashed lines.
3.2 Wave drift loads
Mean drift loads are of importance in certain contexts, for
instance, in the design of mooring system. Although the
mean drift loads are relatively small in magnitude com-
pared with the first order components, the mean drift loads
may still contribute significantly to the total static envi-
ronmental loads on the AHV. Therefore, it is important to
obtain reasonable wave drift loads in this study.
When estimating the mean drift loads on an offshore
structure, the common practice is to solve the first-order
problem in potential flow theory. The mean drift loads can
then be obtained by applying the theory of conservation of
momentum (the far-field theory). More details can be found
in [18]. A benchmark study on the calculation of potential
theory among seven leading commercial codes was carried
out by Naciri and Sergent in 2009 [19]. It is shown that all
the codes involved predict very consistent first order
quantities, as well as the mean drift coefficients calculated
by the conservation of momentum theory. The WADAM
code [20], one of the tested codes in the benchmark study,
was used to obtain the mean wave drift coefficients for the
Bourbon Dolphin vessel in this paper.
Rig
AHV
XG
YG
GlobalCoord.
MooringLine
xB
yB
Current
OG oB
ψ,φ,γ
WindWave
90°180°
270°
0°
LocalCoord.
Fig. 5 Coordinate systems for an anchor handling operation and
definition of direction
J Mar Sci Technol (2015) 20:487–504 491
123

The main particulars of the Bourbon Dolphin AHV are
listed in Table 1. The 5.80 m draft is the draft when the
Bourbon Dolphin accident happened. A convergence test
on the meshing density of the panel model has been carried
out. Good convergences of the required coefficients are
observed when the element length is smaller than 0.6 m. In
this paper, the results are based on a panel model with an
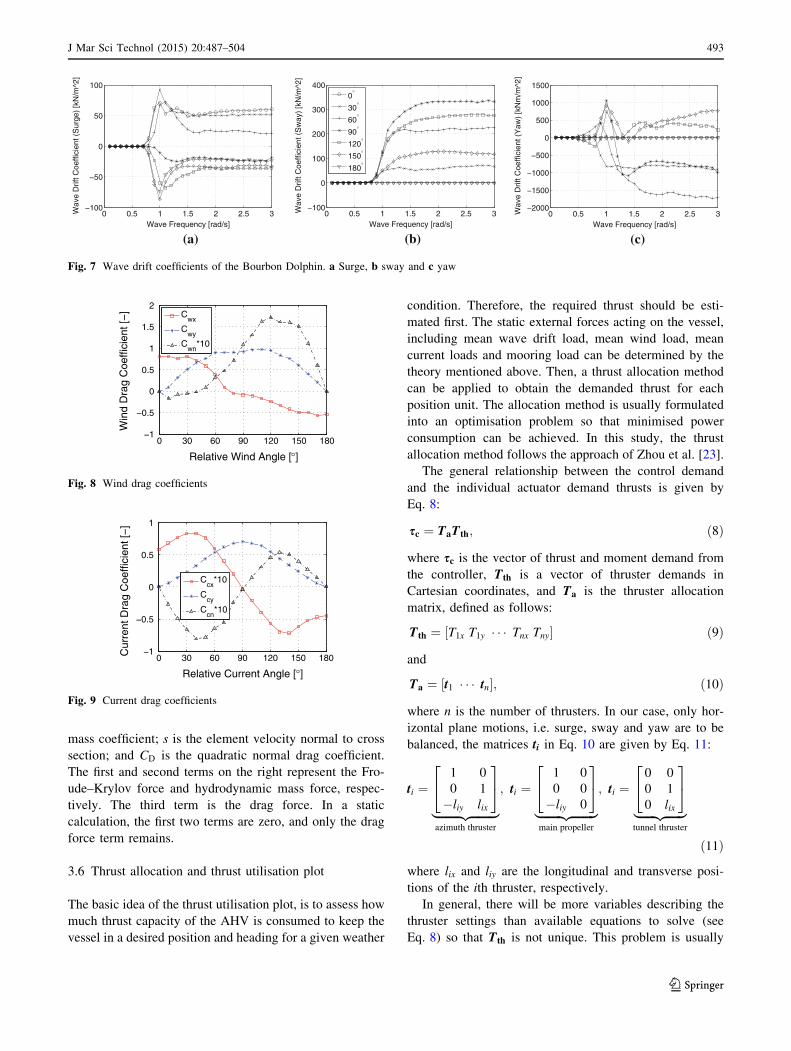
element length of 0.5 m (see Fig. 6). The mean wave drift
coefficients of the Bourbon Dolphin vessel in surge, sway
and yaw are illustrated in Fig. 7a–c, respectively. These
coefficients are imported into SIMO. The mean wave drift
force can then be estimated for a given wave spectrum.
3.3 Wind drag force
The wind drag force is calculated based on the mean wind
velocity on the vessel as follows:
Fwx ¼1
2qaCwxðuÞV2At ð1Þ
Fwy ¼1
2qaCwyðuÞV2Al ð2Þ
Mwn ¼1
2qaCwnðuÞV2AlLoa; ð3Þ
where Fwx, Fwy and Mwn are the wind force in surge, in
sway and wind moment in yaw, respectively; qa is the
density of air; Cwx, Cwy and Cwn are the wind drag coeffi-
cient in surge, sway and yaw, respectively; u is the wind
direction relative to the vessel heading (see Fig. 5); V is the
wind velocity; At and Al are the transverse and lateral
projected area of the vessel superstructure, respectively;
and Loa is the length overall.
Information about the wind drag coefficient for specific
vessels is quite limited in the public literature. To obtain
the best approximation of the Bourbon Dolphin in the
study, data of similar vessels were used. The wind drag
coefficients were obtained in [21] for an offshore supply
vessel (see Fig. 8).
3.4 Current loads
The static current drag forces and moments are estimated
using the following equations:
Fcx ¼1
2qCcxðcÞU2BDm ð4Þ
Fcy ¼1
2qCcyðcÞU2LppDm ð5Þ
Mcn ¼1
2qCcnðcÞU2L2ppDm; ð6Þ
where Fcx, Fcy and Mcn are the current force in surge, in
sway and current moment in yaw, respectively; q is the
density of water; Ccx, Ccy and Ccn are the current drag
coefficient in surge, sway and yaw, respectively; c is the
current direction relative to the vessel heading (see Fig. 5);
U is the current velocity; B is the beam at midships; Dm is
the draught at midships; and Lpp is the length between
perpendiculars.
The current drag coefficients could be obtained both
from model testing and from CFD calculation. In this
paper, the current drag coefficients are obtained in the
ShipX station keeping plug-in [22] (see Fig. 9). These
coefficients were gathered from the MARINTEK model
test for an offshore supply vessel similar to the Bourbon
Dolphin.
3.5 Morison’s equation
The modified Morison’s equation was used to calculate
current loads on the mooring line through the Riflex code.
The drag force acting normal to the mooring line section
with a length of dx is shown in Eq. 7:
dFn ¼ qpDh
2
4dx _wþ qCa
pDh2
4dxð _w� _sÞ
þ 1
2qCDDhdxðw� sÞjw� sj
ð7Þ
where dFn is the hydrodynamic force on an element with
length of dx; q is the water density; Dh is the hydrodynamic
diameter; w is the water particle velocity; Ca is the added
Table 1 Principal particulars of the Bourbon Dolphin
Properties Notations Values Units
Length overall Loa 75.20 m
Length between perpendiculars Lpp 64.91 m
Breadth B 17.00 m
Depth Dp 8.00 m
Draught at midships Dm 5.80 m
Transverse projected area At 314.34 m2
Lateral projected area Al 653.28 m2
Displacement D 4,500 Tonne
The centre of gravity is located 6.90 m from keel and 32.03 m from
aft perpendicular
Fig. 6 Panel model of the Bourbon Dolphin, the port half
492 J Mar Sci Technol (2015) 20:487–504
123
mass coefficient; s is the element velocity normal to cross
section; and CD is the quadratic normal drag coefficient.
The first and second terms on the right represent the Fro-
ude–Krylov force and hydrodynamic mass force, respec-
tively. The third term is the drag force. In a static
calculation, the first two terms are zero, and only the drag
force term remains.
3.6 Thrust allocation and thrust utilisation plot
The basic idea of the thrust utilisation plot, is to assess how
much thrust capacity of the AHV is consumed to keep the
vessel in a desired position and heading for a given weather
condition. Therefore, the required thrust should be esti-
mated first. The static external forces acting on the vessel,
including mean wave drift load, mean wind load, mean
current loads and mooring load can be determined by the
theory mentioned above. Then, a thrust allocation method
can be applied to obtain the demanded thrust for each
position unit. The allocation method is usually formulated
into an optimisation problem so that minimised power
consumption can be achieved. In this study, the thrust
allocation method follows the approach of Zhou et al. [23].
The general relationship between the control demand
and the individual actuator demand thrusts is given by
Eq. 8:
sc ¼ TaTth; ð8Þ
where sc is the vector of thrust and moment demand from
the controller, Tth is a vector of thruster demands in
Cartesian coordinates, and Ta is the thruster allocation
matrix, defined as follows:
Tth ¼ ½T1x T1y � � � Tnx Tny� ð9Þ
and
Ta ¼ ½t1 � � � tn�; ð10Þ
where n is the number of thrusters. In our case, only hor-
izontal plane motions, i.e. surge, sway and yaw are to be
balanced, the matrices ti in Eq. 10 are given by Eq. 11:
ti ¼1 0
0 1
�liy lix
24
35
|fflfflfflfflfflfflfflffl{zfflfflfflfflfflfflfflffl}azimuth thruster
; ti ¼1 0
0 0
�liy 0
24
35
|fflfflfflfflfflfflfflffl{zfflfflfflfflfflfflfflffl}main propeller
; ti ¼0 0
0 1
0 lix
24
35
|fflfflfflfflfflffl{zfflfflfflfflfflffl}tunnel thruster
ð11Þ
where lix and liy are the longitudinal and transverse posi-
tions of the ith thruster, respectively.
In general, there will be more variables describing the
thruster settings than available equations to solve (see
Eq. 8) so that Tth is not unique. This problem is usually
0 0.5 1 1.5 2 2.5 3−100
−50
0
50
100
Wave Frequency [rad/s]
Wav
e D
rift C
oeffi
cien
t (S
urge
) [k
N/m
^2]
0 0.5 1 1.5 2 2.5 3−100
0
100
200
300
400
Wave Frequency [rad/s]
Wav
e D
rift C
oeffi
cien
t (S
way
) [k
N/m
^2]
0°
30°
60°
90°
120°
150°
180°
0 0.5 1 1.5 2 2.5 3−2000
−1500
−1000
−500
0
500
1000
1500
Wave Frequency [rad/s]
Wav
e D
rift C
oeffi
cien
t (Y
aw)
[kN
m/m
^2]
(a) (b) (c)
Fig. 7 Wave drift coefficients of the Bourbon Dolphin. a Surge, b sway and c yaw
0 30 60 90 120 150 180−1
−0.5
0
0.5
1
1.5
2
Relative Wind Angle [°]
Win
d D
rag
Coe
ffici
ent [
−] C
wx
Cwy
Cwn
*10
Fig. 8 Wind drag coefficients
0 30 60 90 120 150 180−1
−0.5
0
0.5
1
Relative Current Angle [°]
Cur
rent
Dra
g C
oeffi
cien
t [−
]
Ccx
*10
Ccy
Ccn
*10
Fig. 9 Current drag coefficients
J Mar Sci Technol (2015) 20:487–504 493
123

formulated as an optimisation problem by introducing a
power minimisation condition. According to Fossen [24],
the least-norm solution of Tth could be achieved by finding
the Moore–Penrose generalised inverse of Ta. The solution
can be expressed in the following form:
Tth ¼ Tya sc ð12Þ
Tya ¼ W�1TT
a ðTaW�1TT
a Þ�1 ð13Þ
and
W ¼
w1x 0
w1y
. ..
wnx
0 wny
2666664
3777775
ð14Þ
where Tya is the generalised inverse of Ta, W is the
weighting matrix in which the element wix is the cost to use
the ith thruster in the surge axis, and wiy is the cost to use
them in the sway axis. The higher the cost in a DP system,
the less thrust will be assigned to that thruster.
When the required thrust, i.e. Tth, is obtained by Eq. 12,
the ratio between the required thrust and the available
thrust of each thrust unit can then be calculated. Here, the
available thrust is based on the thrust setup. Thrust loss is
beyond the scope of this study and therefore is not con-
sidered. The maximum consumption ratio among all thrust
units is used to represent the thrust utilisation for a specific
weather direction. The results are usually presented in a
rosette format, which shows the ratio as a function of
weather direction.
4 Case study
The Bourbon Dolphin accident has been selected as the
basic case for application of the suggested method. The
static loads on the vessel during the accident are first
investigated and discussed, including the mooring line
loads in different current profiles. Then, a comparison
between normal condition and accident condition (defini-
tion will be given in Sect. 4.1.2) is presented. Finally, the
results of several sensitivity studies are shown. Some
simplifications are made so that more general information
can be obtained.
A short reminder of the Bourbon Dolphin accident [2]:
the accident happened on the Rosebank oilfield in the
western part of Shetland where the water depth was
1,100 m. The distance between the rig and the mooring
position was approximately 3,000 m. The mooring line was
approximately 3,500 m, of which 900 m was 84 mm chain
and 920 m was 76 mm chain, plus 1,725 m of 96 mm wire.
During the lowering of anchor, approximately 1,220 m of
83 mm wire was used by the Bourbon Dolphin. The
Bourbon Dolphin ran out all the chain (approximately
1,820 m) for the last anchor (no. 2). Then the vessel drifted
considerably off the mooring line and asked the rig for
assistance. However, the attempt at chain grappling by
another vessel failed. At that moment, the vertical angle a(the angle between the mooring line and the vertical plane,
see Fig. 3) was 38�. Then the vessel capsized during a turn.
See Fig. 1 for the track plot of the Bourbon Dolphin before
the accident happened.
4.1 Load analysis
In this section, the external forces on the AHV during
operation are analysed. First, the current loads on a free-
spanning mooring line are investigated. Then, the total
forces acting on the vessel under different environmental
conditions are presented.
4.1.1 Mooring line loads
While mooring line analysis is commonly conducted for
moored floating structures, study of the effect of a mooring
line during an AHO is not common. As the water depth
increases, the weight of the mooring line increases, which
demands a higher capacity for the AHV. A higher winch
capacity on board is needed due to the mooring line weight.
Meanwhile, the drag force induced by the current increases
as the length of the mooring line increases. The current-
induced mooring load will consume a part of the lateral
thrust forces, which is usually neglected in shallow waters.
Although the shape and tension of a mooring line in calm
water can be predicted well by the traditional catenary
equation, the situation becomes complicated if the current
load is applied. For instance, the shape of the mooring line
will depend on the weight and buoyancy as well as the
current field and thus the loads applied on the vessel could
vary. Therefore, the effect on the loads coming from the
mooring line is of interest.
This subsection describes a parametric study to assess
the effect of current on the mooring line. A two-end-fixed
free-spanning mooring line with uniform cross-section is
placed into different current profiles. A sketch of this study
is illustrated in Fig. 10. The mooring line is assumed to be
aligned with the AHV centre line. The aim is to analyse the
force on the AHV end. The parameters involved are shown
as follows: length of mooring line L, vertical angle a, typesof mooring line, diameter of mooring D, surface current
velocity U, current direction c and current profile. With a
different end distance and a different vertical angle, the
mooring line will have different initial shape (in still
water). Then the current force is applied (with varied
494 J Mar Sci Technol (2015) 20:487–504
123

direction and velocity) and the mooring line will have a
modified shape based on the current condition. As a result,
the distribution of tension along the mooring line will be
changed as well. Iterations should be performed to obtain
the final static shape of the mooring line. Once the static
shape is found, the tension along the mooring line is also
determined. Finally, the force components acting on the
vessel can be obtained.
The significant force components in the total tension T
are the longitudinal force component Tx and the lateral
force component Ty (see Fig. 11). The total tension T is
related to the capacity of the main winch on board. The
winch capacity should be greater than the total tension
coming from the mooring line, or the winch might be
unable to handle the mooring line. The longitudinal force
component Tx is directly linked to the bollard pull. If the
bollard pull of the vessel is smaller than this component,
the vessel will be pulled backward by the mooring line.
The lateral component, Ty, could consume part or even all
of the lateral positioning capability of the vessel. If the
amount is large, Ty could hamper the vessel bollard pull as
well. In practice, T and Tx are quite high compared with the
current loads and not affected much . Emphasis is placed
on the current effect on Ty.
The selected length of the mooring line in this study is
1,800 m, which is almost the same as what Bourbon Dol-
phin had paid out (1,817 m) before the accident happened.
Based on the rig move plan that was carried out during the
Bourbon Dolphin accident, two types of mooring line were
used, including the stud chain and the wire with wire core.
Within each type of mooring line, two diameters were
selected to study the effect of diameter. So in total, there
were four mooring lines that were studied, and the prop-
erties of these mooring lines are summarised in Table 2. In
fact, the type of mooring line used is normally selected
according to the mooring performance analysis of the
mooring system rather than the AHO analysis. The com-
parison between these mooring lines, however, can show
the influence of mooring line properties on the force
components within the same practical project.
In the actual practice, the vertical angle between the
mooring line and the vertical axis (a) is usually between
20� and 60�. This angle describes the relative importance
of the horizontal and the vertical components of the total
tension. A different angle a can be achieved by altering the
distance (D) between the two ends of a mooring line. For
the purposes of convenience, the same distance is applied
on all four types of mooring line for a nominal a value. Dueto the difference in axial stiffness between chains and
wires, there are small differences in the actual angle a of
Current
γRig End AHV EndD
Profile
α
L
U
Fig. 10 Sketch of two-end-fixed mooring line in current
T
ThTy
Tx
Tz
AHV
MooringLine
oB
zB
xByB
Fig. 11 Force components of mooring line tension
Table 2 Mooring line
properties
The nominal diameter of chains
represents the bar diameter. The
equivalent diameter is for a line
with constant volume along its
length. The drag coefficient is
defined on the nominal
diameter. The drag coefficients
are obtained from DNV
recommended practice [28]
Properties Units Mooring line type
Stud chain Wire
Geometry
Diameter (nominal diameter) m 0.084 0.076 0.096 0.083
Equivalent diameter m 0.159 0.144 0.077 0.066
Weight and buoyancy
Mass per unit length kg/m 154.50 126.50 37.77 27.49
Weight per unit length kN/m 1.516 1.241 0.361 0.270
Buoyancy per unit length kN/m 0.199 0.164 0.047 0.035
Weight per unit length in water kN/m 1.317 1.077 0.314 0.235
Structure
Axial stiffness kN 7:13� 105 5:83� 105 3:72� 105 2:78� 105
Hydrodynamics
Normal drag coefficient – 2.6 2.6 1.2 1.2
Tangential drag coefficient – 1.4 1.4 0.0 0.0
J Mar Sci Technol (2015) 20:487–504 495
123

the mooring lines. However, the difference between the
actual and nominal value is small. The selected distance
and the corresponding a (both actual and nominal) are
tabulated in Table 3. The nominal a varies from 10� to 75�.Hereafter, angle a in this paper refers to the nominal value.
The static shapes of 1,800-m-long mooring line with
84 mm chain properties (with different a) in still water,
calculated by Riflex, are illustrated in Fig. 12 with markers.
The analytical solutions of the elastic cable line equations,
see [18], are also presented in Fig. 12 (as red solid lines).
As shown, the Riflex results are in very good agreement
with the analytical solution.
The current profile, velocity and direction have an
influence on the mooring line shape, thus they have an
effect on the force components as well. Six current profiles
in total have been chosen to evaluate the effect. The six
current profiles are uniform, linear sheared, uniform with
50-m slab, linear sheared with 50 m, Ormen Lange field
(representing the profile in the North Sea) and Loop eddies
current field (representing the profile in the Gulf of Mex-
ico). The first two profiles are theoretical current profiles
for deep water. The middle two profiles are the design
profiles proposed by DNV recommended practice [25] for
wind generated current, in which the current velocity is
zero below 50 m. More detail about the last two current
profiles can be found in Rustad et al. [26]. According to
ISO 19901-1 [27], the indicative value for 1-year-return
surface current speed in the west of Shetland is 1.64 m/s.
This value coincides with the maximum estimation of
current speed (3 knots) during the accident in terms of
order. The normalised current velocity profile, with a sur-
face velocity equals to 1 m/s, are illustrated in Fig. 13.
The influence of the current profiles as well as the angle
a on the lateral force component Ty is shown in Fig. 14.
The length of the mooring line is 1,800 m and the current
direction is normal to the mooring direction(c ¼ 90�) witha surface velocity of 1.0 m/s. In this case, Ty represents half
of the total lateral current loads on the mooring line. In
general, the difference between stud chain and wire are
quite significant. The Ty of chains is more or less twice the
magnitude of the Ty of wires in most cases. Therefore,
deploying mooring line with chain sections is usually more
demanding than using wire sections (of the same length)
because the weight will be heavier and possible current
drag loads will be higher. The diameters have less impor-
tance for the current loads within the same type of mooring
line. The maximum difference due to diameter occurs in
the uniform current field in stud chains. However, the
difference is less than 10 kN (1 tonne).
The Ty has a strong angle a dependence in all profiles
except the uniform profile mainly because a different angle
a means a different spanning depth of the mooring line. In
a uniform current field (see Fig. 14a), Ty is almost the same
among all angles a for the same property. This equality is
easy to understand because the profile is uniform and
therefore the mooring lines are subjected to almost the
same current loads. A 1,800-m 84 mm mooring chain can
lead to approximately 100 kN (10 tonnes) in Ty in 1 m/s
uniform current. In a linear sheared current profile (see
Fig. 14b), Ty increases from 40 kN to almost 90 kN as the
angle a varies from 10� to 75�. Within the practical range
Table 3 Relationship between D and a for a 1,800-m-long mooring
line
D (m) Actual að�) Nominal a ð�Þ
Stud chain Wire
773 10.00 10.01 10
1,137 19.95 19.99 20
1,370 29.99 30.05 30
1,501 37.95 38.06 38
1,589 44.96 45.12 45
1,716 59.73 60.18 60
1,787 74.09 75.92 75
0 300 600 900 1200 1500 1800−1200
−1000
−800
−600
−400
−200
0
Distance [m]
Dep
th [m
]
α = 10°
α = 20°
α = 30°
α = 38°
α = 45°
α = 60°
α = 75°
Fig. 12 Static shape of a 84-mm K4 studded chain mooring line for
different angle a, L ¼ 1; 800 m. Analytical solutions are presented
with red solid lines. Riflex results are presented with different
markers (colour figure online)
−0.5 0 0.5 1 1.5 2 2.5 3 3.5 4
−1000
−800
−600
−400
−200
0
Current Velocity [m/s]
Wat
er D
epth
[m]
UniformLinear ShearedUniform with 50m SlabLinear Sheared with 50mOrmen LangeLoop Eddies
Fig. 13 Current profiles
496 J Mar Sci Technol (2015) 20:487–504
123

of a, for example, 38�, the current-induced lateral force is
more than 55 kN.
In the two design profiles of wind generated current, Tyare smaller compared with other cases because current only
affects the very upper part of the mooring line (within 50 m
water depth). Figure 14c shows that there is a jump in the
magnitude for all mooring lines when a is 75� because the
spanning depth of the mooring lines is small in this case
(see Fig. 12) and a much greater portion of the lines is
exposed to the slab current. Therefore, the total current
loads on the lines are much higher. In the linear sheared
profile with 50 m depth, the phenomenon is similar (see
Fig. 14d). Within the practical range of a, however, Ty is
very small for wind generated current profiles.
In regard to the actual current profile, the results are
more interesting. In the current profile at the Ormen Lange
field, the current remains quite strong over the water depth
resulting in a relatively high drag load on the mooring line
(see Fig. 14e). In the Norwegian sector, AHV might have a
higher demand on the thrust capacity due to possibly higher
current load on the mooring line. In the current profile at
the Gulf of Mexico (GOM), the minimum Ty occurs when
the angle a is equal to 38� (see Fig. 14f), due to the
uniqueness of this current profile. There is a drop of the
current strength in approximately 350 m of water depth.
However, the current gradually becomes stronger as the
water depth increases. To keep the main part of the
mooring line in the low current strength region might be an
advantage to take in the GOM.
The uniform current profile is used to investigate the
effect of current direction and velocity on Ty. The current
velocity varies from 0.5 to 2.0 m/s. A value of 2.0 m/s is
too high for an operation weather window and is just for
illustration. However, 1.0 m/s is usually chosen as the
design criterion (the same as the Bourbon Dolphin rig
move procedure), therefore the value is quite reasonable.
Because the a has no influence on Ty in a uniform current
field, there is no need to vary a. The Ty induced current on
an 1,800-m 84 mm mooring chain with angle a equal to
38� is presented in Fig. 15. The figure shows that Ty is
generally proportional to velocity squared. In the 1.5 m/s
current speed, current load on an 1,800-m 84 mm stud
chain can be more than 220 kN, which is approximately
22 tonnes. If this happened in the real world, the AHV
would be in a very challenging situation to maintain
position. The maximum values occur at 90� in a low cur-
rent speed profile and shift to 80� when in a high current
speed profile.
10 20 30 38 45 60 750
20
40
60
80
100
120
α [°]
Ty
[kN
]
10 20 30 38 45 60 750
20
40
60
80
100
α [°]
Ty
[kN
]
10 20 30 38 45 60 750
5
10
15
20
25
α [°]
Ty
[kN
]
10 20 30 38 45 60 750
20
40
60
80
100
α [°]
Ty
[kN
]
10 20 30 38 45 60 750
10
20
30
40
α [°]
Ty
[kN
]
Chain 84Chain 76Wire 96Wire 83
10 20 30 38 45 60 750
2
4
6
8
10
α [°]
Ty
[kN
]
(a) (b) (c)
(e) (f)(d)
Fig. 14 Lateral force component (Ty, see Fig. 11) comparisons for
different current profiles and different angle a (see Fig. 10), c ¼ 90�,U ¼ 1:0 m/s, L ¼ 1; 800 m. a Uniform current profile, b linear
sheared current profile, c slab uniform current profile (50 m depth),
d linear sheared current profile (50 m depth), e Ormen Lange field
current profile and f loop eddies current profile
J Mar Sci Technol (2015) 20:487–504 497
123

Due to the considerable differences in lateral mooring
loads among different current profiles, it is very impor-
tant to take the mooring line effect into account and
apply the current profile in practice as closely as possi-
ble. Further discussion will be provided in the following
subsections.
4.1.2 External loads on the vessel
The external forces acting on an AHV depend on the vessel
dimensions and environmental conditions as well as the
mooring line configuration. The main particulars of the
Bourbon Dolphin anchor handling vessel are listed in Table
1. The 5.80 m draft is the draft when the Bourbon Dolphin
accident happened.
According to the accident report [2], the weather con-
ditions referred to in the rig move procedure mooring
analysis for the Bourbon Dolphin are listed as follows:
• Maximum waves of 4.0 m, significant wave height (Hs)
is approximately 2.2 m, with a wave period (Tp) of
8.5 s
• Wind speed (VW) 10 m/s (19.4 knots)
• Current speed (VC) 1.0 m/s (1.94 knots).
The weather conditions during the day of the accident were
different from the rig move procedure. Based on several
assessments from weather forecasts and testimony of
masters, the weather observations were relatively consis-
tent on wave and wind, while there were strong disagree-
ments on the current. The actual weather situation is listed
as follows:
• Significant wave height was approximately 3.5 m (max
wave approximately 7 m) with a wave period of 7–8 s.
• Mean wind strength was approximately 18 m/s (30–35
knots).
• Estimated current speed varied from 0.3 to 1.5 m/s
(0.6–3 knots).
Based on the above information, two environmental con-
ditions are defined in this study. The condition used in the
rig move procedure is denoted as the ‘‘Normal’’ condition,
while the actual weather condition is denoted as the
‘‘Accident’’ condition. The details of these two weather
conditions are tabulated in Table 4. The selected wave
spectrum is the Jonswap spectrum and the wind field is
considered as constant with uniform profile. The current
profile used here is the Ormen Lange profile, which is
supposed to be the most suitable one among the six studied
profiles. Due to the inconsistency on the surface current
speed estimation in the accident condition, the current
speed in the accident condition is set the same as the cur-
rent speed in the rig move procedure, i.e. 1 m/s. In this
way, the influence from deterioration of the wind and the
waves can be investigated.
Static analyses were performed to obtained static loads
on the Bourbon Dolphin under these two sets of conditions.
No weather misalignment was considered. The mooring
line was attached at the stern of the AHV at the centre line.
The distance between the attach point to the centre of
gravity is 37.23 m. The mooring line was set as 1,800 m of
84 mm chain with the angle a equal to 38�. The configu-
ration is similar to that in the accident. The lateral force
and yaw moment with respect to the centre of gravity of the
Bourbon Dolphin as a function of weather direction is
shown in Fig. 16. The current load acting on the vessel is
denoted as ‘‘current’’, while the mooring load acting on the
vessel due to current is denoted as ‘‘mooring’’. Because the
current conditions are the same in both normal and accident
conditions, the ‘‘current’’ and ‘‘mooring’’ loads in both case
remain the same.
For lateral force components, the highest total force
occurs around the beam sea condition, i.e. 90�. The max-
imum total force in the accident condition is approximately
67 % higher than that in the normal condition. In the
normal condition, the current load on the vessel is pre-
dominant, while the other three are quite similar in mag-
nitude. In the accident condition, the wave drift force
becomes stronger and contributes the most to the total load.
The mean wind load also increases significantly.
For the yaw moment components, the trend is not as
clear as the lateral force because the peak value of each
component does not occur in the same weather direction. In
general, high total yaw moment appears at a stern
0 30 60 90 120 150 1800
100
200
300
400
Current Direction [°]
Ty
[kN
]
VC
=0.5m/s2
VC
=1.0m/s2
VC
=1.5m/s2
VC
=2.0m/s2
Fig. 15 Lateral force component (Ty) comparisons for different
current directions and velocities, uniform current profile,
L ¼ 1; 800 m, b ¼ 38�, 84 mm chain
Table 4 Environmental conditions
Normal Accident Units
Wave Hs 2.2 3.5 m
Tp 8.5 7.0 s
Wind VW 10 18 m/s
Current VC 1.0 1.0 m/s
498 J Mar Sci Technol (2015) 20:487–504
123
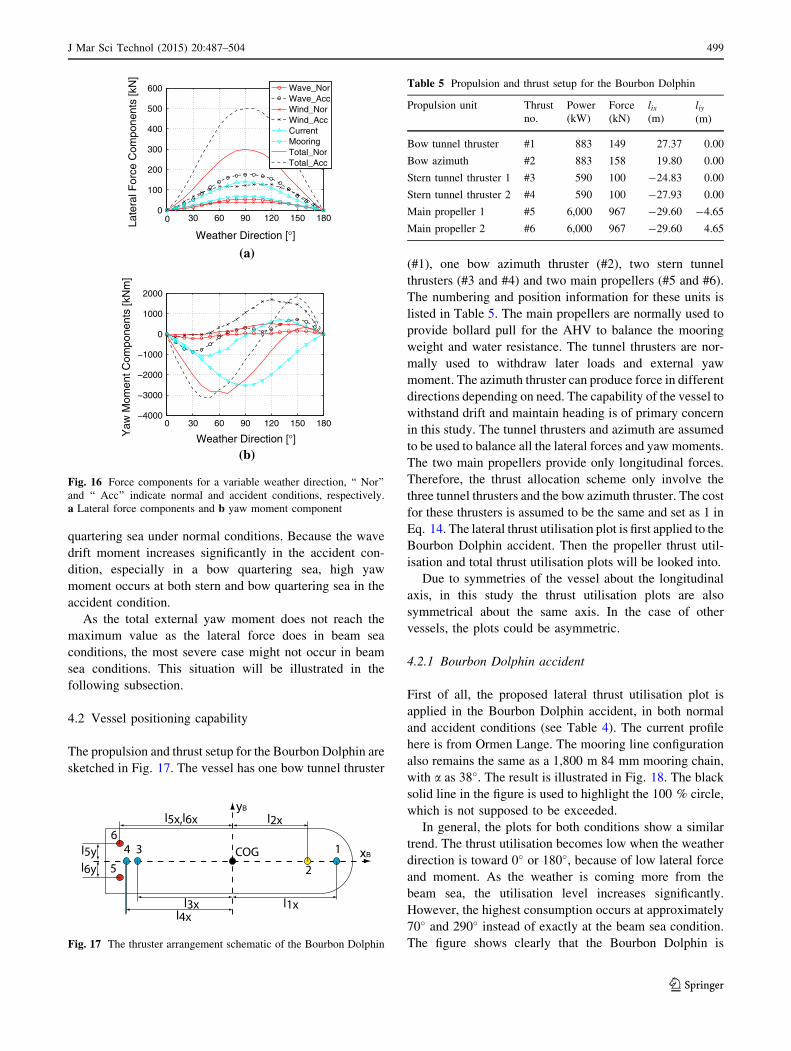
quartering sea under normal conditions. Because the wave
drift moment increases significantly in the accident con-
dition, especially in a bow quartering sea, high yaw
moment occurs at both stern and bow quartering sea in the
accident condition.
As the total external yaw moment does not reach the
maximum value as the lateral force does in beam sea
conditions, the most severe case might not occur in beam
sea conditions. This situation will be illustrated in the
following subsection.
4.2 Vessel positioning capability
The propulsion and thrust setup for the Bourbon Dolphin are
sketched in Fig. 17. The vessel has one bow tunnel thruster
(#1), one bow azimuth thruster (#2), two stern tunnel
thrusters (#3 and #4) and two main propellers (#5 and #6).
The numbering and position information for these units is
listed in Table 5. The main propellers are normally used to
provide bollard pull for the AHV to balance the mooring
weight and water resistance. The tunnel thrusters are nor-
mally used to withdraw later loads and external yaw
moment. The azimuth thruster can produce force in different
directions depending on need. The capability of the vessel to
withstand drift and maintain heading is of primary concern
in this study. The tunnel thrusters and azimuth are assumed
to be used to balance all the lateral forces and yaw moments.
The two main propellers provide only longitudinal forces.
Therefore, the thrust allocation scheme only involve the
three tunnel thrusters and the bow azimuth thruster. The cost
for these thrusters is assumed to be the same and set as 1 in
Eq. 14. The lateral thrust utilisation plot is first applied to the
Bourbon Dolphin accident. Then the propeller thrust util-
isation and total thrust utilisation plots will be looked into.
Due to symmetries of the vessel about the longitudinal
axis, in this study the thrust utilisation plots are also
symmetrical about the same axis. In the case of other
vessels, the plots could be asymmetric.
4.2.1 Bourbon Dolphin accident
First of all, the proposed lateral thrust utilisation plot is
applied in the Bourbon Dolphin accident, in both normal
and accident conditions (see Table 4). The current profile
here is from Ormen Lange. The mooring line configuration
also remains the same as a 1,800 m 84 mm mooring chain,
with a as 38�. The result is illustrated in Fig. 18. The black
solid line in the figure is used to highlight the 100 % circle,
which is not supposed to be exceeded.
In general, the plots for both conditions show a similar
trend. The thrust utilisation becomes low when the weather
direction is toward 0� or 180�, because of low lateral force
and moment. As the weather is coming more from the
beam sea, the utilisation level increases significantly.
However, the highest consumption occurs at approximately
70� and 290� instead of exactly at the beam sea condition.
The figure shows clearly that the Bourbon Dolphin is
0 30 60 90 120 150 1800
100
200
300
400
500
600
Weather Direction [°]
Late
ral F
orce
Com
pone
nts
[kN
]
Wave_NorWave_AccWind_NorWind_AccCurrentMooringTotal_NorTotal_Acc
(a)
0 30 60 90 120 150 180−4000
−3000
−2000
−1000
0
1000
2000
Weather Direction [°]Yaw
Mom
entC
ompo
nent
s [k
Nm
]
(b)
Fig. 16 Force components for a variable weather direction, ‘‘ Nor’’
and ‘‘ Acc’’ indicate normal and accident conditions, respectively.
a Lateral force components and b yaw moment component
COG
l2x
l1xl4xl3x
l5x,l6x
l5yl6y
1
2
34
5
6xB
yB
Fig. 17 The thruster arrangement schematic of the Bourbon Dolphin
Table 5 Propulsion and thrust setup for the Bourbon Dolphin
Propulsion unit Thrust
no.
Power
(kW)
Force
(kN)
lix(m)
liy(m)
Bow tunnel thruster #1 883 149 27.37 0.00
Bow azimuth #2 883 158 19.80 0.00
Stern tunnel thruster 1 #3 590 100 -24.83 0.00
Stern tunnel thruster 2 #4 590 100 -27.93 0.00
Main propeller 1 #5 6,000 967 -29.60 -4.65
Main propeller 2 #6 6,000 967 -29.60 4.65
J Mar Sci Technol (2015) 20:487–504 499
123
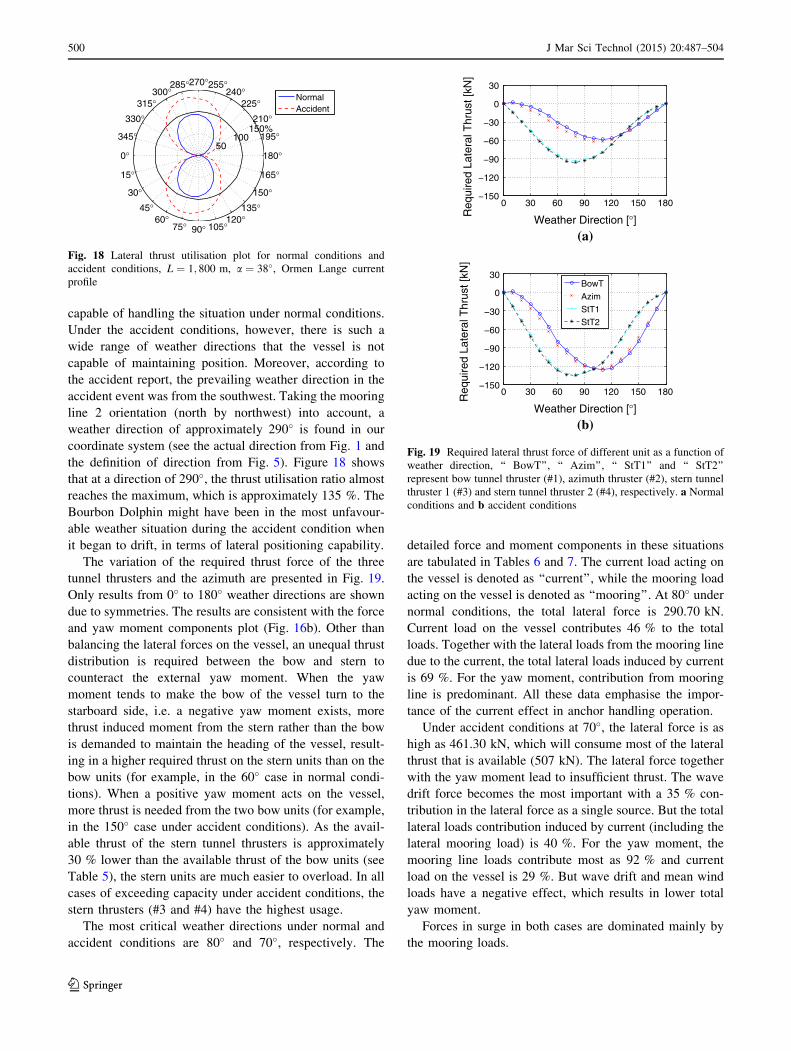
capable of handling the situation under normal conditions.
Under the accident conditions, however, there is such a
wide range of weather directions that the vessel is not
capable of maintaining position. Moreover, according to
the accident report, the prevailing weather direction in the
accident event was from the southwest. Taking the mooring
line 2 orientation (north by northwest) into account, a
weather direction of approximately 290� is found in our
coordinate system (see the actual direction from Fig. 1 and
the definition of direction from Fig. 5). Figure 18 shows
that at a direction of 290�, the thrust utilisation ratio almost
reaches the maximum, which is approximately 135 %. The
Bourbon Dolphin might have been in the most unfavour-
able weather situation during the accident condition when
it began to drift, in terms of lateral positioning capability.
The variation of the required thrust force of the three
tunnel thrusters and the azimuth are presented in Fig. 19.
Only results from 0� to 180� weather directions are shown
due to symmetries. The results are consistent with the force
and yaw moment components plot (Fig. 16b). Other than
balancing the lateral forces on the vessel, an unequal thrust
distribution is required between the bow and stern to
counteract the external yaw moment. When the yaw
moment tends to make the bow of the vessel turn to the
starboard side, i.e. a negative yaw moment exists, more
thrust induced moment from the stern rather than the bow
is demanded to maintain the heading of the vessel, result-
ing in a higher required thrust on the stern units than on the
bow units (for example, in the 60� case in normal condi-
tions). When a positive yaw moment acts on the vessel,
more thrust is needed from the two bow units (for example,
in the 150� case under accident conditions). As the avail-
able thrust of the stern tunnel thrusters is approximately
30 % lower than the available thrust of the bow units (see
Table 5), the stern units are much easier to overload. In all
cases of exceeding capacity under accident conditions, the
stern thrusters (#3 and #4) have the highest usage.
The most critical weather directions under normal and
accident conditions are 80� and 70�, respectively. The
detailed force and moment components in these situations
are tabulated in Tables 6 and 7. The current load acting on
the vessel is denoted as ‘‘current’’, while the mooring load
acting on the vessel is denoted as ‘‘mooring’’. At 80� undernormal conditions, the total lateral force is 290.70 kN.
Current load on the vessel contributes 46 % to the total
loads. Together with the lateral loads from the mooring line
due to the current, the total lateral loads induced by current
is 69 %. For the yaw moment, contribution from mooring
line is predominant. All these data emphasise the impor-
tance of the current effect in anchor handling operation.
Under accident conditions at 70�, the lateral force is as
high as 461.30 kN, which will consume most of the lateral
thrust that is available (507 kN). The lateral force together
with the yaw moment lead to insufficient thrust. The wave
drift force becomes the most important with a 35 % con-
tribution in the lateral force as a single source. But the total
lateral loads contribution induced by current (including the
lateral mooring load) is 40 %. For the yaw moment, the
mooring line loads contribute most as 92 % and current
load on the vessel is 29 %. But wave drift and mean wind
loads have a negative effect, which results in lower total
yaw moment.
Forces in surge in both cases are dominated mainly by
the mooring loads.
50100
150%
0°
15°
30°45°
60°75° 90° 105°
120°135°
150°
165°
180°
195°
210°225°
240°255°270°285°
300°315°
330°
345°
NormalAccident
Fig. 18 Lateral thrust utilisation plot for normal conditions and
accident conditions, L ¼ 1; 800 m, a ¼ 38�, Ormen Lange current
profile
0 30 60 90 120 150 180−150
−120
−90
−60
−30
0
30
Weather Direction [°]Req
uire
dLa
tera
lThr
ust [
kN]
(a)
0 30 60 90 120 150 180−150
−120
−90
−60
−30
0
30
Weather Direction [°]
Req
uire
dLa
tera
l Thr
ust [
kN]
BowT
Azim
StT1
StT2
(b)
Fig. 19 Required lateral thrust force of different unit as a function of
weather direction, ‘‘ BowT’’, ‘‘ Azim’’, ‘‘ StT1’’ and ‘‘ StT2’’
represent bow tunnel thruster (#1), azimuth thruster (#2), stern tunnel
thruster 1 (#3) and stern tunnel thruster 2 (#4), respectively. a Normal
conditions and b accident conditions
500 J Mar Sci Technol (2015) 20:487–504
123

4.2.2 Effect of current profile
Based on the findings in the previous subsection, current
loads are of significant importance in the AHO. The current
profile has a high influence on the mooring load, which has
already been shown. Therefore, a parametric study was
carried out to investigate the influence on the lateral thrust
utilisation plot from current profiles. All profiles shown in
Fig. 13 were used. The mooring line configuration also
remains the same as an 1,800 m 84 mm mooring chain,
with a is 38�. Both normal and accident conditions were
tested and the results are presented in Fig. 20.
Figure 20 shows that the results can be classified into
three groups. Group one includes the two wind generated-
current profiles and the loop eddies profile. Under both sets
of conditions, the vessel can maintain sway and heading in
these current profiles, except that there is a small exceeding
for the loop eddies profile under accident conditions.
Because the current load on the mooring line in these three
profiles is quite low (see Fig. 14), the results can be con-
sidered as no current effect applied on the mooring line.
The second group includes the uniform profile. The posi-
tioning capability of the vessel is not sufficient even under
normal conditions for certain directions, let alone in acci-
dent conditions. The remaining profiles form the third
group, including the linear sheared profile and the Ormen
Lange profile. A vessel in this profile group is capable of
withstanding the external lateral force under normal con-
ditions but will drift-off under accident conditions at cer-
tain weather directions.
Clearly using the uniform current profile overestimates
the current loads on the mooring line and thus leads to
conservative results. Profiles in group one are reasonable,
provided that the wind induced current are dominant in the
region where the operation is taking place. The current
profile effect in this group can be neglected because the
lateral mooring load is small (see Fig. 14). The linear
sheared profile and the Ormen Lange profile are the most
suitable profiles to use in the Bourbon Dolphin case.
Applying these profiles gives a much more realistic
external forces description for the vessel. Therefore, more
reliable thrust utilisation plots can be obtained.
4.2.3 Effect of mooring line configuration
During the deployment of the anchor, the mooring line is
paying out based on the rig move procedure and the
judgment of the tow master. As the length of mooring line
in water increases, the loads acting on the vessel vary as
well. If the angle a remains the same, the longer the
mooring line is, the more loads the vessel needs to carry in
the longitudinal direction. The current loads on the moor-
ing line also vary, depending on the current profile (but it
usually increases). As previously mentioned, the bollard
pull was materially reduced due to the use of thrusters
Table 6 Detailed load components under normal conditions, 80�
Item Actual value Percentage (%)
Surge
(kN)
Sway
(kN)
Yaw
(kNm)
Surge
(–)
Sway
(–)
Yaw
(–)
Wave drift 0.33 52.54 -2.17 0 18 0
Wind -0.97 36.56 214.50 0 13 -8
Current 1.01 134.80 -318.90 0 46 12
Mooring -933.90 66.74 -2,485.00 102 23 96
Total -919.60 290.70 -2,591.00 100 100 100
Table 7 Detailed load components under accident conditions, 70�
Item Actual value Percentage (%)
Surge
(kN)
Sway
(kN)
Yaw
(kNm)
Surge
(–)
Sway
(–)
Yaw
(–)
Wave drift -26.09 159.20 81.57 -3 35 -3
Wind 5.01 117.20 460.10 -1 25 -18
Current 2.01 122.90 -730.70 0 27 29
Mooring -928.70 61.94 -2,306.00 105 13 92
Total -881.60 461.30 -2,495.00 100 100 100
20 40 60 80100%
0°
15°
30°45°
60°75° 90° 105°
120°135°
150°
165°
180°
195°
210°225°
240°255°270°285°
300°315°
330°
345°
UniLinUni50Lin50OrlLoe
(a)
20 40 60 80100%
0°
15°
30°45°
60°75° 90° 105°
120°135°
150°
165°
180°
195°
210°225°
240°255°270°285°
300°315°
330°
345°
UniLinUni50Lin50OrlLoe
(b)
Fig. 20 Lateral thrust utilisation plot with different current profiles,
L ¼ 1; 800 m, a ¼ 38�, ‘‘Uni’’, ‘‘Lin’’, ‘‘Uni50’’, ‘‘Lin50’’, ‘‘Orl’’ and‘‘Loe’’ represent the six current profiles in the same order as shown in
Fig. 13. a Normal condition and b accident condition
J Mar Sci Technol (2015) 20:487–504 501
123

during the Bourbon Dolphin accident. From the accident
report, the total bollard pull of the Bourbon Dolphin
reduced from 180 to 125 tonnes at maximum side thruster
loading. How the propeller usage is influenced by the
mooring line is of interest. Therefore, the propeller util-
isation plot is introduced in the same way as the tunnel
thrusters and azimuth, taking the reduction effect into
account in a simple manner. Due to the lack of information,
the two propellers are assumed to provide 180 tonnes of
thrust forward in total when the lateral thrust usage is zero.
As the lateral thrust utilisation increases, the thrust from
the propellers decreases linearly to 125 tonnes when the
lateral thrust utilisation reaches 100 %. In practice, the real
reduction relationship can be applied.
First, the demanded thrust of the tunnel thruster and
azimuth is estimated, summed and compared with the total
available side thrust. Applying the ratio in the relationship
of the propeller deduction, the ‘‘available’’ thrust of the
propellers can then be obtained. Thus, the thrust utilisation
plot for the propeller can then be generated. The maximum
value between the thruster and propeller is used to establish
the total thrust utilisation plot.
A parametric study has been carried out to examine the
influence on the total thrust utilisation plot, with respect to
different mooring line pay-out lengths. Different lengths of
mooring line can represent different stages of the anchor
handling process. Both normal and accident conditions
were tested. The results are presented in Fig. 21. With a
longer pay-out mooring line, the side thrust utilisation
gradually increases when the weather is coming from the
side, and remains low in a head sea and following sea
conditions (see Fig. 21a, d). Under normal conditions, the
vessel can handle the lateral external loads for all weather
directions with a mooring line up to a length of 1,800 m.
With longer pay-out length, the vessel is lack of position
capability at approximately 80� and 280�. However, underaccident conditions, the vessel is vulnerable in stern
quartering sea weather conditions. Even with a 600 m
length of mooring line the thrust usage is over 100 %.
The propeller utilisation is dominated mainly by the
length of the mooring line (see Fig. 21b, e). As the length
of the mooring line increases, increasing tension is applied
on the AHV due to the increasing total weight of the line.
The propeller utilisation increases quite evenly. However,
50100
150%
0°
15°
30°
45°60°
75° 90° 105°120°
135°
150°
165°
180°
195°
210°
225°240°
255°270°285°300°
315°
330°
345°
L= 600mL=1200mL=1800mL=2400mL=3000m
(a)
50100
150%
0°
15°
30°45°
60°75° 90° 105°
120°135°
150°
165°
180°
195°
210°225°
240°255°270°285°
300°315°
330°
345°
(b)
50100
150%
0°
15°
30°45°
60°75° 90° 105°
120°135°
150°
165°
180°
195°
210°225°
240°255°270°285°
300°315°
330°
345°
(c)
50100
150%
0°
15°
30°45°
60°75° 90° 105°
120°135°
150°
165°
180°
195°
210°225°
240°255°270°285°
300°315°
330°
345°
(e)
50100
150%
0°
15°
30°45°
60°75° 90° 105°
120°135°
150°
165°
180°
195°
210°225°
240°255°270°285°
300°315°
330°
345°
(f)
50100
150%
0°
15°
30°45°
60°75° 90° 105°
120°135°
150°
165°
180°
195°
210°225°
240°255°270°285°
300°315°
330°
345°
(d)
Fig. 21 Thrust utilisation plots with varying mooring line pay out
length, a ¼ 38�, Ormen Lange current profile. a Thruster and
azimuth, normal conditions, b propeller, normal conditions, c total,
normal conditions, d thruster and azimuth, accident conditions,
e propeller, accident conditions and f total, accident conditions
502 J Mar Sci Technol (2015) 20:487–504
123

the propeller utilisation is also influenced by the side thrust
usage because the available propeller thrust is lower in side
weather conditions comparing to other weather directions.
As a result, higher propeller utilisation is observed in about
beam sea conditions, especially under accident conditions.
The propeller utilisation is higher in head sea (180�) than infollowing sea condition (0�) because in head sea condition,
the direction of current-induced loads on the mooring line
is opposite to the thrust of the propellers, so the required
bollard pull is higher, and vice versa.
The total thrust utilisation plots for normal and accident
conditions are shown in Fig. 21c and f. Under normal
conditions, the vessel can fulfil the task in all weather
directions. However, if the length of mooring line reaches
3,000 m, the propellers will be overloaded in side weather
conditions due to the increased mooring weight and bol-
lard pull deduction. Under the accident conditions, the
weather directions in which the vessel can maintain
position are limited to a small spread around the following
sea. As a result, if this information were provided before
the operation commenced, the tragedy might have been
averted.
5 Conclusion
Anchor handling operations, like all human activities, are
potentially hazardous. The mooring line represents a sig-
nificant risk factor for the anchor handling vessel due to its
heavy weight as well as possible current loads, especially
in deep water. Considerable drift is considered an initial
event in the notable Bourbon Dolphin accident and should
be prevented. Therefore, there is a need to establish a
method to quantify the positioning capability for anchor
handling vessel during anchor deployment.
In this paper, the thrust utilisation plot is proposed to
present the positioning capability of the anchor handling
vessel in a basic anchor deployment operation. Emphasis
has been placed on obtaining realistic static loads on the
vessel, including mean wind loads, mean wave drift load,
mean current loads and mooring line loads.
A case study was carried out based on the Bourbon
Dolphin case. The main conclusions can be summarised as
follows:
• Lateral mooring loads vary significantly in different
current profiles, therefore it is important to apply a
reasonable current profile and take the mooring line
effect into account.
• The thrust utilisation plot is useful to demonstrate the
most critical weather direction. When the Bourbon
Dolphin began to drift during the accident event, it
might have been in the most unfavourable weather
direction, which is 290�, in terms of lateral positioning
capability.
• Current loads represent the most important loads in the
Bourbon Dolphin case (with the Ormen Lange field
current profile). Current loads on the vessel together
with current-induced mooring loads contributed up to
69 % (in normal condition) and 40 % (in accident
condition) to the total lateral loads.
• In regions where wind driven current is dominant,
current loads on the mooring line can be neglected. In
regions where a characteristic current profile exists,
current-induced mooring line load should be considered
in the thrust utilisation plot, for instance, in the Ormen
Lange field in Norwegian waters.
• When the vessel deploys a very long mooring line, the
limitation might come from the available propeller
thrust due to heavy mooring weight and bollard pull
deduction.
In general, the proposed method (see Fig. 4) is easy to
implement and is useful for presenting the limitations of
the anchor handling vessel before the operation com-
mences. The proposed method is a good tool for defining
vessel specific limitations, selecting a proper anchor han-
dling vessel in terms of positioning capability during the
planning stage and can also serve as the basis for estab-
lishing critical scenarios that are valuable for crew training
in a simulator.
Acknowledgments This work was carried out at the Centre for
Ships and Ocean Structures at the Faculty of Engineering Science and
Technology, Norwegian University of Science and Technology
(NTNU), Trondheim, Norway. The authors would like to acknowl-
edge the financial support from the SINTEF Fisheries and Aquacul-
ture granted through CeSOS. MARINTEK is acknowledged for
providing software licenses for SIMO and Riflex. The authors would
also like to thank Master Age Muren from Farstad Shipping ASA for
his support and helpful discussions on practical issues related to
anchor handling.
Open Access This article is distributed under the terms of the
Creative Commons Attribution License which permits any use, dis-
tribution, and reproduction in any medium, provided the original
author(s) and the source are credited.
References
1. Saasen A, Simpson M, Ribesen B, Høj J (2010) Anchor handling
and rig move for short weather windows during exploration
drilling. In: The IADC/SPE drilling conference and exhibition,
New Orleans
2. Lyng I (2008) Official norwegian reports: the loss of the ‘‘bour-
bon dolphin’’ on 12 April 2007. In: Technical report NOU 2008,
vol 8. Royal Norwegian Ministry of Justice and the Police
3. Nielsen LG (2004) Casualty report: Stevns power capsizing and
foundering during anchor handling operation on 19 October 2003.
In: Technical report 199940518, Danish Maritime Authority
J Mar Sci Technol (2015) 20:487–504 503
123

4. Gunnu GRS, Moan T (2012) Stability assessment of anchor
handling vessel during operation considering wind loads and
wave induced roll motions. In: The 22nd international offshore
and polar engineering conference. ISOPE, Rhodes
5. Hukkelas T (2012) How to increase the safety during anchor
handling operations?. Technical report, Kongsberg Maritime AS,
Kongsberg
6. Gunnu GRS, Moan T, Chen H (2010) Risk influencing factors
related to capsizing of anchor handling vessels in view of the
bourbon dolphin accident. In: The international conference on
systems engineering in ship and offshore design. Royal Institution
of Naval Architects, Bath
7. Ritchie G (2007) Practical introduction to anchor handling and
supply vessel operations, 2nd edn. Clarkson Research Services
Limited, London
8. Gibson V (2009) Supply ship operations, 3rd edn. La Madrila
Press, Aberdeen
9. IMCA (2000) Specification for DP capability plots. International
Marine Contractors Association, London
10. Gonsholt A, Nygard B (2002) Dp design studies. In: Dynamic
positioning conference. Marine Technology Society, Houston
11. IMCA (2009) International guidelines for the safe operation of
dynamically positioned offshore supply vessels. International
Marine Contractors Association, London
12. Augusto OB, Andrade BL (2003) Anchor deployment for deep
water floating offshore equipments. Ocean Eng 30(5):611–624
13. Wennersberg LAL (2009) Modeling and simulation of anchor
handling vessels. Thesis, Norwegian University of Science and
Technology
14. MSS, Marine systems simulator (2010) Technical report. http://
www.marinecontrol.org. Accessed 15 March 2011
15. Gunnu GRS, Wu X, Moan T (2012) Anchor handling vessel
behavior in horizontal plane in a uniform current field during
operation. In: Choo YS, Edelson DN, Mills T (eds) The 2nd
marine operations specialty symposium. Research Publishing
Services, Singapore
16. SIMO project team (2012) SIMO - Theory Manual Version 4.0
rev. 1, MARINTEK, Trondheim, Norway
17. Ormberg H, Passano E (2012) RIFLEX theory manual.
MARINTEK, Trondheim
18. Faltinsen OM (1990) Sea loads on ships and offshore structures.
Cambridge University Press, Cambridge
19. Naciri M, Sergent E (2009) Diffraction/radiation of 135,000 m3
storage capacity LNG carrier in shallow water: a benchmark
study. In: The ASME 2009 28th international conference on
ocean, offshore and arctic engineering. ASME, Honolulu
20. Wadam DNV (2010) Wave analysis by diffraction and Morison
theory. In: SESAM user manual. Det Norske Veritas, Høvik
21. Blendermann W (1994) Parameter identification of wind loads on
ships. J Wind Eng Ind Aerodyn 51(3):339–351
22. Ringen E, Moi S (2012) ShipX station keeping plug-in.
MARINTEK, Trondheim
23. Zhou L, Moan T, Riska K, Su B (2013) Heading control for
turret-moored vessel in level ice based on Kalman filter with
thrust allocation. J Mar Sci Technol 1–11
24. Fossen TI (2011) Handbook of marine craft hydrodynamics and
motion control. Wiley, West Sussex
25. DNV (2010) Recommended practice DNV-RP-C205, environ-
mental conditions and environmental loads. Det Norske Veritas,
Høvik
26. Rustad AM, Larsen CM, Sørensen AJ (2007) Deep water riser
collision avoidance by top tension control. ASME, London
27. ISO (2005) International standard ISO 19901-1. Metocean design
and operating considerations, 1st edn. In: Petroleum and natural
gas industries—specific requirements for offshore structures.
International Standard, Switzerland
28. DNV (2010) Offshore standard DNV-OS-E301, position moor-
ing. Det Norske Veritas, Høvik
504 J Mar Sci Technol (2015) 20:487–504
123