positive behavioral interventions and supports the children’s guild in anne arundel county kelly...
TRANSCRIPT

Positive Behavioral Interventions and Supports
The Children’s Guild in Anne Arundel County
Kelly Spanoghe, Ed.SExecutive Director

Demographics
Student capacity: 42Gender: 35 males 3 femalesEthnicity: 23 Caucasian 13 African American
2 Bi-racialSES: 50% free or reduced lunchHandicapping 61% Emotional Condition: Disturbance 39% Multi- Handicapped

Psychiatric Diagnosis
• 54% Oppositional Defiant Disorder• 49% Attention Deficit Hyperactivity
Disorder• 31% Bipolar disorder• 27% Post Traumatic Stress Disorder• 18% Dysthymia• 10% Asperger’s disorder• 3% Conduct Disorder
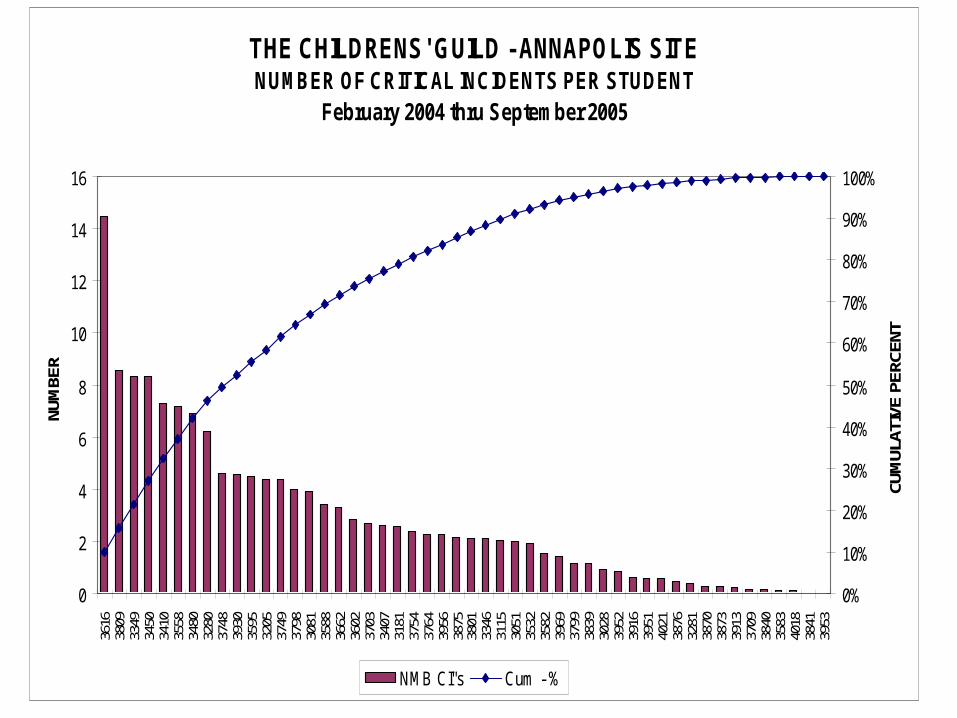
THE CHILDRENS' GUILD - ANNAPOLIS SITENUMBER OF CRITICAL INCIDENTS PER STUDENT
February 2004 thru September 2005
0
2
4
6
8
10
12
14
16
3616
3809
3349
3450
3410
3558
3480
3280
3748
3930
3595
3205
3749
3798
3081
3588
3662
3602
3703
3407
3181
3754
3764
3956
3875
3801
3346
3115
3051
3532
3582
3969
3799
3839
3028
3952
3916
3951
4021
3876
3281
3870
3873
3913
3709
3840
3583
4018
3841
3953
NUM
BER
0%
10%
20%
30%
40%
50%
60%
70%
80%
90%
100%
CUM
ULAT
IVE
PERC
ENT
NMB CI"s Cum - %
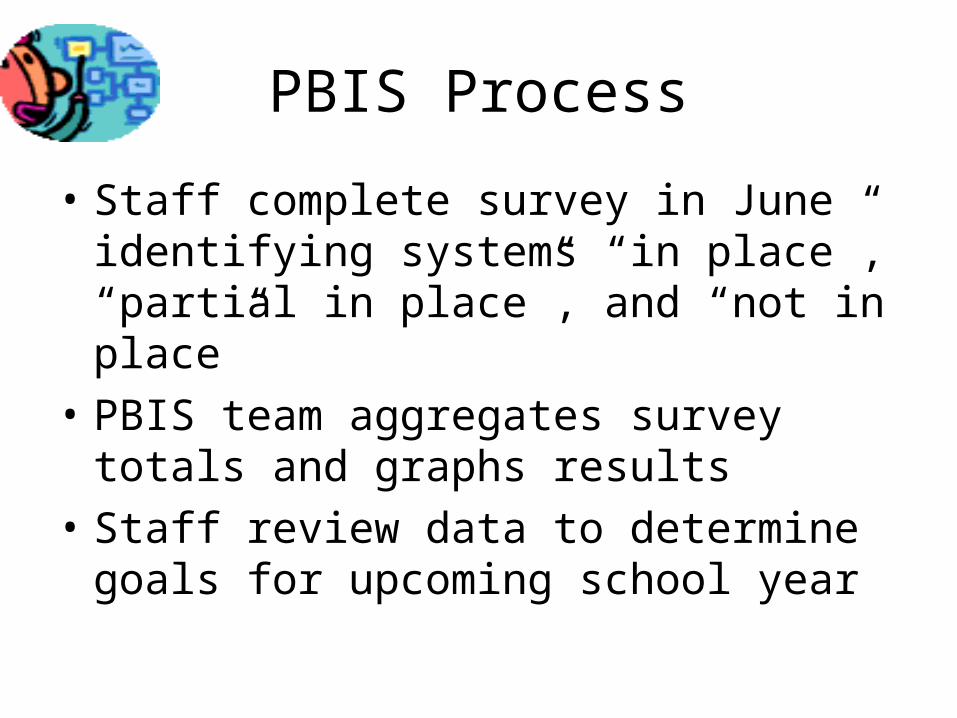
PBIS Process
• Staff complete survey in June identifying systems “in place”, “partial in place”, and “not in place”
• PBIS team aggregates survey totals and graphs results
• Staff review data to determine goals for upcoming school year

Survey ResultsSchool Wide Systems
313
206
274
207
75
204
160
86
2
79
163
0
50
100
150
200
250
300
350
In Place Partial in Place Not in Place
In Place 313 206 274 207
Partial in Place 75 204 160 86
Not in Place 2 79 16 3
SY 04-05 SY 03-04 SY 02-03 SY 01-02

Survey ResultsClassroom Systems
184
155
176
134
100
155150
73
2
25
157
0
20
40
60
80
100
120
140
160
180
200
In Place Partial in Place Not in Place
In Place 184 155 176 134
Partial in Place 100 155 150 73
Not in Place 2 25 15 7
SY 04-05 SY 03-04 SY 02-03 SY 01-02

Survey ResultsIndividual Student Systems
131
87
136
86
65
107
89
59
12
72
23
10
0
20
40
60
80
100
120
140
160
In Place Partial in Place Not in Place
In Place 131 87 136 86
Partial in Place 65 107 89 59
Not in Place 12 72 23 10
SY 04-05 SY 03-04 SY 02-03 SY 01-02

Survey ResultsNonclassroom Settings Sytems
162
104
150
101
66
129123
72
4
50
14
4
0
20
40
60
80
100
120
140
160
180
In Place Partial in Place Not in Place
In Place 162 104 150 101
Partial in Place 66 129 123 72
Not in Place 4 50 14 4
SY 04-05 SY 03-04 SY 02-03 SY 01-02
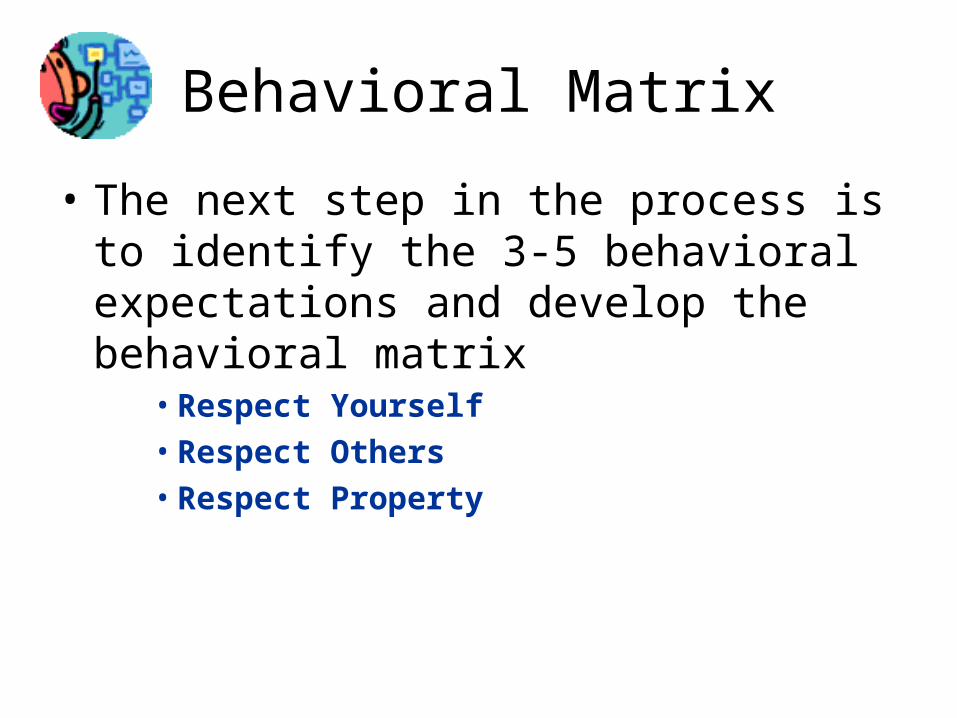
Behavioral Matrix
• The next step in the process is to identify the 3-5 behavioral expectations and develop the behavioral matrix
• Respect Yourself• Respect Others• Respect Property

Behavioral Matrix
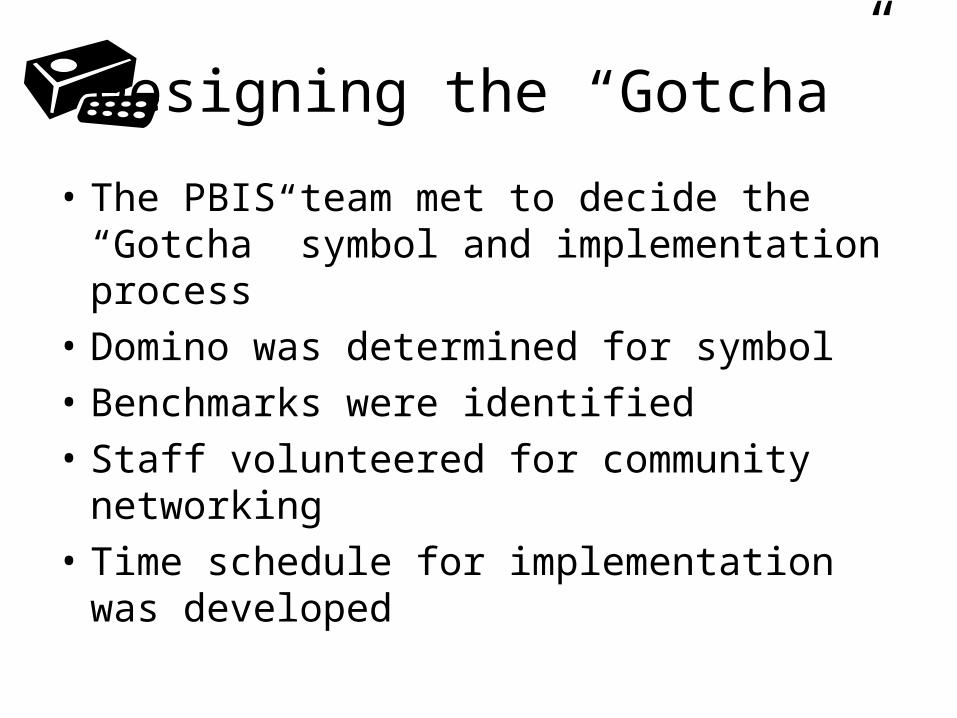
Designing the “Gotcha”
• The PBIS team met to decide the “Gotcha” symbol and implementation process
• Domino was determined for symbol
• Benchmarks were identified
• Staff volunteered for community networking
• Time schedule for implementation was developed

THE CHILDRENS' GUILD - ANNAPOLIS SITEMINUTES EXCLUDED FROM CLASS PER 100 CHILD SERVICE DAYS PER MONTH
0
100
200
300
400
500
600
700
800
900
1,000
FEB-
04
MAR
-04
APR-
04
MAY
-04
JUN-
04
ESY-
04
SEP-
04
OCT-
04
NOV-
04
DEC-
04
JAN-
05
FEB-
05
MAR
-05
APR-
05
MAY
-05
JUN-
05
ESY-
05
SEP-
05
OCT-
05
NOV-
05
DEC-
05
MIN
UTES
PER
100
CHI
LD S
ERVI
CE D
AYS
UNPL MEAN EXCLUSION (MIN)

Benefits
1.School Climate• Results in an increase in
the amount of positive feedback students receive
• Provides a reminder to staff to acknowledge studentbehaviors that exemplify thebehavioral expectations
• Students feel valued therebyresulting in a positive school climate

Benefits
2.Data Decision-making:• Staff participate in monthly data
management review meetings• Program decisions made based
on data• Staff identify problem areas
for data collection• PBIS team collects data and
prepares for monthlymeeting review
• Data management tools areintroduced to review data

Data Decision Making
• Professional developmentactivities:– Student groupings– Bus referrals– Time on task– Student attendance– Staff attendance– Crisis intervention trends
• Transitions• Time of day• Day of week• Booster activities
Benefits
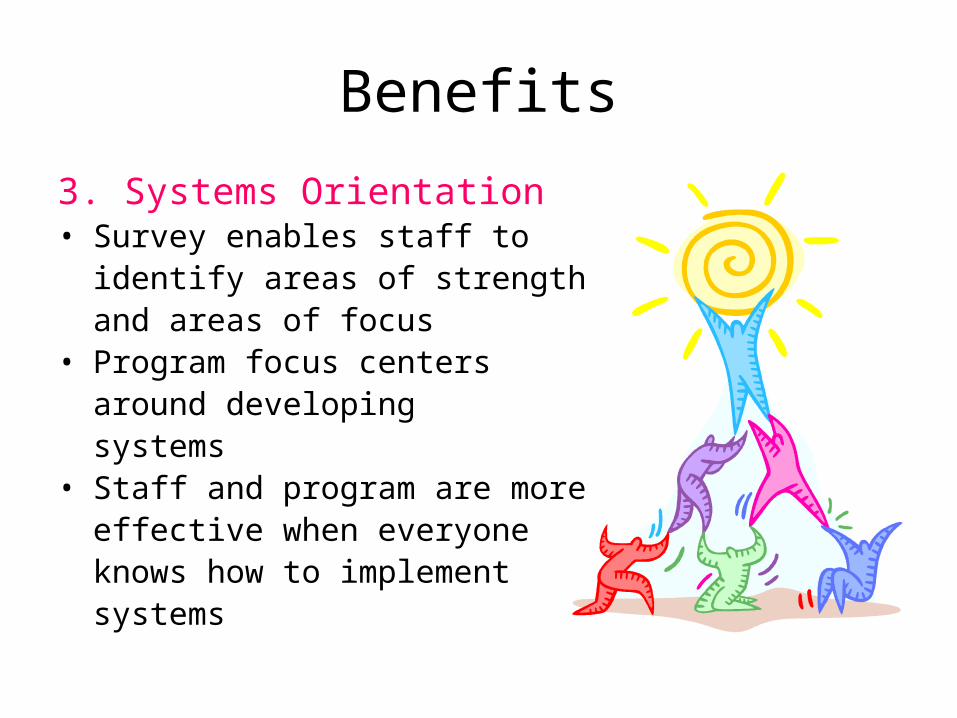
3. Systems Orientation• Survey enables staff to
identify areas of strengthand areas of focus
• Program focus centersaround developing systems
• Staff and program are moreeffective when everyone knows how to implementsystems

Alignment
• FEDERAL MANDATES
• No Child Left Behind– School Improvement Plan– Adequate Yearly Progress
• Reading• Math• Attendance

Alignment
• School Improvement Plan• AYP performance targets• Data collection/analysis/action plan• Professional development• Family/community involvement

Alignment
• Comar Regulations• 13A.08.04 Student Behavior Interventions
– School personnel are encouraged to use an array of positive behavior interventions, strategies and supports to increase or decrease targeted student behaviors
-Documentation of staff training methods and schedule
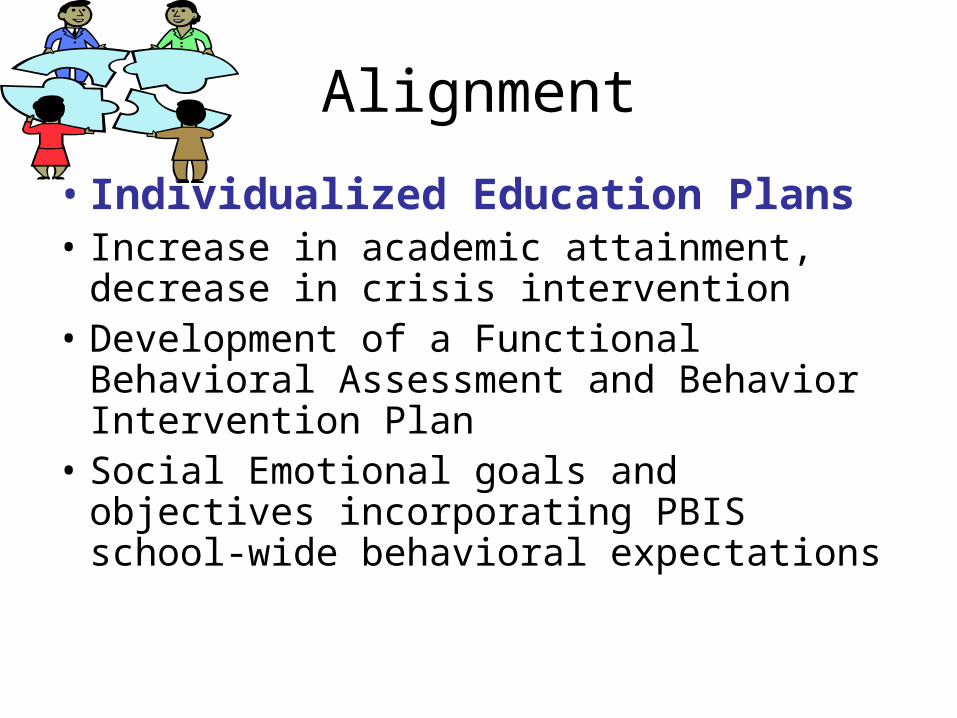
Alignment
• Individualized Education Plans• Increase in academic attainment,
decrease in crisis intervention• Development of a Functional Behavioral
Assessment and Behavior Intervention Plan
• Social Emotional goals and objectives incorporating PBIS school-wide behavioral expectations

PBIS Throughout the School Day
• Bus Domino
Students receive dominoes for displaying
appropriate behavior on the bus
• Morning Meeting
Staff identify behavioral
expectation from matrix for the
day’s focus

PBIS Throughout the Day
• Academics– Awarding of dominoes for
displaying behavioral
expectations
• Transitions
- Review behavioral
expectations for hallways
- Award dominoes
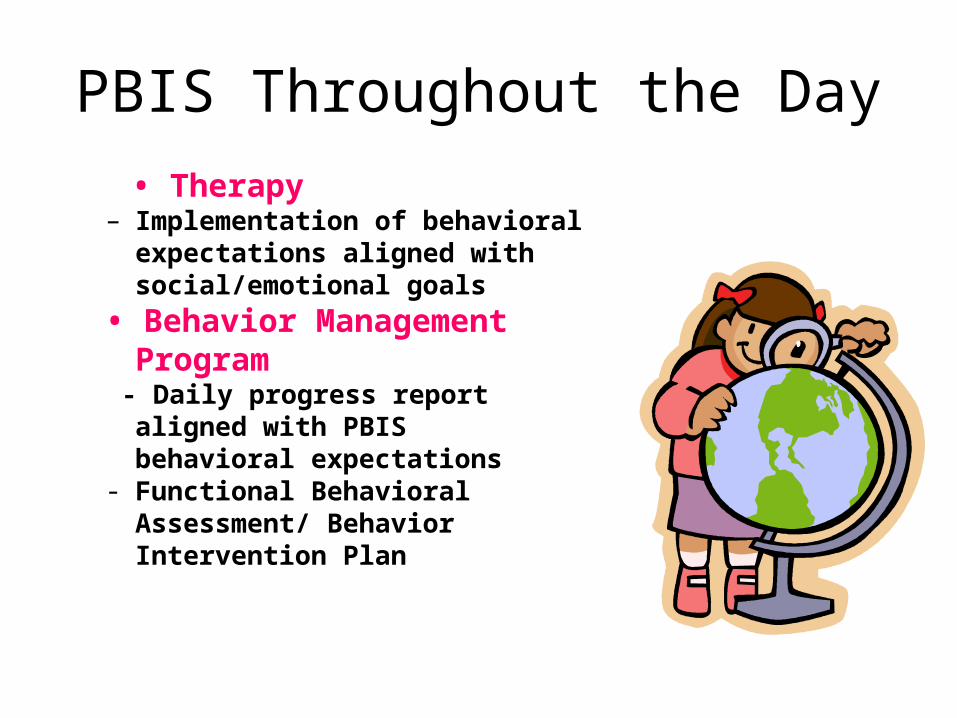
PBIS Throughout the Day
• Therapy– Implementation of behavioral
expectations aligned withsocial/emotional goals
• Behavior Management Program
- Daily progress report aligned with PBISbehavioral expectations
- Functional Behavioral Assessment/ BehaviorIntervention Plan

PBIS Throughout the Day
• Data Management •Students graph number of dominoes
received daily
•Students identify attainment of domino
benchmarks

Celebrations
• Students receive benchmarks at designated
intervals
• Weekly drawing for students and staff
• Classroom celebrations
• Program celebrations
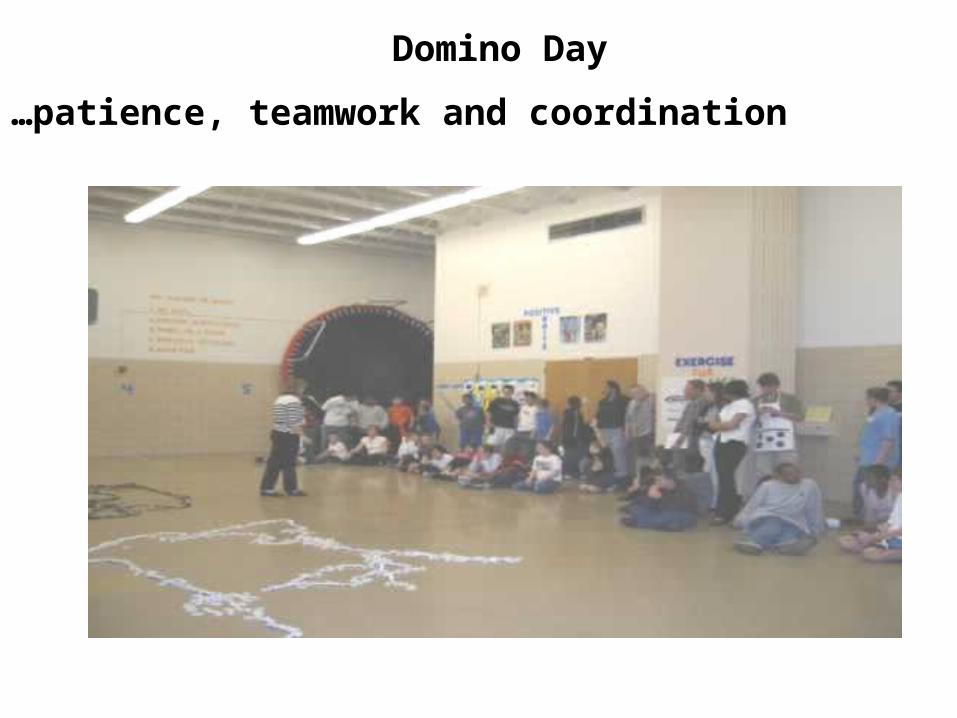
Domino Day
…patience, teamwork and coordination

Soooooooooo creative. . .

Dominos delivers, but we clean up !


