post conference 2009-mosl-co-part1-finalconference.motilaloswal.com/reports/agic2009.pdfdevelop...
TRANSCRIPT

Company ConnectKey takeaways from conference interactions
Research [email protected]
The companies which participated in the Motilal Oswal 5thAnnual Global Investor Conference offer a healthy varietyin terms of sector, size, geography, business model, etc.
One thing is common though: together, these companies formthe creamy layer of India’s capital markets. The 70 companiesare less than 2.5% of the total 3,000+ listed companies inIndia. But they account for 40% of sales, 57% of profitand 50% of India’s total listed market cap.
The following pages provide key takeaways from ourinteractions with these companies. We believe that many ofthese will be a significant beneficiary of India’s Next TrillionDollar opportunity.
2August 3 - 5, 2009
5th Annual Global Investor Conference
Company PageAnant Raj Industries ............................................... 3Axis Bank ............................................................... 4Bajaj Auto ............................................................. 5Bajaj Finserv .......................................................... 6Bank of Baroda ....................................................... 7Bank of India .......................................................... 8Bharat Forge .......................................................... 9Bharti Airtel .......................................................... 10Biocon .................................................................. 11BPCL .................................................................... 12Central Bank of India .............................................. 13Dabur India ........................................................... 14DLF ...................................................................... 15Dr Reddy’s Laboratories ......................................... 16Everest Kanto ........................................................ 17Financial Technologies ........................................... 18Great Eastern Shipping ........................................... 19Glenmark Pharmaceuticals ...................................... 20GMR Infrastructure ................................................ 21Godrej Consumer Products ..................................... 22Grasim Industries .................................................. 23GVK Power & Infrastructure .................................... 24HDFC Bank ............................................................ 25HDFC Standard Life ................................................ 26Hero Honda Motors ................................................ 27HPCL .................................................................... 28ICICI Bank ............................................................ 29Idea Cellular ......................................................... 30Info Edge .............................................................. 31Infosys Technologies .............................................. 32Jaiprakash Associates ............................................ 33Jet Airways ........................................................... 34Jindal Steel & Power .............................................. 35Larsen & Toubro .................................................... 36Lupin .................................................................... 37
Company PageMahindra & Mahindra ............................................. 38Mahindra Lifespaces .............................................. 39Marico .................................................................. 40Maruti Suzuki ........................................................ 41ONGC ................................................................... 42Pantaloon ............................................................. 43Piramal Healthcare ................................................ 44Reliance Capital ..................................................... 45Reliance Communication ........................................ 46Reliance Industries ................................................ 47Reliance Infrastructure ........................................... 48Reliance Power ..................................................... 49Rural Electrification Corporation .............................. 50SBI Life ................................................................. 51Shree Renuka Sugars ............................................ 52Shriram Transport Finance ..................................... 53Simplex Infrastructure ............................................ 54Sintex Industries .................................................... 55State Bank of India ................................................ 56Sterlite Industries .................................................. 57Sun Pharmaceuticals .............................................. 58Suzlon Energy ....................................................... 59Tata Consultancy Services ...................................... 60Tata Steel ............................................................. 61Time Technoplast .................................................. 62Titan Industries ..................................................... 63Union Bank of India ................................................ 64Unitech ................................................................. 65Vardhman Textiles ................................................. 66Voltas ................................................................... 67Wipro ................................................................... 68Yes Bank ............................................................... 69Zee Entertainment ................................................. 70Zee News ............................................................. 71
Index
3August 3 - 5, 2009
5th Annual Global Investor Conference
Anant Raj Industries
Key Takeaways
High quality landbankAnant Raj Industries (ARIL) is among the largest development and constructioncompanies in the National Capital Region (NCR). ARIL has a fully paid land bank of~982 acres with development potential of 77msf - largely in NCR (National CapitalRegion), with 90% within 50km of Delhi and 525 acres within Delhi. As majority ofits projects are on lease basis, securitization of rentals is a likely possibility.
High revenue and cash flow visibilityARIL has a strong project pipeline with high revenue visibility. It has two IT SEZs,~1.8msf at Manesar (70% leased) and ~2.1msf in Rai. ARIL has two retail propertiesin Delhi at Karol Baug (100% leased) and Keerti Nagar (50% leased out). Further,five of its hotel projects are likely to be operational from FY10 onwards. Of these,two hotel projects have been leased out to Park Lane.ARIL is likely to launch two residential projects totaling ~0.6msf in prime areas inDelhi - Hauzkhas (80 units) in FY10 and Bhagwandas (80 units) in FY11. Themanagement expects average rates of Rs20,000-25,000/sf from these two projects.According to the management, the aforementioned projects are likely to generateRs1.1b of rental income, which is likely to increase to Rs2.25b in FY11. During1QFY10, ARIL's rental income stood at Rs100m. Further, the management is targetingrevenues of Rs7.5b in FY10 and Rs12b in FY11 from the two planned residentiallaunches in prime areas of Delhi. The management estimates that ARIL would requireRs3b for the construction of its existing and planned projects.
To utilize net cash for new project acquisitionsAs of June 2009, ARIL has net cash of ~Rs7b, and ~Rs4b net of construction cost ofRs3b. ARIL sold land at Gurgaon for Rs800m during 1QFY10.The management plans to utilize these funds to acquire distressed assets. ARIL hasacquired ~3.4msf for a total consideration of ~Rs1.6b, which is required to be paidover a period 3-4 months. These include Noida (1.8msf at Rs600/sf), Gurgaon(0.2msf at Rs800/sf) and Manesar (1.4msf at Rs350/sf).Further, ARIL has formed strategic JVs with key investors: (i) JV with Reliance ADAGroup to develop 2 hotel projects and an IT SEZ, (ii) JV with Monsoon Capital todevelop ~1.8msf commercial project in Panchkula, Haryana, and (iii) co-investmentagreement with the Government of Singapore (GIC) to pursue investmentopportunities in infrastructure development and hospitality.
Valuation and viewWe believe ARIL is well placed to combat the challenges faced by the real estate industryowing to its high net cash of Rs7b, and high cash flow and revenue visibility. Not Rated.
Company Represented By:Mr Amit Sarin, Director and CEOMr Navneet Singh,General Manager
Covering Analyst(s):Siddharth Bothra+91 22 3982 [email protected]
Mansi Trivedi+91 22 3982 [email protected]
YEAR NET SALES PAT EPS EPS P/E P/BV ROE ROCE EV/ EV/
END (RS M) (RS M) (RS) GROWTH (%) (X) (X) (%) (%) SALES EBITDA
3/06A 568 281 9.1 6,071.0 15.1 8.5 11.4 23.4 8.1 11.43/07A 2,080 1,255 26.2 187.8 5.2 2.8 10.8 19.3 4.5 5.33/08A 6,038 4,364 74.0 182.3 1.9 1.4 15.2 26.2 0.4 0.53/09A 2,508 2,073 35.2 -52.5 3.9 1.2 6.3 8.9 0.7 0.8
Bloomberg ARCP INEquity Shares (m) 294.6CMP (Rs) 137Mcap (US$ b) 0.952 W Range 166 / 361, 6, 12 Rel Per 16 / 140 / -20

4August 3 - 5, 2009
5th Annual Global Investor Conference
Axis Bank
Key Takeaways
Growth outlook moderatedManagement sees industry loans growing 16-17% in FY10. Axis Bank aims to growits loan book at 20-25% instead of 25% as announced earlier. While sanctions arepicking up, disbursals could take longer.Infrastructure, cement, steel are likely to lead the growth based on existing sanctionsavailable. On the retail book, mortgages and car financing are the loan growthdrivers.While the yield on funds is expected to fall (due to pressure on loan growth andpricing), margins will stay at 3.25-3.5% as a fall in the cost of funds is expected tocompensate for falling yields.Management believes it can sustain a CASA ratio at 40% going forward.The borrower-wise outstanding restructured loan book was Rs22.6b or 2.9% of theloan book in June 2009. This number will rise in 2QFY10. Corporates including SME,comprise 90% of the restructured loans spread across 200 accounts.Management believes fee income will grow at least in line with loan-growth. Themanagement targets a cost-to-income ratio of 40-45% against 45-50% earlier.By the end of FY10, Tier-I CAR is seen falling to 8% from 9.4% currently.
Valuation and viewWe expect Axis Bank to report EPS of Rs60 in FY10 and Rs73 in FY11. BV will be Rs333in FY10E and Rs392 in FY11E. ABV is expected to be Rs318 in FY10E and Rs370 inFY11E. RoA and RoE are seen to be strong at 1.3% and more than 19% over FY10-11E.Maintain Buy with a target price of Rs980 (2.5x FY11E BV).
Company Represented By:Mr Somnath Sengupta,President-Finance and AccountsMr Shishir Mankad,VP - Finance and Accounts
Covering Analyst(s):Ajinkya Dhavale+91 22 3982 [email protected]
Alpesh Mehta+91 22 3982 [email protected]
YEAR NET INCOME PAT EPS EPS P/E P/BV CAR ROAE ROAA P/ABV
END (RS M) (RS M) (RS) GROWTH (%) (X) (X) (%) (%) (%) (X)
3/08A 43,808 10,710 29.9 28.0 28.4 3.5 13.7 17.6 1.2 3.5
3/09A 65,831 18,154 50.6 68.9 16.8 3.0 13.7 19.1 1.4 3.1
3/10E 81,507 21,554 60.0 18.7 14.2 2.6 12.4 19.4 1.3 2.7
3/11E 97,259 26,082 72.7 21.0 11.7 2.2 11.4 20.0 1.3 2.3
Bloomberg AXSB INEquity Shares (m) 357.7CMP (Rs) 851Mcap (US$ b) 6.452 W Range 974 / 2781, 6, 12 Rel Per -6 / 42 / 6

5August 3 - 5, 2009
5th Annual Global Investor Conference
Bajaj Auto
Key Takeaways
Product launches may drive volume growthBajaj Auto expects to post double-digit volume growth in FY10.It sees flat-to-marginally positive export volumes.Management hopes volume will be driven by new products such as Pulsar (35-40,000/month) and Discover 100 (25,000/month).Higher three-wheeler volume and the planned launch of three-wheeler goods andpassenger vehicles will support volumes.
EBITDA margins sustainable1QFY10 EBITDA margin improvement of 430bp QoQ (800bp YoY) to 19.5% wasdriven by higher hedged forex rate and higher operating leverage.The company has secured steel contracts until December as it entered into freshcontracts from July 1, which gave it a price rise of 2-3%. On aluminum it hascontracts until September 09.Hence EBITDA margins will be sustainable in 2QFY10.But the launch of the 100cc "volume" bike will dilute margins from 1QFY10 levels asit will earn lower-than-average margins.
Sees ramp-up at PantnagarBajaj Auto plans to ramp-up operations at its Pantnagar plant, where it enjoys fiscalincentives.From 41,000 units in April 09, it is targeting a ramp-up to 60,000/month (1,15,000units in 1QFY10).It makes the Platina, Platina 125 and XCD 135 at Pantnagar. It plans to produce 50%of its "volume" bike at Pantnagar and the rest at Chakan.
Other takeawaysFinance availability for two-wheelers not improved. Out of the 25% of vehicles soldon credit, Bajaj Auto Finance financed most of them.Indonesian operations, which lost Rs600m in FY09 (Rs110m loss in 1QFY10), isseen to break even in FY11.Focus on the African market, where competition comes from Chinese firms.Plans to boost market share by increasing investment in advertising, marketing anddistribution.
Valuations and viewVolume recovery in domestic and exports, coupled with higher hedged forex rates willboost profitability. Higher volumes and market share recovery will be a catalyst for thestock. It trades at 15.5x FY10E EPS and 14.5x FY11E EPS. Maintain Buy.
Company Represented By:Mr Kevin D'sa, VP - Finance
Covering Analyst(s):Jinesh Gandhi+91 22 3982 [email protected]
Bloomberg BJAUT INEquity Shares (m) 144.7CMP (Rs) 1,283Mcap (US$ b) 3.952 W Range 1358 / 2621, 6, 12 Rel Per 21 / 107 / 136
YEAR NET SALES PAT EPS EPS P/E P/BV ROE ROCE EV/ EV/
END (RS M) (RS M) (RS) GROWTH (%) (X) (X) (%) (%) SALES EBITDA
3/08A 90,462 8,241 57.0 20.2 10.5 51.9 42.4 1.8 12.4
3/09A 88,104 7,963 55.0 -3.4 23.3 11.0 47.2 36.3 2.1 15.3
3/10E 97,963 11,994 82.9 50.6 15.5 7.4 47.9 43.7 1.8 9.8
3/11E 105,177 12,828 88.7 6.9 14.5 5.5 38.1 38.5 1.6 8.9

6August 3 - 5, 2009
5th Annual Global Investor Conference
Bajaj Finserv
Key Takeaways
Life insurance business (Bajaj Allianz Life Insurance)The company will continue to focus on profitability and operational/capital efficiencyrather than market share. Over a longer period, it believes that 15-20% RoE ispossible from this business. While its reported NBAP is ~19%, it is having an expenseunder run currently.Private life insurance companies are expected to grow 10-15% annually. Bajaj AllianzLife Insurance would be content to consolidate for one or two years as the industryrationalizes before growing in double digits.Bajaj Allianz's business model includes: (1) higher exposure to low ticket sizes andTier III/IV cities, and (2) low cost working. The management believes this makes itsproposition unique for sustaining the downturn.The company expects distributors' commissions to decline so that the customergets the best return in the final analysis.Bajaj Allianz Life Insurance does not foresee strong competition from newer playersas ability to burn capital will be a constraint for them.
General insurance business (Bajaj Allianz General Insurance)Bajaj Allianz General Insurance will continue to focus on profitable motor and healthinsurance products.In the near term, the company will focus upon preserving profitability, maintainingmarket share and effectively utilizing capital.
Bajaj Auto FinanceThe company will focus on gradual pace of organic growth. It has also tightenedcredit standards.The company will also launch construction equipment finance business.For improving profitability the company plans to: (1) focus on reducing operatingexpenses, (2) explore portfolio acquisition (to leverage capital), and (3) cross-sellproducts.
Company Represented By:Mr Sanjiv Bajaj, MDMr Ranjit Gupta, President (Ins)Mr S Sreenivasan, CFO (Gen. Ins)
Covering Analyst(s):Ajinkya Dhavale+91 22 3982 [email protected]
Alpesh Mehta+91 22 3982 [email protected]

7August 3 - 5, 2009
5th Annual Global Investor Conference
Bank of Baroda
Key Takeaways
Focus on qualitative growthThe management is confident of growing assets at a pace higher than industry. Thebank's FY10 loan growth is seen at 22%.CASA remains the key focus area and management is reluctant to fund asset growththrough bulk deposits. BoB's CASA ratio at 35% and CASA growth at 18-20% is oneof the best among its peers.The 1QFY10 margin decline (2.37% from 2.91% in 4QFY09), is an aberration, not atrend. With loan growth picking up and downward re-pricing of deposits, managementis sure of achieving sustainable 2.7% NIM by FY10.Management believes fee-income growth will be at least in line with loan growthdue to the diversified nature of fee income.Management is focusing on improving its cost-to-income ratio and sees higheroperating leverage in future.BoB's asset quality is among the best with net NPA at 0.3% and coverage of 82%.Restructured loans, which comprise 2.8% of the book, remain the best among itspeer banks. The management foresees no large account restructuring in the nearfuture. Management indicated it would not compromise asset quality to gain marketshare.Management is confident of sustaining at least 1% RoA and 18% RoE.
Valuation and viewWe expect BoB to post EPS of Rs61 in FY10 and Rs76 in FY11.BV will be Rs364 in FY10E and Rs422 in FY11E.RoA will be 0.9-1%+ and RoE at 18-19% over the next two years.The stock trades at 1x FY11E BV and 5.7x FY11E EPS. Maintain Buy with top pickstatus.
Company Represented By:Mr R K Bakshi, EDDr Rupa Nitsure, Chief economist
Covering Analyst(s):Ajinkya Dhavale+91 22 3982 [email protected]
Alpesh Mehta+91 22 3982 [email protected]
YEAR NET INCOME PAT EPS EPS P/E P/BV CAR ROAE ROAA P/ABV
END (RS M) (RS M) (RS) GROWTH (%) (X) (X) (%) (%) (%) (X)
3/08A 59,628 14,355 39.3 39.8 11.1 1.6 12.9 15.8 0.9 1.7
3/09A 78,811 22,272 60.9 55.1 7.2 1.4 14.1 20.9 1.1 1.4
3/10E 79,242 22,382 61.2 0.5 7.1 1.2 13.5 18.0 0.9 1.2
3/11E 93,671 27,878 76.3 24.6 5.7 1.0 12.9 19.4 1.0 1.1
Bloomberg BOB INEquity Shares (m) 365.5CMP (Rs) 437Mcap (US$ b) 3.452 W Range 485 / 1701, 6, 12 Rel Per -6 / 4 / 40
8August 3 - 5, 2009
5th Annual Global Investor Conference
Bank of India
Key Takeaways
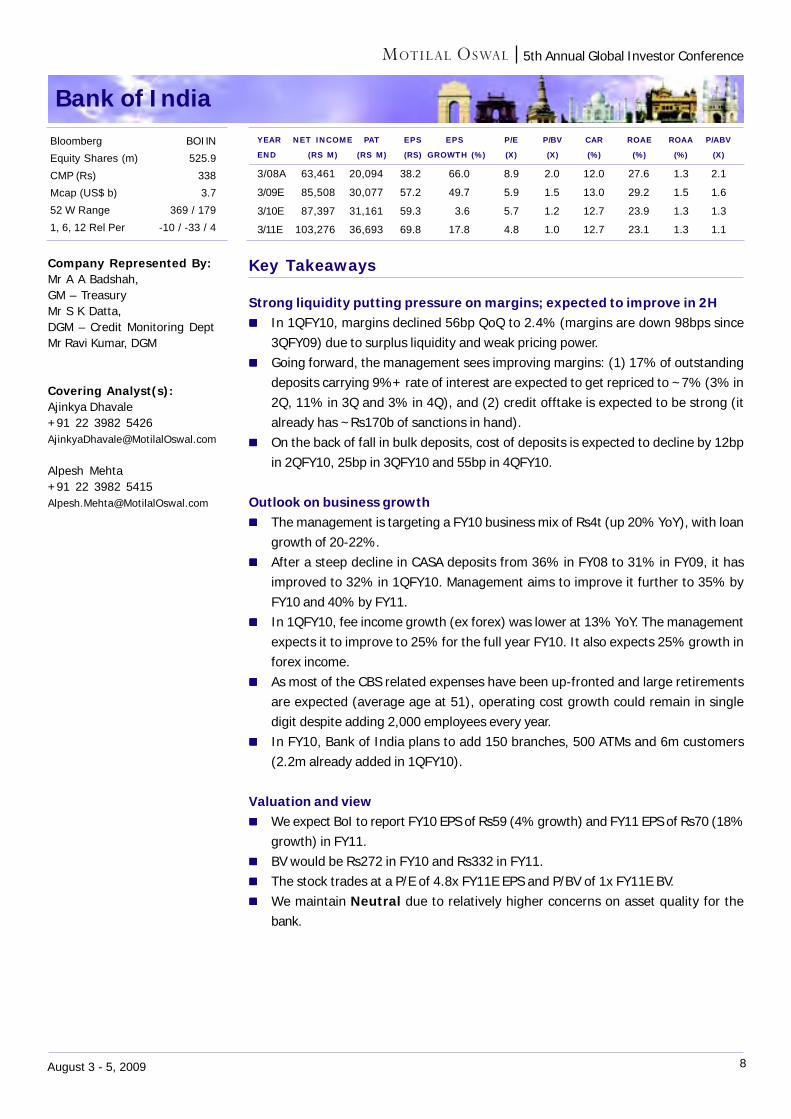
Strong liquidity putting pressure on margins; expected to improve in 2HIn 1QFY10, margins declined 56bp QoQ to 2.4% (margins are down 98bps since3QFY09) due to surplus liquidity and weak pricing power.Going forward, the management sees improving margins: (1) 17% of outstandingdeposits carrying 9%+ rate of interest are expected to get repriced to ~7% (3% in2Q, 11% in 3Q and 3% in 4Q), and (2) credit offtake is expected to be strong (italready has ~Rs170b of sanctions in hand).On the back of fall in bulk deposits, cost of deposits is expected to decline by 12bpin 2QFY10, 25bp in 3QFY10 and 55bp in 4QFY10.
Outlook on business growthThe management is targeting a FY10 business mix of Rs4t (up 20% YoY), with loangrowth of 20-22%.After a steep decline in CASA deposits from 36% in FY08 to 31% in FY09, it hasimproved to 32% in 1QFY10. Management aims to improve it further to 35% byFY10 and 40% by FY11.In 1QFY10, fee income growth (ex forex) was lower at 13% YoY. The managementexpects it to improve to 25% for the full year FY10. It also expects 25% growth inforex income.As most of the CBS related expenses have been up-fronted and large retirementsare expected (average age at 51), operating cost growth could remain in singledigit despite adding 2,000 employees every year.In FY10, Bank of India plans to add 150 branches, 500 ATMs and 6m customers(2.2m already added in 1QFY10).
Valuation and viewWe expect BoI to report FY10 EPS of Rs59 (4% growth) and FY11 EPS of Rs70 (18%growth) in FY11.BV would be Rs272 in FY10 and Rs332 in FY11.The stock trades at a P/E of 4.8x FY11E EPS and P/BV of 1x FY11E BV.We maintain Neutral due to relatively higher concerns on asset quality for thebank.
Company Represented By:Mr A A Badshah,GM – TreasuryMr S K Datta,DGM – Credit Monitoring DeptMr Ravi Kumar, DGM
Covering Analyst(s):Ajinkya Dhavale+91 22 3982 [email protected]
Alpesh Mehta+91 22 3982 [email protected]
YEAR NET INCOME PAT EPS EPS P/E P/BV CAR ROAE ROAA P/ABV
END (RS M) (RS M) (RS) GROWTH (%) (X) (X) (%) (%) (%) (X)
3/08A 63,461 20,094 38.2 66.0 8.9 2.0 12.0 27.6 1.3 2.1
3/09E 85,508 30,077 57.2 49.7 5.9 1.5 13.0 29.2 1.5 1.6
3/10E 87,397 31,161 59.3 3.6 5.7 1.2 12.7 23.9 1.3 1.3
3/11E 103,276 36,693 69.8 17.8 4.8 1.0 12.7 23.1 1.3 1.1
Bloomberg BOI INEquity Shares (m) 525.9CMP (Rs) 338Mcap (US$ b) 3.752 W Range 369 / 1791, 6, 12 Rel Per -10 / -33 / 4

9August 3 - 5, 2009
5th Annual Global Investor Conference
Bharat Forge
Key Takeaways
Initial signs of improvement, after witnessing worst in 3Q/4QFY09Volumes in Bharat Forge's (BFL) key CV segment have witnessed improvement inall geographies as 3Q/4Q witnessed significant correction in inventory.BFL has taken initiatives to bring down breakeven capacity utilization in all thegeographies. Currently, it would breakeven at ~50% utilization in US & EU and~35% in India. Excluding one-offs, its global operations should be near break-evenlevels, whereas India operations are profit making.It has witnessed no bad debts in any of the geographies. It doesn't have any directexposure to OEMs like GM, Chrysler, etc; however, it supplies to them through tier-I vendors like ZF AG. Further, its exposure to GM has reduced from 60-65% to 35%.
Significant opportunity arising from structural shift in the industryThe global economic crisis has resulted in two key trends: (1) bankruptcy of itspeers, and (2) focus on small cars.Bankruptcy of its global competitors provides BFL an opportunity to move up thevalue chain, as global OEMs replace troubled tier-I suppliers with BFL.Shift in demand towards smaller fuel efficient cars augurs well for BFL, as globalOEM's with integrated facilities for SUVs and pick-ups, are not willing to invest innew facilities, resulting in higher outsourcing.
Focus on doubling non-auto contribution to revenues to 40% by FY13As against 20% currently, BFL is targeting 40% of revenue from non-auto businessesby 2012 and 60% by 2015. This is mainly turbine generators (TG), and heavy forgingsfor nuclear, hydro power and wind turbine generators. This is expected to improveEBITDA margin, RoCE and cash generation.BFL has entered into a 50:50 JV with Alstom for manufacturing supercritical TG withcapacity of 5,000MW by FY13. The JV has already participated in bulk project awardsfrom NTPC (11*660MW).BFL has also entered into a JV with Areva for heavy forgings to cater to the nuclearmarket in India. The JV would have assured procurement of up to 70% from Areva.The JV will cater to nuclear power, hydro power etc, and will have a 14,000 tonforging press which would be operational by 2012.The Maharashtra government has signed an LoI with Areva to set up 10,000MW ofnuclear power capacity at a cost of Rs650b. This could be substantial opportunityfor the forging JV.
Valuations and viewThe stock currently trades at 33x FY10E consolidated consensus EPS of Rs7.3 and 22.3xFY11E consolidated consensus EPS of Rs10.8. We do not have rating on the stock.
Company Represented By:Mr Amit Kalyani,Executive Director
Covering Analyst(s):Jinesh Gandhi+91 22 3982 [email protected]
Bloomberg BHFC INEquity Shares (m) 237.3CMP (Rs) 241Mcap (US$ b) 1.252 W Range 283 / 691, 6, 12 Rel Per 64 / 130 / -12
YEAR NET SALES PAT EPS EPS P/E P/BV ROE ROCE EV/ EV/
END (RS M) (RS M) (RS) GROWTH (%) (X) (X) (%) (%) SALES EBITDA
03/06A 29,715 2,505 10.8 -77.7 28.2 18.8
03/07A 41,489 2,835 12.1 12.0 20.6 14.0
03/08A 45,976 2,908 12.4 2.8 18.5 12.2
03/09A 47,112 411 1.7 -86.5 144.0 3.3 2.5 2.8 1.5 19.7

10August 3 - 5, 2009
5th Annual Global Investor Conference
Bharti Airtel
Key Takeaways
Rural market remains attractiveBharti remains sanguine about the rural markets and believes that economic growthin rural India would continue unabated.Rural India accounted for ~55% of wireless subscriber additions for Bharti in 4QFY09.This share is likely to expand going forward, as wireless penetration in rural Indiastill remains significantly low at 15-16% as against ~35% for the overall Indianmarket.ARPU in rural markets remains attractive at ~2/3rd of the overall Indian marketARPU.
Low tariffs (high affordability) is the safety net against competitionBharti believes that very low tariffs prevailing in the Indian market are the biggestsafety net for incumbents against increasing competition.Bharti's significant coverage advantage would ensure that incremental margins arein line with the current margin profile.Mr Gupta also emphasized on the secular demand growth in telecom services,which leads to stable industry outlook.
3G likely in late CY09/early CY10Bharti expects 3G spectrum auction/allocations in late CY09/early CY10.The company believes that wireless is the only viable option for India to improvebroadband reach.WCDMA/HSPA is likely to be the preferred technology for providing broadband.
High tariffs, low penetration makes Africa an attractive marketMr Gupta believes that high tariffs and relatively low penetration in Africa makes itan attractive market for Bharti.Scope for cost and tariff reductions could trigger significant volume growth opportunityin the African markets.
Valuations and viewBharti trades at an EV of 7.4x FY11E EBITDA and 12.9x FY11E EPS.Bharti remains best-placed, given low capex intensity, un-leveraged balance sheet,and scale advantage.Maintain Buy with a target of Rs492.
Company Represented By:Mr Akhil Gupta, DirectorMr Harjeet Kohli,Group Treasurer
Covering Analyst(s):Shobhit Khare+91 22 3982 [email protected]
YEAR NET SALES PAT EPS EPS P/E P/BV ROE ROCE EV/ EV/
END (RS M) (RS M) (RS) GROWTH (%) (X) (X) (%) (%) SALES EBITDA
3/08A 270,250 67,008 17.7 57.4 22.7 6.7 36.9 25.8 5.8 13.8
3/09A 369,615 84,699 22.3 26.4 18.0 4.8 31.4 23.8 4.3 10.5
3/10E 420,025 104,388 27.5 23.2 14.6 4.0 30.0 21.5 3.7 8.7
3/11E 468,526 117,761 31.1 12.8 12.9 3.1 27.1 21.2 3.2 7.4
Bloomberg BHARTI INEquity Shares (m) 3795.2CMP (Rs) 401Mcap (US$ b) 32.152 W Range 518 / 2421, 6, 12 Rel Per -11 / -47 / -11

11August 3 - 5, 2009
5th Annual Global Investor Conference
Biocon
Key Takeaways
Contract research, insulin to be drive growth in the medium term; Long-termbenefits from BiogenericsContract research to grow at over 20% in FY10: Biocon's contract researchsubsidiary (Syngene) recently began to execute the BMS contract, which is likely togradually ramp up over the next few quarters. This business is expected to record over20% growth in FY10. We estimate 26% CAGR for this business over FY09-11.
Multiple initiatives in Insulin space: Biocon continues its insulin filings in emergingmarkets with few approvals to come through annually for the next two years. It alsohas tie-ups in regulated markets for supply of insulin crystals. Its oral insulin NCErecently started Phase-III trials in India. We believe Biocon's insulin initiative (API,formulation & NDDS) will be a key growth driver in the coming years.Biogeneric collaboration with Mylan is long-term positive: Biocon enteredinto collaboration with Mylan (USA) for development, manufacture and distributionof biogenerics. Mylan and Biocon will share development, capital and certain othercosts to commercialize biogenerics. This is a long-term positive for Biocon as it getsa partner to share development costs and Biocon can leverage Mylan's distributionstrengths in the US and Europe. The cost of sharing will ensure that Biocon's P&Ldoes not get overburdened by the costs of developing biogenerics. But revenuefrom this tie-up is expected to start accruing only after two or three years. In theinterim Biocon will be entitled to milestone payments from Mylan.Biocon to R&D expenses: Management says R&D expenses are likely to increaseto 8% of revenue over the next two years as some of the NCEs progress into clinicaltrials. Biocon expects to complete Phase-III trials for its oral insulin NCE in the next12 months and expects to launch it in India in FY11 after which it will explore thepossibility of out-licensing the NCE for developed markets.Targets domestic formulation revenue of Rs5b over 3-5 years: Bioconentered the domestic formulations market three years ago and generated revenueof over Rs1b in FY09. Management targets revenue of Rs5b from this initiative overthe next three to five years.
Valuation and viewKey growth drivers for FY10E will be traction in Biocon's insulin initiative, contributionfrom immuno-suppressants and ramp-up in the contract research business. But higherR&D costs, increased depreciation and higher expenses, linked to the scale-up of thedomestic formulations business, will continue to temper earnings growth. We expectFY10 EPS of Rs13 (up 176% on a low base) and FY11 EPS of Rs15.2 (up 17.8%). Thestock is valued at 18.2x FY10E and 15.5x FY11E earnings. Maintain Buy.
Company Represented By:Mr Murali Krishnan K NPresident - Group Finance
Covering Analyst(s):Nimish Desai+91 22 3982 [email protected]
YEAR NET SALES PAT EPS EPS P/E P/BV ROE ROCE EV/ EV/
END (RS M) (RS M) (RS) GROWTH (%) (X) (X) (%) (%) SALES EBITDA
03/08A 10,542 2,250 22.5 12.4 10.4 1.6 15.2 13.6 4.2 14.9
03/09A 16,091 935 4.7 -79.2 50.2 3.1 6.2 6.2 3.0 14.9
03/10E 21,257 2,574 12.9 175.4 18.2 2.7 15.1 15.8 2.2 10.6
03/11E 23,616 3,033 15.2 17.8 15.5 2.4 15.6 16.2 1.9 9.3
Bloomberg BIOS INEquity Shares (m) 200.0CMP (Rs) 235Mcap (US$ b) 1.052 W Range 243 / 851, 6, 12 Rel Per -2 / 55 / 14
12August 3 - 5, 2009
5th Annual Global Investor Conference
BPCL
Key Takeaways
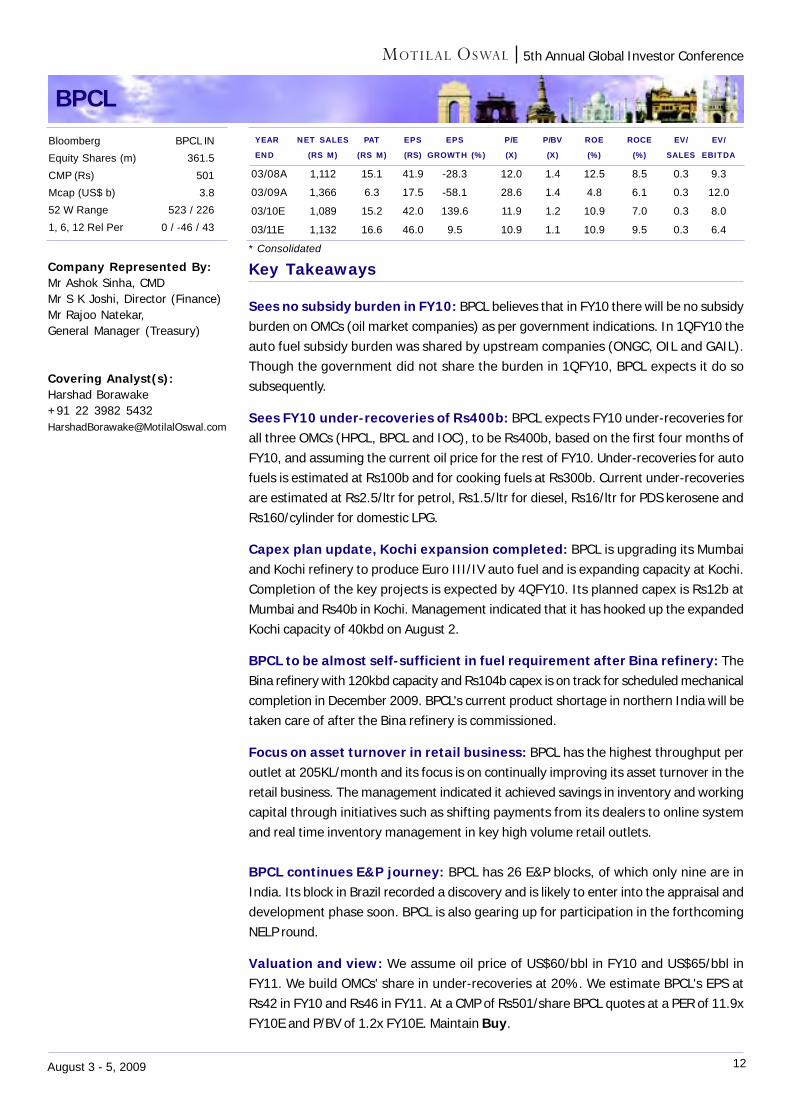
Sees no subsidy burden in FY10: BPCL believes that in FY10 there will be no subsidyburden on OMCs (oil market companies) as per government indications. In 1QFY10 theauto fuel subsidy burden was shared by upstream companies (ONGC, OIL and GAIL).Though the government did not share the burden in 1QFY10, BPCL expects it do sosubsequently.
Sees FY10 under-recoveries of Rs400b: BPCL expects FY10 under-recoveries forall three OMCs (HPCL, BPCL and IOC), to be Rs400b, based on the first four months ofFY10, and assuming the current oil price for the rest of FY10. Under-recoveries for autofuels is estimated at Rs100b and for cooking fuels at Rs300b. Current under-recoveriesare estimated at Rs2.5/ltr for petrol, Rs1.5/ltr for diesel, Rs16/ltr for PDS kerosene andRs160/cylinder for domestic LPG.
Capex plan update, Kochi expansion completed: BPCL is upgrading its Mumbaiand Kochi refinery to produce Euro III/IV auto fuel and is expanding capacity at Kochi.Completion of the key projects is expected by 4QFY10. Its planned capex is Rs12b atMumbai and Rs40b in Kochi. Management indicated that it has hooked up the expandedKochi capacity of 40kbd on August 2.
BPCL to be almost self-sufficient in fuel requirement after Bina refinery: TheBina refinery with 120kbd capacity and Rs104b capex is on track for scheduled mechanicalcompletion in December 2009. BPCL's current product shortage in northern India will betaken care of after the Bina refinery is commissioned.
Focus on asset turnover in retail business: BPCL has the highest throughput peroutlet at 205KL/month and its focus is on continually improving its asset turnover in theretail business. The management indicated it achieved savings in inventory and workingcapital through initiatives such as shifting payments from its dealers to online systemand real time inventory management in key high volume retail outlets.
BPCL continues E&P journey: BPCL has 26 E&P blocks, of which only nine are inIndia. Its block in Brazil recorded a discovery and is likely to enter into the appraisal anddevelopment phase soon. BPCL is also gearing up for participation in the forthcomingNELP round.
Valuation and view: We assume oil price of US$60/bbl in FY10 and US$65/bbl inFY11. We build OMCs' share in under-recoveries at 20%. We estimate BPCL's EPS atRs42 in FY10 and Rs46 in FY11. At a CMP of Rs501/share BPCL quotes at a PER of 11.9xFY10E and P/BV of 1.2x FY10E. Maintain Buy.
Company Represented By:Mr Ashok Sinha, CMDMr S K Joshi, Director (Finance)Mr Rajoo Natekar,General Manager (Treasury)
Covering Analyst(s):Harshad Borawake+91 22 3982 [email protected]
YEAR NET SALES PAT EPS EPS P/E P/BV ROE ROCE EV/ EV/
END (RS M) (RS M) (RS) GROWTH (%) (X) (X) (%) (%) SALES EBITDA
03/08A 1,112 15.1 41.9 -28.3 12.0 1.4 12.5 8.5 0.3 9.3
03/09A 1,366 6.3 17.5 -58.1 28.6 1.4 4.8 6.1 0.3 12.0
03/10E 1,089 15.2 42.0 139.6 11.9 1.2 10.9 7.0 0.3 8.0
03/11E 1,132 16.6 46.0 9.5 10.9 1.1 10.9 9.5 0.3 6.4
Bloomberg BPCL INEquity Shares (m) 361.5CMP (Rs) 501Mcap (US$ b) 3.852 W Range 523 / 2261, 6, 12 Rel Per 0 / -46 / 43
* Consolidated
13August 3 - 5, 2009
5th Annual Global Investor Conference
Central Bank of India
Key Takeaways
Profit growth over businessCentral Bank of India (CBoI) management's current focus is to grow profits than balancesheet size. Its thrust areas are: (1) other income growth, (2) reducing dependence ofbulk business (loans as well as deposits), and (3) reducing NPAs and recovering written-off accounts.
Margins seen at 2.25% by March 2010 from 1.8% currentlyCost of funds is likely to fall as ~30% of deposits carrying 10%+ rate of interest arecoming up for repricing in the rest of FY10. Yield on loans is expected to improve due toincreasing share of retail and SME loans. Improvement in CD ratio (64% as on 1QFY10)and higher share of low cost deposits should also help improve margins.
Operating leverage to boost return ratiosStaff cost growth is likely to remain low as 2,500-3,000 employees are expected toretire every year over the next three years. Complete CBS rollout (100% by September2009) is also expected to reduce cost of operations.
CAR to remain above 13%CBoI's CAR stood at 13.4% with Tier I ratio of 7.17%. Government of India has recentlyinfused Rs7b and is expected to infuse 7b more in FY10. We believe capital is not aconstraint for growth in the near term.
Asset quality a focus areaIn 1QFY10, GNPA declined 4% QoQ to Rs22.3b and provision coverage ratio stood strongat 73%. Cumulative restructured loans stood at 35b (~4% of book). The managementclaims that higher share of corporate lending (~68%) will help to improve asset quality.CBoI has written off asset pool of Rs40b where recoveries can be significant inmanagement's view.
Other highlightsCBoI has recently launched 'Operation Nav Chetana' to rejuvenate its staff, branchesand client coverage. It has also opened 14 centralized credit processing centers toincrease flow of credit to the retail sector. Large- and mid-corporate vertical brancheshave been opened and six asset recovery branches have also been established.
Valuation and viewCBoI trades at 7.3x FY09 EPS of Rs14.1, 1.2x FY09 BV of Rs86 and 1.5x FY09 ABV ofRs68. RoA was lower at 0.43% and RoE was at 14.4% on back of higher leverage. Wehave no rating on the stock.
Company Represented By:Mr S Sridhar, CMDMr Arun Kaul, Executive Director
Covering Analyst(s):Ajinkya Dhavale+91 22 3982 [email protected]
Alpesh Mehta+91 22 3982 [email protected]
YEAR NET INCOME PAT EPS EPS P/E P/BV CAR ROE ROA P/ABV
END (RS M) (RS M) (RS) GROWTH (%) (X) (X) (%) (%) (%) (x)
3/06A 29,649 2,574 7.9 -28.0 12.9 1.6 11.0 12.6 0.4 1.73/07A 31,134 4,980 15.4 93.5 6.7 1.3 10.4 21.5 0.6 1.83/08 30,161 5,522 13.7 10.9 7.5 1.3 10.4 16.8 0.5 1.83/09E 32,984 5,712 14.1 14.1 7.3 1.2 13.1 14.4 0.4 1.5
Bloomberg CBOI INEquity Shares (m) 404.1CMP (Rs) 103Mcap (US$ b) 0.952 W Range 106 / 301, 6, 12 Rel Per -2 / 93 / 52
14August 3 - 5, 2009
5th Annual Global Investor Conference
Dabur India
Key Takeaways
Volume leads growth; No impact of monsoons on sales yetDabur's growth story (led by volumes) continues with 13% volume growth in FY09, 16%in 1QFY10. July sales maintained the momentum with no visible impact of the delayedmonsoon on demand. Management indicated government spending on NREGS and otherinitiatives might keep intact demand growth in the near term. But deficient monsoonsnext year might hurt consumer demand.
Fem Care is the missing linkDabur's management indicated that with its purchase of Fem Care it acquired a missinglink in its portfolio, giving it market leadership in niche skin-care category. Themanagement is focused on boosting sales growth and profitability. Dabur launched Femherbal bleach and plans to focus on new skin solutions, distribution expansion andmarketing.
New launches to boost sales; enters niche categoriesHair care has been augmented with Dabur Protect Shampoo (positioned as a familyhealth shampoo), Amla Flower Magic and Dabur Almond Hair Oil. Dabur test launchedits new ayurvedic skin-care range under the brand Uveda. The brand will be present inthe face-wash, moisturizer and fairness-cream segments and is priced at par withGarnier and Everyuth. Dabur will use Uveda for its skin-care products and the Vatikabrand only for hair-care products. Real Burrst's full-scale launch is expected next year.
Home care to stay competitive, Hair care, shampoos to maintain momentumThe home-care segment is growing at 8-10% against expectations of 20-25% CAGR.Competition is stiffening in this category from launches by branded players and privatelabels. Hair-oils and shampoos are expected to keep growing strongly. Dabur is short ofcapacity in shampoos and can increase sales growth further. Hair-oil growth will be ledby volumes in the medium term.
Valuation and viewWe estimate 18% EPS CAGR FY09E-11E. The stock trades at 26.2x FY10E EPS of Rs5.3and 21.9xFy11 EPS of Rs6.4. Maintain Buy.
Company Represented By:Mr Sunil Duggal, CEO
Covering Analyst(s):Amnish Aggarwal+91 22 3982 [email protected]
Amit Purohit+91 22 3982 [email protected]
YEAR NET SALES PAT EPS EPS P/E P/BV ROE ROCE EV/ EV/
END (RS M) (RS M) (RS) GROWTH (%) (X) (X) (%) (%) SALES EBITDA
03/08A 23,610 3,337 3.9 17.7 36.2 18.8 54.0 55.6 4.9 28.0
03/09A 28,054 3,912 4.5 17.1 30.9 14.3 47.8 44.6 4.1 24.2
03/10E 34,074 4,620 5.3 18.2 26.2 10.8 43.1 44.3 3.4 19.3
03/11E 39,761 5,518 6.4 19.4 21.9 8.4 40.1 45.3 2.8 16.0
Bloomberg DABUR INEquity Shares (m) 864.0CMP (Rs) 140Mcap (US$ b) 2.552 W Range 142 / 601, 6, 12 Rel Per -5 / -21 / 46

15August 3 - 5, 2009
5th Annual Global Investor Conference
DLF
Key Takeaways
Concern on high outstandings from DAL reducesDuring 1QFY10, the promoters of DLF raised Rs38b by selling ~9.9% of their stakein DLF. Of this, ~Rs19b was utilized to reduce outstandings from DLF Assets (DAL)while the balance is likely to be utilized to buy out DE Shaw's 75% stake in DAL.The management stated that DLF is likely to pick up a stake in DAL based on thevaluation at which DLF buys out DE Shaw's stake in DAL. According to themanagement, the valuation exercise is currently underway and is likely to be finalizedover the next 2-3 months.
Debt to decline to Rs75b-80b in FY10, largely aided by asset salesNet debt is likely to be reduced to Rs75b-80b in FY10 from Rs140b during 1QFY10,mainly aided by sale of non-strategic assets. The company plans to reduce itsleverage to 0.3x in FY10 from 0.5x currently. DLF does not have any major debtrepayment obligation for another 2-3 years.The management is hopeful of achieving its target of Rs55b of asset sales in FY10.DLF is in advanced stages of negotiation for assets worth Rs25b-30b, which include(i) wind power assets - Rs10b, (ii) refund from government agencies for discontinuedprojects ~Rs4b, and (iii) land for hotel projects - Rs5b-6b.
Residential launch plans focus on lucrative city-centric projectsTo boost its cash flow position, DLF plans to focus on launching city-centric projects.It has plans to launch 17-18msf of residential projects in FY10 comprising (i) 8-9msfof city-centric projects priced at Rs5,000-8,000/sf across Chennai, Kochi, Delhi andGurgaon and (ii) 5-8msf of affordable/mid-income housing projects priced at Rs2,500-3,000/sf in key cities in South India and NCR.According to the management, DLF is likely to launch phase II of SBM, Delhi at 15-20% higher rates than its previous launch.
Construction activity has picked paceArea under construction increased by ~8msf to 42msf during 1QFY10, after aboutthree quarters of negligible activity. DLF has commenced construction on (i) residentialprojects in New Gurgaon and (ii) commercial complexes in New Delhi and Kolkata.Further, it is likely to commence construction on its SBM Delhi project during 2QFY10.
Valuation and viewOur NAV estimate for DLF is Rs360/share. Once DLF resolves its DAL outstanding issue,it would address much of the negative overhang on the stock. The stock trades at 2.5xits adjusted book value of Rs154 and 9% premium to its NAV of Rs360/share. Progresson debt leveraging and subsequent business revival in the commercial and retail verticalscould lead to higher valuation multiples for DLF. Maintain Buy.
Company Represented By:Mr Anurag Kalra,VP-Investor Relations
Covering Analyst(s):Siddharth Bothra+91 22 3982 [email protected]
Mansi Trivedi+91 22 3982 [email protected]
YEAR NET SALES PAT EPS EPS P/E P/BV ROE ROCE EV/ EV/
END (RS M) (RS M) (RS) GROWTH (%) (X) (X) (%) (%) SALES EBITDA
3/08A 144,329 78,120 45.8 262.8 8.5 3.8 39.7 43.0 5.3 7.9
3/09A 100,440 46,292 26.9 -41.3 14.6 3.0 18.7 15.5 8.2 14.9
3/10E 58,593 23,246 13.5 -49.8 29.0 2.7 8.6 7.9 13.2 23.2
3/11E 74,404 32,871 19.1 41.4 20.5 2.4 10.9 11.2 10.1 16.4
Bloomberg DLFU INEquity Shares (m) 1714.4CMP (Rs) 391Mcap (US$ b) 14.152 W Range 580 / 1241, 6, 12 Rel Per 13 / 106 / -36

16August 3 - 5, 2009
5th Annual Global Investor Conference
Dr Reddy’s Laboratories
Key Takeaways
Strategic prioritization in generic markets: Dr Reddy's has recently initiatedthe process of realigning its presence internationally to focus on certain keygeographies and has decided to gradually exit from some of the small/marginalmarkets. Focus markets for the future will be US, India, Russia & CIS, UK andGermany.One/two low-competition product launches in the US every year: Mr Prasadindicated 1-2 such opportunities every year for the next five years. Visible opportunitiesinclude potential launch of generic Arixtra and Prilosec OTC. These opportunitiesspan across FY10/11. The company currently has a pipeline of 16 FTF, targetinginnovator market size of US$9b.Aims to become tier-I player in the US: Dr Reddy's is currently among the tier-II players in the US and is aiming to upgrade itself to tier-I status (implying increasein annual revenues from ~US$400m to US$1b) over the next few years. New launchesconsisting of normal, low-competition and patent challenge products will help it toachieve this goal.Restructuring of German operations: Given the shift from branded generics totender-based generics market, the company intends to restructure its Betapharmoperations, including reduction in sales force (from 110 to 50) and shift ofmanufacturing to India.Ramp-up in the biologics business: Dr Reddy's is targeting to ramp up its biologicsbusiness in emerging markets in the short-to-medium term and in regulated marketsin the long-term (possibly through partnerships).GSK tie-up to bring in long-term benefits: The tie-up with GSK gives Dr Reddy'saccess to many emerging markets through GSK's distribution network, with verylow incremental investments. The tie-up includes a basket of 100 products includingnormal and differentiated products. It may include biogenerics at a later date.Guidance: The company guided 10% topline growth and RoCE of mid-to-high teensfor FY10 on a high base of FY09. By FY13, it targets revenues of US$3b (implying21% CAGR over FY09-13) and 25% RoCE, led mainly by the above initiatives.
Valuation and viewTraction in the branded formulations and US businesses, and focus on improvingprofitability will be the key growth drivers for Dr Reddy's over the next two years.We expect EPS of Rs43.3 for FY10 (v/s net loss for FY09) and Rs50.8 for FY11 (up17.5%), leading to 22% EPS CAGR for FY08-11. The stock currently trades at 19xFY10E and 16.2x FY11E core earnings. Our DCF value of generic Arixtra, PrilosecOTC and Sumatriptan (the visible opportunities of the Para-IV/low-competitionpipeline) is Rs26/share. Maintain Buy.
Company Represented By:Mr GV Prasad,Vice Chairman & CEOMr Kedar Upadhye,Director - Corporate FinanceMr Raghavender R, DeputyManager - Investor Relations
Covering Analyst(s):Nimish Desai+91 22 3982 [email protected]
YEAR NET SALES PAT EPS EPS P/E P/BV ROE ROCE EV/ EV/
END (RS M) (RS M) (RS) GROWTH (%) (X) (X) (%) (%) SALES EBITDA
03/09A* 69,441 -5,169 -30.7 -210.6 -26.8 3.3 -12.3 -3.3 2.2 12.003/10E* 70,832 8,020 47.603/10E 68,734 7,286 43.3 19.0 2.9 16.8 14.2 2.1 12.403/11E 76,031 8,557 50.8 17.4 16.2 2.6 15.9 13.8 2.0 11.903/11E* 79,481 10,121 60.1 38.9
Bloomberg DRRD INEquity Shares (m) 168.4CMP (Rs) 820Mcap (US$ b) 2.952 W Range 836 / 3551, 6, 12 Rel Per -6 / 8 / 33
* - includes patent challenge/low competition upsides
17August 3 - 5, 2009
5th Annual Global Investor Conference
Everest Kanto Cylinders
Key Takeaways
Multiple factors affect 1QFY10 resultsIn 1QFY10 Everest Kanto's net sales fell 19% YoY, EBITDA margin fell 12pp YoY andadjusted PAT fell 81% YoY. The weak performance was due to:In India, CNG cylinder sales slipped due to a sharp slowdown in off-take by commercialvehicle (CV) OEMs.
In Dubai sales were hit due to non-receipt of LCs from customers in Iran due to thepolitical situation there.Margins were affected due to lower economies of scale and also drawdown of high-cost inventories.In the US, despite higher sales, EBIT was negative due to higher depreciation andgoodwill amortization.In China markets are facing recession. Besides the natural-gas progress was not asaggressive as was expected from earlier pronouncements by the Chinesegovernment.
2QFY10 to be better than 1Q; recovery likely from 3QFY10In 2QFY10 Indian operations are expected to be much better than in 1QFY10 due topick-up in CVs, and the addition of Maruti as a client. LCs from Iran are also expectedtowards the end of the quarter. Likewise, sales to Pakistan (another large market forDubai operations) are also starting to pick up. EBTIDA margins in 2QFY10 are seen tobe better than 1Q as the high-cost inventory has been almost fully drawn down. In theUS, some high value orders are to be executed in 2Q and 3Q. But the full impact of allthis is expected to be felt from 3QFY10.
Expansion programs broadly on trackEverest Kanto has commissioned its jumbo cylinders unit in Gandhidham. The billet-pierced industrial cylinders unit (200,000 capacity) is expected to start commercialproduction by end-2QFY10. The plate-cylinders unit in Kandla SEZ (300,000 capacity) isdue for commission in 4QFY10. The capex plan for FY10 is Rs850m.
Gas operations to start in Sep 09From September 2009 Everest Kanto expects to buy gas from ONGC in its 73% JVCalcutta Compressions & Liquefaction Engineering (CC&L). FY10 revenue target is onlyRs60-70m, breakeven is expected by FY11.
Valuation and viewWe estimate Everest Kanto to post FY09-11 EPS CAGR of 10%. The stock trades at 15xFY10E EPS of Rs12.3 and 11x FY11E EPS of Rs17.2. We value Everest Kanto at 15xFY10E EPS to arrive at a target price of Rs185. Considering limited upside from currentlevels we are Neutral on the stock.
Company Represented By:Mr J Sivakumar, CFOMr Kishore Thakkar,Finance Controller
Covering Analyst(s):Shrinath Mithanthaya+91 22 3982 [email protected]
YEAR NET SALES PAT EPS EPS P/E P/BV ROE ROCE EV/ EV/
END (RS M) (RS M) (RS) YOY (%) (X) (X) (%) (%) SALES EBITDA
03/08A 5,287 1,029 10.2 38.4 26.3 24.1
03/09E 8,564 1,503 14.1 39.1 13.1 2.6 24.4 21.9 2.7 8.8
03/10E 8,853 1,308 12.3 -13.0 15.0 2.2 16.1 14.1 2.5 9.3
03/11E 11,168 1,829 17.2 39.9 10.7 1.9 19.1 17.9 2.0 7.2
Bloomberg EKCL INEquity Shares (m) 101.2CMP (Rs) 185Mcap (US$ b) 0.452 W Range 327/841, 6, 12 Rel Per -15/ -37/-48

18August 3 - 5, 2009
5th Annual Global Investor Conference
Financial Technologies
Key Takeaways
A unique business modelFinancial Technologies (FTIL) is the only integrated provider of exchanges,ecosystems and technology catering to market participants. It has 10 exchanges, 6ecosystem ventures and market leading position in products for exchanges andbrokerages like 'Dome' and 'Odin'.The company has a self-fueling business model with both the exchange andecosystem businesses feeding into each other.The management has a goal of having equal revenue contribution from technologyand exchanges over a longer term, and expects to grow through technology andmonetization of its stakes in exchanges.
Key differentiatorsDue to FTIL's extensive experience in the exchange business, its time to market is~1/3rd compared to that of competitors.FTIL requires lower investments to set up and run exchanges due to the use of in-house technology, which is ~1/10th of a comparable exchange.Capex requirement is up to US$10m for domestic exchanges, up to US$25m ininternational ventures and up to US$50m in exceptional ventures.
MCX continues its market leadership, MCX-SX showing strong tractionMCX's market share increased 100bp YoY to 86% in 1QFY10MCX-SX currently allows FX trading with regulatory approval expected shortly forequities, interest rate derivatives and bonds.The exchange currently enjoys 50% market share in currency trading with the other50% belonging to NSE.FTIL owns 31% in MCX and 49% in MCS-SX.
Ecosystem venturesFTIL has invested in eco system ventures to complement its exchanges business. Itcurrently has 6 such ventures in areas like warehousing, mobile payments, informationdissemination, services to credit markets, etc.With a warehousing capacity of 1.4m tons and 569 storage facilities, FTIL subsidiary,NBHC is the largest private player in warehousing related services.
Recent developmentsThe company intends to monetize its holding in MCX-SX to bring its stake in line withthe regulatory requirement of maximum 15% holding by one exchange in another, and5% by a corporate entity in an exchange. It expects this to happen by Aug-Sep 2009.
Valuation and viewFTIL stock currently trades at 28x FY09 earnings. Not rated.
Company Represented By:Ms Vaishali Kariya,SVP – Investor Relations
Covering Analyst(s):Ashwin Mehta+91 22 3982 [email protected]
Vihang Naik+91 22 3982 [email protected]
YEAR NET SALES PAT EPS EPS ROE ROCE
END (RS M) (RS M) (RS) GR. (%) (%) (%)
3/06A 1,820 839 18.2 257.9 28.4 19.53/07A 2,645 1,036 20.3 11.6 22.3 8.83/08A 2,669 8,857 189.1 832.6 83.3 0.63/09A 3,164 2,457 53.5 -71.7 NA NA
Bloomberg FTECH INEquity Shares (m) 45.9CMP (Rs) 1,607Mcap (US$ b) 1.652 W Range 1625 / 3821, 6, 12 Rel Per 12 / 185 / 7
19August 3 - 5, 2009
5th Annual Global Investor Conference
Great Eastern Shipping
Key Takeaways
Significant expansion plans on commercial and offshore sideGreat Eastern Shipping (GESCO) currently owns a fleet of 37 ships comprising 31Tankers (12 crude containers, 18 product tankers, 1 LPG carrier) and 6 dry bulkcarriers. The average age of ships is 10 years; cumulative tonnage is 2.84m DWT.Additionally, the company has placed orders to acquire 7 more ships (5 dry bulkcarriers and 2 Tankers) with aggregate capacity of 0.68m DWT. Total capex onthese ships stands at US$437m.The offshore business of the company is being carried out through wholly ownedsubsidiary, Greatship (India) Limited, which currently owns 5 platform supply vessels(PSVs) and 7 Anchor Handling Tug cum Supply Vessels (AHTSVs). It has enteredinto in-charter agreements for 1 PSV and 1 Jack-up rig.It plans to ramp up the offshore fleet from 12 currently to 26 by FY12 (mix ofAHTVS, rigs, etc) at a capex of US$686m. Total group capex is estimated atUS$1.12b over FY10-12E and management expects peak debt-equity at 1.2:1 (vs0.83:1 as of June 2009). Net debt would go up by US$150m by end-FY12.Company has sold 14 ships in the last 18 months, while it has not acquired any newships in the last one year.
Acquisition of ships to depend on market dynamics; time charter only at 40%Management will decide on any acquisition decision only once strong signals emergeon global arena. Based on the current environment, the expectation is that thevessels price could see ~10-15% decline from the current levels.Currently, the company is operating time charters of ~40%, while it can go upto60% (based on market dynamics). The key reason for lower time charter was dueto credit risk of the counter party.
~50% coverage on forex through forward contractThe company covers its net forex exposure (receipt less expenses) at 50% basedon simple forward contracts.Also, the company has cash balance of Rs25b, which it rolls to US$ to furtherenhance the hedge against the currency movement.
NAV of Rs317/share, based on shipbroker's estimateNAV of GESCO's owned vessels stands at Rs317/share as of June 2009, based onthe estimates provided by shipbrokers.Management informed that though the liquidity in vessels market has dried up, theNAV estimates factor that in and the contract to sell ships would get honored at thecurrent prices.The stock trades at 0.9x current NAV. We have no rating on the stock.
Company Represented By:Ms Anjali Kumar,AGM - Corporate Finance & InvMr Sanket Rege, Asst ManagerCorporate Communication
Covering Analyst(s):Shrinath Mithanthaya+91 22 3982 [email protected]
Bloomberg GESCO INEquity Shares (m) 15.2CMP (Rs) 277Mcap (US$ b) 0.152 W Range 423 / 1371, 6, 12 Rel Per 4 / -29 / -41
YEAR NET SALES PAT EPS EPS P/E P/BV ROE ROCE EV/ EV/
END (RS M) (RS M) (RS) YoY (%) (X) (X) (%) (%) SALES EBITDA
03/06A 20,361 8,562 54.7 26.9 37.2 13.103/07A 21,660 9,074 57.8 5.8 32.7 16.503/08A 31,308 14,534 92.9 60.6 39.1 16.603/09A 38,008 14,178 91.7 -1.3 3.0 0.8 29.8 13.2 1.6 4.0
20August 3 - 5, 2009
5th Annual Global Investor Conference
Glenmark Pharmaceuticals
Key Takeaways
Delayed ramp-up in Latam & US, higher R&D & interest costs to temper downFY10E earnings growth
Latam growth yet to recover: Management indicated that its growth in Latamis likely to recover from 2HFY10 onwards and expects 20-25% growth for FY10E.We expect 17% CAGR for the branded business in Latam over the next two years.Slower pace of approvals impact US growth: The pace of approvals in the UShas slowed down in the past few quarters given the stringent stance adopted by theUS FDA, thus impacting growth for Glenmark's US business. Management has guidedfor revenues of US$160m from US for FY10E. We expect 10% CAGR for this businessover the next two years.Increasing R&D and interest costs: Glenmark has guided for R&D expenses ofUS$40-50m for FY10E (up 250% YoY) due to more NCEs progressing further inclinical trials and delays in closing out-licensing deals for some of these NCEs. Interestcosts are rising as debt has almost doubled in the last six months.Emerging market growth to recover: Management indicated that growth inmost of the emerging markets is recovering as customers have commenced re-stocking after last few quarters of de-stocking. Emerging market currenciesappreciating against the US$ has also helped growth recovery. We expect 25-30%revenue CAGR in these markets for next two years.Fund raising for debt reduction: Glenmark has recently taken board approvalfor raising about US$250m through a preferential issue/QIP/private placement ofshares. We believe that higher debt burden has prompted the company to evaluateraising equity capital to repay part of the debt. The company is targeting reducingdebt by almost 50% to Rs10b.Awaiting further data on Oglemilast: Management has indicated that it is awaitingfurther data on Oglemilast in the near future from its partner Forest Labs. Positivedata can lead to further milestone payments for Glenmark.
Valuation and viewWe believe that Glenmark's FY10E performance will be adversely impacted due to: 1)Inability to strike NCE out-licensing deals at acceptable valuations, leading to higherR&D spend, 2) Delays in receiving US FDA approvals for its US business, 3) Delayedramp-up in Latam and 4) Higher interest costs. Glenmark has differentiated itself byemerging as the most successful NCE research company by out-licensing 3 moleculesand receiving US$117m in up-front and milestone payments till date. Given this success,Glenmark has been aggressive in adding new NCEs to its pipeline, which will put pressureon its operations in the short term as the company will have to fund the R&D expensesfor these NCEs on its own. The stock trades at 24x FY10E and 19.7x FY11E EPS. Neutral.
Company Represented By:Mr Aditya Renjen, GM - IR
Covering Analyst(s):Nimish Desai+91 22 3982 [email protected]
YEAR NET SALES PAT EPS EPS P/E P/BV ROE ROCE EV/ EV/
END (RS M) (RS M) (RS) GROWTH (%) (X) (X) (%) (%) SALES EBITDA
03/08A 19,757 3,154 12.0 166.1 22.6 4.4 20.8 15.8 3.8 9.4
03/09A 20,930 1,143 4.3 -63.8 62.2 3.9 6.7 8.2 3.7 23.2
03/10E 25,153 2,968 11.3 159.6 24.0 3.4 15.0 14.6 3.2 13.4
03/11E 29,389 3,607 13.7 21.5 19.7 2.8 14.9 14.5 2.7 11.7
Bloomberg GNP INEquity Shares (m) 248.7CMP (Rs) 270Mcap (US$ b) 1.452 W Range 695 / 1191, 6, 12 Rel Per 4 / 48 / -65

21August 3 - 5, 2009
5th Annual Global Investor Conference
GMR Infrastructure
Key Takeaways
Power portfolio progress on track; strategy to keep ~40% under merchantbasis
In the power sector, GMR is looking at opportunities to buy-out projects which arestalled for funds. Recently, GMR Energy acquired 100% stake in EMCO Energy, whichis developing 600 MW coal based power plant in Maharashtra. Construction onproject is expected to begin in 3QFY10.GMR plans to keep ~60% of its power portfolio under long-term Power PurchaseAgreement (PPA), and the balance 40% on merchant basis.PPA has been signed for Kamalanga project (~30% of capacity) in Orissa and returnfor the same is based on new tariff norms i.e. 16% RoE, plus incentives. 350MWhas been sold out under Case 1 bidding to Haryana SEB, and balance will be kept onmerchant basis.
Roads projects portfolioGMR has commissioned Tindivanam-Ulundurpet highway project in July 2009 andwith this all its 6 roads projects are operational.Recently, it has emerged as preferred bidder for Hyderabad-Vijayawada road project(cost of Rs22b, 32% revenue sharing) and Chennai Outer Ring Road (cost of Rs11b,grant of Rs3b). The Hyderabad-Vijayawada project is toll-based, while the Chennaiproject is annuity-based (Rs621m semi-annually).
Real estate monetization at both airports to gain momentumSeven plots (22.5 acres) of land at Delhi airport have already been monetized,while it is in final negotiation for the eight plot of 7.7 acres. Total upfront deposit isexpected at Rs13-15b. Lease rental for first full year of operations for 30 acres isexpected to be ~Rs450-460m, to be escalated at 6.5% pa.At Hyderabad airport, an aviation SEZ is planned on 250 acres (MRO business +Aviation academy), while plans are on for additional 250 acres SEZ.Of the balance 1,000 acres at Hyderabad airport, 25 acres is being planned ashealth corridor (hospital, research facilities, etc) in discussion with several parties.For the balance land, development plan is being worked out.
Valuation and viewWe expect GMR's consolidated FY10 PAT at Rs1.5b and FY11 Rs2b. Based on SOTPvaluation methodology, we arrive at a target price of Rs105/share. We are Neutral onthe stock.
Company Represented By:Mr GBS Raju, DirectorMr Subba Rao Amarthaluru,CFO - Corp. Group IntegrationMr Ashutosh Aggarwala,CFO - Corp. Strategic FinanceMr Gaurang Vasani,Associate General ManagerStrategic Finance
Covering Analyst(s):Satyam Agarwal+91 22 3982 [email protected]
Nalin Bhatt+91 22 3982 [email protected]
Bloomberg GMRI INEquity Shares (m) 1820.7CMP (Rs) 140Mcap (US$ b) 5.452 W Range 184 / 461, 6, 12 Rel Per -8 / 26 / 27
YEAR NET SALES* PAT* EPS EPS P/E P/BV ROE ROCE EV/ EV/
END (RS M) (RS M) (RS) GROWTH (%) (X) (X) (%) (%) SALES EBITDA
3/07A 16,967 1,744 1.1 - 133.2 11.7 8.8 6.9 15.0 46.73/08A 22,948 2,101 1.2 9.5 121.6 4.2 3.4 3.2 13.1 50.33/09E 40,192 2,795 1.5 32.1 92.0 4.0 4.4 4.0 7.9 29.93/10E 41,303 4,017 2.2 43.7 64.1 3.8 6.0 6.9 8.7 17.4

22August 3 - 5, 2009
5th Annual Global Investor Conference
Godrej Consumer Products
Key Takeaways
Value-for-money positioning boosts soap volumesGodrej Consumer's value-for-money positioning has helped it to post volume growthof 18% YoY in FY09 and 15% in 1QFY10. Good product quality (76% TFM), increaseddistribution and initiatives like low-priced packs (Rs5 SKU) have been key growthdrivers. The company is focusing on Godrej No1, which accounts for 60% of volumes.Palm-oil prices (22% of sales) are 40% down YoY, which will boost company marginsin FY10. GCPL entered into a long-term forward contract and booked its requirementsuntil January-February 2010. This will ensure margin-expansion through FY10.
Hair-color sales revive, reflect in market-share gainsInitiatives such as the re-launch of Godrej powder hair dye as Godrej Expert, launchof Renew powder hair dye and a 5% increase in trade margins have helped GCPLrevive hair-color sales and enhance market share.The management believes there is potential to upgrade consumers from unbrandedmehendi to branded mehendi, especially as GCPL expands in rural India.Management indicated that it is focusing on the hair-color market and is open toacquisitions in this segment
International businessHigher sales of Cuticura hand wash (anti-bacterial), as the swine flu scare increasedin Britain, drove Keyline's performance. With integration issues with Kinky sortedout, performance is expected to improve. GCPL plans to invest in enhancingdistribution in South Africa, which has big potential for hair-care products.The international market accounts for 25% of GCPL's revenue and this is indicatedto rise to 50% in the next three years through acquisitions in the hair-color category.
Godrej Sara LeeGCPL will continue to hold 49% in the Godrej Sara Lee JV after the current scheme ofarrangement. Acquisition of the remaining stake will be triggered after Sara Lee Global(US$2b turnover) plans to sell its global business. The valuation will be based on a pre-arranged price finalized at the time of entering into the JV. GCPL will get rights to SaraLee products only for the Indian markets.
Valuation and viewWe estimate 27.8% EPS CAGR for FY09-11. We estimate FY10 and FY11 EPS at Rs9.4and Rs10.9, excluding the acquisition of 49% stake in Godrej Sara Lee. The stock tradesat 23.8x FY10E and 20.4xFY11E EPS. We believe that acquisition of the remaining 51%in Godrej Sara Lee can re-rate the stock. Maintain Buy.
Company Represented By:Mr H K Press, Vice Chairman
Covering Analyst(s):Amnish Aggarwal+91 22 3982 [email protected]
Amit Purohit+91 22 3982 [email protected]
YEAR NET SALES PAT EPS EPS P/E P/BV ROE ROCE EV/ EV/
END (RS M) (RS M) (RS) GROWTH (%) (X) (X) (%) (%) SALES EBITDA
03/08A 11,040 1,592 7.1 18.6 31.6 33.5 92.8 64.4 4.7 24.0
03/09A 13,930 1,726 6.7 -5.2 33.3 9.7 29.0 27.8 4.0 27.2
03/10E 16,344 2,414 9.4 40.0 23.8 8.5 35.6 36.2 3.4 18.1
03/11E 18,748 2,820 10.9 16.8 20.4 7.4 36.2 37.6 2.9 15.2
Bloomberg GCPL INEquity Shares (m) 258.1CMP (Rs) 223Mcap (US$ b) 1.252 W Range 250 / 901, 6, 12 Rel Per 23 / -6 / 78

23August 3 - 5, 2009
5th Annual Global Investor Conference
Grasim Industries
Key Takeaways
Cautious outlook for core businessExpects the cement industry to grow at 9% in FY10 (v/s 12.2% in 1QFY10). Thisalong with expected excess capacities from 2HFY10 will put pressure on prices.The management expects realization (+Rs5/bag QoQ in 2QFY10) and margins toimprove from 1QFY10 levels. But it is uncertain that it will sustain beyond 2QFY10especially because of the widening price differential between competing fibers,increased excise duty by 4-8% and the start of a downward trend in China.
Capex nearly completeCapex plan to add 14MT capacity would be completed by 3QFY10, taking total capacityto 49MT. Most of its capacity enhancement program has been completed and a 3MTgrinding unit at its Kotputli plant is expected to be commissioned in 3QFY10.Grasim will invest Rs43.3b over FY10-11 to augment its logistics infrastructure,waste heat recovery system, CPP, evacuation facility and on modernization.As a result, Grasim is seen to substantially increase its free cash flow from FY10(estimated at Rs45.7b in FY10 v/s Rs9.8b in FY09).
Cost savings to result in stable margins in FY10Stabilization of production at its recently expanded capacities will drive the group'svolume growth. It expects to gain market share as its volumes will grow faster thanthat of the industry.Softening of imported coal/pet coke prices (50% dependence) will benefit Grasim.Its commissioning of new CPPs 263MW (incl 40MW waste-heat recovery system)will increase its reliance on CPP to 80%.Grasim will also cut logistic costs. It will reduce the lead distance to its plants whenit opens new units and will enhance its logistics infrastructure by expanding thejetty at its Gujarat plant and setting up bulk terminals.
Other takeawaysStrong growth in rural/semi-urban markets has led to an increase in its share to30% from 12% earlier.No pick-up yet from organized real-estate sector.South India most prone to pricing power based on overcapacity.
Valuation and viewThe outlook for Grasim's core business has improved with higher volumes in VSF andhigher pricing in the cement business. Grasim is best placed among its peers, as thereis high visibility for volume growth and cost-savings triggers The stock is quoting at 9xFY10E consolidated EPS and 4.7x EV/EBTIDA. Maintain Buy.
Company Represented By:Mr Adesh Gupta, CFO
Covering Analyst(s):Jinesh Gandhi+91 22 3982 [email protected]
YEAR NET SALES PAT EPS EPS P/E P/BV ROE ROCE EV/ EV/
END* (RS M) (RS M) (RS) GROWTH (%) (X) (X) (%) (%) SALES EBITDA
03/08A 169,739 26,951 293.9 37.0 9.6 2.8 34.3 31.1 2.0 6.7
03/09A 184,039 21,867 238.5 -18.9 11.9 2.2 21.1 20.7 1.8 7.6
03/10E 202,243 28,846 314.6 31.9 9.0 1.8 22.2 24.8 1.4 4.7
03/11E 210,694 26,475 288.7 -8.2 9.8 1.6 15.8 24.1 1.2 4.5
Bloomberg GRASIM INEquity Shares (m) 91.7CMP (Rs) 2,829Mcap (US$ b) 5.552 W Range 2940 / 8241, 6, 12 Rel Per 10 / 38 / 34
* Consolidated

24August 3 - 5, 2009
5th Annual Global Investor Conference
GVK Power & Infrastructure
Key Takeaways
Roads and power are focus areasGVK Power & Infrastructure (GVKPIL) has identified roads and power sectors asfocus areas for the medium term. The company has taken a stance to participate inbidding for new road projects but with desired level of profitability (RoE of 16%+).In power, the company is open to inorganic growth and is evaluating acquisition ofinterest in a few projects. The company has been approached by various projectdevelopers with project sizes ranging from 600-1200MW. The company is in theprocess of obtaining necessary clearances.Additionally, the company is exploring capacity expansion at Gautami power projectby 800MW and JP Phase II by 400MW, given that land and other clearances are inplace.
Gas supply at existing projects in place, merchant sale clearance is expectedany time in 2QFY10
Gas supply at all three operating power projects, viz, JP Phase I & II and Gautami isavailable for 100% capacity and plants are currently operating at a PLF of 88-99%.Merchant sale from JP II and Gautami power project is expected to begin only from3QFY10 (hearing on 18th August 2009), as management expects approval for saleof merchant power by end 2QFY10.
Cash balance at ~Rs10b; no plans to divest stake in JKELCash on books as at June 2009 stands at Rs10b, and GVKPIL is fairly placed to meetequity funding over next two years towards existing projects. Estimated equityfounding requirement is Rs3-3.5b each in FY10 and FY11.The company is not looking to divest its stake in JKEL currently and if found attractive,it may securitize cash flows from the project.
Real estate monetization at Mumbai airport to begin from FY10Master plan for development is now completed with plots/zones identified for variouspurposes falling under commercial real estate development. GVKPIL is likely tomonetize 0.5msf by March 2010.Slum rehabilitation by HDIL is progressing with minor delay. Total ~20,000 familieswill be rehabilitated by HDIL.
Valuation and viewWe expect GVKPIL to report PAT of Rs2.5b in FY10 (up 136%) and Rs3.2b in FY11(up 26%). Maintain Buy with SOTP based target price of Rs54/share.
Company Represented By:Ms Mala Paropkari,Vice President - IRMr Viren Vijaya Shankar,Senior Manager - IR
Covering Analyst(s):Satyam Agarwal+91 22 3982 [email protected]
Nalin Bhatt+91 22 3982 [email protected]
Bloomberg GVKP INEquity Shares (m) 1,579CMP (Rs) 44Mcap (US$ b) 1.652 W Range 51 / 101, 6, 12 Rel Per -5 / 58 / 3
YEAR NET SALES* PAT* EPS EPS P/E P/BV ROE ROCE EV/ EV/
END (RS M) (RS M) (RS) GROWTH (%) (X) (X) (%) (%) SALES EBITDA
3/08A 4,700 1,361 1.0 -34.6 45.3 2.8 6.2 4.6 3.7 9.33/09A 5,138 1,076 0.8 -20.9 57.2 2.7 4.7 2.1 6.7 19.53/10E 23,726 2,543 1.6 110.5 27.2 2.1 7.9 6.8 2.1 6.33/11E 25,014 3,192 2.0 7.4 21.7 2.0 9.2 6.3 2.4 7.3
*Consolidated

25August 3 - 5, 2009
5th Annual Global Investor Conference
HDFC Bank
Key Takeaways
Business environment favorable for HDFC BankMr Puri remains optimistic about India's growth prospects. He believes that theworst is behind for the economy and the banking industry.In India, demand for banking services remains higher than supply, and this willcontinue to provide significant opportunities for banks.The overall business environment remains favorable for HDFC Bank.
Focus on retail assets and liabilitiesPost merger with CBoP, HDFC Bank is in much better shape to grow its retail liabilities.Customer segmentation, product diversification, effective utilization of technology,and immaculate execution would continue to remain the key success factors for thebank.The bank will stick to its strategy of growing its middle and upper middle incomecustomer segments.
HDFC Bank will maintain above industry growth ratesIndustry loan growth is likely to be 18-20% in FY10 and HDFC Bank would maintainhigher than industry growth.Retail loans and working capital demand would continue to drive loan growth forHDFC Bank. However, corporate loan growth is likely to be higher than the growth inretail loans considering the rundowns in the acquired CBoP loan book.
Worst is behind on NPA front; equity dilution unlikely in next 3 yearsMr Puri believes that NPAs for HDFC Bank are near peak and upside from the currentlevels is very limited.HDFC Bank would not need equity capital for the next three years to manage itsgrowth.The bank is not considering international expansion, as the domestic economy offersimmense opportunities.
Valuation and viewWe expect HDFC Bank to report EPS of Rs63 in FY10 and Rs84 in FY11.BV would be Rs462 in FY10 and Rs528 in FY11.Stock trades at 3.1x FY11E BV and 17.2x FY11E EPS. Maintain Neutral as valuationsare fair.
Company Represented By:Mr Aditya Puri, MDMr Paresh Sukthankar, ED
Covering Analyst(s):Ajinkya Dhavale+91 22 3982 [email protected]
Alpesh Mehta+91 22 3982 [email protected]
YEAR NET INCOME PAT EPS EPS P/E P/BV CAR ROAE ROAA P/ABV
END (RS M) (RS M) (RS) GROWTH (%) (X) (X) (%) (%) (%) (X)
3/08A* 88,403 17,530 41.3 22.1 35.0 4.5 13.6 16.2 1.3 4.6
3/09A 107,118 22,449 52.8 27.7 27.4 4.1 15.7 15.6 1.3 4.2
3/10E 129,473 28,494 63.1 19.6 22.9 3.1 15.2 15.9 1.4 3.2
3/11E 157,492 37,942 84.0 33.2 17.2 2.7 14.1 17.0 1.6 2.8
Bloomberg HDFCB INEquity Shares (m) 451.6CMP (Rs) 1,448Mcap (US$ b) 13.852 W Range 1584 / 7741, 6, 12 Rel Per -12 / -11 / 16
* Includes pro forma merged figures for HDFC Bank and CBoP
26August 3 - 5, 2009
5th Annual Global Investor Conference
HDFC Standard Life
Key Takeaways
The management's focus remains on profitable growth; market share is currentlylow priority. However, accounting break-even is expected to be a couple of yearsaway from now. (HDFC Standard Life reported a loss of Rs5b in FY09.)FY09 was the worst year for the company as business environment deterioratedsignificantly, soon after rapid expansion in branches/manpower, and massive adspends. This, coupled with deterioration in persistency ratio (dropped from 86% inFY08 to 65% in FY09), led to doubling of losses despite maintaining new businesspremium.The management's present focus is to optimize cost structure and improve efficiencyrather than go in for geographical expansion. It believes over the long term, salesand service would be the key differentiator among insurance companies.In management's view, the recently announced cap on charges for ULIP productswould certainly have impact on overall business profitability for all the players butquantifying the same is difficult at this point of time. However, structurally, thismove is a positive for customers and would lead to rationalization of distributioncommissions and other operating costs of life insurance companies.The management believes that life insurance business in India can sustain 10-15%growth, and that HDFC Standard Life would strive to grow in line with industry goingforward.
Company Represented By:Mr Paresh Parasnis,Principal officer and EDMs Vibha Padalkar, CFO
Covering Analyst(s):Ajinkya Dhavale+91 22 3982 [email protected]
Alpesh Mehta+91 22 3982 [email protected]

27August 3 - 5, 2009
5th Annual Global Investor Conference
Hero Honda Motors
Key Takeaways
Conservative guidanceThe company's conservative guidance of 4m units in FY10 is based on:
Uncertainty of the monsoon, the impact of which will be seen from 3QFY10Withdrawal of excise duty reduction can have short-term impactMore competition
However the management will review its guidance at the end of 1HFY10 and expectsthe following factors to positively impact volumes:
Any improvement in financeHigher government spending in rural areasLower channel inventory of 180,000 units against normal levels of 250,000-275,000 units
EBITDA margins should improve 2QFY10EBITDA margins at 16.8% in 1QFY10 will improve in 2QFY10 because:
Volumes in 2QFY10 will be higher than 1.1m units in 1QFY10Advertising spends at Rs500m in 1QFY10 will be lower in 2QFY10 as there areno special events, such as the IPL and the 20-20 World Cup, in the quarter.
The management doesn't expect commodity prices to rise substantially in the shortterm. It sources its monthly raw material requirement on a spot basis.
Haridwar plansThe company plans to add a fourth line at Haridwar, enhancing output to meetdemand.The company produces 4,000 units a day (about 350,000 units per quarter).Hero Honda makes Splendor at Haridwar and will produce Passion there as well.Vendor localization at Haridwar will increase from 30% to 65% by 3QFY10.
Other takeawaysStrong demand for some of its brands, such as Passion, is leading to a shortage.Plans to launch nine products (including a new model) from September will drivegrowth.Hero Honda plans 22 Just For Her scooter showrooms catering exclusively to women.Hero Honda and HMSI have a non-competing product portfolio.
Valuation and viewRecovery in domestic and export volumes coupled with higher hedged forex rates willhelp profitability. Continued volume improvement and recovery in market share will bea catalyst for the stock. The stock trades at 16x FY10E EPS and 14.6x FY11E EPS.Maintain Buy.
Company Represented By:Mr Ravi Sud, SVP & CFO
Covering Analyst(s):Jinesh Gandhi+91 22 3982 [email protected]
YEAR NET SALES PAT EPS EPS P/E P/BV ROE ROCE EV/ EV/
END (RS M) (RS M) (RS) GROWTH (%) (X) (X) (%) (%) SALES EBITDA
3/08A 103,318 9,679 48.5 12.8 29.4 9.5 35.5 45.7 2.5 19.2
3/09A 123,191 12,818 64.2 32.4 25.0 8.4 37.8 47.9 2.3 16.5
3/10E 149,946 19,968 100.0 55.8 16.0 6.1 44.3 53.7 1.8 10.9
3/11E 166,289 21,998 110.2 10.2 14.6 4.7 36.7 44.8 1.5 9.4
Bloomberg HH INEquity Shares (m) 199.7CMP (Rs) 1,604Mcap (US$ b) 6.752 W Range 1780 / 6611, 6, 12 Rel Per 5 / 8 / 87
28August 3 - 5, 2009
5th Annual Global Investor Conference
HPCL
Key Takeaways
Sees no subsidy burden in FY10: HPCL said that according to the government therewas unlikely to be a subsidy burden on OMCs (oil market companies) in FY10. In 1QFY10the auto fuel subsidy burden was shared by upstream companies (ONGC, OIL and GAIL).Though the government did not share the burden in 1QFY10, HPCL expects it do sosubsequently.
Green fuels projects at Mumbai, Visakh commissioned: HPCL has completed theEuro III/IV MS upgrade at Mumbai refinery and will complete its Visakh refinery upgradein August 2009. The diesel upgrade will be completed with the installation of a dieselhydro-treater in September 2011.
Key projects on track, capex may be lower than estimated: HPCL is implementingfour projects: 1) the Rs10b LOBS upgrade at Mumbai (by May 2010); 2) the Rs9b newFCCU at Mumbai (by 1QFY10); 3) the Rs69b diesel hydro-treaters at Mumbai and Visakh(by Sept 2011) and 4) Rs6.5b Single Point Mooring (SPM) facility at Visakh (by March2010). Capex for diesel hydro-treaters and SPM are expected to be lower than estimatesby 25-30%.
Bhatinda Refinery mechanical completion target December 2010: HPCL's9mmtpa, Rs189b, JV refinery with Mittal Energy Investments in Bhatinda, Punjab hasachieved 35% physical progress and critical long-lead item orders have been placed.Mechanical completion is targeted in December 2010.
Strong domestic demand growth seen to continue: The management expectsstrong domestic product demand growth to continue at 1% below India's GDP growthrate.
HPCL has a portfolio of 26 E&P blocks: HPCL has equity investment in 26 E&Pblocks, including 14 deepwater, five shallow water and seven on-land blocks. HPCLplans to invest Rs10b over the next five years in its E&P business but the managementsaid it would invest more if needed. Though HPCL has a cautious approach to its E&Pportfolio (average stake of 15-20%), its long-term goal is to source 50% of its oilrequirement from its own blocks.
Valuation and view: We assume oil price of US$60/bbl in FY10 and US$65/bbl inFY11. We build OMCs' share in under-recoveries at 20%. We estimate HPCL's EPS atRs39 in FY10 and Rs30 in FY11. At a CMP of Rs364/share BPCL quotes at a PER of 9.4xFY10E and P/BV of 1x FY10E. Maintain Buy.
Company Represented By:Mr B Mukherjee,Director (Finance)Mr K Murali,Director (Refineries)Mr A V Dixit,Sr Manager (Budget & MIS)
Covering Analyst(s):Harshad Borawake+91 22 3982 [email protected]
YEAR NET SALES PAT EPS EPS P/E P/BV ROE ROCE EV/ EV/
END (RS M) (RS M) (RS) GROWTH (%) (X) (X) (%) (%) SALES EBITDA
03/08A 1,047,038 7,263 21.4 -49.6 17.0 1.2 7.2 7.6 0.2 15.0
03/09A 1,246,943 4,355 12.8 -40.0 28.3 1.1 4.1 8.8 0.2 7.6
03/10E 1,026,284 13,084 38.6 200.5 9.4 1.0 11.4 9.9 0.2 4.7
03/11E 1,111,609 10,279 30.3 -21.4 12.0 1.0 8.2 8.8 0.2 5.6
Bloomberg HPCL INEquity Shares (m) 339.0CMP (Rs) 364Mcap (US$ b) 2.652 W Range 398 / 1631, 6, 12 Rel Per 1 / -50 / 49

29August 3 - 5, 2009
5th Annual Global Investor Conference
ICICI Bank
Key Takeaways
Will continue to execute “4C” strategyICICI Bank’s focus would continue to be CASA, Capital conservation, Cost efficiency andimproving Credit profile for profitable growth. The key enablers are:
Expanding branch network (2,000 by FY10) and making branches focus points forcustomer acquisition and relationshipsChanging collection mechanism by in housing collections of few products andpreventive collection focusHuman resources transformation through retraining and redeployment of staff fornew branch oriented responsibilities
Targets to double RoE over next 3 yearsWith improving margins, pick-up in fees and continued efficiency, ICICI Bank istargeting to double its RoE to high teens over the next three years. FY10 RoEexpansion would be driven by consolidation strategy and cost cutting, while the nexttwo years’ RoE expansion would be driven by loan growth and lower credit cost.The bank maintains its CASA ratio target of 33% by FY10. It maintains its strategyof preserving capital for the next growth phase. “Loan growth” remains the lastpriority for FY10.Housing loans, project finance and commercial banking would be the growth avenuesin the mid-term. Risk aversion towards unsecured retail loans remains intact.
Margin expansion possible from 2HFY10Downward re-pricing of bulk deposits, loan growth and further improvement in CASAratio gives the management comfort about margin expansion possibilities.
NPAs look to be peaking outICICI Bank expects NPAs to peak out in the next quarter. Credit costs would decline, asunsecured retail loans run off significantly in the next two quarters. While the restructuringnumber would increase in 2QFY10, strong corporate health and improving domesticdemand will keep ultimate credit losses manageable.
Valuations and viewWe expect ICICI Bank to report EPS of Rs35 in FY10 and Rs45 in FY11.BV would be Rs466 in FY10 and Rs497 in FY11. We expect RoA to expand to 1.2%and Core RoE to cross 12% by FY11.Stock trades at AP/ABV (price adjusted for value of subs and BV adjusted forinvestment is subs and NPAs) of 1.8x FY10E and 1.6x FY11.Valuations are fair now. Buy on declines with FY11 SOTP target price of Rs777.
Company Represented By:Ms Chanda Kochhar, MD & CEO,Mr Rakesh Jha, Deputy CFO,Mr Rupesh Kumar, Chief Manager
Covering Analyst(s):Ajinkya Dhavale+91 22 3982 [email protected]
Alpesh Mehta+91 22 3982 [email protected]
YEAR NET INCOME PAT EPS EPS AP/E* AP/ABV* CAR ROAE ROAA P/ABV
END (RS M) (RS M) (RS) GROWTH (%) (X) (X) (%) (%) (%) (X)
3/08A 161,149 41,577 37.4 8.0 17.3 2.0 14.0 14.3 1.1 1.9
3/09A 159,704 37,582 33.8 -9.7 19.2 2.1 16.0 10.0 1.0 1.8
3/10E 162,665 38,933 35.0 3.6 16.7 1.8 15.7 10.2 1.0 1.8
3/11E 178,023 50,240 45.1 29.0 12.5 1.6 15.7 12.4 1.2 1.6
Bloomberg ICICIBC INEquity Shares (m) 1112.7CMP (Rs) 773Mcap (US$ b) 18.152 W Range 808 / 2521, 6, 12 Rel Per 1 / 23 / 5
* Price adjusted for value of key ventures and BV adjusted for investments in those key ventures
30August 3 - 5, 2009
5th Annual Global Investor Conference
Idea Cellular
Key Takeaways
Subscriber additions losing relevance due to dual SIMsIdea management believes that monthly subscriber additions are losing relevancedue to SIM duplication and diverse churn policies of operators, especially for unlimitedvalidity plans.Idea's churn rate has increased by 270bp YoY to 6.7% (tight churn criteria), thusaffecting its net adds market share.Over next few quarters, as new rollouts ease, subscribers are likely to move back tonormalized state of using primarily one SIM.
Traffic growth likely to remain strongIdea's wireless traffic has grown at 10-11% QoQ in each of the preceding fourquarters driven by a 74% YoY increase in cell site base.Growth outlook remains strong led by new subscriber additions and circle launches.
Potential tariff declines unlikely to sustainIdea believes that while potential tariff declines, though possible due to competitivepressure from new rollouts, are unlikely to sustain.Idea does not plan to retaliate in the event of irrational pricing by new entrantsunless there is significant impact on traffic/subscriber share.Given low RoIC of most operators, there could be room for increase in pricing onceconsolidation happens (likely in 1-3 years) and competitive pressure erodes.
3G auction participation will depend on base price/biddingIdea is waiting for more clarity on number of spectrum slots available for 3G auctionsand base price.3G investments would be driven more by requirement of future proofing technologyshifts rather than current market potential.Pricing of spectrum would ultimately drive the extent to which Idea participates inthe 3G opportunity.
Peak capex in established circles is overFY09 was the peak capex in established circles. Going forward, higher networkutilization driven by lower coverage capex would drive efficiencies and cushionmargins in these circles.FY10 would mark peak capex in circles launched during FY09 and FY10. We estimatecapex (ex-3G) to decline by ~30% in FY11.
Valuation and viewIdea trades at FY11E P/E of 22.1x and EV/EBITDA of 7.4x.Maintain Neutral on fair valuations and lower visibility on new circle losses/NPV.
Company Represented By:Mr Akshaya Moondra, CFO
Covering Analyst(s):Shobhit Khare+91 22 3982 [email protected]
YEAR NET SALES PAT EPS EPS P/E P/BV ROE ROCE EV/ EV/
END (RS M) (RS M) (RS) GROWTH (%) (X) (X) (%) (%) SALES EBITDA
3/08A 67,374 10,424 4.0 84.4 19.7 5.8 36.4 14.7 3.9 11.5
3/09A 101,485 9,008 3.0 -23.7 25.9 1.7 10.4 7.4 2.8 9.9
3/10E 127,429 10,933 3.5 16.9 22.1 1.6 7.6 6.1 2.4 8.2
3/11E 163,865 11,743 3.6 0.9 21.9 1.3 6.9 6.2 2.1 7.4
Bloomberg IDEA INEquity Shares (m) 3100.1CMP (Rs) 78Mcap (US$ b) 5.152 W Range 93 / 341, 6, 12 Rel Per -1 / 2 / -19
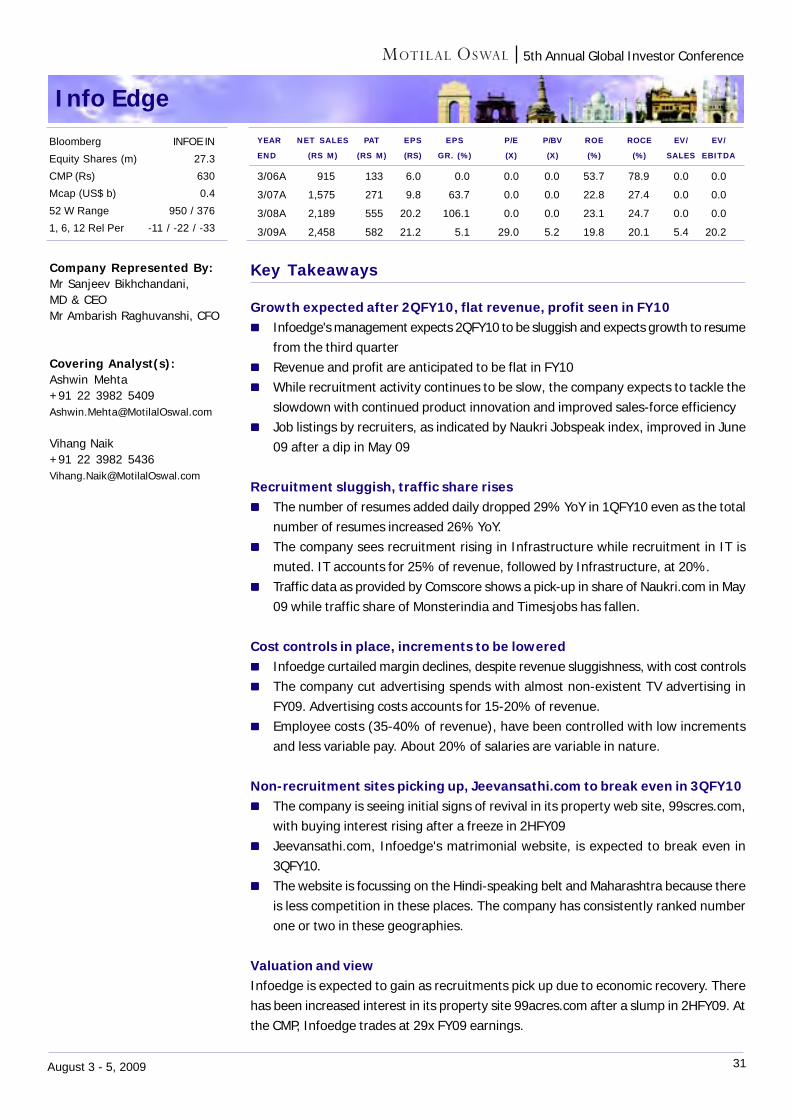
31August 3 - 5, 2009
5th Annual Global Investor Conference
Info Edge
Key Takeaways
Growth expected after 2QFY10, flat revenue, profit seen in FY10Infoedge's management expects 2QFY10 to be sluggish and expects growth to resumefrom the third quarterRevenue and profit are anticipated to be flat in FY10While recruitment activity continues to be slow, the company expects to tackle theslowdown with continued product innovation and improved sales-force efficiencyJob listings by recruiters, as indicated by Naukri Jobspeak index, improved in June09 after a dip in May 09
Recruitment sluggish, traffic share risesThe number of resumes added daily dropped 29% YoY in 1QFY10 even as the totalnumber of resumes increased 26% YoY.The company sees recruitment rising in Infrastructure while recruitment in IT ismuted. IT accounts for 25% of revenue, followed by Infrastructure, at 20%.Traffic data as provided by Comscore shows a pick-up in share of Naukri.com in May09 while traffic share of Monsterindia and Timesjobs has fallen.
Cost controls in place, increments to be loweredInfoedge curtailed margin declines, despite revenue sluggishness, with cost controlsThe company cut advertising spends with almost non-existent TV advertising inFY09. Advertising costs accounts for 15-20% of revenue.Employee costs (35-40% of revenue), have been controlled with low incrementsand less variable pay. About 20% of salaries are variable in nature.
Non-recruitment sites picking up, Jeevansathi.com to break even in 3QFY10The company is seeing initial signs of revival in its property web site, 99scres.com,with buying interest rising after a freeze in 2HFY09Jeevansathi.com, Infoedge's matrimonial website, is expected to break even in3QFY10.The website is focussing on the Hindi-speaking belt and Maharashtra because thereis less competition in these places. The company has consistently ranked numberone or two in these geographies.
Valuation and viewInfoedge is expected to gain as recruitments pick up due to economic recovery. Therehas been increased interest in its property site 99acres.com after a slump in 2HFY09. Atthe CMP, Infoedge trades at 29x FY09 earnings.
Company Represented By:Mr Sanjeev Bikhchandani,MD & CEOMr Ambarish Raghuvanshi, CFO
Covering Analyst(s):Ashwin Mehta+91 22 3982 [email protected]
Vihang Naik+91 22 3982 [email protected]
YEAR NET SALES PAT EPS EPS P/E P/BV ROE ROCE EV/ EV/
END (RS M) (RS M) (RS) GR. (%) (X) (X) (%) (%) SALES EBITDA
3/06A 915 133 6.0 0.0 0.0 0.0 53.7 78.9 0.0 0.0
3/07A 1,575 271 9.8 63.7 0.0 0.0 22.8 27.4 0.0 0.0
3/08A 2,189 555 20.2 106.1 0.0 0.0 23.1 24.7 0.0 0.0
3/09A 2,458 582 21.2 5.1 29.0 5.2 19.8 20.1 5.4 20.2
Bloomberg INFOE INEquity Shares (m) 27.3CMP (Rs) 630Mcap (US$ b) 0.452 W Range 950 / 3761, 6, 12 Rel Per -11 / -22 / -33

32August 3 - 5, 2009
5th Annual Global Investor Conference
Infosys Technologies
Key Takeaways
Macro-economic improvements yet to translate into better demandIT spending would happen with a lag. Clients continue to prioritize spend andconserve cash. Spend velocity remains slow.The company expects budgets to improve in CY10 if there is no further bad news tillDecember 2009.Reversal of growth to past levels will happen when there is stability in large clientsand concurrent growth across a few of its largest clients, which was the case inFY07 and FY08, when BT contributed to significant growth.
Verticals and service line outlookSees traction in BPO/IMS/Testing and continued sluggishness in Enterprise SolutionsWithin verticals, Infosys sees growth in Retail, with BFSI and Telecom stabilizingExpects the next phase of growth to be driven by BFSI and Telecom
Utilization pressure in the interim; scope for growth without headcountaddition
The company expects its utilization (excl. trainees) to go down from 70.9% levels,on account of hiring of freshers (20,000 fresher offers for FY10).It believes revenues can grow around 10% without increase in headcount, on accountof this buffer, which should be positive on margins.
Sees value in long-term offshoring propositionThere is scope for outsourcing in [1] existing business at clients, [2] vendor consolidation,[3] shift of business from captives or hiving off of captives, [4] in-house IT beingoutsourced, and [5] incremental spending in selective cases.
Key investment areasThe company continues to spend on:
Solutions and platforms e.g. HR, publishingVerticals like healthcare and life sciences, also looking at inorganic optionsExpansion of sales staff in countries like Japan, France and GermanyOnsite hiring of 1,000 locals to reduce risk in case the 50:50 rule on H1-B localemployment becomes a reality
Valuation and viewWe are positive on Infosys' ability to manage margins in FY10, while we remain cautiouson volume growth. We expect a revival in US$ revenue growth in FY11 to 12.3%. Thestock is trading at 20.7x FY10E and 20.3x FY11E earnings. Maintain Neutral.
Company Represented By:Mr V Balakrishnan, CFO
Covering Analyst(s):Ashwin Mehta+91 22 3982 [email protected]
Vihang Naik+91 22 3982 [email protected]
YEAR NET SALES PAT* EPS EPS P/E P/BV ROE ROCE EV/ EV/
END (RS M) (RS M) (RS) GROWTH (%) (X) (X) (%) (%) SALES EBITDA
3/08A 166,920 45,380 79.2 19.8 26.0 8.5 36.2 37.0 6.6 21.1
3/09A 216,930 58,800 102.5 29.5 20.0 6.4 36.7 40.2 5.0 15.0
3/10E 217,093 56,922 99.2 -3.2 20.7 5.3 28.2 31.0 4.8 14.6
3/11E 234,477 58,028 101.2 1.9 20.3 4.5 24.2 27.7 4.3 13.5
Bloomberg INFO INEquity Shares (m) 573.7CMP (Rs) 2,095Mcap (US$ b) 25.352 W Range 2107 / 10401, 6, 12 Rel Per 6 / -9 / 19
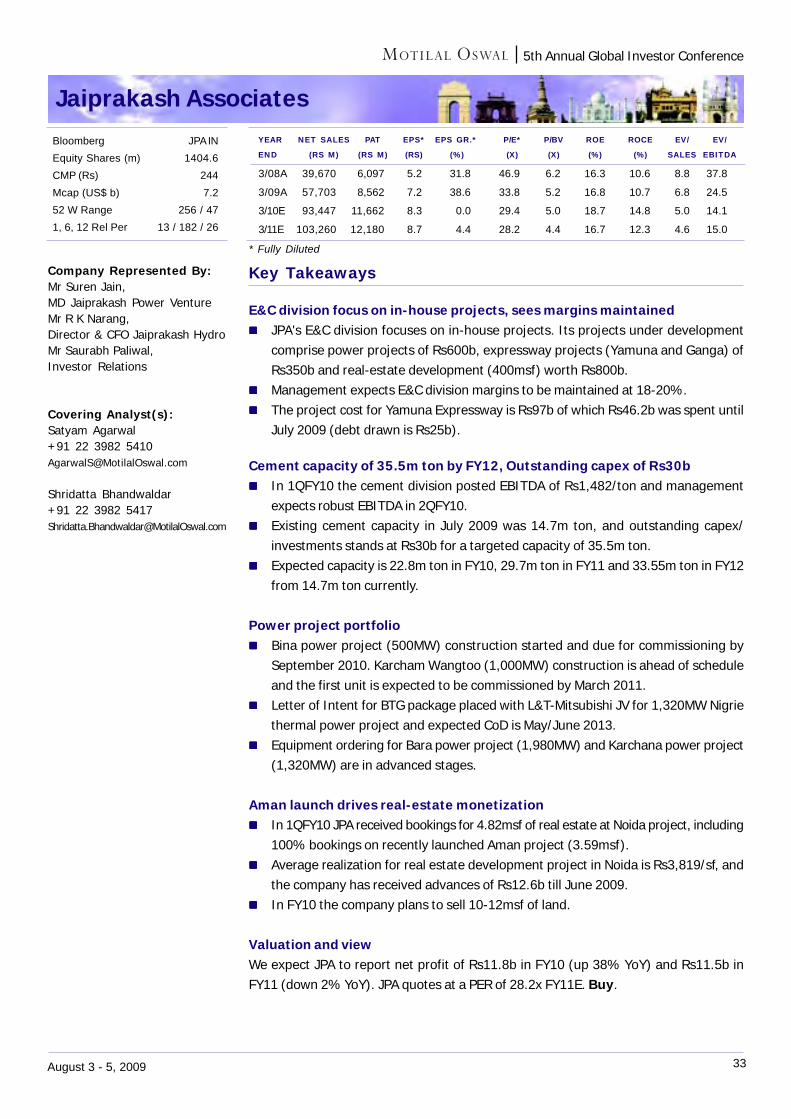
33August 3 - 5, 2009
5th Annual Global Investor Conference
Jaiprakash Associates
Key Takeaways
E&C division focus on in-house projects, sees margins maintainedJPA's E&C division focuses on in-house projects. Its projects under developmentcomprise power projects of Rs600b, expressway projects (Yamuna and Ganga) ofRs350b and real-estate development (400msf) worth Rs800b.Management expects E&C division margins to be maintained at 18-20%.The project cost for Yamuna Expressway is Rs97b of which Rs46.2b was spent untilJuly 2009 (debt drawn is Rs25b).
Cement capacity of 35.5m ton by FY12, Outstanding capex of Rs30bIn 1QFY10 the cement division posted EBITDA of Rs1,482/ton and managementexpects robust EBITDA in 2QFY10.Existing cement capacity in July 2009 was 14.7m ton, and outstanding capex/investments stands at Rs30b for a targeted capacity of 35.5m ton.Expected capacity is 22.8m ton in FY10, 29.7m ton in FY11 and 33.55m ton in FY12from 14.7m ton currently.
Power project portfolioBina power project (500MW) construction started and due for commissioning bySeptember 2010. Karcham Wangtoo (1,000MW) construction is ahead of scheduleand the first unit is expected to be commissioned by March 2011.Letter of Intent for BTG package placed with L&T-Mitsubishi JV for 1,320MW Nigriethermal power project and expected CoD is May/June 2013.Equipment ordering for Bara power project (1,980MW) and Karchana power project(1,320MW) are in advanced stages.
Aman launch drives real-estate monetizationIn 1QFY10 JPA received bookings for 4.82msf of real estate at Noida project, including100% bookings on recently launched Aman project (3.59msf).Average realization for real estate development project in Noida is Rs3,819/sf, andthe company has received advances of Rs12.6b till June 2009.In FY10 the company plans to sell 10-12msf of land.
Valuation and viewWe expect JPA to report net profit of Rs11.8b in FY10 (up 38% YoY) and Rs11.5b inFY11 (down 2% YoY). JPA quotes at a PER of 28.2x FY11E. Buy.
Company Represented By:Mr Suren Jain,MD Jaiprakash Power VentureMr R K Narang,Director & CFO Jaiprakash HydroMr Saurabh Paliwal,Investor Relations
Covering Analyst(s):Satyam Agarwal+91 22 3982 [email protected]
Shridatta Bhandwaldar+91 22 3982 [email protected]
YEAR NET SALES PAT EPS* EPS GR.* P/E* P/BV ROE ROCE EV/ EV/
END (RS M) (RS M) (RS) (%) (X) (X) (%) (%) SALES EBITDA
3/08A 39,670 6,097 5.2 31.8 46.9 6.2 16.3 10.6 8.8 37.8
3/09A 57,703 8,562 7.2 38.6 33.8 5.2 16.8 10.7 6.8 24.5
3/10E 93,447 11,662 8.3 0.0 29.4 5.0 18.7 14.8 5.0 14.1
3/11E 103,260 12,180 8.7 4.4 28.2 4.4 16.7 12.3 4.6 15.0
Bloomberg JPA INEquity Shares (m) 1404.6CMP (Rs) 244Mcap (US$ b) 7.252 W Range 256 / 471, 6, 12 Rel Per 13 / 182 / 26
* Fully Diluted

34August 3 - 5, 2009
5th Annual Global Investor Conference
Jet Airways
Key Takeaways
Focus on emerging as a global network carrierJet Airways (JAL) believes that globally two business models proved to be successfulin the airline industry: network and low-cost carriers. JAL is focused on establishingitself as a global network carrier with a firm footing in the fast growing Indianmarket.
Continuous innovation, relentless cost cuts the only solutionJAL is focusing on cost cutting especially in its domestic operations and consequentlylaunched a low-cost service, Jet Konnect. It operates 12 aircraft and might increasethat number to 24 by the end of FY10.
The management has outlined a $600m cost reduction program, includingrationalization of its network and reducing staff costs, administrative and S&GAexpenses.
The management has taken steps to cut costs in Jet Lite such as renewing itsageing fleet and rationalizing manpower costs. The company is likely to renewleases of its old aircraft with new ones, which will reduce the age of its fleet fromeight years to four in FY11.
International operations to stabilize soonJAL's international operations have stabilized after it cut capacity. Nine out of 22wide-body aircraft have been leased out.
Other takeawaysJAL has net debt of Rs145b, of which Rs85b is for aircraft at attractive interest ratesof less than 4%. JAL is looking to raise $800m through the PE and QIP route.
Valuation and viewWe believe JAL is a good proxy for the Indian aviation industry with 31% market share.JAL's international operations are likely to fare better than domestic operations due toless competition and lower fuel prices. The domestic operations will continue to facesignificant pressure on profitability due to slowing passenger demand, the depreciationof the rupee against the US dollar and stiff competition. Not rated.
Company Represented By:Mr K G Vishwanath, VicePresident - Commercial Strategy& Investor RelationsMr Raghunath G, Manager - MIS& Investor Relations
Covering Analyst(s):Siddharth Bothra+91 22 3982 [email protected]
YEAR NET SALES PAT EPS EPS P/E P/BV ROE ROCE EV/ EV/
END (RS M) (RS M) (RS) GROWTH (%) (X) (X) (%) (%) SALES EBITDA
3/06A 56,458 4,520 52.4 15.3 4.9 1.0 20.9 8.2 0.9 5.43/07A 70,578 279 3.2 -93.8 79.0 1.0 0.0 -0.6 1.0 19.83/08A 102,456 -5,844 -75.7 -2,440.3 -3.4 0.5 21.0 -7.5 1.3 -82.63/09A 130,779 -21,265 -111.4 -47.0 -2.3 0.6 0.6 -9.4 1.3 -20.2
Bloomberg JETIN INEquity Shares (m) 86.3CMP (Rs) 256Mcap (US$ b) 0.552 W Range 567 / 1151, 6, 12 Rel Per -4 / -17 / -54

35August 3 - 5, 2009
5th Annual Global Investor Conference
Jindal Steel & Power
Key Takeaways
Rich mineral resourcesJSPL has rich mineral resources of coal and iron ore. Coal reserves of 2.5b tonshave been allotted to the company in Orissa, Chhattisgarh, Madhya Pradesh andJharkhand.Iron ore mines are in Orissa, Jharkhand and Bolivia.
PAT grows 54% CAGR in 2000-09, strong pipeline of growth driversRevenue and PAT rose 43% and 54%, respectively, CAGR from 2000 to 2009. A strongpipeline of power and steel projects will drive earnings growth subsequently. Thecompany's 2020 vision envisages the following:
Steel capacities will rise from 3mt a year to 20mt a year.Power (including captive) capacity will rise from 1,340MW to 15,000MW.Oil production from coal-to-liquid project will rise to 80,000bpd.
Jindal PowerA 1,000MW power plant is operating at full capacity. Cost of power generation islow due to proximity of captive coal mines. A 400KVA transmission line connects thesite to the national grid. The project is highly profitable because of low cost ofgeneration and is able to sell most of the power through short-term contracts,under the open access policy, directly to the end user, earning lucrative rates.Jindal Power has ordered equipment for the 2,400MW brown-field expansion, whichis likely to be commissioned by 2012-13.The 4,500MW hydropower project is likely to be executed during 2014-20.
Other takeawaysJSPL has entered the oil and gas sector by acquiring five oil blocks in Georgia andone in Rajasthan (NELP VII), which have been grouped under Jindal Petroleum.Except for one operational block in Georgia, all the others are under exploration. Oiland gas are likely to start contributing to the bottomline in the next five to 10 years.Iron-ore mining in Bolivia is likely to start in FY10.
Valuation and viewWe expect Jindal Steel & Power to report net profit of Rs36.5b in FY10 and Rs38.8b inFY11. At a CMP of Rs2,722, the stock trades at a PE of 11.5xFY10E and P/BV of 4.1xFY10E(RoE of 35.3%). Maintain Buy.
Company Represented By:Mr Sushil Maroo, Director
Covering Analyst(s):Sanjay Jain+91 22 3982 [email protected]
YEAR NET SALES PAT EPS EPS P/E P/BV ROE ROCE EV/ EV/
END (RS M) (RS M) (RS) GROWTH (%) (X) (X) (%) (%) SALES EBITDA
3/08A 54,890 13,634 88.6 97.0 32.6 11.5 35.4 16.6 9.3 21.5
3/09A 108,443 30,572 198.6 124.2 14.5 6.6 45.1 27.9 4.6 9.6
3/10E 113,248 36,461 236.8 19.3 12.2 4.3 35.3 21.9 4.8 9.2
3/11E 126,419 38,747 251.7 6.3 11.5 3.2 27.5 16.7 4.6 9.0
Bloomberg JSP INEquity Shares (m) 154.0CMP (Rs) 2,884Mcap (US$ b) 9.352 W Range 3238 / 5171, 6, 12 Rel Per 2 / 106 / 26
Consolidated
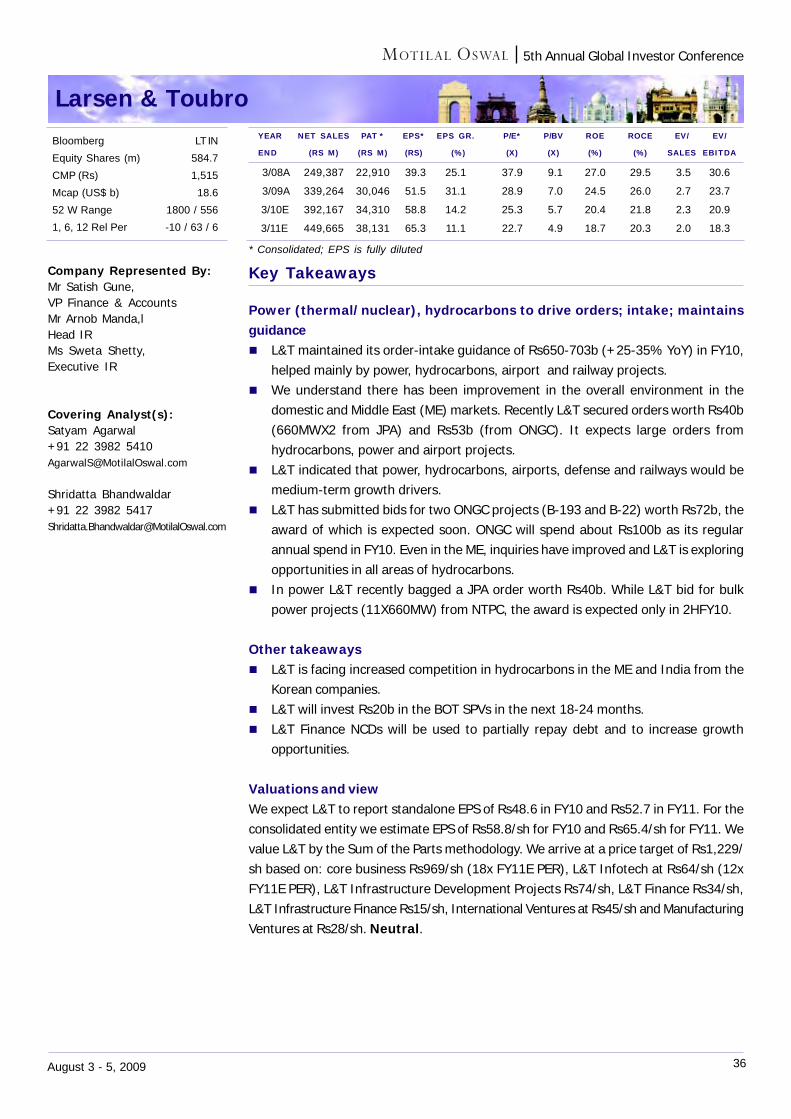
36August 3 - 5, 2009
5th Annual Global Investor Conference
Larsen & Toubro
Key Takeaways
Power (thermal/nuclear), hydrocarbons to drive orders; intake; maintainsguidance
L&T maintained its order-intake guidance of Rs650-703b (+25-35% YoY) in FY10,helped mainly by power, hydrocarbons, airport and railway projects.We understand there has been improvement in the overall environment in thedomestic and Middle East (ME) markets. Recently L&T secured orders worth Rs40b(660MWX2 from JPA) and Rs53b (from ONGC). It expects large orders fromhydrocarbons, power and airport projects.L&T indicated that power, hydrocarbons, airports, defense and railways would bemedium-term growth drivers.L&T has submitted bids for two ONGC projects (B-193 and B-22) worth Rs72b, theaward of which is expected soon. ONGC will spend about Rs100b as its regularannual spend in FY10. Even in the ME, inquiries have improved and L&T is exploringopportunities in all areas of hydrocarbons.In power L&T recently bagged a JPA order worth Rs40b. While L&T bid for bulkpower projects (11X660MW) from NTPC, the award is expected only in 2HFY10.
Other takeawaysL&T is facing increased competition in hydrocarbons in the ME and India from theKorean companies.L&T will invest Rs20b in the BOT SPVs in the next 18-24 months.L&T Finance NCDs will be used to partially repay debt and to increase growthopportunities.
Valuations and viewWe expect L&T to report standalone EPS of Rs48.6 in FY10 and Rs52.7 in FY11. For theconsolidated entity we estimate EPS of Rs58.8/sh for FY10 and Rs65.4/sh for FY11. Wevalue L&T by the Sum of the Parts methodology. We arrive at a price target of Rs1,229/sh based on: core business Rs969/sh (18x FY11E PER), L&T Infotech at Rs64/sh (12xFY11E PER), L&T Infrastructure Development Projects Rs74/sh, L&T Finance Rs34/sh,L&T Infrastructure Finance Rs15/sh, International Ventures at Rs45/sh and ManufacturingVentures at Rs28/sh. Neutral.
Company Represented By:Mr Satish Gune,VP Finance & AccountsMr Arnob Manda,lHead IRMs Sweta Shetty,Executive IR
Covering Analyst(s):Satyam Agarwal+91 22 3982 [email protected]
Shridatta Bhandwaldar+91 22 3982 [email protected]
YEAR NET SALES PAT * EPS* EPS GR. P/E* P/BV ROE ROCE EV/ EV/
END (RS M) (RS M) (RS) (%) (X) (X) (%) (%) SALES EBITDA
3/08A 249,387 22,910 39.3 25.1 37.9 9.1 27.0 29.5 3.5 30.6
3/09A 339,264 30,046 51.5 31.1 28.9 7.0 24.5 26.0 2.7 23.7
3/10E 392,167 34,310 58.8 14.2 25.3 5.7 20.4 21.8 2.3 20.9
3/11E 449,665 38,131 65.3 11.1 22.7 4.9 18.7 20.3 2.0 18.3
Bloomberg LT INEquity Shares (m) 584.7CMP (Rs) 1,515Mcap (US$ b) 18.652 W Range 1800 / 5561, 6, 12 Rel Per -10 / 63 / 6
* Consolidated; EPS is fully diluted

37August 3 - 5, 2009
5th Annual Global Investor Conference
Lupin
Key Takeaways
Differentiated US portfolio, strong growth in India & ramp-up in Europe to bethe key growth drivers, Confident of resolving US FDA issues
Differentiated US portfolio: Lupin has been able to exploit at least one low-competition (high margin) product opportunity in the US every year for the past fewyears. It currently has 56 ANDAs pending approval including filings for oralcontraceptives and ophthalmics which are likely to witness low-competition.Management expects to file about 35 ANDAs with the US FDA in FY10E adding tothis pipeline. We expect Lupin's formulation exports to regulated markets to grow at27% CAGR for FY09-11.Strong growth in India formulations: Lupin's domestic formulations revenueshave grown by more than 20% for the past three years led by new introductionsand ramp-up in some of the life-style segments. Management expects the growthtrajectory to continue over the next two years as well. We estimate 17% CAGR forthis business for FY09-11.Confident of resolving US FDA issues: Management has responded to the USFDA warning letter and expects a re-inspection of the Mandideep facility in the nextfew months. It is confident of resolving the cGMP issues over the next few months.Latam & GCC markets: While these are important markets for Lupin, it has notbeen able to gain traction in these markets organically. Management indicated thatit will be exploring inorganic opportunities in these markets, with focus on acquiringfront-end companies with established doctor relationships.Japan holds long-term potential: Management indicated that the Japanesegeneric market holds good long-term potential given the government's initiative toboost generics to reduce healthcare costs. It expects 15% CAGR for this businessover the next few years. Management expects improvement in profitability of thisbusiness in the long-term as it starts supplying products from its Indian facilities.MTM forex losses have reduced: Lupin had MTM forex losses of about Rs2.9b(reflected in the B/S) as of 31st Mar-09 which, have reduced to Rs1.5b as of 30thJun-09 due to the sequential appreciation of the INR vs the US$.
Valuations and viewWe expect Lupin's core operations (excluding one-off upsides) to record 17% sales andearnings CAGR for FY09-11 led by traction in regulated markets and strong growth indomestic formulations. The growth will be led by 27% CAGR for the regulated dosageform business and 17% CAGR for the domestic formulations business. We expect thecompany to record EPS of Rs68.7 for FY10E (up 20.8%) and Rs78.3 for FY11E (up 14%)on a high base. We believe valuations at 13.7x FY10E and 12x FY11E EPS do not fullyreflect the sustained earnings growth and 30%+ RoE. Maintain Buy.
Company Represented By:Mr Ramesh Swaminathan,President - Finance & Planning
Covering Analyst(s):Nimish Desai+91 22 3982 [email protected]
YEAR NET SALES PAT EPS EPS P/E P/BV ROE ROCE EV/ EV/
END (RS M) (RS M) (RS) GROWTH (%) (X) (X) (%) (%) SALES EBITDA
03/08A 27,064 3,334 37.8 43.3 24.9 6.0 31.0 22.0 3.2 20.0
03/09A 37,759 5,015 56.9 50.4 16.5 5.5 37.1 25.6 2.4 13.8
03/10E 45,053 6,057 68.7 20.8 13.7 4.2 36.8 27.0 2.0 11.4
03/11E 51,950 6,907 78.3 14.0 12.0 3.3 32.7 25.8 1.7 9.9
Bloomberg LPC INEquity Shares (m) 82.1CMP (Rs) 938Mcap (US$ b) 1.652 W Range 992 / 5181, 6, 12 Rel Per 1 / -15 / 18
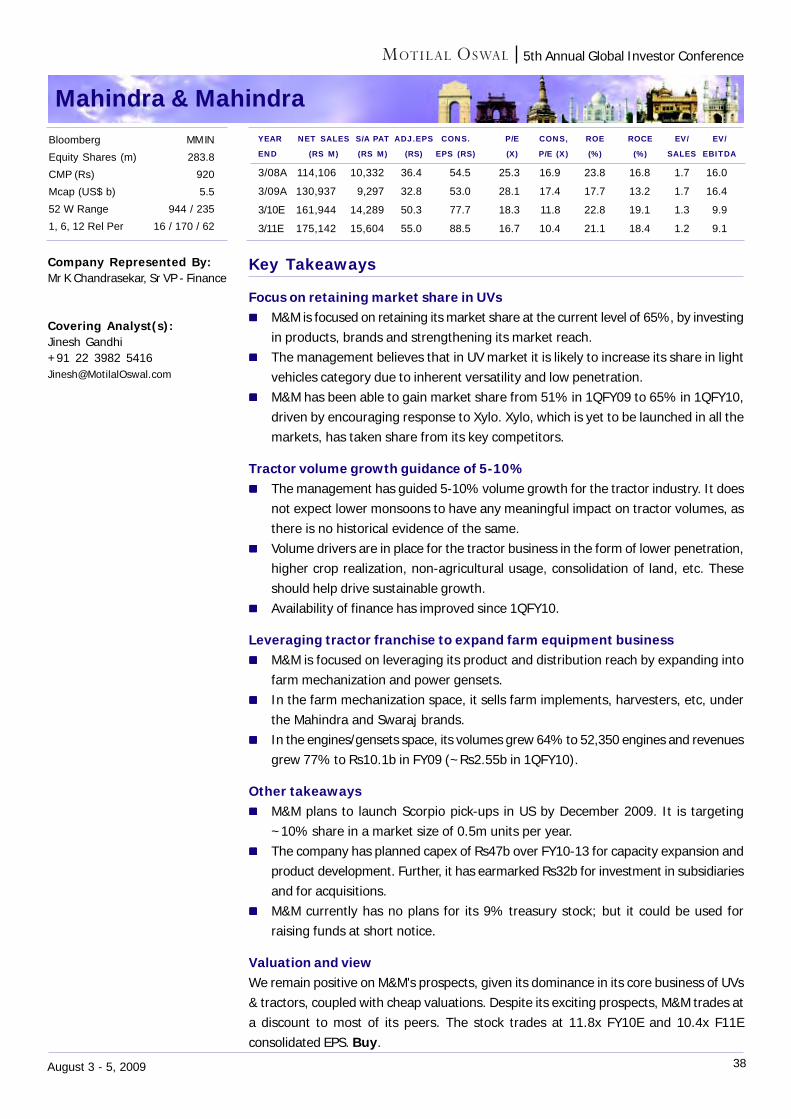
38August 3 - 5, 2009
5th Annual Global Investor Conference
Mahindra & Mahindra
Key Takeaways
Focus on retaining market share in UVsM&M is focused on retaining its market share at the current level of 65%, by investingin products, brands and strengthening its market reach.The management believes that in UV market it is likely to increase its share in lightvehicles category due to inherent versatility and low penetration.M&M has been able to gain market share from 51% in 1QFY09 to 65% in 1QFY10,driven by encouraging response to Xylo. Xylo, which is yet to be launched in all themarkets, has taken share from its key competitors.
Tractor volume growth guidance of 5-10%The management has guided 5-10% volume growth for the tractor industry. It doesnot expect lower monsoons to have any meaningful impact on tractor volumes, asthere is no historical evidence of the same.Volume drivers are in place for the tractor business in the form of lower penetration,higher crop realization, non-agricultural usage, consolidation of land, etc. Theseshould help drive sustainable growth.Availability of finance has improved since 1QFY10.
Leveraging tractor franchise to expand farm equipment businessM&M is focused on leveraging its product and distribution reach by expanding intofarm mechanization and power gensets.In the farm mechanization space, it sells farm implements, harvesters, etc, underthe Mahindra and Swaraj brands.In the engines/gensets space, its volumes grew 64% to 52,350 engines and revenuesgrew 77% to Rs10.1b in FY09 (~Rs2.55b in 1QFY10).
Other takeawaysM&M plans to launch Scorpio pick-ups in US by December 2009. It is targeting~10% share in a market size of 0.5m units per year.The company has planned capex of Rs47b over FY10-13 for capacity expansion andproduct development. Further, it has earmarked Rs32b for investment in subsidiariesand for acquisitions.M&M currently has no plans for its 9% treasury stock; but it could be used forraising funds at short notice.
Valuation and viewWe remain positive on M&M's prospects, given its dominance in its core business of UVs& tractors, coupled with cheap valuations. Despite its exciting prospects, M&M trades ata discount to most of its peers. The stock trades at 11.8x FY10E and 10.4x F11Econsolidated EPS. Buy.
Company Represented By:Mr K Chandrasekar, Sr VP - Finance
Covering Analyst(s):Jinesh Gandhi+91 22 3982 [email protected]
YEAR NET SALES S/A PAT ADJ.EPS CONS. P/E CONS, ROE ROCE EV/ EV/
END (RS M) (RS M) (RS) EPS (RS) (X) P/E (X) (%) (%) SALES EBITDA
3/08A 114,106 10,332 36.4 54.5 25.3 16.9 23.8 16.8 1.7 16.0
3/09A 130,937 9,297 32.8 53.0 28.1 17.4 17.7 13.2 1.7 16.4
3/10E 161,944 14,289 50.3 77.7 18.3 11.8 22.8 19.1 1.3 9.9
3/11E 175,142 15,604 55.0 88.5 16.7 10.4 21.1 18.4 1.2 9.1
Bloomberg MM INEquity Shares (m) 283.8CMP (Rs) 920Mcap (US$ b) 5.552 W Range 944 / 2351, 6, 12 Rel Per 16 / 170 / 62

39August 3 - 5, 2009
5th Annual Global Investor Conference
Mahindra Lifespaces
Key Takeaways
Robust activity at the Chennai SEZThe area under Chennai SEZ increased by ~180 acres in FY09, thereby increasingthe total area under the SEZ to ~1,550 acres.Chennai SEZ has a total customer base of ~48 companies, of which 24 are operationalcurrently. Employment in the Chennai SEZ currently stands at ~12,000 employeesand is slated to increase to ~0.1m by FY14.Mahindra Lifespaces (MLL) has planned two new residential launches in FY10: (i) aproject of ~1msf, and (ii) a project of ~1.5msf through its JV with Ayala Land.
Jaipur SEZ gains tractionMLL's Jaipur SEZ became operational in FY09, within 19 months of ground breaking,with two of its clients commencing operations in their IT/ITeS SEZs. Of the proposedarea of 3,000 acres, it has already acquired 2,604 acres and is hopeful of completingthe remaining land acquisition within FY10.~1.6msf of IT space (christened eVolve) is under construction, of which 0.23msfhas been completed and leased out to Infosys BPO and Deutsche.As of FY09, MLL's Jaipur SEZ had a total of 29 clients. The management envisagesthat the SEZ would attract an investment of Rs100b and employee base of ~0.1monce it is fully operational.
Planned new launches across key citiesIt has planned new launches of ~5.3msf of residential projects in Chennai (~2.3msf),Pune (~0.3msf), Nagpur (~1.3msf) and Gurgaon (~1.4msf).
Update on planned SEZsMLL is actively considering the launch of its proposed 52-acre biotech SEZ in Thane(30km north-east of Mumbai), Maharashtra. It has received in-principle approvalfor its planned multi-product SEZ at Karla, near Pune.The management has stated that land acquisition is in progress for ~5,500 acres inwestern Maharashtra (which includes ~3,000-acre multi-product SEZ at Karla, Pune).
Valuation and viewMLL has a healthy balance sheet, with low leverage of ~0.1x as of FY09 and no majorland outstandings. This, coupled with its strong management, differentiates the companyfrom its peers. Our SOTP value for MLL is Rs518/share: (1) Chennai SEZ at Rs96/share, (2) Jaipur SEZ at Rs174/share, (3) residential vertical at Rs171/share, and (4)cash/other rental assets at Rs76/share. The stock trades at 1x FY11E adjusted bookvalue of Rs281 and at 0.6x its SOTP value of Rs518. Our target price for MLL is Rs362/share, which translates into a 14% upside. Maintain Buy.
Company Represented By:Ms Anita Arjundas, CEOMr Vishnu Banka, GM - Finance
Covering Analyst(s):Siddharth Bothra+91 22 3982 [email protected]
Mansi Trivedi+91 22 3982 [email protected]
Bloomberg MLIFE INEquity Shares (m) 40.8CMP (Rs) 317Mcap (US$ b) 0.352 W Range 580 / 831, 6, 12 Rel Per 9 / 100 / -42
YEAR NET SALES PAT EPS EPS P/E P/BV ROE ROCE EV/ EV/
END (RS M) (RS M) (RS) GROWTH (%) (X) (X) (%) (%) SALES EBITDA
3/08A 2,311 449 16.0 271.2 19.5 1.5 7.8 8.0 6.6 23.5
3/09E 3,418 641 15.7 -3.5 20.2 1.4 6.9 7.8 4.3 20.4
3/10E 3,870 875 21.5 36.7 14.8 1.3 8.7 12.1 3.2 8.63/11E 5,454 1,622 39.8 85.3 8.0 1.1 13.8 18.0 1.9 4.2
40August 3 - 5, 2009
5th Annual Global Investor Conference
Marico
Key Takeaways
Parachute volumes to grow 8-9%; lower input cost to enable margin expansionParachute Coconut Oil, Marico's cash cow, is likely to report volume growth of 8-9%in FY10. The management indicated that the trend of up-trading from loose oils wassustainable, and being the market leader, Parachute would benefit most.Strong pricing power and benign prices of copra will result in margin expansion.Copra prices are 20% lower YoY and purchasing by government agencies at minimumsupport price (MSP) is unlikely to take it to previous highs.Imposition of excise duty will have minimal impact, if any, as the company believesit enjoys the pricing power to pass on the cost.
Hair oils in new growth orbit; trend to continueThe management said rising awareness of personal grooming and lifestyle changeshad put the hair oil category into a new growth orbit. The management maintainedits growth guidance of 14%.Marico has begun prototyping two cooling oil variants - Nihar Naturals CoconutCooling Oil in Bihar and Parachute Advanced Coconut Cooling Oil in Andhra Pradeshto expand its portfolio to cooling oils.
Kaya impacted by slowdownKaya, being a high ticket discretionary spend, has been impacted by the economicslowdown. After the Budget, nearly 70% of Kaya revenue is likely to come under theservice-tax bracket.Same-store sales in India have been flat and the imposition of service tax is likely toresult in deterioration of profitability. The management aims to open 15-20 newstores a year.The management expects the division to post EBITDA margin of 20%.
Global business profitability to riseThe franchise/distribution in Bangladesh for Parachute will be leveraged to expandthe group's product range and area of operations.Supply-chain issues in Egypt have been sorted out. The commissioning of themanufacturing hub in Egypt (tax/excise-free unit) will increase margins.
Valuation and viewWe estimate 20.6% EPS CAGR over FY09-11. The stock trades at 21.2x FY10E EPS of Rs3.9 and 17.2xFY11E EPS of Rs4.8. Maintain Buy.
Company Represented By:Mr Chaitanya Deshpande,Head M&A and IR
Covering Analyst(s):Amnish Aggarwal+91 22 3982 [email protected]
Amit Purohit+91 22 3982 [email protected]
YEAR NET SALES PAT EPS EPS P/E P/BV ROE ROCE EV/ EV/
END (RS M) (RS M) (RS) GROWTH (%) (X) (X) (%) (%) SALES EBITDA
03/08A 19,050 1,586 2.6 62.3 32.1 16.2 50.4 42.6 2.8 21.8
03/09A 23,884 2,037 3.3 28.5 25.0 11.2 44.9 42.5 2.2 17.6
03/10E 27,467 2,352 3.9 17.5 21.2 7.9 37.3 47.4 1.9 13.9
03/11E 32,945 2,950 4.8 23.3 17.2 5.7 33.1 47.9 1.5 11.2
Bloomberg MRCO INEquity Shares (m) 609.0CMP (Rs) 84Mcap (US$ b) 1.152 W Range 92 / 461, 6, 12 Rel Per 4 / -32 / 42

41August 3 - 5, 2009
5th Annual Global Investor Conference
Maruti Suzuki India
Key Takeaways
Domestic volume growth guidance conservative at 5%Cautiously positive outlook for FY10, with conservative domestic volume growth of5% (v/s our estimate of 10% and ~13% YTD growth).The management is cautious in its guidance despite strong momentum in domesticvolumes due to (a) lack of pick-up in volumes in top-10 cities, and (b) uncertainty onmonsoon. Monsoon is a concern, although there is no historical evidence of below-normal monsoon impacting volumes.However, it is witnessing pick-up in volume growth in tier-2 cities, whereas ruralmarkets continue to register strong demand.
Strong demand from export marketsThe management expects export volume of 130,000 units (v/s our estimate of 119,000units), driven by A-Star exports to European countries.A-Star exports to European countries are driven by 'scrappage' incentives offeredthe respective governments. Further, Maruti has commenced A-Star exports to non-European markets.Export of older models is recovering, with monthly run-rate of ~1,500 units.
Improving sales mix driven by newer modelsMaruti's product mix has been improving since 3QFY09, with the contribution of A2& A3 segment going up to 86.4% in 1QFY10 from 71.6% in 1QFY09.This shift in product mix is driven by robust demand for newer products like Ritz, A-Star, Swift and Swift Dzire.Sales of diesel engine cars have also grown significantly (~66% YoY & 10% QoQ).
New levers of growthMaruti is focused on exploring newer markets, especially in rural areas and smallertowns. Volumes from the rural market, which contributes 14% of Maruti's totalvolumes, grew 34% in 1QFY10. On the other hand, volumes from top-10 cities(~46% of Maruti's total volumes) declined 4%.Sales to government employees now contribute 14% as against 8% last year.Contribution of True Value (used car network) to volumes, through exchangeprogram, now stands at 16%.
Valuation and viewWith the macro environment improving, there are catalysts that would drive earningsgrowth for the company. Improving demand outlook for its cars would drive stockperformance in the medium term. The stock trades at 22.8x FY10E and 20.4x FY11EEPS. Maintain Buy.
Company Represented By:Mr Ajay Seth, CFO
Covering Analyst(s):Jinesh Gandhi+91 22 3982 [email protected]
YEAR TOTAL INC. PAT ADJ. EPS EPS P/E P/BV ROE ROCE EV/ EV/
END (RS M) (RS M) (RS) GROWTH (%) (X) (X) (%) (%) SALES EBITDA
3/08A 182,599 17,100 59.2 9.1 24.4 4.9 20.6 26.7 2.1 14.3
3/09A 209,075 12,175 42.1 -28.8 34.2 4.4 12.8 16.9 1.8 19.7
3/10E 251,517 18,300 63.3 50.3 22.8 3.7 16.3 21.7 1.5 12.6
3/11E 288,167 20,434 70.7 11.7 20.4 3.2 15.7 20.9 1.3 11.0
Bloomberg MSIL INEquity Shares (m) 289.0CMP (Rs) 1,441Mcap (US$ b) 8.852 W Range 1516 / 4281, 6, 12 Rel Per 26 / 75 / 128

42August 3 - 5, 2009
5th Annual Global Investor Conference
ONGC
Key Takeaways
Clarity on subsidy-sharing policy expected: ONGC indicated that the governmentintentions are towards rationalization of subsidy sharing. In 1QFY10 ONGC shared onlytowards auto fuel under-recoveries. The company pointed out that as indicated by theFinance Minister in his Budget speech a new expert group was likely to be set up todecide on subsidies and the policy on auto-fuel pricing.
ONGC production maintained vis-a-vis decline in global fields: ONGC's oil andgas production has been maintained against a non-OPEC production decline of 9.4% inthe past nine years (2000-08). ONGC's investments in IOR/EOR and redevelopmentprojects to arrest the production decline have been over Rs300b. The cumulativeproduction through IOR/EOR till date has been 48mmt.
Spuds first well in Kerala-Konkan Basin: On August 2 ONGC spudded (commenceddrilling) its first deepwater well in the Kerala-Konkan Basin. It is using a deepwater righired from RIL at this well and drilling is expected to be complete in 101 days. After thiswell the rig will be shifted to KG-DWN-98/2 block.
To adopt hub development for east-coast discoveries: ONGC will adopt the hubdevelopment for its east-coast discoveries (G-4-6, GS-29-1, G-4-5, KG-DWN-98/2, IB)in three phases. Production is likely to commence in 2012.
Alternative-energy investment sources imminent: The management expectsdemand to rebound as the global economy recovers. Besides, over the long term, oilprices are likely to rise and hence it will be imperative to shift towards alternativeenergy sources (CBM, UCG, shale gas, gas hydrates).
US$50b investment in 15-20 years required in Indian E&P: Indian sedimentarybasins are poorly explored and require technology and capital-intensive acceleratedexploration. Only 22% of the area is well explored and investment of US$50b will benecessary in next 15-20 years to increase E&P in India, which will also help in reducingdependence on imported oil.
Valuation and view: We assume oil price of US$60/bbl in FY10 and US$65/bbl inFY11. We build upstream (ONGC, OIL and GAIL) share at 1/3rd level in our estimates.We estimate ONGC's EPS at Rs103 in FY10 and Rs106 in FY11. At the CMP of Rs1,194/sh, ONGC quotes at PER of 11.6x FY10E EV/EBITDA of 5.7. Neutral.
Company Represented By:Mr R S Sharma, CMDMr D K Sarraf, Director (Finance)Mr B L Ghasolia,Advisor (Finance).Mr Sanjiv Kumar,Chief Manager (F&A)Mr L Nelson, Manager (F&A)
Covering Analyst(s):Harshad Borawake+91 22 3982 [email protected]
YEAR NET SALES PAT EPS EPS P/E P/BV ROE ROCE EV/ EV/
END (RS B) (RS B) (RS) GROWTH (%) (X) (X) (%) (%) SALES EBITDA
03/08A 968 199 92.9 11.8 12.9 3.3 27.7 27.5 2.3 5.5
03/09A 1,046 198 92.3 -0.6 12.9 2.9 23.7 23.2 2.3 5.6
03/10E 1,008 219 102.5 11.0 11.6 2.5 22.8 23.6 2.3 5.7
03/11E 1,068 227 105.9 3.3 11.3 2.2 20.5 21.4 2.1 5.7
Bloomberg ONGC INEquity Shares (m) 2138.9CMP (Rs) 1,192Mcap (US$ b) 53.752 W Range 1220 / 5381, 6, 12 Rel Per -2 / 4 / 13
Consolidated

43August 3 - 5, 2009
5th Annual Global Investor Conference
Pantaloon
Key Takeaways
Demand revival reflected in same-store sales growthThe management indicated increasing signs of revival in consumption trends after theslump in the October-December quarter. The recently concluded end-of-season salebeat expectations with increasing footfalls and conversions. Though Home Retailingcontinues to disappoint long-term opportunity is big. The management expects HomeSolutions' profitability to improve as volumes are likely to rise in FY10.
Margins to rise due to improved sales mix, higher private-label shareIn five years Pantaloon expects 40-50% of sales to from its own brands including 85-90% in fashion (75% currently), 30% in household and personal-care products, 15-18% in electronics and a high share in home products. Its area-addition in the higher-margin fashion segment will be higher than the food and grocery sections which willboost profitability. The management indicated an EBIDTA margin band of 10-12% whichshows a 200bp expansion in the medium term. Near-term margins are expected to holdstrong due to 1) the rising share of private labels in sales mix 2) higher proportion ofsales from full-price products (81% in FY09 sales season against 65% in FY08) and 3)cost control measures in lease rentals, employee costs and overheads.
Targets space addition of 5msf by FY11; capex requirement of Rs5bThe company plans to add 5msf in FY10 and FY11 (2.5msf each year). The companybelieves the capex requirement will be capped at Rs2,500/sf (including working capital)resulting in a requirement of Rs5b a year for the next two years. Recent capital infusionof Rs 3.8b was used to repay debt. The management said it could raise funds eitherthrough a QIP issue or a stake sale to a strategic partner.
Consolidated results to be in black in FY10; not to fund units in near termThe management has guided for a profit of Rs750m in FY10 on a consolidated basis.The swing is largely due to key subsidiaries like Home Solutions and Future Capitalbreaking even/contributing marginally to profits, even as others like KB Fair Price andFuture Bazaar incur losses. But the management indicated that most subsidiaries werefully funded and those that weren't were likely to get funding on their own.
Valuation and viewWe estimate 25.6% EPS CAGR over FY09-FY11E. The stock trades at 32.5xFY10E EPSof Rs9.7 and 25.7xFY11E EPS of Rs12.30. Maintain Buy.
Company Represented By:Mr Prashant Desai,Chief Investor Relations
Covering Analyst(s):Amnish Aggarwal+91 22 3982 [email protected]
Amit Purohit+91 22 3982 [email protected]
YEAR NET SALES PAT EPS EPS P/E P/BV ROE ROCE EV/ EV/
END (RS M) (RS M) (RS) GROWTH (%) (X) (X) (%) (%) SALES EBITDA
06/08A 50,489 1,259 7.9 90.0 39.8 2.7 6.8 9.3 1.4 15.2
06/09E 63,845 1,362 7.8 -1.6 40.5 2.8 6.9 11.4 1.1 10.6
06/10E 74,154 1,842 9.7 24.5 32.5 2.5 7.7 11.6 0.9 9.6
06/11E 87,242 2,395 12.3 26.7 25.7 2.3 8.9 11.7 0.8 8.6
Bloomberg PF INEquity Shares (m) 175.2CMP (Rs) 314Mcap (US$ b) 1.252 W Range 417 / 1051, 6, 12 Rel Per -10 / 37 / -18
44August 3 - 5, 2009
5th Annual Global Investor Conference
Piramal Healthcare
Key Takeaways
Double-digit growth for domestic formulations; improving profitability inCRAMS; Debt reduction to be key earnings drivers
Domestic business to record double-digit growth: Expanded field force,aggressive new launches and increased geographical penetration will be key driversfor this business which continues to be the single largest profit contributor. Managementindicated that this business will continue to grow in double-digits for next few years.We expect the company to record about 13% revenue CAGR for this business overthe next two years on a high base.Clarity on revival of CRAMS supplies from India by Dec'09: Managementexpects clarity on revival of CRAMS supplies from India by Dec'09 when customersfirm up plans for outsourcing for CY10 and after some of the large M&A deals(proposed) in the global pharmaceutical space receive regulatory approval.Restructuring on UK CRAMS business nearing completion: With the closureof the Huddersfield facility and transfer of contracts from this facility to other sites,the restructuring of the UK CRAMS business is nearing completion. Managementdoes not expect the need for any further restructuring/rationalization.Contract renewals & restructuring at UK operations to improveprofitability: PHL has renewed part of the Pfizer contract at its Morpeth facilityand is confident of further renewals. Closure of the Huddersfield facility is likely toadversely impact topline but will expand profitability as some of the customer contractsget shifted to India.Debt to reduce from FY10E: PHL's debt-equity has increased significantly from0.7x in FY08 to about 1x currently due to funding of acquisitions (Rs3b) and capex(Rs1.3b). Post the significant spend on acquisitions, management has indicated thatthe company is unlikely to bid for any large acquisition in FY10E. Management istargeting D/E to improve from current 1x to about 0.7x by March 2009.Reiterates FY10 guidance: Management has reiterated its FY10E guidance of16-17% topline growth, EBITDA Margins of 21-22% and EPS of Rs23.5-24/share.
Valuation and viewWhile we expect 1HFY10 to be challenging for PHL given the inventory correctionundertaken by CRAMS customers, we believe that PHL's strong MNC relations will ensuretraction in CRAMS business in the medium-term. A steady double-digit growth for thedomestic formulations business with improving profitability and potential debt reductionshould also augur well over the next two years. We expect EPS of Rs23 for FY10 (up34%) and Rs29.1 for FY11 (up 27%), leading to 30% earnings CAGR over FY09-11E(albeit on a low base) and 30%+ RoE in FY10E and FY11E. Valuations at 14x FY10E and11x FY11E EPS do not fully reflect these positives. Maintain Buy.
Company Represented By:Ms Nandini Piramal, EDMr Murari Rajan, EDMr Sagar Gokani, Manager
Covering Analyst(s):Nimish Desai+91 22 3982 [email protected]
YEAR NET SALES PAT EPS EPS P/E P/BV ROE ROCE EV/ EV/
END (RS M) (RS M) (RS) GROWTH (%) (X) (X) (%) (%) SALES EBITDA
03/08A 28,728 3,643 17.4 58.9 18.4 6.1 34.0 25.6 2.6 13.6
03/09A 32,448 3,580 17.1 -1.7 18.7 5.1 29.7 21.0 2.4 12.7
03/10E 37,753 4,781 22.9 33.5 14.0 4.0 31.8 24.2 2.0 9.7
03/11E 43,492 6,087 29.1 27.3 11.0 3.1 31.7 26.7 1.7 7.8
Bloomberg PIHC INEquity Shares (m) 209.0CMP (Rs) 321Mcap (US$ b) 1.452 W Range 367 / 1641, 6, 12 Rel Per -9 / -18 / -15

45August 3 - 5, 2009
5th Annual Global Investor Conference
Reliance Capital
Key Takeaways
The management's focus has changed from faster top-line growth and market-sharegains to profitability. Across all the businesses cost controls and optimization remainkey focus areas. The management mentioned that asset management, life insuranceand broking and distribution remain core businesses, and consumer finance and generalinsurance remain non-core businesses.
Reliance Life value unlocking in FY10The management is confident of unlocking value from its life-insurance business inFY10 through either an IPO or stake sale. A proposal for approval for an IPO is withthe government of India.Management is confident of growing at least twice as much as private life insurersin FY10.Reliance Life reported NBAP of Rs974m in 1QFY10 with a margin of 21.2% against20.9% in FY09. The company sees losses to fall to Rs2.5-3b by FY10 from Rs10.8bin FY09. It expects to break even in FY11. So far Reliance has invested Rs27.4b inlife insurance. It expects to infuse Rs4-5b in FY10 and Rs1.5-2b in FY11.The management believes the recent IRDA proposal of putting a cap on ULIP chargescan be managed without significant impact on profitability by controlling costs andaltering a few policy terms and conditions.
Reliance consumer finance aims at 1% RoANPAs are near their peak-net NPAs of Rs2.8b comprise 3%+ of the loan book.Incremental slippages have fallen from historical levels.The loan-book size is seen at Rs100b by FY10-a growth of 15%. The managementaims to make at least 1% RoA from this business. The management is consideringsecuritization to keep the balance sheet light and improve RoA.
Other takeawaysAs on date the group has a proprietary book of Rs21b with unrealized gains of Rs5b.Reliance General Insurance will grow 10-12% only with a focus on improving thecombined ratio and profits.The broking business will consolidate/rationalize its operations in FY10 and mightconsider changing the fee structure to boost future profits.Capital requirements across the businesses have fallen as the desired scale hasbeen achieved and profitability will improve.
Valuation and viewWe expect RCFT to report EPS of Rs23 in FY10 and Rs33 in FY11. BV is expected to beRs322 and Rs350 in FY10 and FY11. RCFT trades at 27.5x FY11E PE and 2.6x FY11 BV.Maintain Neutral. Our FY11E SOTP value is Rs863.
Company Represented By:Mr Praveen Challa, SVP - IRMs Savli Mangle, AVP - IR
Covering Analyst(s):Ajinkya Dhavale+91 22 3982 [email protected]
Alpesh Mehta+91 22 3982 [email protected]
Bloomberg RCFT INEquity Shares (m) 246.2CMP (Rs) 913Mcap (US$ b) 4.752 W Range 1475 / 2741, 6, 12 Rel Per -4 / 74 / -41
YEAR EBITDA PAT EPS EPS P/E P/BV ROE
END (RS M) (RS M) (RS) GROWTH (%) (X) (X) (%)
3/08A 12,161 10,057 40.9 43.0 22.4 3.4 16.93/09A 13,246 10,157 41.3 1.0 22.1 3.0 14.43/10E 9,045 5,720 23.2 -43.7 39.3 2.8 7.43/11E 11,741 8,169 33.2 42.8 27.5 2.6 9.9
46August 3 - 5, 2009
5th Annual Global Investor Conference
Reliance Communications
Key Takeaways
Strong wireless traffic growth driven by GSM tractionRCom reported the highest QoQ traffic growth of 11.5% (8-10% reported by peers),driven by increased usage by GSM subscribers. Customer response to GSM hasbeen better than the company's expectations.The company had withdrawn promotional minutes offered as part of the "customerexperience program" in March 2009. Migration of new GSM subscribers to normaltariff plans supported RPM (+0.4% QoQ excluding termination impact).
Profitability to be sustainedRCom expects profitability to be sustained along with strong volume growth drivenby GSM.While tariffs could trend down in subsequent quarters, higher network utilizationwould lead to cost efficiencies, thus leading to stable wireless margins for RCom.
Coverage capex behind, capex to be driven by capacity requirementsRCom's 50,000 GSM cell site base is adequate for coverage requirements.Incremental capex would be low, as RCom can add electronics to the existing sitebase for capacity requirements once the current capacity (of start-up network) isutilized.The company would be adding 5,000-15,000 cell sites in FY10 depending on (1)traffic and subscriber growth, and (2) tower availability from USO.FY10 capex guidance remains unchanged at Rs100b.
High CDMA spectrum allocation with RCOM ideal for data applicationsRCom has seen good response to the recently launched EVDO-based high speedwireless internet service in 35 cities.Significant (~5 MHz) allocation in the 800 MHz band allows RCom to dedicate spectrumexclusively towards high speed data applications like data cards.
Non-wireless business outlook stableRCom's non-wireless business growth has been sluggish due to cautious enterprisespending and certain regulatory developments.The management believes that demand has bottomed out and business outlook forGlobal and Broadband segments is stable.
Valuations and viewThe stock trades at an EV/EBITDA of 7.4x FY10E and 5.5x FY11E, and P/E of 11.5xFY10E and 8.9x FY11E.We maintain Buy on operational turnaround, driven by the GSM launch, sharp declinein capex intensity and cheap valuations.
Company Represented By:Mr Arvind Narang, Joint president
Covering Analyst(s):Shobhit Khare+91 22 3982 [email protected]
YEAR NET SALES PAT EPS EPS P/E P/BV ROE ROCE EV/ EV/
END (RS M) (RS M) (RS) GROWTH (%) (X) (X) (%) (%) SALES EBITDA
3/08A 190,679 55,095 26.7 71.0 10.5 2.1 22.7 12.0 3.52 8.23/09A 229,410 61,552 29.8 11.7 9.4 1.5 18.7 8.9 3.48 8.63/10E 267,218 52,094 25.3 -15.4 11.1 1.4 13.1 6.8 3.0 7.23/11E 326,819 67,066 32.5 28.7 8.6 1.2 15.0 9.7 2.3 5.4
Bloomberg RCOM INEquity Shares (m) 2063.0CMP (Rs) 280Mcap (US$ b) 12.152 W Range 463 / 1311, 6, 12 Rel Per -9 / 0 / -43
47August 3 - 5, 2009
5th Annual Global Investor Conference
Reliance Industries
Key Takeaways
KG-D6 oil and gas production: KG-D6 is producing 31mmscmd of gas and 12kbpd ofcrude oil. RIL commenced oil production at KG-D6 in September 2008 and gas productionin April 2009.
Strong near-term petchem margins seen: Petchem margins will continue to remainstrong in the near term due to RIL's domestic focus. RIL does not expect margins to beimpacted by new Middle East supply, as they are likely to target the US.
Refining margins affected by low diesel cracks; utilization seen to stay high:RIL's GRMs have been under pressure in recent quarters led by global weakness in therefining sector (US$7.5/bbl in 1QFY10, lowest in the past 15 quarters) and particularlylower diesel cracks. Its out-performance over the regional benchmark, Singapore GRM,has declined due to lower light-heavy crude price differentials. Operating rates areexpected to remain high due to lower operating costs and flexibility in refinery production.
New Reliance Petroleum (RPET) refinery operating above 90% utilization: NewReliance Petroleum refinery is operating at ~93% capacity utilization. In 1QFY10 RPETprocessed 4.04mmt of crude (55% cap utilization) and produced 49kt of PP. But it is yetto reach full complexity pending commissioning of one or two downstream units, andexpects to reach full complexity by the end of August.
Investments in retail and SEZ have slowed: Incremental investments in retail andSEZ have been low in recent quarters. Cumulative investment until 1QFY10 was Rs55bin retail and Rs28b in SEZ.
Valuation and view: We estimate RIL to report EPS of Rs126 in FY10 and Rs159 inFY11. At the CMP of Rs2,076/sh, RIL quotes at PER of 16.5x FY10E and 13.1x FY11E andEV/EBITDA of 10x FY10 and 8x FY11. Buy.
Company Represented By:Mr Robinder Singh, VicePresident (Investor Relations)Mr Hemen Modi, GeneralManager (Investor Relations)
Covering Analyst(s):Harshad Borawake+91 22 3982 [email protected]
YEAR NET SALES PAT EPS EPS P/E P/BV ROE ROCE EV/ EV/
END (RS B) (RS B) (RS) GROWTH (%) (X) (X) (%) (%) SALES EBITDA
03/08A 1,334 143 98.2 19.5 21.1 3.7 20.1 16.6 2.5 14.3
03/09A 1,463 156 103.1 -1.1 20.1 2.9 16.1 13.7 2.3 14.5
03/10E 1,771 207 125.5 21.7 16.5 2.4 16.3 14.9 2.0 10.0
03/11E 1,985 263 158.5 26.3 13.1 2.1 17.9 17.3 8.0 8.0
Bloomberg RIL INEquity Shares (m) 1573.4CMP (Rs) 2,075Mcap (US$ b) 68.752 W Range 2535 / 9301, 6, 12 Rel Per -4 / -14 / -15
FY10E onwards includes RPET financials
48August 3 - 5, 2009
5th Annual Global Investor Conference
Reliance Infrastructure
Key Takeaways
Strong EPC order book; building competencies for EPC in other sectorsThe EPC division order book stands at Rs206b of which Sasan UMPP accounts forRs127b (62% of order book). The number of employees for the division currentlystands at 1,550 (against 1,050 in March 2008), and expected to be ramped up to3,500 in 18 months.RELI is expanding its competence of the EPC division towards infrastructure projectslike airports, ports and metros.
Infrastructure assets under development worth Rs135bRELI has a portfolio of 11 infrastructure projects under development, valued atRs135b, while it is sole/L1 bidder for projects valued at Rs200b. The companyrecently signed a concession agreement for Gurgaon-Faridabad road project (Rs8b)and financial closure is expected in 2QFY10. It is an L1 bidder for the Jaipur-Reengusroad project (52km).Mumbai metro phase I is expected to be completed by September 2010 and RELIhas emerged as the sole bidder for Mumbai metro phase II. The cost of phase IIdevelopment is Rs110b, of which VGF is Rs23b.Real-estate development is expected to contribute meaningfully to the Delhi metroproject NPV (59,000 sq. meters, spread over four locations).
Profitability of Mumbai regulatory area may not be impactedDemand for Mumbai region is 1,540MW, met from 500MW Dahanu (cost of Rs2.3/unit), 500MW from Tata Power (Rs5/unit) and 540MW on spot basis (Rs7-9/unit)RELI's regulatory business profit for Mumbai region is unlikely to be impacted giventhat Tata Power will have to use RELI's distribution network.RELI has floated tenders to source medium-term power of 1GW (from November2009 to 2014) and 1.5GW on a long-term basis (November2014 onwards). Thetender is expected to be finalized by October 2009.
Net cash/liquid investments of Rs27bGross cash and equivalents in FY09 was Rs101b, comprising Rs54b in cash/MFs,Rs16b in ICDs Rs30b in preference shares.RELI has received advances of Rs18b from Reliance Power towards EPC of SasanUMPP and Krishnapatnam UMPP.
Valuation and viewWe expect RELI to report net profit of Rs12.3b in FY10 (35.5% YoY) and Rs14b in FY11(14% YoY). The stock trades at a PER of 22.1x FY10E and 19.4x FY11E. We arrive at aSOTP based target price of Rs1,278/share. Maintain Buy.
Company Represented By:Mr Amit Jain,Head IR
Covering Analyst(s):Satyam Agarwal+91 22 3982 [email protected]
Nalin Bhatt+91 22 3982 [email protected]
YEAR NET SALES PAT EPS* EPS P/E* P/BV ROE ROCE EV/ EV/
END (RS M) (RS M) (RS) GROWTH (%) (X) (X) (%) (%) SALES EBITDA
3/08A 63,642 7,442 33.2 -7.2 36.5 2.8 11.0 9.7 3.4 40.1
3/09A 96,965 9,081 40.5 22.0 29.9 2.6 10.2 9.0 2.4 27.5
3/10E 116,299 12,301 54.8 35.5 22.1 2.4 10.4 10.1 2.1 24.4
3/11E 128,413 14,032 62.5 14.1 19.4 2.2 10.9 10.5 2.4 19.6
Bloomberg RELI INEquity Shares (m) 224.3CMP (Rs) 1,212Mcap (US$ b) 5.752 W Range 1374 / 3531, 6, 12 Rel Per -6 / 58 / 10
* Consolidated, Fully Diluted

49August 3 - 5, 2009
5th Annual Global Investor Conference
Reliance Power
Key Takeaways
Project progress on track, cumulative capex of Rs61bReliance Power's (R Power) ongoing projects, viz, Rosa Phase 1, Butibori projectand Sasan UMPP are progressing as per schedule.Cumulative capex on various projects stands at Rs61b, including Rs20b for RosaPhase 1, Rs5b for Rosa Phase 2, Rs16b for Sasan UMPP, Rs10b for KrishnapatnamUMPP, Rs4b for Butibori project and Rs6.5b towards Dadri and other projects (evencost of DPR is included for hydro power projects).Out of the total capex of Rs61b incurred on various projects till date, Rs45b is equitycontribution and Rs16b is debt (pertaining to Rosa Phase 1).
Financial closure achieved for 5.8GW projects, Krishnapatnam next in lineR Power has achieved financial closure for 5.8GW of projects under constructionincluding Sasan UMPP (4GW), Rosa Power Phase 1 & 2 (1.2GW), Butibori (600MW),and it is working on financial closure for Krishnapatnam (4GW).Financial closure for Krishnapatnam UMPP is in final stages, as IDFC and PFC havebeen appointed lead arrangers and have together sanctioned debt of Rs26b for theproject. The management expects financial closure to be complete by end FY10.
Rosa Phase 1 to be commissioned by March 2010Management expects 600MW of Rosa power project to be completed by March2010, vs total project completion timeline of June 2010. The project is based on newtariff guidelines and thus, project return will be based on 16% RoE plus incentives.Rosa Phase II is expected by July/August 2011; of this, 300MW is based on regulatedreturn, and 300MW on merchant sales.
1,320MW of Sasan UMPP likely to be commissioned by FY12Land for the main plant area is now almost completely available with the company,while land acquisition for mine is underway. Management is hopeful of commissioning1st unit of project from Dec-11, and 2nd unit by Mar-12. The entire project will becommissioned by Mar-13.The company has also initiated evaluation of mining equipment for mine development.Orders are likely to be placed soon.
50% of Chitrangi power could be kept under merchant basisOf the planned capacity addition of 4GW at Chitrangi, ~1.2GW has been sold toMadhya Pradesh SEB at levelised rate of Rs2.45/unit. It plans to further bid additionalcapacity under Case 1 bidding.The company has applied for linkages for the project separately, and will have ~10-11m tons from coal blocks allotted for Sasan UMPP. Management expects to achievefinancial closure for the project by end 2010 and targets to commission 1st unit byDec-12.
Company Represented By:Mr S Kasturi,Additional Vice President - IR
Covering Analyst(s):Satyam Agarwal+91 22 3982 [email protected]
Nalin Bhatt+91 22 3982 [email protected]
50August 3 - 5, 2009
5th Annual Global Investor Conference
Rural Electrification Corporation
Key Takeaways
With cumulative sanctions of >Rs1,000b in last three years, loan growth outlook fornext couple of years remains robust (25% growth sustainability).Incremental spreads would be sustained at 2.75-3% vs current spreads at 3.5%.Higher spreads currently are function of favorable ALM mismatches.Considering the escrow mechanism and emerging cash profile of SEBs, chances ofNPAs remain low in management's view. Government's thrust on improving financialhealth of SEBs augurs well for long term outlook.Rs70b of low cost 54EC bonds (average rate of 5.5-6%) are maturing in FY10. Tothat extent, there would be upward pressure on cost of funds as a large part ofthese bonds get replaced by commercial borrowings. However, as Rs78b of loansare expected to get reset upwards by at least 250bp in 2HFY10, the impact wouldbe managed. Rs120b of loans are subject to reset clause in FY11 and managementexpects the upward revision to be at least 200bp.The management is optimistic of getting approval from government of India forcapital raising in FY10. The extent of dilution by the government and mode of capitalraising remain uncertain. Including accumulated DTL, REC's Tier I stands at 12%+.The management intends to diversify its borrowings profile to sustain the businessmodel. ECBs are being actively considered.
Valuation and viewREC delivered EPS (pre DTL provision) of Rs16 in FY09 and BV (including accumulatedDT liability) was Rs83 as of March 2009. RoA was 3% and RoE 21%.Stock trades at 2.4x FY09 BV and 12x FY09 EPS. We have no rating on the stock.
Company Represented By:Mr D S Ahluwalia,GM Finance and Accounts
Covering Analyst(s):Ajinkya Dhavale+91 22 3982 [email protected]
Alpesh Mehta+91 22 3982 [email protected]
Bloomberg RECL INEquity Shares (m) 858.7CMP (Rs) 188Mcap (US$ b) 3.552 W Range 208 / 531, 6, 12 Rel Per 9 / 58 / 102
YEAR NET INCOME Adj PAT EPS EPS P/E P/RBV ROE ROA P/ADJ BV
END (RS M) (RS M) (RS) GROWTH (%) (X) (X) (%) (%) (X)
3/06A 9,055 6,236 8.0 -20.3 24.7 3.7 15.7 2.3 3.73/07A 11,113 7,766 9.9 24.5 19.8 3.8 17.4 2.3 3.23/08A 14,740 9,376 10.9 9.8 18.0 3.2 17.1 2.4 2.73/09A 20,439 14,117 16.4 50.6 12.0 2.7 21.2 2.9 2.4
ABV includes DTL, P/RBV is BV excluding DTL. PAT, EPS, RoA and RoE are before DTL provision
51August 3 - 5, 2009
5th Annual Global Investor Conference
SBI Life
Key Takeaways
Management objective remains to be the largest private life insurance company inIndia. In 1QFY10, SBI Life has emerged as the largest private life insurance companyin terms of new business premiums.The management remains confident that life insurance business in India can sustain15% growth for a couple of years more at least, considering the under penetrationand higher savings rate.The management believes that most of the physical infrastructure expansion (SBILife increased branches from 207 in June 2008 to 490 in June 2009) is done andimprovement in efficiency would drive growth going forward.Currently, 85% of SBI group branch network of 16,000 sell SBI Life products.However, the efficiency is below target for >80% of these branches. The managementbelieves the group's low-cost model of bancassurance would ensure superiorprofitability.Low persistency remains an area of concern. In FY09, persistency at <45% wasone of the lowest in the industry and significantly below management's target of70%. Management attributes this to collection inefficiency and lower focus in past.With increased efforts on improving renewal collections, management aims toimprove this to ~70% over next couple of years.The recently announced cap on charges for ULIP products would lead to refiling ofmore or less all the products. Management believes it would certainly have impacton overall business profitability for all the players but quantifying the same is difficultat this point of time.
Company Represented By:Mr Abhijit Gulanikar, CIOMr Kedar Patki, Finance Controller
Covering Analyst(s):Ajinkya Dhavale+91 22 3982 [email protected]
Alpesh Mehta+91 22 3982 [email protected]
52August 3 - 5, 2009
5th Annual Global Investor Conference
Shree Renuka Sugars
Key Takeaways
Outlook on sugarShree Renuka Sugars (SRSL), estimates FY10 domestic sugar output will rise 15%YoY to 17.5m tons against 15.25m tons in FY09 and sugar consumption will rise to23m tons in FY10 from 22.5m tons in FY09. SRSL believes alcohol production islikely to rise to 1.75b liters from 1.5b liters, an increase of 17% YoY.SRSL is likely to benefit with inventory gains from India's sugar-deficit situation inFY10. SRSL has contracted for more than 1m tons of raw sugar, to be used until3QFY10, at lower than current international prices, which will allow it to reap thebenefits of inventory gains.
Sugar refining business to boost growthSRSL has the largest raw sugar refining capacity and is best placed over next twoyears as India needs to import raw sugar to tide over the shortage.SRSL announced expansion plans to expand its capacity at Athani, Karnataka, from1,000tpd to 2,000tpd and set up sugar refining capacity of 1000tpd at Havalga inKarnataka. The plants are due to be commissioned by December 2009.After the expansion, SRSL's sugar refining capacity will rise to 6,000tpd in FY10 andmight increase to 9,000tpd in FY11.The management indicates sugar production is likely to climb to 1.75m tons in FY10and 2.15m tons in FY11 v/s 1.03m tons in FY09 boosted by raw sugar output, whichis due to rise to 1.2m tons in FY10 and 1.4m tons in FY11 from 0.65m tons in FY09.
Renewable business seen risingSRSL's ethanol production capacity is likely to rise to 375m liters in FY10 from 250mliters in FY09 and ethanol production to climb to 1,230KLP in FY10 from 930KLPD, arise of 32% YoY.SRSL's power capacity is likely to rise to 173MW in FY10 and 233MW in FY11 from143MW in FY09.SRSL signed an MoU with Hindustan Petroleum Corp (HPCL) to form a JV, in whichSRSL will hold 74%. The venture will set up an integrated sugar and ethanolproduction facility (300klpd) in September 2009.
Valuation and viewSRSL is relatively better placed than its peers largely due to its presence in the southernregion, low leverage and high contribution from value-added business. Not rated.
Company Represented By:Mr Narendra Murukumbi,MD and CEOMr Gautam Watve,Head - Strategy and Planning
Covering Analyst(s):Siddharth Bothra+91 22 3982 [email protected]
Mansi Trivedi+91 22 3982 [email protected]
YEAR NET SALES *PAT *EPS EPS P/E P/BV ROE ROCE EV/ EV/
END (RS M) (RS M) (RS) GROWTH (%) (X) (X) (%) (%) SALES EBITDA
3/05A 7,955 561 2.3 - 47.7 27.3 142.0 93.1 3.4 31.83/06A 11,047 1,205 4.9 114.6 22.2 8.5 63.2 36.0 5.2 36.03/07A 9,506 830 3.3 -31.1 32.3 6.1 22.4 12.1 6.3 45.73/08A 21,143 1,181 5.5 64.3 19.7 6.6 21.4 15.2 3.0 25.0
Bloomberg SHRS INEquity Shares (m) 316.9CMP (Rs) 187Mcap (US$ b) 1.252 W Range 189 / 411, 6, 12 Rel Per 26 / 74 / 34
*Adjusted

53August 3 - 5, 2009
5th Annual Global Investor Conference
Shriram Transport Finance
Key Takeaways
Management might maintain surplus liquidity for one or two quarters more untileconomic recovery becomes sustainable and visible.Core margins/spreads are expected to improve from FY09 level of 7.2% due to(i) lower cost of funds since the company is a wholesale borrower, (ii) the possibilityof an up-tick in loan growth (linked to economic revival), and (iii) lower elasticity ofyield on loans, given its niche area of operation.Risk of delinquencies and higher credit cost due to the improving macro economicsituation, in turn improving the financial health of borrowers.AUM CAGR of 68% over FY05-09 will slow as new CV sales are expected to remainsluggish and the base has broadened. But STF maintains 15-20% growth for FY10driven mainly by the used-CV business.
Valuation and viewWe expect the company to report EPS of Rs34 and Rs42 in FY10 and FY11 respectively.BV will be Rs145 and Rs179.Return ratios will remain superior of over 2.7% and over 26% over FY10-11.The stock trades at a P/E of 9.3x FY10E and P/E of 7.4x FY11E and P/BV of 2.2xFY10E and P/BV of 1.8x FY11E. Maintain Buy with a target price of Rs358.
Company Represented By:Mr Sanjay Mundra, VP IR
Covering Analyst(s):Ajinkya Dhavale+91 22 3982 [email protected]
Alpesh Mehta+91 22 3982 [email protected]
* Valuation multiples are adjusted for SBI Life's value
Bloomberg SHTF INEquity Shares (m) 203.5CMP (Rs) 310Mcap (US$ b) 1.352 W Range 357 / 1501, 6, 12 Rel Per -9 / -11 / -6
YEAR NET INCOME PAT EPS EPS P/E P/BV CAR ROE ROA P/ABV
END (RS M) (RS M) (RS) GROWTH (%) (X) (X) (%) (%) (%) (X)
3/08A 12,124 3,898 19.2 85.6 16.1 3.5 13.6 27.4 2.7 3.63/09A 17,535 6,124 30.1 56.8 10.3 2.8 19.2 30.3 2.8 2.83/10E 21,354 7,078 33.5 11.2 9.3 2.1 15.3 26.5 2.7 2.23/11E 26,793 8,894 42.0 25.6 7.4 1.7 15.0 25.9 3.0 1.8
54August 3 - 5, 2009
5th Annual Global Investor Conference
Simplex Infrastructure
Key Takeaways
Order intake target of Rs80-100b in FY10Order inflow in FY10 is expected to improve substantially over FY09. During FY10Simplex is targeting order intake of Rs80-100b (up 60-100% YoY) against Rs50b inFY09. This will translate into an FY10 order book of Rs130-150b. The managementis targeting revenue of Rs55b (over 17.5% YoY) in FY10.Order inflow improved from July 2009 (Rs4.6b), indicating an improved environmentcompared with the past two to three quarters. We understand that after September-October 2009 orders with better profitability are expected.While the order intake in 1QFY10 is low, L1 has increased to Rs18.7b (againstRs10b in 4QFY09). The order pipeline also improved in the past three months. Bidspending for Simplex improved from Rs260b in 4QFY09 to Rs320b 1QFY10, excludingpre-qualified projects. Pipeline improved in the Middle East, where it increasedfrom Rs70b to Rs130b.During FY10 order inflow growth in the domestic market will be driven by segmentssuch as power, urban infrastructure, buildings and housing and industrials. Powerorders from the private sector have improved as well.The order book has 60% of private projects against 70% at the start of FY09.
Capex benefits to kick in; EBITDA margins to expand in 12-18 monthsWe understand EBITDA margins are likely to improve in the next 12-18 months by100-150bp. This will be driven mainly by (1) full benefit of higher capex incurred inFY08 and FY09 (Rs8b) and (2) benefits from a reduction in low-margin contracts inthe order book.Return ratios are expected to improve as well since equipment is expected to attainoptimal utilization. The fixed asset return for Simplex is likely to improve to 5-6xfrom 3.8x in FY09.
Valuation and viewWe expect FY10 EPS at Rs36 (up 35%YoY) and FY11 EPS of Rs44 (up 22%YoY). At CMP,the stock is trading at PER of 10.7xFY10E and 8.8xFY11E. Maintain Buy with a pricetarget of Rs439/sh (based on 10xFY11E earnings).
Company Represented By:Mr Amitabh Mundhra, Director
Covering Analyst(s):Satyam Agarwal+91 22 3982 [email protected]
Shridatta Bhandwaldar+91 22 3982 [email protected]
YEAR NET SALES PAT EPS EPS P/E P/BV ROE ROCE EV/ EV/
END (RS M) (RS M) (RS) GROWTH (%) (X) (X) (%) (%) SALES EBITDA
3/08A 28,121 1,021 20.6 65.5 18.7 2.5 19.8 18.1 0.9 9.5
3/09A 46,888 1,324 26.8 29.7 14.4 2.0 15.7 17.0 0.6 7.0
3/10E 55,123 1,786 36.1 34.9 10.7 1.9 18.4 18.1 0.5 5.6
3/11E 61,963 2,173 43.9 21.6 8.8 1.6 19.6 19.3 0.5 5.0
Bloomberg SINF INEquity Shares (m) 49.5CMP (Rs) 383Mcap (US$ b) 0.452 W Range 497 / 1021, 6, 12 Rel Per -13 / 108 / -24
55August 3 - 5, 2009
5th Annual Global Investor Conference
Sintex Industries
Key Takeaways
Reiteration of FY10 guidanceSintex reiterated its FY10 guidance of 5-10% topline growth and 20-25% bottomlinegrowth.
Monolithics and pre-fabs to sustain FY10 revenue growthIn 1QFY10 revenue from monolithics was Rs930m, almost flat YoY. This is mainly due tospillover of business into subsequent quarters. Thus, for the full year FY10, Sintexexpects monolithics revenue of Rs7.5b, up from Rs4.5b in FY09. Order book is healthyat Rs18b. Even after significant drawdown in FY10 Sintex expects to maintain book-to-bill of 2x by the end of the year or order book of Rs15b.
The pre-fab structures business was weak in 1QFY10 at Rs880m down from Rs1,380min 1QFY09. This was mainly because: (1) lower government business due to the electionsand (2) passing on of lower raw material prices. Sintex expects this business to pick upstrongly subsequently and to end the year with 15-20% volume growth.
Subsidiaries - a mixed bagSintex's US subsidiary, Wausaukee Composites, makes plastic composite componentsprimarily for industrial trucks, tractors and windmills, all of which are facing a slowdown.Sintex's French subsidiary, Nief, caters to auto, electricals, aerospace, defense and themedical equipment sectors. It has lowered its exposure to auto, and extended its presenceto Hungary and Tunisia. Thus its performance is expected to be less weak thanWausaukee's.
Indian subsidiaries Zeppelin and Bright Brothers are expected to grow 15%. Zeppelin isa beneficiary of recovery in the base telecom shelter business, and Bright has addednew clients and commissioned a Rs210m unit for 'under-the-hood' components. By theend of 2009 it will also commission a unit to supply electrical components to Schneider,Germany.
US$10m investment in Geiger to be written offSintex made an initial payment of 7m euro (US$10m) towards the acquisition of Geiger,Germany, which has since gone into liquidation. As a result, Sintex will write off theamount. The timing and the exact accounting treatment of the amount will be decidedshortly.
Valuation and viewWe estimate Sintex to record FY09-11 EPS CAGR of 14% with RoE of 17-19%. The stocktrades at 8.6x FY10E EPS of Rs23.2 and 7x FY11E EPS of Rs31.1. We maintain Buy witha target price of Rs232 (10x FY10E EPS).
Company Represented By:Mr Sunil Kanojia, Group PresidentMr Rajiv Naidu, Head - IR & PR
Covering Analyst(s):Shrinath Mithanthaya+91 22 3982 [email protected]
YEAR NET SALES PAT EPS EPS P/E P/BV ROE ROCE EV/ EV/
END (RS M) (RS M) (RS) GROWTH (%) (X) (X) (%) (%) SALES EBITDA
03/08A 22,978 2,170 16.0 35.5 21.5 14.7
03/09A 31,356 3,251 24.0 49.9 8.9 1.6 19.8 12.3 1.1 6.7
03/10E 35,398 3,141 23.2 -3.4 8.6 1.4 17.3 14.0 1.0 6.1
03/11E 41,058 4,212 31.1 34.1 6.9 1.2 18.6 15.8 0.8 4.6
Bloomberg SINT INEquity Shares (m) 135.5CMP (Rs) 213Mcap (US$ b) 0.652 W Range 386 / 701, 6, 12 Rel Per -17 / 10 / -48

56August 3 - 5, 2009
5th Annual Global Investor Conference
State Bank of India
Key Takeaways
Worst is behindFor FY10, management believes that 20-22% loan growth is possible with a possibleupside of 24-25% (vs 23% in 1QFY10). Deposit growth may continue to outpaceloan growth (36% in 1QFY10) given rapid branch expansion and customer acquisition.If the loan growth does not pick up in 2HFY10, then the management will moderateits strategy of deposits growth.Traction in CASA growth (up 23% YoY in 1QFY10, highest among PSU banks) wouldcontinue as branch expansion and marketing efforts are yielding the desired results.Margins are expected to gradually expand to ~2.7% by end of FY10 from 2.3% in1QFY10 as benefit of deposit repricing continues, loan growth picks up and loanyields firm up.Deposits of Rs730b (~10% of total) will come up for repricing/repayment in the restof FY10. These deposits carry a cost of 9%+ and are expected to get re-priced200bp lower.Fee income growth momentum is seen sustaining at a pace higher than loan growth.Gross NPAs would be contained at sub 3% (2.8% as of June 2009) and net NPAs at~1.6%. The management is aiming to improve provision coverage which remainsone of the lowest at 45% as of June 2009. Any surplus profits would be deployed toincrease NPA provisions as was done in 1QFY10.FY10 PAT is seen at ~Rs110b at least, up 21% from FY09 level.
Valuation and viewWe expect SBI to report consolidated EPS of Rs211 in FY10 and Rs255 in FY11.Consolidated BV is expected to be Rs1,316 in FY10 and Rs1,527 in FY11. ConsolidatedABV is expected to be Rs1,205 in FY10 and Rs1,391 in FY11.Adjusted for value of SBI Life, the stock trades at 1.4x FY11E consolidated ABV and1.3x FY11E consolidated ABV.Over FY10-11, RoA and RoE are expected to be strong at ~1% and 16%+, respectively.We maintain Buy with a target price of Rs2,190 (1.5x FY11E consolidated ABV +Rs100 for insurance).
Company Represented By:Mr S S Ranjan, Deputy MD & CFOMr C Ramnath, Chief GMMr Sunil Damodar, GM
Covering Analyst(s):Ajinkya Dhavale+91 22 3982 [email protected]
Alpesh Mehta+91 22 3982 [email protected]
YEAR NET INCOME PAT EPS CONS. CONS. P/BV CONS. CAR ROE ROA
END (RS M) (RS M) (RS) EPS (RS) P/E (X) (X) P/ABV (X)* (%) (%) (%)
3/08A 257,162 67,291 106.6 141.9 12.3 2.2 2.0 13.0 16.8 1.0
3/09A 335,639 91,212 143.7 178.4 9.8 1.9 1.7 14.3 17.1 1.1
3/10E 372,488 101,013 159.1 211.2 8.3 1.7 1.4 12.6 16.3 1.0
3/11E 457,739 118,815 187.1 255.4 6.8 1.5 1.3 12.5 16.9 1.0
Bloomberg SBIN INEquity Shares (m) 634.9CMP (Rs) 1,845Mcap (US$ b) 24.652 W Range 2040 / 8921, 6, 12 Rel Per -2 / -6 / 11
* Valuation multiples are adjusted for SBI Life's value

57August 3 - 5, 2009
5th Annual Global Investor Conference
Sterlite Industries
Key Takeaways
Strong growth in metal, powerAluminum capacity will increase at 30% CAGR to 1.1mt a year by FY13.Zinc-lead capacity will increase at 31% CAGR to 1.1mt a year by FY11.Power capacity will rise 53% CAGR to 5,536MW by FY12.
Copper: Proposed acquisition of AsarcoThe agreed offer price is $1.87b of which US$1.1b will be paid in cash and $770m will
be paid as secured non-recourse non-interest-bearing promissory notes payableover nine years, linked to copper-price movements.There are opportunities to cut the price of copper production after the acquisition ofAsarco. The cost of mining is $1.05/lb and smelting costs are 30 cents/lb.The decision is expected in mid-August. Though two suitors have submitted competingproposals, only Sterlite's offer has the support of workers' unions and creditors.
Power: Ordering soon for 3960MWThe US$1.9b, 2,400MW project's first unit of 600MW has coal linkages and is expectedto be commissioned by December 2009. The group is working on securing interimcoal linkages for three units until captive coal mines (112m tons of reserves) start.Sterlite will soon order SEL Talwandi Sabo 1980MW at a capex of $2.1b and VAL's1,980MW CPP in Jharsuguda at a capex of $2b to feed the 1.25mt-a-year aluminumsmelter.
Call option: Balco in arbitrationA couple of hearings are pending for arbitration on BALCO's call option. Thereafterthe call option on Hindustan Zinc will be excercised.
Bauxite: delays foreseenBauxite mining in Nyamgiri hills is expected to start by the end of the year becausea few statutory permissions are still pending. The company does not envisageresistance from locals because several of them hare employed at the alumina refineryat Lanjigarh. But the continued protest by some people in Britain might delay theproject because the external affairs ministry is now involved in the matter.
Valuation and viewWe believe a strong pipeline of growth projects in aluminum, zinc and energy andstronger metal prices will drive earnings growth. Rich mineral resources of zinc, bauxiteand coal and cost leadership present Sterlite with a unique advantage. The company ismuch ahead in project execution compared with its peers. The stock is trading at P/BVof 1.5xFY10E. Maintain Buy.
Company Represented By:Mr Sumanth Cidambi, IRMs Sheetal Khanduja, IR
Covering Analyst(s):Sanjay Jain+91 22 3982 [email protected]
YEAR NET SALES PAT EPS EPS P/E P/BV ROE ROCE EV/ EV/
END (RS M) (RS M) (RS) GROWTH (%) (X) (X) (%) (%) SALES EBITDA
3/08A 247,243 43,581 61.5 -23.4 11.1 2.2 19.5 21.2 1.6 7.6
3/09A 215,233 33,141 46.8 -24.0 14.6 1.9 13.0 10.1 2.0 11.8
3/10E 174,334 26,806 31.9 -31.8 21.3 1.6 7.5 4.8 2.7 16.7
3/11E 203,201 32,730 41.0 28.4 16.6 1.5 8.9 5.7 2.2 10.3
Bloomberg STLT INEquity Shares (m) 708.5CMP (Rs) 681Mcap (US$ b) 10.152 W Range 740 / 1651, 6, 12 Rel Per 2 / 83 / 11
Consolidated

58August 3 - 5, 2009
5th Annual Global Investor Conference
Sun Pharmaceuticals
Key Takeaways
Domestic business, exports key profitability drivers; No clarity on Caraco issuesDomestic formulations business to revert to normalcy from 2QFY10: Mostof the domestic revenue fall due to excess supplies in 4QFY09 is reflected in the27% de-growth posted in 1QFY10. We believe the domestic formulations businessis the most profitable for Sun Pharma with GPM of more than 70%.No clarity on resolution of Caraco's US FDA problems: There is no clarity onthe timeline for resolution of the cGMP non-compliance issues faced by Caraco. Perthe consent decree provisions, Caraco will follow the pathway identified by lawyersfrom both sides based on which the US FDA may allow Caraco some relaxations.US pipeline gaining strength: Sun has a pipeline of 111 products pending approvalwith the US FDA including a combination of low-competition, patent challenge andnormal product opportunities. Of these, approvals for 25 products filed throughCaraco are unlikely to come through until the US FDA issues are resolved. But wenote that as a strategy most of the high-margin/Para-IV products have been filedfrom Sun's Indian facilities. This is likely to significantly temper the adverse impactof the US FDA action on profits from this product pipeline. We continue to be positiveon SPIL's US pipeline, which includes many low-competition/Para-IV products, froma long-term perspective.Non-US formulation exports grow: Sun's exports to about 30 emerging marketscontinue growing strongly, posting 40% CAGR over FY07-09. We believe this businessis expected to continue posting double-digit growth over the next two years. Thecompany plans to ramp-up its presence in the European generic markets by workingon complex products filed through its Indian facilities.No clarity on Taro acquisition: Management indicated the Israel Supreme Courtdirected Sun and Taro promoters to try for a re-negotiation of the proposed mergeragreement. However the two parties have been unable to reach any agreement.The Supreme Court has been informed and a judgment is awaited.
Valuation and viewAn expanding generic portfolio coupled with a changed product mix in favor of high-margin exports is likely to bring in long-term benefits for Sun. Key drivers for the futureinclude a ramp-up in the US (from Indian facilities), expected value unlocking by leveragingacquired companies (Able Labs & Valeant) and monetization the Para-IV pipeline alongwith sustained growth momentum for domestic formulations and non-US exports. Giventhe severity of the recent US FDA action on Caraco, we believe Sun Pharma's stockprice will remain muted until US FDA issues are resolved. Sun is valued at 20.6x FY10Eand 17.9x FY11E earnings (excluding Para-IV upsides which have a DCF value of Rs19/share). Maintain Buy.
Company Represented By:Mr Uday Baldota, VP - IRMs Mira Desai, General Manager
Covering Analyst(s):Nimish Desai+91 22 3982 [email protected]
YEAR NET SALES PAT EPS EPS P/E P/BV ROE ROCE EV/ EV/
END (RS M) (RS M) (RS) GROWTH (%) (X) (X) (%) (%) SALES EBITDA
03/09A* 42,723 18,177 87.8 22.2 13.5 3.8 31.7 33.1 5.1 11.603/10E 35,394 11,889 57.4 -34.6 20.6 3.3 17.1 16.8 5.8 18.103/10E* 41,582 15,911 76.8 -12.503/11E 40,295 13,647 65.9 14.8 17.9 2.9 17.1 17.0 4.9 14.8
Bloomberg SUNP INEquity Shares (m) 207.1CMP (Rs) 1,182Mcap (US$ b) 5.252 W Range 1600 / 9531, 6, 12 Rel Per -9 / -62 / -25
* Includes Para-IV upsides
59August 3 - 5, 2009
5th Annual Global Investor Conference
Suzlon Energy
Key Takeaways
Targeted revenue guidance calls for additional orders of 500MW by NovemberSuzlon maintained its revenue guidance of 2,400MW for FY10 (over 2,700MW inFY09). While the order book of 1,500MW is sufficient to achieve 1,900-2,000MW ofrevenue (assuming 700-800MW from domestic market); additional 500MW ofinternational orders will be needed by November to meet FY10 guidance.The additional orders of 500MW (international) are anticipated from small-executioncycle markets like Australia, Brazil, China and South Africa.Suzlon's management indicated the possibility of improving order intake afterSeptember-October 2009 due to various stimulus packages.
Realizations to be hit in FY10; multiple levers to cut costsWind turbine realizations are expected to fall 7-10% in FY10. This will be driven bya decline in commodity prices and increased competition/extra capacity. But a declinein costs will help to maintain profitability.We understand that in the WTG business other expenses were at Rs4.2b during1QFY10. The reported number of Rs2.9b was adjusted for Rs1.4b of forex gains.Due to expanded manufacturing capacity, supplies of turbines is now in better controland thus provisions for liquidated damages will be lower. Also, V-2 series havestarted approaching stabilization and the V-3 WTGs have stabilized, and thusprovisions on account of availability loss will be curtailed.
Hansen: to divest full/part stakeSuzlon's management maintained that the company is in the process of divestingfull/part stake in Hansen and has already appointed investment bankers. In FY09Suzlon divested 10% in Hansen for US$80m. This will help the company to reduceits balance sheet leverage. Suzlon's net debt is Rs138b.Suzlon's debt covenants entail maintaining consolidated net debt/EBITDA below 4xand will come up for retest in September 2009. A breach will entail increased costof debt.
Valuation and viewWe estimate consolidated EPS of Rs2.5 in FY10E (-59%) and Rs4.3 (+71%) in FY11E.Maintain Neutral with a target price of Rs78/sh based on 18x FY11E earnings.
Company Represented By:Mr Tulsi Tanti, CMDMr Samir Shah,Head - Corporate FinanceMr Nishit Dave,AGM - Corporate FinanceMr Jigar Kavaiya,Sr Executive - Corporate Finance
Covering Analyst(s):Satyam Agarwal+91 22 3982 [email protected]
Shridatta Bhandwaldar+91 22 3982 [email protected]
YEAR NET SALES PAT* EPS* EPS GR.* P/E* P/BV ROE ROCE EV/ EV/
END (RS M) (RS M) (RS) (%) (X) (X) (%) (%) SALES EBITDA
3/08A 136,794 12,607 8.0 33.2 11.6 1.7 21.7 15.3 1.2 8.2
3/09E 260,817 9,728 6.2 -22.8 15.1 1.6 11.6 12.1 1.0 9.8
3/10E 263,745 4,284 2.5 -58.8 36.5 1.5 4.7 7.4 1.0 11.4
3/11E 302,467 7,312 4.3 70.7 21.4 1.4 7.4 9.2 0.9 9.1
Bloomberg SUEL INEquity Shares (m) 1497.0CMP (Rs) 97Mcap (US$ b) 3.052 W Range 254 / 331, 6, 12 Rel Per -15 / 50 / -66
* Consolidated nos (fully diluted)
60August 3 - 5, 2009
5th Annual Global Investor Conference
Tata Consultancy Services
Key Takeaways
1QFY10 performance should not be extrapolatedIn US$ terms, TCS' revenues had grown 3.3% QoQ in 1QFY10.While the growth was not due to anything extraordinary, the management believesthat it should not be extrapolated, as:
Greater offshoring enabled clients to increase volumesSome 4QFY09 ramp-ups spilled over to 1QFY10, resulting in sequential growthSome M&A related integration work increased quarterly billing
Discretionary spend in BFSI is necessary to reach earlier growth rates.
Pricing concerns abated, previous guidance staysWhile pricing discussions have largely been concluded, individual discussions arestill on.Pricing guidance of single-digit decline in FY10 stays.
Employee additions on track, could spill over to FY11TCS has made 24,885 offers for FY10 and expects the additions to flow throughfrom 2QFY10.The company expects to add ~1,000 employees in 2QFY10 and the remaining in3&4QFY10 depending on volume growth.The company currently has capacity to train ~7,000 employees per quarter.In a situation where volume growth turns out to be muted, TCS could defer itsjoinees to FY11.
Margin maintenance possible, levers intactDespite impressive offshoring in the last few quarters, the management has indicatedthat there is further scope to offshore effort.The company believes that pricing will not deteriorate further and does not seemargin risk on the pricing front.Cost controls, which helped margins in 1QFY10, have further scope for rationalization.This provides comfort on sustainability of margins.
Other highlightsHedges at the end of 1QFY10
US$457m of revenue hedges with limited upside after Rs41/US$US$226m for FY10 and the US$230m for FY11/12
Valuation and viewWe expect a revival in revenue growth to 11% in FY11 after a 1% dip in FY10. EBITDAmargin should expand by 100bp in FY10 on better cost management and greateroffshoring. TCS trades at 17.4x FY10E and 16.7x FY11E EPS. Maintain Neutral.
Company Represented By:Mr Vish Iyer,CFO - Global OperationsMr Kedar Shirali,Director - IR
Covering Analyst(s):Ashwin Mehta+91 22 3982 [email protected]
Vihang Naik+91 22 3982 [email protected]
YEAR NET SALES PAT EPS EPS P/E P/BV ROE ROCE EV/ EV/
END (RS M) (RS M) (RS) GROWTH (%) (X) (X) (%) (%) SALES EBITDA
3/08A 228,614 50,191 25.5 20.8 20.3 8.1 46.5 46.2 4.3 16.5
3/09A 278,129 51,369 26.2 3.0 19.7 6.4 36.4 44.2 3.5 13.7
3/10E 285,408 58,250 29.8 13.4 17.4 4.9 32.1 36.6 3.4 12.5
3/11E 304,783 60,754 31.0 4.3 16.7 4.1 26.7 30.3 3.0 11.7
Bloomberg TCS INEquity Shares (m) 1957.2CMP (Rs) 530Mcap (US$ b) 21.852 W Range 545 / 2081, 6, 12 Rel Per 26 / 45 / 21
61August 3 - 5, 2009
5th Annual Global Investor Conference
Tata Steel
Key Takeaways
20% volume growth in FY10 to drive India operationsVolume growth of 20% YoY to 6.36m tons in FY10 will drive the company's Indiaoperations.Margins will expand due to production cost cuts of US$30/ton because of lowercoking-coal prices in subsequent quarters.Steel-making capacity will expand to 10mt a year by March 2011. The facilities willinclude an 'I' blast furnace, LD shop, a thin slab caster, 2.4mt a year rolling mill,1.4mt a year new coke ovens, a 6mt a year pelletization plant and augmenting ofexisting mines.
Higher demand outlook, cost cuts in Corus to drive earningsDemand for Corus' steel products began to improve in July. The demand recoverywill be more visible in the next couple of months.Corus has undertaken cost cutting initiatives-1,200 jobs were cut, reducing manpowerto 40,700 in March 2009. The company will cut 8,000 more jobs by March 2010.Fixed-cost cuts of 763m pounds are expected in FY10, giving a non-recurring amountof only 10-15%.The fit-for-future program is expected to yield 300-350m pounds of permanentannual savings.Corus' pension fund has a corpus of 9b pounds. The fund has been significantly de-risked and had a surplus of 600m pounds in March 2009. The fund reduced itsexposure to equity to 32% from 50%.The debt covenant reset package requires Tata Steel, the parent company to inject425m pounds into Tata Steel Europe in a phased manner, of which about 200mpounds will be used to prepay debt and de-leverage the European balance sheet.
Raw material self sufficiency to rise from 25% to 50%Tata steel has 35% stake in a JV project with Riversdale. One tenement has inferredreserves of 4b tons of coal in Mozambique.Another JV with New Millennium Capital in Canada, has 100m tons of iron ore. TataSteel has the option to acquire 80% in a direct shipping ore (DSO) project in Canadaand a South African iron ore mining project.
Valuation and viewWe believe the earnings outlook for the India operations is robust and demand recoveryin Europe may turn positive for Corus. But Corus will still have to struggle with issueslike Teesside because complete closure is not an easy option and there will be a longerwait for its break even. Investments in iron-ore mines and coal assets abroad willincrease raw material security and improve margins in the coming years. Neutral.
Company Represented By:Mr Praveen Sood, IRMs Debashree Sarkar, IR
Covering Analyst(s):Sanjay Jain+91 22 3982 [email protected]
YEAR NET SALES PAT EPS EPS P/E P/BV ROE ROCE EV/ EV/
END (RS M) (RS M) (RS) GROWTH (%) (X) (X) (%) (%) SALES EBITDA
3/08A 1,315,359 77,404 87.2 24.2 5.4 2.6 48.4 15.1 0.6 4.6
3/09A 1,473,130 90,610 102.1 17.1 4.6 3.2 68.2 14.6 0.6 4.9
3/10E 1,021,186 39,079 44.0 -56.9 10.7 2.7 25.2 9.3 0.9 7.1
3/11E 1,117,851 70,864 79.9 81.3 5.9 2.3 38.0 12.5 0.8 5.6
Bloomberg TATA INEquity Shares (m) 822.0CMP (Rs) 473Mcap (US$ b) 8.252 W Range 695 / 1381, 6, 12 Rel Per 6 / 85 / -36
Consolidated

62August 3 - 5, 2009
5th Annual Global Investor Conference
Time Technoplast
Key Takeaways
FY10 guidanceTime Technoplast has guided for FY10 topline growth of 20-25% and 20% EBITDAmargin.
Focus on industrial packaging, infrastructure productsTime Technoplast (TTL) is present in five verticals (% of FY09 revenue in brackets):industrial packaging, mainly drums and conipails (60% of FY09 revenue), auto components(8% of FY09 revenue), lifestyle products including plastic furniture and mats (9% ofFY09 revenue), healthcare products, mainly disposable syringes (3% of FY09 revenue)and infrastructure including VRLA batteries, and construction safety nets (20% of FY09revenue). TTL plans to focus on industrial packaging and infrastructure.
For industrial packaging TTL plans to add two new units, one each in Kolkata, to becommissioned in FY10, and Ahmedabad, to be commissioned in FY11. It is also settingup a unit in Tianjin, China with an initial investment of $10m, to be commissioned by theend of FY10.
In infrastructure TTL is expanding its battery capacity. It is also adding two new productssuch as HDPE pipes and pre-fabricated shelters to its product portfolio. A Rs250m HDPEpipe unit was commissioned in Silvassa in 4QFY09 and a Rs300m pre-fabricated shelterunit in Silvassa is due for commissioning in 2QFY10.
Plastic-based material handling systems JV: In June 2009 TTL formed a 50.1:49.9JV with Dutch group Schoeller Arca Systems (SAS) for plastic-based material handlingsolutions and systems (large foldable containers, pallets and crates). The end users aresectors like FMCG, retail, processed food, pharmaceuticals and consumer durables.The initial project cost is 10m euro. To begin with the JV will focus on marketing andsource its products from TTL.
Futuristic products: Several futuristic products a re in the pipeline. These include:(1) LPG and CNG cylinders based on composite material (2) Sound barriers for flyovers,elevated roads and rail networks and (3) Fuel cells that generate electricity from fuelssuch as hydrogen, natural gas and methanol.
Rs1b FY10 capex; funding from internal accrualsTTL's planned FY10 capex is Rs1b, to bwe used mainly for packaging (Rs440m), pre-fabricated shelters (Rs150m) and batteries (Rs100m). In March 2009, TTL had Rs450min cash. This as well as internal accruals will fund the capex. TTL plans to repay someof its Rs3b debt.
Company Represented By:Mr Anil Jain, MD
Covering Analyst(s):Shrinath Mithanthaya+91 22 3982 [email protected]
YEAR NET SALES PAT EPS EPS P/E P/BV ROE ROCE EV/ EV/
END (RS M) (RS M) (RS) YOY (%) (X) (X) (%) (%) SALES EBITDA
03/06A 2,624 245 3.1 18.3 14.7
03/07A 3,987 403 2.4 -24.0 23.9 18.9
03/08A 6,816 737 3.5 48.5 31.2 24.7
03/09A 7,898 690 3.3 -6.3 6.1 0.9 17.7 18.8 0.9 4.4
Bloomberg TIME INEquity Shares (m) 209.3CMP (Rs) 44Mcap (US$ b) 0.252 W Range 79 / 181, 6, 12 Rel Per 6 / 49 / -46

63August 3 - 5, 2009
5th Annual Global Investor Conference
Titan Industries
Key Takeaways
Watch volumes rebound after Sonata restockingWatch volume growth is likely to be fairly robust, driven by increasing penetration,faster replacement and dual ownership.Watch sales have been impacted in Mumbai, Pune and Ahmadabad but demand hasbeen strong in Tier-II and Tier-III cities.Watch volumes fell 9% in FY09 largely led by a decline in the Sonata brand due tode-stocking. De-stocking was required because of excess inventory collected by thetrade during a high inflationary environment.Tax benefits from the Baddi unit fell from 100% to 30%. Next year the Deharadununit will also move to a 30% tax rebate area from a tax free area.
High gold prices, consumer sentiment put jewelry business under pressureJewelry volumes fell 15% in 1QFY10 as high gold prices impacted demands. Besides,higher overheads due to the commissioning of new stores impacted margins.
The company moved to the FIFO method of inventory valuation, which overstatedprofits by Rs300m in 1QFY10. The management believes this method better reflectsprofitability as hedge accounting will become compulsory from next year.The company is moving to large-format stores in metros based on the hub-and-spoke model. This will help the company cater to the large marriage jewelry marketwhere Tanishq has a low market share.Volume shrinkage is declining, demand expected to improve from the festival season.
Eyewear offers potential; first-mover advantage to payTitan increased the number of its Titan Eye+ stores to 77, including 21 company-operated stores. It has 30% of its own brands and 15 more brands. The companyforesees big potential in this segment with gross margins in this business equal tothe watch business. The number of stores is expected to rise to 225-250 withexpected breakeven in three years.Titan is setting up a lens manufacturing facility (Rs100m) to cut dependence onoutsourcing. This will enable quality control and backward integration.
Slowdown hits Precision EngineeringThe division has felt the impact of the global slowdown, especially in the aerospace andautomotive sectors, to which it has direct exposure. The company is exploring divestmentand a tie-up with other players for part of the business in the next 12-18 months.
Valuation and viewWe estimate 13% EPS CAGR over FY09-FY11. The stock trades at 26.7xFY10E EPS ofRs45.3 and 20.9xFY11E EPS of Rs57.6. Maintain Neutral.
Company Represented By:Mr Bhaskar Bhat,Managing DirectorMr K F Kapadia,Executive VP FinanceMr S Ravi Kant, COO, Eyewear
Covering Analyst(s):Amnish Aggarwal+91 22 3982 [email protected]
Amit Purohit+91 22 3982 [email protected]
YEAR NET SALES PAT EPS EPS P/E P/BV ROE ROCE EV/ EV/
END (RS M) (RS M) (RS) GROWTH (%) (X) (X) (%) (%) SALES EBITDA
03/08A 29,937 1,483 33.4 25.5 36.1 11.7 34.0 30.7 1.8 21.0
03/09A 38,034 2,056 46.3 38.6 26.0 9.3 37.5 34.2 1.4 16.8
03/10E 43,553 2,005 45.2 -2.5 26.7 7.1 27.8 32.3 1.2 15.1
03/11E 50,904 2,556 57.6 27.5 20.9 5.6 28.1 33.9 1.0 12.2
Bloomberg TTAN INEquity Shares (m) 42.3CMP (Rs) 1,204Mcap (US$ b) 1.152 W Range 1,375 / 6651, 6, 12 Rel Per -16 / -21 / -11
64August 3 - 5, 2009
5th Annual Global Investor Conference
Union Bank of India
Key Takeaways
Decline in cost of deposits to drive margin expansionManagement expects margin to reach ~3% in FY10 (2.3% in 1QFY10) on the backof:1) expected higher loan offtake, 2) amount parked in liquid MF (Rs45b on anaverage during 1QFY10) getting used for loan growth (yield on this funds is ~5.5%vs loan yield of 10.3%), and 3) repayment/re-pricing of bulk depositsIn 1QFY10, fees grew 42% YoY to Rs2.7b led by higher processing fees. Themanagement expects strong traction in fee income to continue.Loan book is expected to grow 25% YoY led by agriculture, SME and retail. UnionBank already has ~Rs110b fund-based sanctions in hand.Deposit growth is expected to be 23% and focus will continue to grow core retailterm deposits and improve share of CASA ratio. CASA ratio is targeted to be 35%by FY12.The management expects cost of term deposits to decline ~85bp by December2009. Large part of the high cost deposits is likely to mature in 2Q and 3QFY10.Union Bank has ~Rs490b of corporate loan portfolio with 337 accounts havingexposure above Rs500m. Of these, 236 accounts with exposure of Rs285b arealready rated, and further rating of corporates is likely to improve CAR.The bank has licenses in hand for 500 branches which it expects to open in FY10.This will help to improve core retail deposits growth.Total restructuring based on borrower-wise comes to Rs55b (5.7% of the loanbook). The management guided for maximum slippage ratio of 1.5% and GNPAratio of 1.75% by the end of FY10.
Valuation and viewWe expect the bank to report EPS of Rs40 in FY10 and Rs48 in FY11.BV is expected to be Rs172 in FY10 and Rs211 in FY11. We expect RoA to sustain at1.2% and RoE at 25%+.UNBK trades at 4.8x FY11E EPS and 1.1x FY11E BV. We maintain Buy with a targetprice of Rs275 (1.3x FY11E BV).
Company Represented By:Mr M V Nair, CMDMr N S Mehta, CFO
Covering Analyst(s):Ajinkya Dhavale+91 22 3982 [email protected]
Alpesh Mehta+91 22 3982 [email protected]
YEAR NET INCOME PAT EPS EPS P/E P/BV CAR ROAE ROAA P/ABV
END (RS M) (RS M) (RS) GROWTH (%) (X) (X) (%) (%) (%) (X)
3/08A 41,733 13,870 27.5 64.1 8.4 2.1 12.5 26.8 1.22 2.1
3/09A 52,961 17,266 34.2 24.5 6.7 1.6 13.3 27.2 1.21 1.7
3/10E 59,050 20,160 39.9 16.8 5.8 1.3 12.6 25.6 1.15 1.4
3/11E 71,282 24,249 48.0 20.3 4.8 1.1 12.1 25.1 1.18 1.2
Bloomberg UNBK INEquity Shares (m) 505.1CMP (Rs) 230Mcap (US$ b) 2.452 W Range 266 / 1131, 6, 12 Rel Per -15 / -18 / 48
65August 3 - 5, 2009
5th Annual Global Investor Conference
Unitech
Key Takeaways
Fund raising combats solvency riskUnitech has recapitalized its balance sheet in the last few months by (1) successfullyraising US$900m equity through two QIP issues, and (2) asset sale of ~Rs10b. Thishas significantly lowered solvency risk for the company. Post QIP II, Unitech's netdebt has reduced to Rs70b during 1QFY10 while net debt stands at Rs50b; net debtequity is comfortable at 0.5x.
Core business witnessed strong tractionSince March 2009, the company has launched ~17msf of residential projects inGurgaon, Chennai, Mohali, Kolkata and Mumbai and sold ~6.9msf (~4msf in NCR,~1.4msf in Chennai and ~1.4msf in other cities).This is in line with Unitech's targeted launch plan of ~30msf across 15 cities andsales of ~20msf in FY10. It is likely to commence construction on ~6.9msf in FY10,which are likely to be delivered over the next 2-3 years.
Aggressive launch plans for the affordable housing verticalUnitech has aggressive plans to launch projects in the affordable housing segment,comprising standardized units of 500-1,000sf each, priced at Rs1m-3m/unit underthe brand name, Unihomes. Unitech plans to launch 8-9msf of affordable housingprojects spread across eight cities in FY10.It has already launched its first affordable housing project in Noida during 1QFY10and is likely to launch its next affordable housing project in Chennai.
Comfortable cash flow positionUnitech has a comfortable cash flow position in FY10; it estimates ~Rs43b of cashinflows including: (i) 35% of sales value of 20msf at an average rate of Rs3,000/sf- Rs21b, (ii) inflows of Rs3.5b from old projects, and (iii) asset sales of Rs10.4b. Asagainst this, it expects cash outflows of Rs42.5b in FY10, including: (i) constructioncost of ~20msf of Rs13b, with average cost of Rs1,300/sf, 25% of the cost to beincurred in FY10, (ii) additional construction cost of Rs6.5b for old projects andclubs, (iii) debt repayment of Rs17b, and (iv) interest cost of Rs8b.
Valuation and viewUnitech has managed to recapitalize its balance sheet by: (1) successfully raisingUS$900m equity through two QIP issues, and (2) asset sale of ~Rs10b. This hassignificantly lowered solvency risk for the company and improved financial outlook. Thestock trades at 2.1x FY11E adjusted BV of Rs45/share and at 14% premium to FY11ENAV of Rs83/share. While the macro outlook has turned positive for Unitech, we believethe stock is fairly valued. Maintain Neutral.
Company Represented By:Mr R Nagaraju,VP-Corporate Planning
Covering Analyst(s):Siddharth Bothra+91 22 3982 [email protected]
Mansi Trivedi+91 22 3982 [email protected]
YEAR NET SALES PAT EPS EPS P/E P/BV ROE ROCE EV/ EV/
END (RS M) (RS M) (RS) GROWTH (%) (X) (X) (%) (%) SALES EBITDA
3/08A 41,152 16,692 10.2 -36.4 9.1 4.2 46.1 21.5 7.1 13.3
3/09A 28,945 11,968 6.0 -41.7 15.6 2.9 18.7 13.2 10.6 19.2
3/10E 33,799 10,794 4.5 -24.2 20.6 2.0 9.9 10.4 7.8 15.4
3/11E 30,224 9,986 4.2 -7.5 22.2 1.9 8.4 8.1 8.5 18.0
Bloomberg UT INEquity Shares (m) 2385.6CMP (Rs) 93Mcap (US$ b) 4.752 W Range 192 / 221, 6, 12 Rel Per 9 / 159 / -55
66August 3 - 5, 2009
5th Annual Global Investor Conference
Vardhman Textiles
Key Takeaways
Global textile demand to revive in 9-12 monthsThe management expects textile demand to revive in nine to 12 months. It alsoexpects the revival to be very strong as global capacity additions have ceased.
The cost of production in China is rising due to higher labor costs. This is likely toforce Chinese manufacturers to raise product prices. India is likely to benefit fromsuch a situation.
Capex benefits to be visible from FY11VTL is on track to complete its Rs25b capacity expansion in FY10, which will increaseits textile capacity to 8.37m spindles, processed fabric capacity of 90m meters andsewing thread capacity of 33mtd. VTL expects full utilization of its plant in FY11.
Entry into new areas positiveVardhman entered the garments sector with a joint venture with Nisshinbo TextileInc. to make shirts in Ludhiana, Punjab. Vardhman holds 51% in the venture. Theshirts will be sold in India and exported to the US, Europe & Japan. Production isseen to start from April 2010 with 1.20m units of which 300,000 will be sold inIndia.
VTL's 51:49 JV, called Vardhman Yarns and Thread, with A&E, Inc. US, to make anddistribute A&E-branded sewing threads, is growing strongly and the managementis open to strategic tie-ups or financial investors in the venture.
Valuation and viewAlthough near-term outlook on the stock is negative because of multiple margin pressures,we are bullish on it over the medium to long term due to healthy growth opportunities inthe upstream textile sector. The stock trades at 7.4x FY10E EPS of Rs20.5 and 5.2xFY11E EPS of Rs28.8. Buy.
Company Represented By:Mr Sachit Jain, Executive DirectorMs Jasmeet Gill, Sr ManagerCorp Finance
Covering Analyst(s):Siddharth Bothra+91 22 3982 [email protected]
YEAR NET SALES PAT EPS EPS P/E P/BV ROE ROCE EV/ EV/
END (RS M) (RS M) (RS) GROWTH (%) (X) (X) (%) (%) SALES EBITDA
3/08A 22,947 1,225 21.2 -28.6 7.1 0.7 10.8 6.2 1.4 9.0
3/09A 24,536 633 21.4 1.0 7.1 0.7 10.1 4.4 1.2 8.1
3/10E 31,816 1,184 20.5 -4.3 7.4 0.6 9.0 6.3 1.1 7.6
3/11E 35,500 1,665 28.8 40.6 5.2 0.6 11.5 7.4 0.9 6.1
Bloomberg VTEX INEquity Shares (m) 57.8CMP (Rs) 151Mcap (US$ b) 0.252 W Range 160 / 391, 6, 12 Rel Per 18 / 85 / 52

67August 3 - 5, 2009
5th Annual Global Investor Conference
Voltas
Key Takeaways
Revenue CAGR of 20-25% for next 2-3 yearsVoltas has indicated an improved outlook in the domestic and international markets.It is targeting revenue and PAT CAGR of 20-25% over the next 2-3 years, and noRoCE dilution is expected to achieve the growth.
EMP revenue to grow 30-35%; improved demand for engineering productsIn 1QFY10 Voltas' global business revenue grew 90% YoY against 20% YoY in the domesticElectromechanical Projects (EMP) division. EMP order book is Rs48b, which providesrevenue visibility for the next 12-15 months.
On the international side (Rs36b of order book) markets like Qatar, Abu Dhabi andSaudi Arabia are improving. New markets like Singapore are opening up forentertainment projects (casinos and theme parks).EMP revenue is expected to grow 30-35% with stable profitability and RoCE.Engineering Products division: In the Engineering Products division meaningfulimprovement in enquiries is absent. While textile machinery continues to be weak,material handling equipment and mining/construction equipment is expected toimprove in 2HFY10. This will reflect in actual performance only from 1HFY11. ManagingFY10 EBITDA margin will be a challenge for this division.Unitary Cooling Products: Revenue improved substantially in July compared witha 3.5% YoY increase in 1QFY10. The management sees stable margins andimproved volumes to 8-10% YoY in FY10 for the segment. Organized retail contributes25-30% of room AC sales, and Voltas is improving its performance in these formatsas well.
Other takeawaysCompetition is increasing in the Middle East due to a slowdown in Dubai and theSaudi Arabian markets.Voltas will spend Rs400-500m on capex, and Rs200-250m on stake acquisition inRohini Electricals. It will use Rs2-3b to fund possible acquisition in the water segment.Voltas plans to gain pre-qualifications in areas such as oil and gas (refineries), andchemical water treatment.
Valuation and viewThe stock trades at P/E of 21x FY09 EPS of Rs28. We have no rating on the stock.
Company Represented By:Mr M M Miyajiwala,EVP - FinanceMr B N Garudachar,GM, Corporate Communications
Covering Analyst(s):Shrinath Mithanthaya+91 22 3982 [email protected]
Bloomberg VOLT INEquity Shares (m) 330.6CMP (Rs) 145Mcap (US$ b) 1.052 W Range 150 / 311, 6, 12 Rel Per 9 / 192 / 2
YEAR NET SALES PAT EPS EPS P/E P/BV ROE ROCE EV/ EV/
END (RS M) (RS M) (RS) YoY (%) (X) (X) (%) (%) SALES EBITDA
03/06A 19,544 646 2.0 61.4 29.9 23.703/07A 25,267 1,110 3.4 71.8 58.0 25.003/08A 32,029 1,760 5.3 58.5 41.5 39.903/09A 43,259 2,252 6.8 28.0 21.3 6.1 36.8 32.0 1.0 15.4
68August 3 - 5, 2009
5th Annual Global Investor Conference
Wipro
Key Takeaways
Signs of stability visibleDemand in IT services is showing signs of stability. However, recovery is likely to beslow and steady.Budgets have been curtailed, as client risk appetite remains low.Wipro expects strong growth in cost rationalizing service lines like BPO helped by(1) lower level of penetration compared to IT services, and (2) Wipro's globalizedoffering with BPO centers in Philippines and Eastern Europe.
Emerging markets catching up, dormant sectors starting to show tractionEmerging market IT spends are growing and catching up with developed marketsHigh momentum seen in India, led by sectors like telecom, infrastructure, BFSI andgovernment spendingEven in developed markets, sectors like utilities and healthcare, which were lessamenable to outsourcing earlier, are now growing.Other sectors are likely to resume IT spend in 2-3 quarters due to the followingfactors: (1) regulation (change in credit card rules, lending norms, etc), (2)consolidation with other companies needing IT integration, and (3) change in businessenvironment entailing companies to build and develop new products and services.
Wipro's two pronged strategyWipro is following a two-pronged strategy: (1) restructure and streamline internaloperations to make processes lean, and (2) prepare for the next leg of growth.The second strategy includes several aspects such as: building consulting capability,hiring in global centers for local delivery to clients, and investing in newer technologieslike cloud computing and platform based services.
Investment in non-linearityWipro is also investing in non-linearity. This is being done in the following fourquadrants:1. Automation and process excellence - shared tools2. Solutions and platforms (e.g. acquired company in US, which has a solution for
loan origination)3. More value-added services (solutions)4. Sub-contracting (in the early stage).
Valuation and viewWe expect Wipro to post US$ revenue growth of 11.2% in FY11 after a 1.4% dip inFY10. EBIT margins should improve by 30bp over the period. We expect Wipro to clockEPS CAGR of 10% over FY09-11. The stock trades at 18x FY10E and 17.4x FY11E EPS.Maintain Neutral.
Company Represented By:Mr Girish Paranjpe, Joint CEOMr Rajendra Shreemal,VP & Corporate Treasurer
Covering Analyst(s):Ashwin Mehta+91 22 3982 [email protected]
Vihang Naik+91 22 3982 [email protected]
YEAR NET SALES PAT* EPS EPS P/E P/BV ROE ROCE EV/ EV/
END (RS M) (RS M) (RS) GROWTH (%) (X) (X) (%) (%) SALES EBITDA
3/08A 197,428 32,240 22.2 9.8 22.5 5.6 27.9 23.1 3.6 18.3
3/09A 254,564 34,415 23.6 6.7 21.1 4.8 24.6 21.6 2.8 14.1
3/10E 263,304 40,357 27.7 17.1 18.0 3.9 23.9 20.3 2.6 12.4
3/11E 285,193 41,802 28.7 3.6 17.4 3.3 20.4 18.9 2.3 11.3
Bloomberg WPRO INEquity Shares (m) 1459.1CMP (Rs) 498Mcap (US$ b) 15.352 W Range 511 / 1801, 6, 12 Rel Per 21 / 52 / 5
* Citi Technology Services is fully consolidated in 4QFY09
69August 3 - 5, 2009
5th Annual Global Investor Conference
Yes Bank
Key Takeaways
Superior returns ratios to be maintainedIn FY10-11, Yes Bank expects to maintain superior return ratios (RoA 1.5%+ and RoE20%+) backed by higher loan growth (expected to be 2x of industry growth rates),improved margins (bulk deposits re-pricing and improvement in CASA ratio, targetingCASA ratio of 25% by FY12 and 40% in FY15), strong growth in fee income due tohigher advisory, forex and third party distribution income and stable credit cost.
Falling cost of funds to be used for margin improvementWith 123 branches and expected additions of ~130 branches in next 2 years (14 branchlicences in hand), the focus in FY10-11 is to improve retail deposit franchise and acceleratecustomer acquisition. Yes Bank plans to use the opportunity of significant fall in bulkdeposits rates to garner higher retail term deposits by paying competitive rates comparedto peers. Benefit of bulk deposits is evident from falling cost of funds (8.8% in FY09 to8.1% in 1QFY10). The management mentioned that with every 100bp improvement inCASA ratio, NIMs will improve 4-5bps.
Non-interest income contribution in total income to remain healthyHealthy signs of revival have been noticed in income from financial markets, financialadvisory, and third party distribution. Forex income is likely to show strong traction andcontribution from debt markets will also remain strong in FY10. Yes Bank already hasrequisite infrastructure to grow its income from third party distribution (123 branchesand dedicated sale staff).
Asset quality no concernsYes Bank maintains that asset quality is likely to remain strong. In 1QFY10, GNPA ratiodeclined to 0.48% vs 0.68% in FY09 and NNPA ratio declined to 0.24% vs 0.33% inFY09. The bank restructured Rs614m (~0.48% of loans) worth of loans during thequarter and total restructured book stands at Rs1.2b (0.94% of the loan book). Theoutlook on asset quality has improved significantly and NPAs would remain manageable.The management on a prudent basis is planning to increase provision coverage ratio byaccelerating provisions. NNPA ratio is not expected to go above 0.6%.
Comfortable on CAR in near term; will dilute at appropriate timeCAR of the bank stood at 17.6%; Tier I is 10.3%. While capital is not a constraint forgrowth in the near term, the board decision of enabling capital raising committee toraise US$250m is premised on longer term fund requirement.
Valuation and viewYes Bank trades at 15x FY09 EPS of Rs10.2 and 2.8x FY09 BV of Rs55. We have no ratingon the stock.
Company Represented By:Mr Rajat Monga, CFOMr Jaideep Iyer, Deputy CFO
Covering Analyst(s):Ajinkya Dhavale+91 22 3982 [email protected]
Alpesh Mehta+91 22 3982 [email protected]
Bloomberg YES INEquity Shares (m) 297CMP (Rs) 154Mcap (US$ b) 1.052 W Range 166 / 411, 6, 12 Rel Per 2 / 89 / 5
YEAR NET INCOME PAT EPS EPS P/E P/BV CAR ROAE ROAA P/ABV
END (RS M) (RS M) (RS) GROWTH (%) (X) (X) (%) (%) (%) (X)
3/06A 1,826 527 2.0 n.a. 78.8 7.3 16.4 13.3 1.9 7.3
3/07A 3,659 944 3.4 72.7 45.6 5.5 13.6 13.9 1.2 5.5
3/08A 6,912 2,000 6.8 100.7 22.7 3.5 13.6 19.0 1.4 3.5
3/09E 9,462 3,039 10.2 51.3 15.0 2.8 16.6 20.6 1.6 2.9

70August 3 - 5, 2009
5th Annual Global Investor Conference
Zee Entertainment
Key Takeaways
Television growing faster than print mediaTelevision is growing faster than print media, as advertisers focus on low costverticals. Historically, TV advertising growth has been 2x growth of GDP growth.Television industry is expected to grow from Rs211b in 2007 to Rs341b by 2011E.55 new channels have been launched in past four years (four in Hindi GEC). Thoughthis has put pressure on incumbents, it has also expanded Hindi GEC GRPs from 889in September-October 2007 to 1,150 in June-July 2009.
Signs of improvement in advertising; Zee to be a key beneficiaryAd industry is showing some signs of improvement on a sequential basis. Withmega sports events behind, Mr Goenka expects ad growth to improve in 2HFY10.Zee's content strategy in Hindi GEC has played out well. In fiction programming, itmoved away from "kitchen politics" based soaps to issue-based serials (Saat Phereand Betiyaan) and in non-fiction, from foreign high-cost formats to homebred formats(Sa Re Ga Ma, Dance India Dance, etc).Mr Goenka indicated that Zee TV is well placed to take advantage of any improvementin the advertising scenario due to: (1) consistent improvement in GRPs despite bigticket events like IPL and T20 World Cup, (2) highest share (23 shows) in top-50Hindi GEC, and (3) strong network of Zee group (17% network market share).
Share of subscription revenue to increase to 65-70% in three yearsDigitization is now a reality and would be driven by DTH subscription growth. MrGoenka expects DTH subscriber to grow from the current 14m to 20m by FY10 and35m in next 3 years. Zee has guided for DTH revenue growth of 45-50% in FY10.Over the next three years, the company indicated that its subscription revenuecould reach 65-70% of total revenue, driven by digitization of distribution.
Focus on profitability and shareholder returnZee's strategy with focus on low-cost content v/s movies or high cost non-fictioncontent enables cost control. Its new programs are at lower cost than the onesgetting replaced, which has also resulted in savings in programming cost.Management indicated that from here on no further cost savings are likely, as risingcompetition will force Zee to increase its spend on programming.Zee would continue to focus on profitability and improving shareholder return.
Valuation and viewWe expect Zee Entertainment to report PAT of Rs3.9b in FY10 (down 0.3% YoY) andRs4.9b in FY11 (up 24% YoY). The stock trades at a P/E of 21.8x FY10E and 17.6xFY11E. Maintain Neutral.
Company Represented By:Mr Punit Goenka, CEOMr Atul Das, Executive VP,Corporate StrategyMr Harsh Deep Chhabra,Sr Manager IR
Covering Analyst(s):Amnish Aggarwal+91 22 3982 [email protected]
Amit Purohit+91 22 3982 [email protected]
YEAR NET SALES PAT EPS EPS P/E P/BV ROE ROCE EV/ EV/
END (RS M) (RS M) (RS) GROWTH (%) (X) (X) (%) (%) SALES EBITDA
3/08A 18,354 3,850 8.9 58.7 22.5 3.0 13.5 19.6 4.7 15.8
3/09A 21,730 3,995 9.2 3.8 21.7 2.7 12.6 17.3 4.1 16.6
3/10E 22,106 3,981 9.2 -0.3 21.8 2.5 11.6 16.9 3.8 14.8
3/11E 24,850 4,938 11.4 24.1 17.6 2.3 13.4 20.4 3.3 11.6
Bloomberg Z INEquity Shares (m) 433.6CMP (Rs) 200Mcap (US$ b) 1.852 W Range 255 / 881, 6, 12 Rel Per 4 / 17 / -10
71August 3 - 5, 2009
5th Annual Global Investor Conference
Zee News
Key Takeaways
Regional broadcasting a huge opportunity; number of players to increasebut rule of three to apply
Regional broadcasting offers a huge opportunity due to (1) advertisers focusing onregional/rural markets for incremental sales, and (2) limited options with viewers,who are open to change/new channels.The segment is likely to witness entry of several players and digitization would alsobe the key factor attracting new players. However, management indicated that ruleof three will prevail in the broadcasting space with top-3 players getting significantshare of the regional advertising market.Regional advertising market would continue to grow faster than national advertising,as advertising/viewership ratio for regional genres is less than Hindi GEC.
Zee News plans to strengthen its position in existing markets and increase itsofferings in both regional and new genres; focus on profitability
Zee News has increased its presence across the regional markets. The companyplans to strengthen is position in the existing market and aims to remain amongstthe top-3 players in each of the regional markets.Its long term strategy is to launch regional channels in the news genre. Managementbelieves that although the regional news genre is currently a small market, it offershuge potential, as it has strong viewership.Zee News would continue to focus on profitability even when it plans to increase itsnetwork, through better cost management. The company targets to achieve breakevenin regional GEC in 36-48 months and in the news genre in 24-36 months.
Share of subscription revenue to increase to 40% in three years; DTH to bethe key growth driver
Management targets to increase its share of subscription revenue from current19% to 40% over the next three years, leveraging the strength of Zee Group'sdistribution network.The strong growth in subscription revenue would be driven by digitization.
Valuation and viewFor FY09, Zee News posted revenue of Rs5.2b and PAT of Rs446m. The stock quotes at23x FY09E EPS of Rs1.9. Not Rated.
Company Represented By:Mr Barun Das, CEO
Covering Analyst(s):Amnish Aggarwal+91 22 3982 [email protected]
Amit Purohit+91 22 3982 [email protected]
YEAR NET SALES PAT * EPS EPS P/E P/BV ROE ROCE EV/ EV/
END (RS M) (RS M) (RS) GR. (%) (X) (X) (%) (%) SALES EBITDA
03/07A 2,405 79 0.3 77 130.3 5.5 3.4 8.6 4.1 123.6
03/08A 3,671 395 1.6 401 26.0 4.8 18.8 28.8 2.7 14.3
03/09A 5,221 446 1.9 13 23.1 4.0 17.7 20.1 2.2 13.7
Bloomberg ZEEN INEquity Shares (m) 239.8CMP (Rs) 43Mcap (US$ b) 0.252 W Range 52 / 241, 6, 12 Rel Per -3 / -32 / -7

This report is for the personal information of the authorized recipient and does not construe to be any investment, legal or taxation advice to you. Motilal OswalSecurities Limited (hereinafter referred as MOSt) is not soliciting any action based upon it. This report is not for public distribution and has been furnished to you solelyfor your information and should not be reproduced or redistributed to any other person in any form.
The report is based upon information that we consider reliable, but we do not represent that it is accurate or complete, and it should not be relied upon such. MOSt orany of its affiliates or employees shall not be in any way responsible for any loss or damage that may arise to any person from any inadvertent error in the informationcontained in this report. MOSt or any of its affiliates or employees do not provide, at any time, any express or implied warranty of any kind, regarding any matterpertaining to this report, including without limitation the implied warranties of merchantability, fitness for a particular purpose, and non-infringement. The recipients ofthis report should rely on their own investigations.
MOSt and/or its affiliates and/or employees may have interests/ positions, financial or otherwise in the securities mentioned in this report. To enhance transparency,MOSt has incorporated a Disclosure of Interest Statement in this document. This should, however, not be treated as endorsement of the views expressed in the report.
Disclosure of Interest Statement
The MOSt group and its Directors own shares in the following companies covered in this report: Bharti Airtel, Hero Honda, Marico, and State Bank.
MOSt may have broking relationships with a few of the companies covered in this report.
MOSt is engaged in providing investment-banking services in the following companies covered in this report: Sintex Industries
This information is subject to change without any prior notice. MOSt reserves the right to make modifications and alternations to this statement as may be requiredfrom time to time. Nevertheless, MOSt is committed to providing independent and transparent recommendations to its clients, and would be happy to provideinformation in response to specific client queries.
Motilal Oswal Securities Ltd, 3rd Floor, Hoechst House, Nariman Point, Mumbai 400 021Phone: (91-22) 39825500 Fax: (91-22) 22885038. E-mail: [email protected]