post-genomic computational methods for functional annotation
DESCRIPTION
Post-Genomic Computational Methods for Functional Annotation. presented by: Ashok Palaniappan November 5, 2002. Overview of the methods. Phylogenetic profiling Rosetta-Stone method (the name derives from the key discovery to decrypting Egyptian hieroglyphics) that detects domain fusions - PowerPoint PPT PresentationTRANSCRIPT
Post-Genomic Computational Methods for Functional
Annotation
presented by: Ashok PalaniappanNovember 5, 2002
Overview of the methods
1. Phylogenetic profiling2. Rosetta-Stone method (the name derives from the key
discovery to decrypting Egyptian hieroglyphics) that detects domain fusions
3. Chromosomal proximity
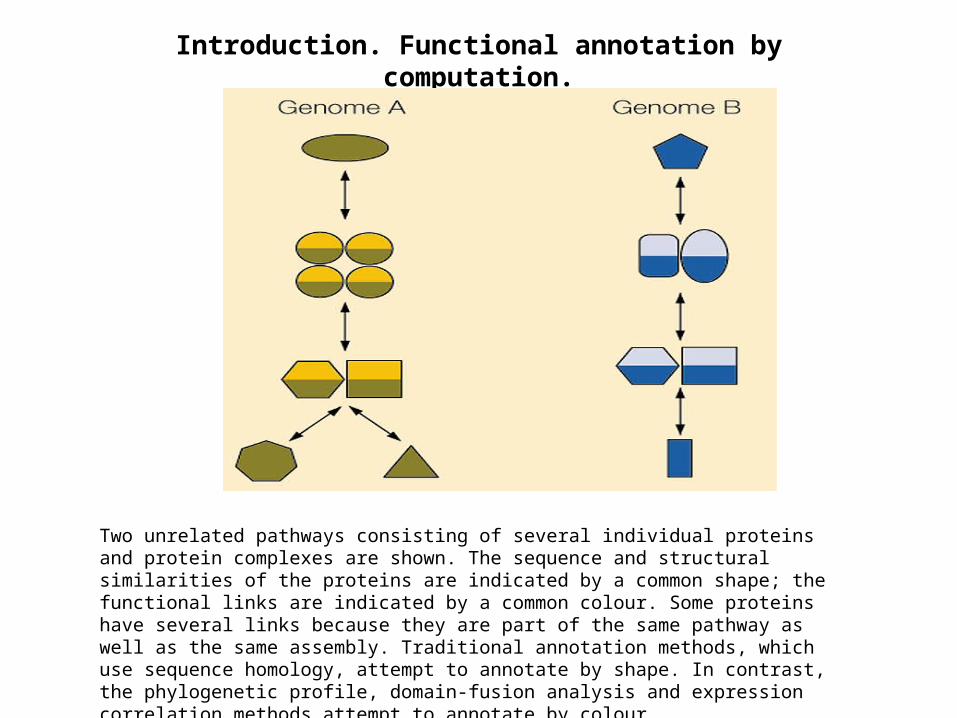
Introduction. Functional annotation by computation.
Two unrelated pathways consisting of several individual proteins and protein complexes are shown. The sequence and structural similarities of the proteins are indicated by a common shape; the functional links are indicated by a common colour. Some proteins have several links because they are part of the same pathway as well as the same assembly. Traditional annotation methods, which use sequence homology, attempt to annotate by shape. In contrast, the phylogenetic profile, domain-fusion analysis and expression correlation methods attempt to annotate by colour.
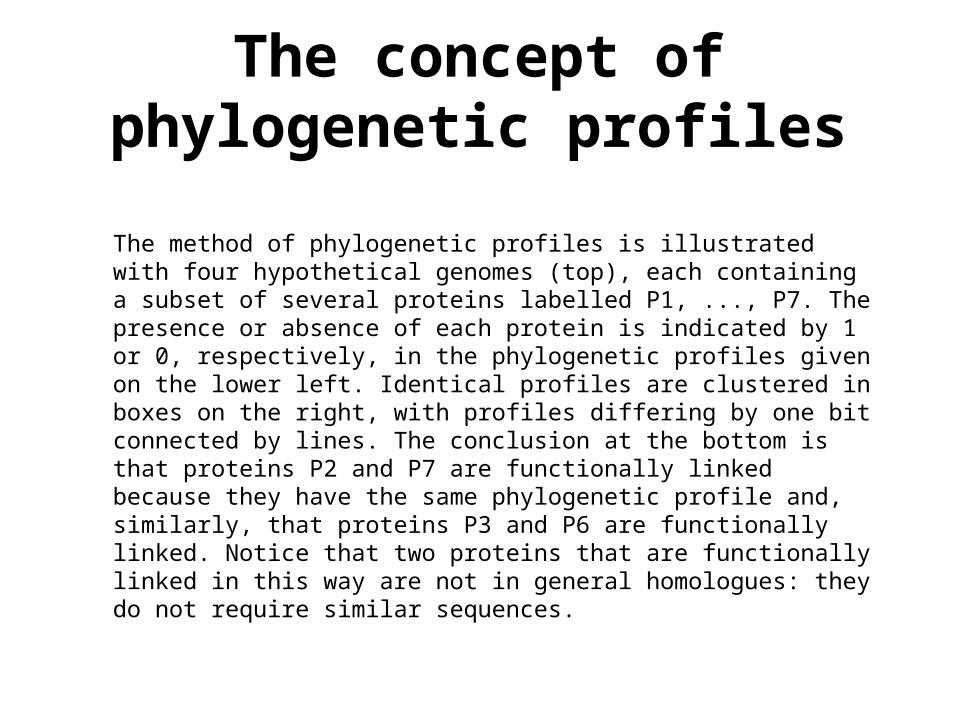
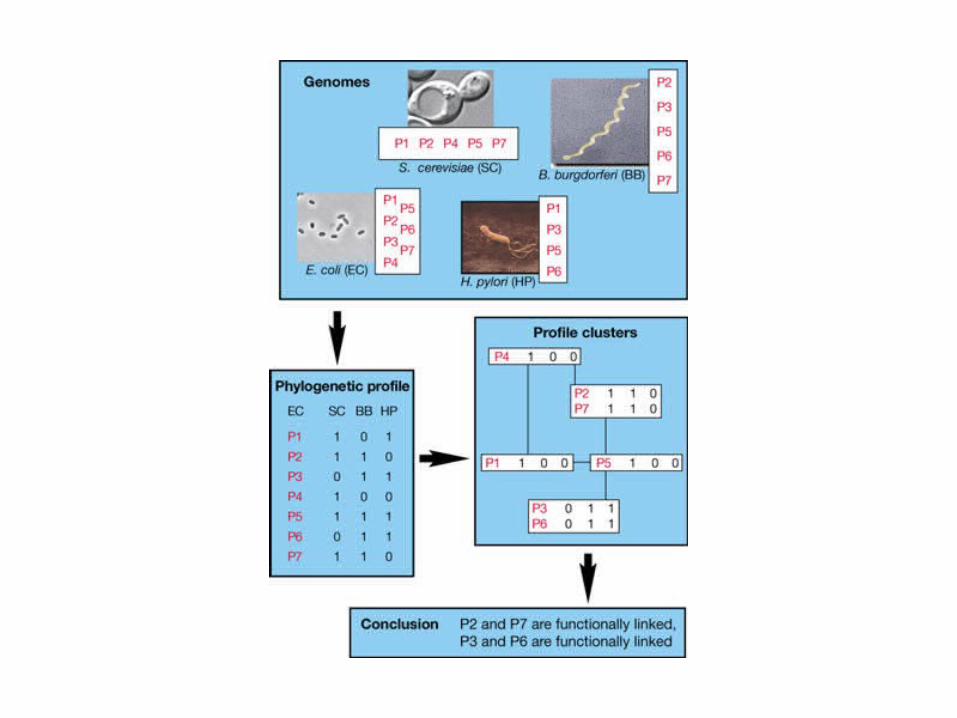
The concept of phylogenetic profiles
The method of phylogenetic profiles is illustrated with four hypothetical genomes (top), each containing a subset of several proteins labelled P1, ..., P7. The presence or absence of each protein is indicated by 1 or 0, respectively, in the phylogenetic profiles given on the lower left. Identical profiles are clustered in boxes on the right, with profiles differing by one bit connected by lines. The conclusion at the bottom is that proteins P2 and P7 are functionally linked because they have the same phylogenetic profile and, similarly, that proteins P3 and P6 are functionally linked. Notice that two proteins that are functionally linked in this way are not in general homologues: they do not require similar sequences.
Improvements to the phylogenetic profile method
Improvement in the design of the profile vector.. Use a fuzzy scheme instead of a binary scheme. Fuzzy schemes can take fractional values from 0 to 1. The value at each position of the phylogenetic profile is recalculated as –1/logE, where E is the BLAST expectation value of the best matching sequence in a genome. Thus a phylogenetic profile would be a string of zeros for perfect matches and ones for no matches.
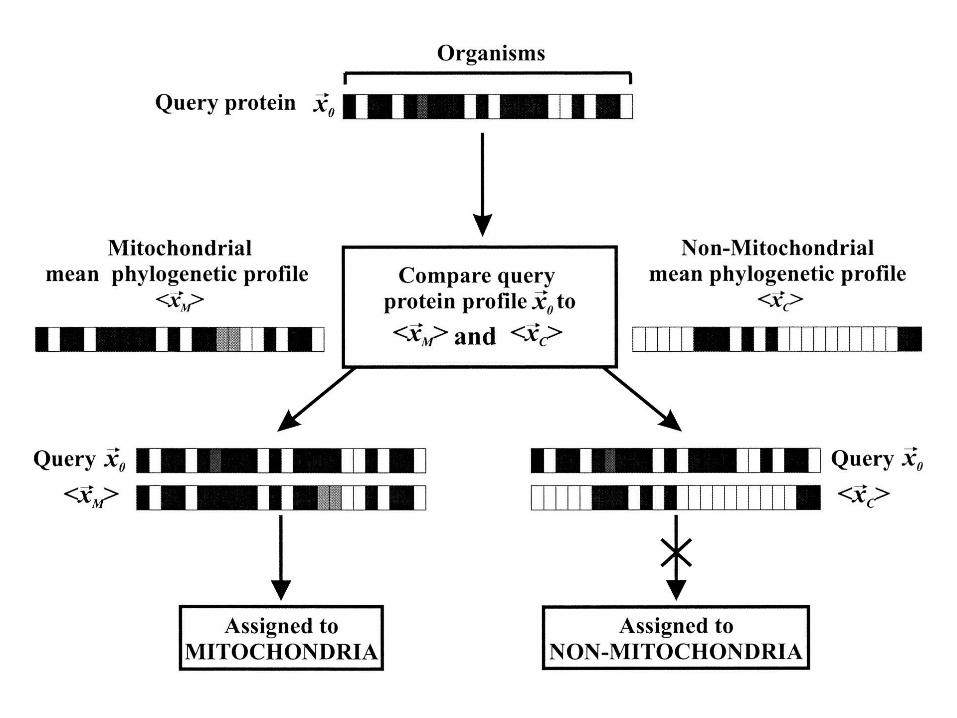
Another application: Localizing proteins in the cell
The scheme by which proteins are classified into mitochondrial or nonmitochondrial cellular localizations. Each horizontal bar is a phylogenetic profile; that for the protein of interest x0 is compared with the mean profiles for mitochondrial <x1 > and nonmitochondrial proteins <x2 > to determine its localization. In this example, the protein of interest is assigned to the mitochondrion because the query protein's phylogenetic profile more closely resembles the mean profile of mitochondrial proteins than the mean profile of cytosolic proteins.
•
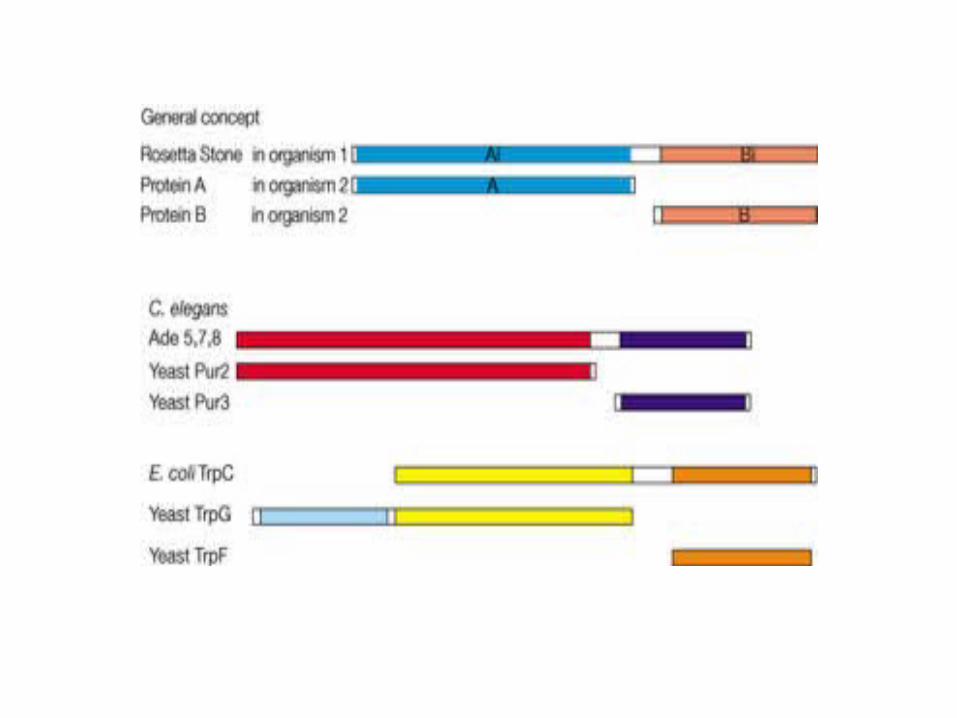
The Rosetta Stone method for detecting functional linkage
The domain fusion or Rosetta Stone method for detecting functional linkage12, 15 is illustrated here by three examples. The top sequence in all three triplets of proteins is the fused domain or Rosetta Stone sequence; it is homologous to two separate sequences in another species. In the middle example, the genes Pur2 and Pur3 of yeast both encode enzymes that catalyse steps in the purine biosynthetic pathway. If it were not previously known from biochemical and genetic experiments that these enzymes are functionally linked, the linkage would be apparent from the Rosetta stone sequence Ade5,7,8 from Caenorhabditis elegans. Similarly, in the lower example, the fused sequence of TrpC in the Escherichia coli genome would inform us that the yeast proteins TrG and TrpF are functionally linked, if we did not know already that they both catalyse steps in the biosynthesis of tryptophan.
•
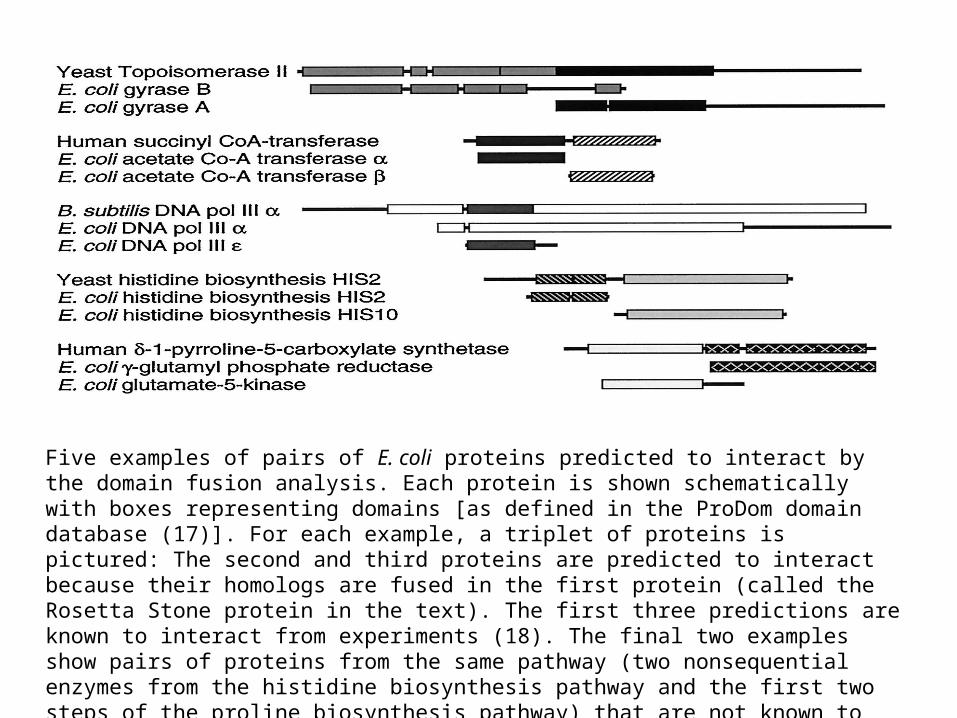
Five examples of pairs of E. coli proteins predicted to interact by the domain fusion analysis. Each protein is shown schematically with boxes representing domains [as defined in the ProDom domain database (17)]. For each example, a triplet of proteins is pictured: The second and third proteins are predicted to interact because their homologs are fused in the first protein (called the Rosetta Stone protein in the text). The first three predictions are known to interact from experiments (18). The final two examples show pairs of proteins from the same pathway (two nonsequential enzymes from the histidine biosynthesis pathway and the first two steps of the proline biosynthesis pathway) that are not known to interact directly.
•
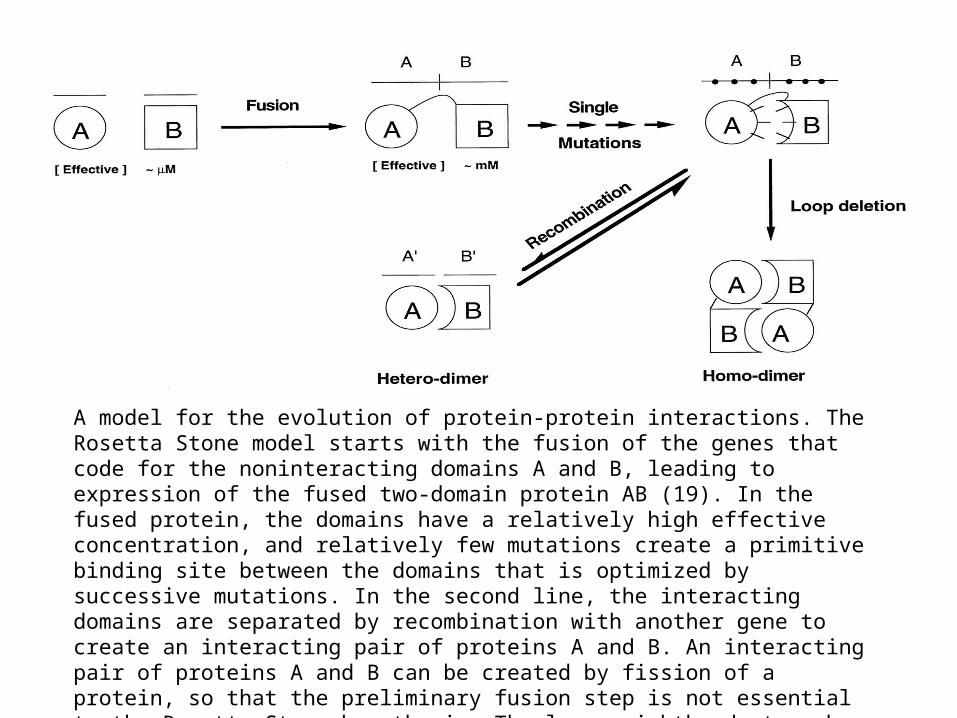
A model for the evolution of protein-protein interactions. The Rosetta Stone model starts with the fusion of the genes that code for the noninteracting domains A and B, leading to expression of the fused two-domain protein AB (19). In the fused protein, the domains have a relatively high effective concentration, and relatively few mutations create a primitive binding site between the domains that is optimized by successive mutations. In the second line, the interacting domains are separated by recombination with another gene to create an interacting pair of proteins A and B. An interacting pair of proteins A and B can be created by fission of a protein, so that the preliminary fusion step is not essential to the Rosetta Stone hypothesis. The lower righthand step shows another possible mutation, a loop deletion that leads to a domain-swapped homodimer. This evolutionary path to homooligomers has been discussed earlier (20) and is the analog for homooligomers of the evolutionary path suggested here for heterooligomers.
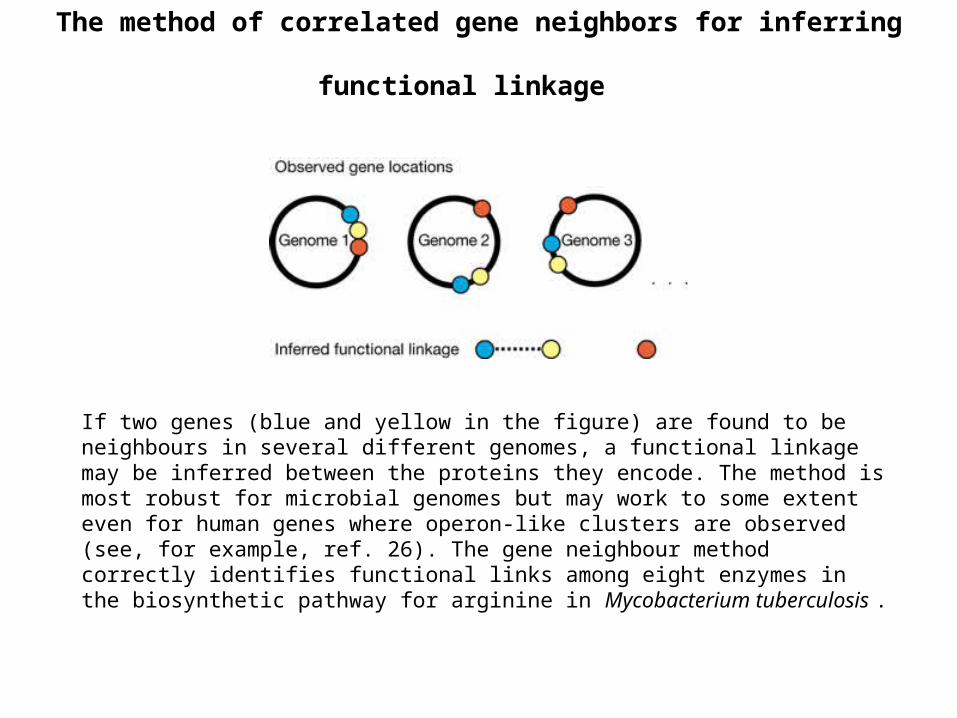
The method of correlated gene neighbors for inferring functional linkage
If two genes (blue and yellow in the figure) are found to be neighbours in several different genomes, a functional linkage may be inferred between the proteins they encode. The method is most robust for microbial genomes but may work to some extent even for human genes where operon-like clusters are observed (see, for example, ref. 26). The gene neighbour method correctly identifies functional links among eight enzymes in the biosynthetic pathway for arginine in Mycobacterium tuberculosis .
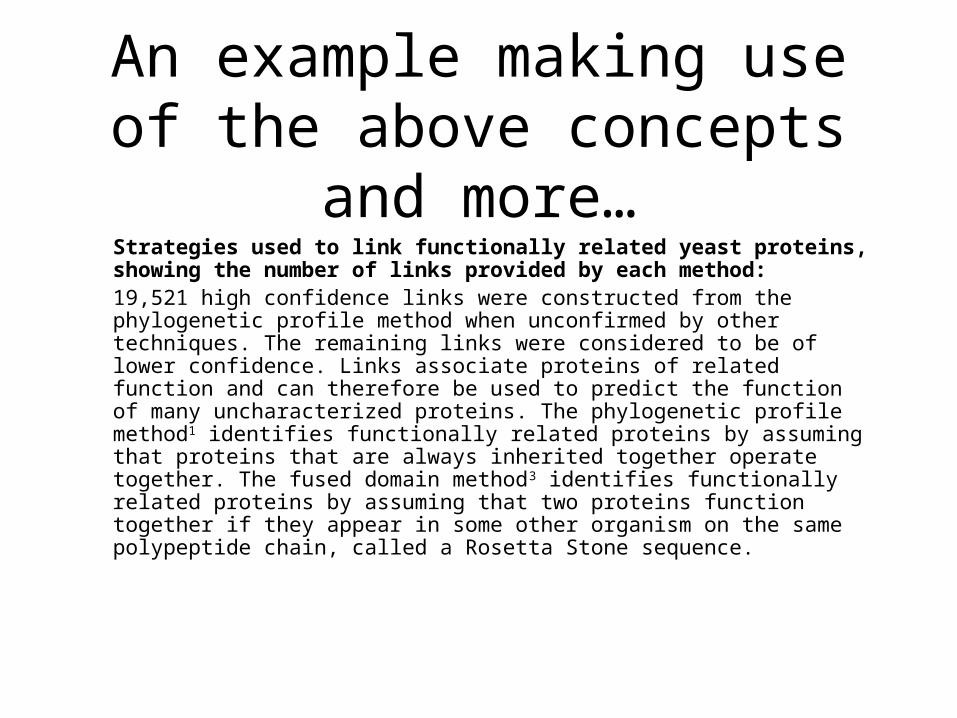
An example making use of the above concepts and more…
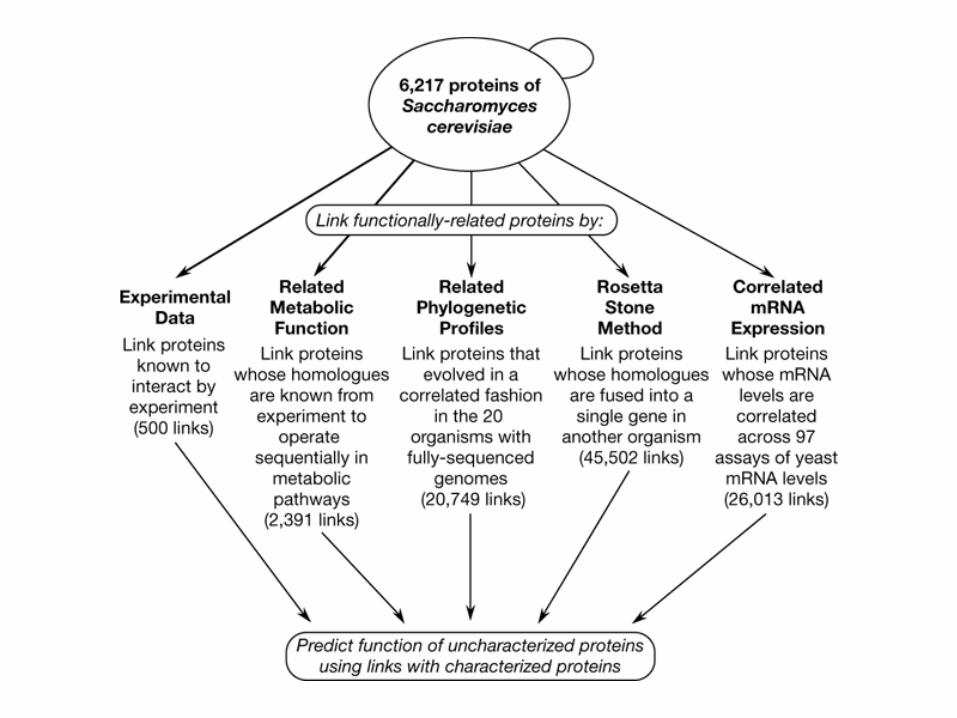
Strategies used to link functionally related yeast proteins, showing the number of links provided by each method:19,521 high confidence links were constructed from the phylogenetic profile method when unconfirmed by other techniques. The remaining links were considered to be of lower confidence. Links associate proteins of related function and can therefore be used to predict the function of many uncharacterized proteins. The phylogenetic profile method1 identifies functionally related proteins by assuming that proteins that are always inherited together operate together. The fused domain method3 identifies functionally related proteins by assuming that two proteins function together if they appear in some other organism on the same polypeptide chain, called a Rosetta Stone sequence.
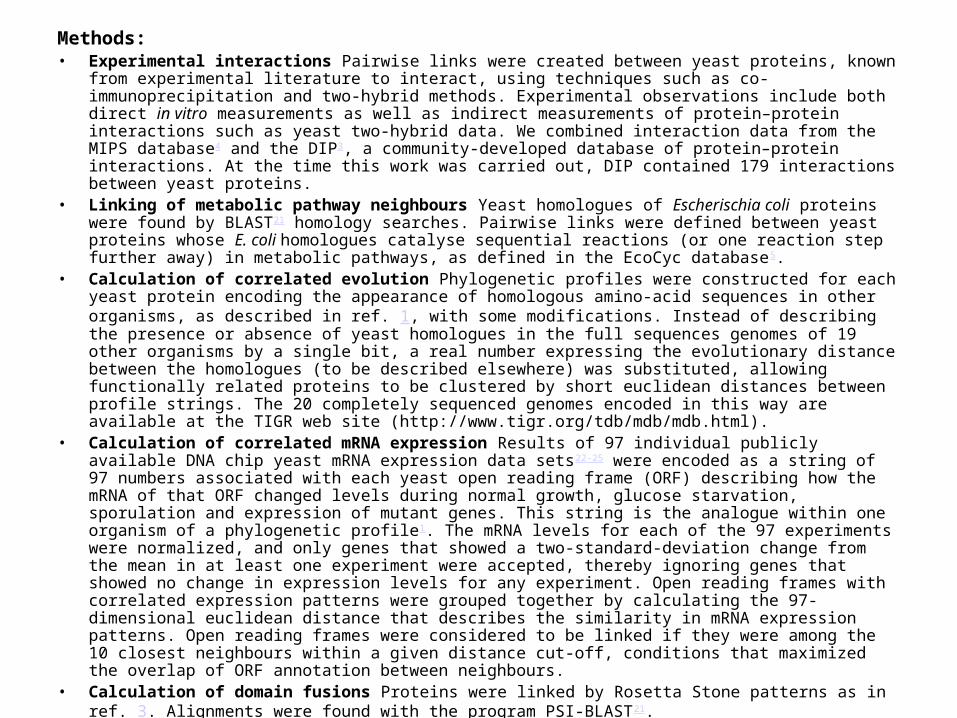
Methods:• Experimental interactions Pairwise links were created between yeast proteins, known
from experimental literature to interact, using techniques such as co-immunoprecipitation and two-hybrid methods. Experimental observations include both direct in vitro measurements as well as indirect measurements of protein–protein interactions such as yeast two-hybrid data. We combined interaction data from the MIPS database4 and the DIP3, a community-developed database of protein–protein interactions. At the time this work was carried out, DIP contained 179 interactions between yeast proteins.
• Linking of metabolic pathway neighbours Yeast homologues of Escherischia coli proteins were found by BLAST21 homology searches. Pairwise links were defined between yeast proteins whose E. coli homologues catalyse sequential reactions (or one reaction step further away) in metabolic pathways, as defined in the EcoCyc database5.
• Calculation of correlated evolution Phylogenetic profiles were constructed for each yeast protein encoding the appearance of homologous amino-acid sequences in other organisms, as described in ref. 1, with some modifications. Instead of describing the presence or absence of yeast homologues in the full sequences genomes of 19 other organisms by a single bit, a real number expressing the evolutionary distance between the homologues (to be described elsewhere) was substituted, allowing functionally related proteins to be clustered by short euclidean distances between profile strings. The 20 completely sequenced genomes encoded in this way are available at the TIGR web site (http://www.tigr.org/tdb/mdb/mdb.html).
• Calculation of correlated mRNA expression Results of 97 individual publicly available DNA chip yeast mRNA expression data sets22-25 were encoded as a string of 97 numbers associated with each yeast open reading frame (ORF) describing how the mRNA of that ORF changed levels during normal growth, glucose starvation, sporulation and expression of mutant genes. This string is the analogue within one organism of a phylogenetic profile1
. The mRNA levels for each of the 97 experiments were normalized, and only genes that showed a two-standard-deviation change from the mean in at least one experiment were accepted, thereby ignoring genes that showed no change in expression levels for any experiment. Open reading frames with correlated expression patterns were grouped together by calculating the 97-dimensional euclidean distance that describes the similarity in mRNA expression patterns. Open reading frames were considered to be linked if they were among the 10 closest neighbours within a given distance cut-off, conditions that maximized the overlap of ORF annotation between neighbours.
• Calculation of domain fusions Proteins were linked by Rosetta Stone patterns as in ref. 3. Alignments were found with the program PSI-BLAST21.
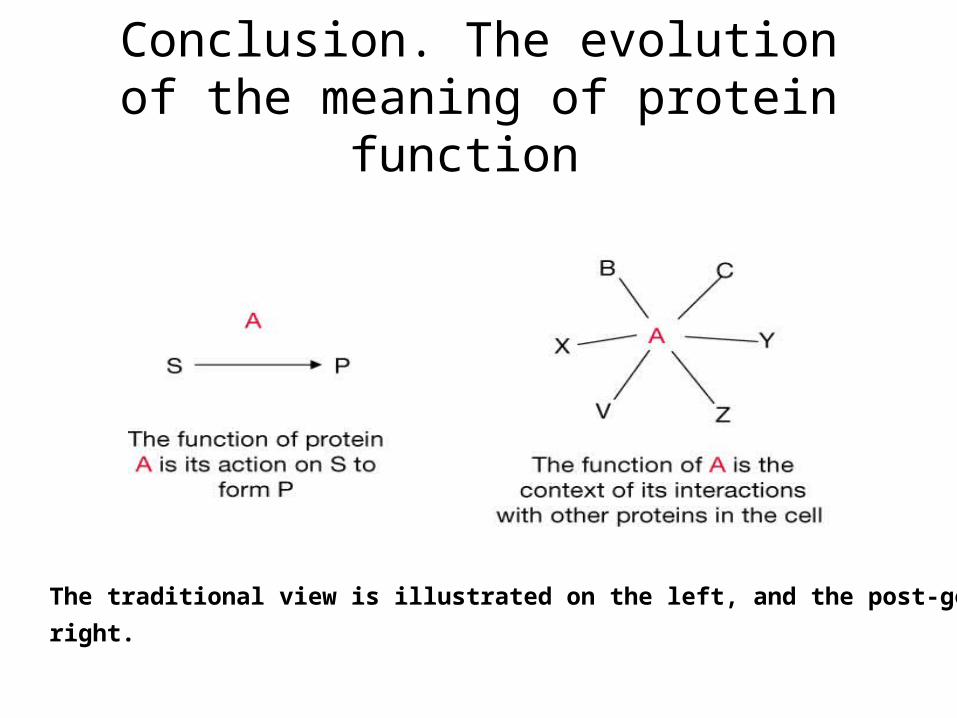
Conclusion. The evolution of the meaning of protein function
The traditional view is illustrated on the left, and the post-genomic view on the right.
Current popular www databases that originated from these
concepts
1. DIP: Database of Interacting Proteins@ http://dip.doe-mbi.ucla.edu/
2. Predictome: a database of putative functional links between proteins@ http://predictome.bu.edu
References1. Pellegrini,M., Marcotte,E.M., Thompson,M.J., Eisenberg,D. and Yeates,T.O. (1999) Assigning
protein functions by comparative genome analysis: protein phylogenetic profiles. Proc. Natl Acad. Sci. USA, 96, 4285–4288.
2. Marcotte,E.M., Pellegrini,M., Ng,H.L., Rice,D.W., Yeates,T.O. and Eisenberg,D. (1999) Detecting protein function and protein–protein interactions from genome sequences. Science, 285, 751–753
3. Eisenberg,D., Marcotte,E.M., Xenarios,I. and Yeates,T.O. (2000) Protein function in the post-genomic era. Nature, 405, 823–826
4. Marcotte,E.M., Pellegrini,M., Thompson,M.J., Yeates,T.O. and Eisenberg,D.A (1999) Combined algorithm for genome-wide prediction of protein function. Nature, 402, 83–86
5. Xenarios,I., Rice,D.W., Salwinski,L., Baron,M.K., Marcotte,E.M. and Eisenberg,D. (2000) DIP: the database of interacting proteins. Nucleic Acids Res., 28, 289–291. Updated article in this issue: Nucleic Acids Res. (2002), 30, 303–305
6. Sali, A. Genomics: Functional links between protein. Nature, 402, 23-257. Edward M. Marcotte, Ioannis Xenarios, Alexander M. van der Bliek, and David Eisenberg.
Localizing proteins in the cell from their phylogenetic profiles Proc. Natl Acad. Sci. USA 2000 97: 12115-12120
8. Joseph C. Mellor, Itai Yanai, Karl H. Clodfelter, Julian Mintseris, and Charles DeLisi Predictome: a database of putative functional links between proteins Nucleic Acids Res. 2002 30: 306-309.