post marketing surveillance of four brands of norfloxacin
TRANSCRIPT

1
The National Ribat University
Faculty of Graduate Students and Scientific research
Post marketing surveillance of four brands of Norfloxacin tablets
marketed in sudan
A thesis submitted in partial fulfillment of the Requirements of Master Degree of
Pharmacy (M.pharm) in Drugs Quality Control
By: Hiba Ismail Abaker Eltaher Supervisor:Professor Elrasheed Ahmed GadKariem
2017

I
Dedicated to my dear mother,
My father,
My sister,
My husband
And my beloved little daughter Mayar.

II
Table of contents Subject Page number
Dedication I
Table of content II-III
Acknowledgements IV
Abbreviations V
Abstract VI-VII
VIII المستخلص
List of figures IX
List of tables X-XI
Chapter one: Introduction
1.1. Introduction
1.2. Chemical and physical properties of Norfloxacin
1.2.1. Color
1.2.2.Melting point
1.2.3. Solubility
1.3. Experimental properties
1.3.1. Dissociation constant
1.3.2. Decomposition
1.4.Activity
1.5. Theoretical background
1.6. literature review
1.7. Research Rationale
1.8.Objectives
1-3
4
4
4
4
4
4
4
4
5-8
9
10
10
Chapter two: Materials and Methods
2.Materials and methods
2.1. Instruments and equipment
2.2. Materials
2.3.Methods
2.3.1. Preparation of stock solution
2.3.2.Sample preparation
2.3.3.Construction of standard curve
2.3.4. First order derivative method
11
11
11-12
13
13
13
13
14

III
2.3.5.Physical tests
2.3.5.1.Weight variation test
2.3.5.2.Diameter test
2.3.5.3.Thickness test
2.3.5.4.Hardness test
2.3.5.5.Friability test
2.3.5.6.Disintegration test
14
14
14
14
14
14
14
Chapter three: Results
3.1.Zero order spectrophotometric method
3.1.1. Standard curve of zero order spectrophotometric
method
3.1.2.Assay of Norfloxacin tablets using zero order
spectrophotometric method
3.1.2.1.Trizolin
3.1.2.2. Anquin
3.1.2.3. Yesnorf
3.1.2.4.Norozal
3.2.first derivative spectrophotometric method
3.2.1. Standard curve of 1st derivative method
3.2.2.Assay of Norfloxacin using first derivative
method
3.4.1.Trizolin
3.4.2.Anquin
3.4.3. Yesnorf
3.4.4. Norozal
3.5. Statistical analysis
3.6.Results of physical tests
15
15
17
17
17
18
18
19
19
20
20
21
21
22
23-24
25
Chapter four : Discussion , Conclusion and
Recommendations
4.1. Discussion
4.2. Conclusion
4.3. Recommendation
References
26-29
30
30
31-34

IV
ACKNOWLEDGEMENTS
Firstly, I would like to express my sincere gratitude to my advisor Prof. Elrasheed
Ahmed GadKariem for the continuous support of my master study and related
research, for his patience, motivation, and immense knowledge. His guidance
helped me in all the time since bachelor study until now. I could not have imagined
having a better advisor and teacher.
Besides my advisor, I would like to thank Dr. Imad Osman Abureid , whose
door is always open for any question.
Thanks also extend to my colleges and technical staff in National Ribat
University, faculty of pharmacy. Special thanks to Mr. Ibrahim Mohamed Ismail
for valuable help.
Last, but not least, I would like to express my most sincere gratitude to my
family, particularly my parents, my husband and daughter for their support and
encouragement throughout my studies.

V
List of abbreviations
NOR Norfloxacin
UV Ultra violet
HPLC High performance liquid chromatography
BP British Pharmacopeia
USP United State Pharmacopeia
APIs Active pharmaceutical ingredients
2D 2 dimension
3D 3 dimension
VI
ABSTRACT
Background: One of the major roles of the pharmaceutical analyst is to ensure
circulation of safe and effective drugs .Post marketing surveillance is normally
conducted out to verify this target.
To ensure this target the use of either known dependable method or developing
simple, accurate and precise method is required.
Objective: 1- Carry out post marketing surveillance for the assay of Norfloxacin
which is an important antibiotic of high frequency use and compare the results
obtained using direct zero order spectrophotometric method with first derivative
method.
2-Compare the quality of Norfloxacin brands with each other.
Method: The physicochemical parameters and assay of the four brands of
Norfloxacin tablets were assessed through the evaluation of uniformity of tablet
weight, friability, hardness, diameter , thickness, disintegration, and assay of active
ingredients according to established methods (BP and USP).
Results:All brands complied with the official specification for uniformity of
weight, friability, hardness, thickness, diameter and disintegration. The zero order
UV Visible spectrophotometric assay of Norfloxacin tablets revealed that three
samples contained over 90% and less than 100% (w/w) of labeled claim (Trizolin
97.6% ± 0.03 , Yesnorf 98.2%±0.43 and Norozal 93.03±0.002%) and one
sample contained more than 100% content (Anquin 101.43%±0.44).
The first derivative UV-Visible spectroscopy showed that three samples contained
over 100%content (Trizolin -103.83%±1.08 ,Anquin 101.71% ±0.016,Yesnorf
106.4%±0.16) and one sample contained less than 100% (Norozal 98.9%±0.03
content).

VII
Despite of these differences all brands pass the limits of assay according to BP (95-
105%) or USP (90-110%) limits.
Conclusion: The results evaluated by statistical analysis showed significant
difference in percentage content between the four brands. However, all the results
for the different brands were within specific BP and USP limits.
The methods are simple and rugged for routine analysis for batch-to-batch and
between brands quality control assessment.

VIII
المستخلص
احد اهم اهداف التحليل الصيدلاني هو مون ت تودا ل اد يون اننون . لون ا النواالون التح ليول ل.ود الخلفية:
التس يق تجوى ع دة لتحقيق هذا الهدفا الهدف ان ات نستخدم طويقن ن.و ن ن.تندة ا تط يو طويقن لسيطن دايقنالمن ت هذا
هو نوت النمو دال الحي يون Norfloxacinعنل التح ليل الصيدلانين ل.د التس يق لفحو عقو و -1 الهدف:
اله نن الش ئ.ن الاستخداما نع ل.مه الل.ضا Norfloxacinنق ونن ج دة ال.لان ل التج وين لد اء -2
نق ونن النت ئج التي تم الحص ل عليهو ل سوتخدام طويقون التحليول الطيفوي للاشو.ن النوئيون و ق اللنفسوجين -3
نع طويقن النشتقن الا لىاتوم تقيينوم نوت خولال Norfloxacinالطويقون النششووال الفيوي ميني ئيون حو الاول.ون عينو ل نوت د اء
القطوو السون, التفمو, حو النم نو ل الف. لون قو للاسو لي تقييم اختلاف الو وت التفتول الصولالن النتل.ناالاول.ن ان اع نت الد اء انتثلل للن اصف ل الوسنين لاختلاف ال وت التفتل الصلالن السون, النتائج:
القطو التفم,اثولا عينو ل تحتو نو يويود اختل و الاش.ن ق اللنفسجين الطيفين النوئين ي النست ى الصوفو يلويت ات
Trizolin 97.6%±0.03 ,Yesnorf وت( نووت النسوولن هووم \% ) وت100% ااوول نووت 90علووى 98.2%±0.43 and Norozal 93.03%±0.002 نوت الحتو ى 100 عينون احودة احتو ل امثوو نوت %
Anquin 101.43%±0.44 . % 100اظهو ا ل نشتق التحليل الطيفي للاش.ن ق اللنفسجين النوئين ات ثلا عين ل تحت امثو نت
Trizolin103.83%±1.08,Anquin101.71%±0.016,Yesnorf 106.4%±0.16 . نحت ى هم
% هي 100 عينن احدة تحت اال نت Norozal 98.9%±0.03ا
يع الاد ين منت الحد د الن م عن نت دست و الاد ين اللويط ني على الوغم نت هذه الاختلا ل جن
%(ا110-90ا الانويمي)\%( 95-105)
النت ئج التي اينل ل اسطن التحليل الاحص ئي لينل اختلا مليوا ي نحت ى الن دة الف. لن ليت الخلاصة:
النص نع داخل حد د دس تيو الد اء النصنع ل اسطن نص نع نختلفن نع ذل, م نل جنيع النت ئج لنختلف
ا الانويميا\الاد ين اللويط ني
الطوق النتل.ن ي الدواسن لسيطن . لن لتقييم الد اء نت د .ن لد .ن ي نفس النصنع ليت النص نع النختلفنا

IX
List of Figures
Figure number Title Page number
1 2D structure of Norfloxacin 3
2 3D structure of Norfloxacin 3
3 Scheme Synthesis of Norfloxacin 3
4 Derivatives Spectra of a Gaussian absorbance band 8
5 Absorption spectrum of standard Norfloxacin in zero
order UV.Visible spectrophotometric method
15
6 Calibration curve of zero order spectrophotometric
method of Norfloxacin
16
7 Absorption spectrum of Norfloxacin using 1st
derivative spectrophotometric method
19
8 Standard curve of Norfloxacin 1st derivative method 20

X
List of Tables Table number Title Page number
1 Brands of NOR and their sources 12
2 Concentrations of standard and corresponding
absorption ( zero order UV.Visible method)
16
3 Calculation steps of percentage content of NOR
in Trizolin tablets using zero order UV.Visible
spectrophotometry
17
4 Calculation steps of percentage content of NOR
in Anquin tablets using zero order UV.Visible
spectrophotometry
17
5 Calculation steps of percentage content of NOR
in Yesnorf tablets using zero order UV.Visible
spectrophotometry
18
6 Calculation steps of percentage content of NOR
in Norozal tablets using zero order UV.Visible
spectrophotometry
18
7 Concentrations of standard and corresponding
absorption(1st derivative UV.Visible method)
19
8 Calculation steps of percentage content of NOR
in Trizolin tablets by 1st derivative UV.Visible
spectrophotometry
20
9 Calculation steps of percentage content of NOR
in Anquin tablets by 1st derivative UV.Visible
spectrophotometry
21
10 Calculation steps of percentage content of NOR 21

XI
in Yesnorf tablets by 1st derivative UV.Visible
spectrophotometry
11 Calculation steps of percentage content of NOR
in Norozal tablets by 1st derivative UV.Visible
spectrophotometry
22
12 ANOVA table of Trizolin and Anquin tablets 23
13 ANOVA table of 1st Yesnorf and Norozal tablets 24
14 Results of physical tests 25

1
CHAPTER ONE
INTRODUCTION and
LITERATURE REVIEW

1
1.1. INTRODUCTION
Post-market surveillance or monitoring involves all undertaken activities to
obtain more data and information about a product after it had been granted
marketing authorization and made available for public use. The data and
information so obtained could be employed for product improvement, development
of standards and regulations.
Regulatory agencies rely on limited information obtained during clinical trials and
to some extent scientific literature as guides to granting marketing authorization of
medicines for public use.
It is therefore imperative to conduct post-market surveillance or monitoring of
approved medicines in order to adequately assess the quality, therapeutic
effectiveness and safety of medicines for the larger public(1) .
Post-market monitoring ought not to be a one off event rather it should be a
continuous event throughout the life of a drug product.
Activities of post market monitoring of a drug have been identified to include:
review of product’s condition of approved study; evaluation and investigation of
reported drug complaints; inspection of manufacturer’s processes and procedures
for production and complaint handling; market surveys of technical and clinical
documentation; review of product claims/labeling ; public access to information
taken and reported to the regulatory agency(ices) ; and in vitro testing of products
for compliance to standards (1)
Counterfeit and substandard medicines are a major cause of morbidity, mortality
and loss of public confidence in drugs and health structures (2).
To reduce the cost of medicines especially for the low income group of
developing countries, the World Health Organization (WHO) has continuously

2
advocated the use of generic brands (3) but this approach has not provided sufficient
evidence for the substitution of one brand for another.
The difference in cost between a branded and generic medicine may be as high as
90%.
To assist in substitution of branded with generics for affordability and at the same
time achieve therapeutic efficacy, bioequivalence studies become paramount (4)
Generic substitution could be considered when a generic copy of a reference drug
contains identical amounts of the same active ingredient in the same dose
formulation and route of administration as well as meet standards for strength,
purity, quality and identity (5).
Assay, Uniformity of weight, disintegration and dissolution are compendial
standards to assess the quality of tablets while hardness and friability are referred
to as non-compendial standards although friability is now included in the United
States Pharmacopeia (6).
Uniformity of weight does serve as a pointer to good manufacturing practices
(GMP) as well as amount of the active pharmaceutical ingredient (API)
Norfloxacin (NOR), chemically 1-ethyl-6-fluoro-1,4-dihydro-4-oxo-7-(1-
piperazinyl)-3-quinoline carboxylic acid(7) (figure 1)
Norfloxacin is the first synthetic second-generation fluoroquinolone antimicrobial
drug. It was developed for use in human and veterinary medicine (8).
The Chemical structure and synthesis of Norfloxacin are demonstrated in figures (1,2 and 3).

3
Figure (1) 2D Chemical Structure
figure( 2 )3D Chemical Structure
Scheme (1) Synthesis of Norfloxacin

4
1.2.Chemical and Physical Properties of Norfloxacin
1.2.1.color
White to light-yellow crystalline powder
1.2.2.Melting point
220-221 deg C
1.2.3.Solubility
In water , 0.28 mg/mL at 25 deg C. Solubility in water is pH dependent, increasing
sharply at pH<5 or pH >10
Solubility at 25 deg C (mg/mL): methanol 0.98; ethanol 1.9; acetone 5.1;
chloroform 5.5; diethyl ether 0.01; benzene 0.15; ethyl acetate 0.94; octyl alcohol
5.1; glacial acetic acid 340
1.3. Experimental Proberties:
1.3.1.Dissociation constant
pKa1 = 6.34; pKa2 = 8.75 (9)
1.3.2.Decomposition
When heated to decomposition it decompose to toxic fumes of hydrogen floride
and nitrogen oxides (10)
1.4.Activity:
Norfloxacin, occasionally used to treat common, as well as complicated urinary
tract infections, exhibits a broad spectrum of activity against Gram-positive and
Gram-negative bacteria (11-13). The mechanism of the bacterial effect of Norfloxacin
is based on the primary target in bacterial enzyme DNA gyrase and topoisomerase
II and IV. Inhibition of the activity of these enzymes disables DNA replication
which in turn, inhibits bacterial replication (14_15).
In addition, good tolerability and a favorable safety profile make the
fluoroquinolones important therapeutic options for the treatment of infections
caused by antibiotic-resistant bacteria (16)

5
1.5.Theoretical background Spectroscopy methods are the branch of science dealing with the study of
interaction between Electromagnetic radiation and matter. It is a most powerful
tool available for the study of atomic and molecular structure/s and is used in the
analysis of wide range of samples. Optical spectroscopy includes the region on
electromagnetic spectrum between 100 Å and 400 μm.(17 -18)
Spectroscopic techniques involve UV-Visible spectroscopy , fluorescence
spectroscopy , atomic absorption – emission spectroscopy , infrared spectroscopy ,
Mass spectroscopy , NMR spectroscopy and Raman spectroscopy .
Ultraviolet–visible spectroscopy or ultraviolet-visible spectrophotometry (UV-Vis
or UV/Vis) refers to absorption spectroscopy or reflectance spectroscopy in the
ultraviolet-visible spectral region (19).
Principal of UV.Visible spectroscopy that molecules containing π-electrons or non-
bonding electrons (n-electrons) can absorb the energy in the form of ultraviolet or
visible light to excite these electrons to higher anti-bonding molecular orbitals.
The more easily excited the electrons, the longer the wavelength of light it can
absorb(20).
UV/Vis spectroscopy is routinely used in analytical chemistry for the quantitative
determination of different analytes, such as transition metal ions, highly conjugated
organic compounds, and biological macromolecules. Spectroscopic analysis is
commonly carried out in solutions but solids and gases may also be studied (21).
The quantitative application of UV.Visible spectroscopy depends on Beer-Lambert
law.
The Beer-Lambert law states that the absorbance of a solution is directly
proportional to the concentration of the absorbing species in the solution and the
path length. Thus, for a fixed path length, UV/Vis spectroscopy can be used to

6
determine the concentration of the absorber in a solution. It is necessary to know
how quickly the absorbance changes with concentration. This can be taken from
references (tables of molar extinction coefficients), or more accurately, determined
from a calibration curve.(21)
The Beer-Lambert law (or Beer's law) is the linear relationship between
absorbance and concentration of an absorbing species. The general Beer-Lambert
law is usually written as:
A = a( ) * b * c
where A is the measured absorbance, a( ) is a wavelength-dependent absorptivity
coefficient, b is the path length, and c is the analyte concentration. When working
in concentration units of molarity, the Beer-Lambert law is written as:
A = * b * c
where is the wavelength-dependent molar absorptivity coefficient. Data are
frequently reported in percent transmission (I/I0 * 100) or in absorbance [A = log
I0/I]. The latter is particularly convenient.
Sometimes the extinction coefficient is given in other units; for example,
A = A1%1cm * b * c
where the concentration C is in gram per 100 ml of solution. This is useful when
the molecular weight of the solute is unknown or uncertain.
Derivative spectrophotometry is an analytical technique of great utility for
extracting both qualitative and quantitative information from spectra composed of
unresolved bands.The derivative method has found application not only in
ultraviolet-visible region spectrophotometry, but also in infrared,atomic-absorption

7
and flame emission spectrometry, and also in fluorimetry (normal’ and
synchronous scanning’)(22).
The use of derivative spectrometry is not restricted to special cases, but may be of
advantage whenever quantitative study of normal spectra is difficult. Its
disadvantage is that the differentiation degrades the signal-to-noise ratio, so that
some form of smoothing is required in conjunction with the differentiation.’(23)
The principals and objectives of derivatives spectroscopy is that correction of
interference by impurities ,conversion of irregular interference to linear one , then
the linear to a constant (the slope of the constant is zero) .
For quantitative purpose , 2nd and 4th derivatives spectra are the most used as they
give more sharp peaks which are more close to the reference peak.4th derivative
gives more slopes hence better detection for impurities or resolution.
The first derivative is the rate of change of absorbance against wavelength. It starts
and finishes at zero, passing through zero at the same wavelength as λmax of the
absorbance band.
This derivative has a positive and a negative band with maximum and minimum at
the same wavelengths as the inflection points in the absorbance band. This bipolar
function is characteristic of all odd-order derivatives. The most distinctive feature
of the second-order derivative is a negative band with minimum at the same
wavelength at the maximum on the zero-order band. This derivative also shows
two positive satellite bands on either side of the main band. The fourth derivative
shows a positive band with a maximum at the same wavelength as the maximum
on the zero order bands. Even-order derivatives show a negative or positive band
with minimum or maximum at the same wavelength as λmax on the absorbance
band (24)

8
figure (4) derivatives spectra of a Gaussian absorbance band

9
1.6.litrerature review
• Research workers in Nigeria reported Quality control assessment of four
brands of Norfloxacin tablets marketed in Nigeria. Predictions from DE
indicated that the brands were all bioequivalent and therefore
interchangeable with the innovator brand(25).
• In USP and BP Norfloxacin is assayed by high performance liquid
chromatography equipped with 275 nm detector and 3.9mm*30 cm column
that contains packing L1 (26)
Some other reported methods include:
• Simultaneous spectrophotometric estimation of Norfloxacin and Ornidazole
in tablet dosage form , using UV.Visiblespectrophotometer at 273 and
318.5 nm (27)
• Simultaneous determination of trace Norfloxacin, Pefloxacin and
Ciprofloxacin by TLC fluorescence Spectrodesitometry(28)
• Bioequivalence of Norfloxacin by HPLC-UV method. A simple, rapid and
convenient high performance liquid chromatographic method has been
developed for the determination and bioequivalence of Norfloxacin in
tablets formulations by using ciprofloxacin as an internal standard(29)
• A simple, accurate, sensitive and precise Ultraviolet specrophotometric
method has been developed for the determination of Norfloxacin in tablet
dosage form, the quantitative determination of the drug was carried at 277
nm.(30)

10
1.7.Research rationale:
Routine laboratory testing of drugs in the market is crucial to protect public health
especially in developing countries where counterfeit and substandard drugs have
become a major challenge to health care services.
There is an increasing need to evaluate the performance of a number of the
available fluoroquinolone antibacterial agents because of the unexplainable pattern
of microbial sensitivity to the members of this class of drugs. (31).
1.8.Objectives:
The Study was done to:
1. Assess the quality of Norfloxacin brand in Sudanese market and to ensure that
the label claim comply with the British pharmacopeia and/or US Pharmacopeia .
2.Apply derivative spectrophotometric method for the assay of all brands of
Norfloxacin marketed in sudan.
3. Compare the quality of the brands with each other.

11
Chapter Two
MATERIALS and METHODS
11
2.Materials and Methods
2.1.Instruments and Equipment:
1.UV.Visible spectrophotometer single beam :UV mini-1240, shimadzu
2.UV.Visible spectrophotometer double beam : SHIMADZU ,japan,model, UV
1800-240 V.
3.Sonicater; seial NO.A1145602050 CD.
4.Electronic balance: AX120. NO D432510585,capacity 120g, shimadzu
5.Friabilatortrommel:D-63150 Heusenstamm /Germany ,ERWEKA
6.Disintegration apparatus: ZT 321 HEUSENSTAMM / Germany
7.Hardness tester
8.Vernia caliper: thickness and diameter tester
9.Glass wares: volumetric flasks, volumetric pipettes, beakers, cylinder , funnel ,
conical flask: analytical grade. ISO lab
10.Filter paper: Whatman filter paper
11.Foil
2.2.Materials:
2.2.1.Chemicals:
1.HCL: 37% w/w, analytical grade ,ACS ,ISO, Germany
2.Distelled water
2.2.2.Standard:
3.Norfloxacin standard powder was supplied by Azal Pharmaceuticals, khartoum,
Sudan.

12
2.2.3.Sample
Brands of Norfloxacin and their sources summarized in table (2)
Table (1) Brands of Norfloxacin and their sources
Item Name Agent Manufacturer Country
Trizolin
400mg tablet Siho trading c Remedica ltd Cyprus
Anquin
400mg tablet Badr drugs
Lyka labs , ltd ,
Ankliahwar India
Yesnorf
400mg tablet
Shanghai,
Sudan
shanghai pharmacutical
co, Sudan
Norozal
400mg tablet
Azal
pharmacutical
azalpharmacuticalidustries
Co. ltd Sudan

13
2.3.Methods:
2.3.1.Preparation of stock solution:
100 mg of NOR was placed in 100 ml volumetric flask and dissolved in 75 ml of
0.1 N HCL and the volume was made up to the mark with 0.1NHCL . 10 ml of the
solution was diluted up to 100 ml with 0.1 N HCL to produce final stock solution
of 100 μg/ml of NOR .
2.3.2.Sample preparation
Twenty tablets were taken, powdered and powder weight equivalent to 100 mg of
NOR was accurately taken and transferred to a 100 ml volumetric flask. 70 ml of
0.1N HCL added and sonicated for 30 min ,the flask was shaken before the volume
was diluted to the mark with the same solvent (solution A). The above solution was
filtered using whatman filter paper no. 1.
10 ml of solution A was transferred to a 100 ml volumetric flask and the volume
was made up to the mark with 0.1NHCL (solution B). 3 ml of solution B was then
transferred to 50 ml volumetric flask and made up to the mark with 0.1 N HCL
(solution C) final concentration of about 6 μg/ml . The absorbance of solution C
was read at 277 nm against blank for all brands using UV.Visible
spectrophotometer.
2.3.3.Construction of standard curve
Serial dilutions from stock solution were made to obtain concentrations of 2 , 4 , 6 ,
8 , 10 , 12 μg/ml .The absorbance of each solution was read at 277 nm wave
length using UV.Visible spectrophotometer… Standard curve was then constructed
for absorbances versus concentrations.

14
2.3.4.Derivative Spectrophotometric method:
The standard stock solution(100 μg/ml). and the sample solution used for the
derivative method were prepared as mentioned under zero order method. The
prepared solutions were scanned using UV.Visible spectrophotometer in the 1st
derivative mode.
2.3.5.Physical tests
2.3.5.1.Weight variation test
Twenty tablets were randomly selected, individually weighed, the
Average weight , standard deviation and weight variation of twenty tablets were
calculated.
2.3.5.2.Diameter
Diameter of the 10 tablets were determined using Vernier caliper and average
value was calculated.
2.3.5.3.Thickness
Thickness of the 10 tablets were determined using Vernier caliper and an average
value was calculated.
2.3.5.4.Hardness
Hardness of the 10 tablets were tested using a Monsanto Hardness tester and an
average value was calculated.
2.3.5.5.Friability
Friability of the tablets was determined in a friabilator (Friabilatortrommel). Ten
tablets were weighed initially (w1) and placed in the friabilator that revolves at a
speed of 25 rpm, dropping those tablets at a distance of six inches height with each
revolution and rotated in the friabilator for 100 revolutions. After completion of
rotations, the tablets were dedusted and weighed (w2).
The percent loss in weight or friability (f) is calculated by
using the formula. f = (w1-w2)/w1 x100
2.3.5.6. Disintegration test
The disintegration test was performed using water as disintegration medium and
the temperature maintained at 37±2°C . The time in minutes required for complete
disintegration with no palpable mass remaining in the apparatus was then recorded.

15
Chapter Three
RESULTS

15
3.Results
The results of these work are summarized in (13) tables and (4) figures
3.1. Zero order spectrophotometric method:
Absorbtion spectrum of standard Norfloxacin shown in figure (5)
Figure (5) Zero order absorption spectrum of standard Norfloxacin
(concentration ..6 μg/ml)
3.1.1.Standard curve of simple spectrophotometric method
The obtained absorbance values at 277nm are shown in table (2)

16
Table (2) Absorbance values for the prepared concentrations at lambda max
277nm:
concentration
(μg/ml) Absorbance
2 0.257
4 0.514
6 0.762
8 1.03
10 1.287
12 1.546
r=0.9999 a= -2*10E-4 b=0.1282
Figure (6) Calibration curve of Norfloxacin standard using zero order
spectrophotometric method (absorbances VS concentrations)
y = 0.129x - 0.0039R² = 0.9999
0
0.2
0.4
0.6
0.8
1
1.2
1.4
1.6
1.8
0 2 4 6 8 10 12 14
Series1
Linear (Series1)

17
3.1.2.Assay of Norfloxacin tablets using zero order
spectrophotometric method:
The % content of tablets were determined using calibration curve . Results
obtained are shown in tables (3- 6).
3.1.2.1.TRIZOLIN
Table (3): Calculation of percentage content of Norfloxacin in Trizolin by zero
order UV.Visible spectrophotometric method
3.1.2.2.ANQUIN
Table (4): Calculation of percentage content of Norfloxacin in Anquin by zero
order UV.Visible spectrophotometric method
Anquin
weight
taken(gm) absorpance
theoretical
concn
(μg/ml)
practical
concn(μg/ml)
percentage
content
sample1 0.1413 0.738 5.7025 5.7562 101.05%
sample2 0.1488 0.778 6.0052 6.0681 101.04%
sample3 0.1439 0.761 5.8074 5.9356 102.20%
Trizolin weight taken(gm)
Absorbanc theoretical concn
(μg/ml)
practical concentration
(μg/ml) percentage content
sample 1 0.14139 0.717 5.7408 5.5925 97.40%
sample 2 0.1382 0.732 5.844 5.7094 97.70%
sample 3 0.141 0.747 5.9627 5.8264 97.70%

18
3.1.2.3.YESNORF
Table (5): Calculation of percentage content of Norfloxacin in
Yesnorf by zero order UV.Visible spectrophotometric method
Yesnorf
weight
taken(gm)
Absorpance
theoretical
concn(μg/ml)
practical
concn
(μg/ml)
percentage
content
sample
1 0.1685
0.755
5.9561 5.8888 98.80%
sample
2 0.1691
0.752
5.9773 5.8654 98.30%
sample
3 0.1679
0.742
5.9349 5.7874 97.50%
3.1.2.4.NOROZAL
Table (6) Calculation of percentage content of Norfloxacin in
NOROZAL by using zero order UV.Visible spectrophotometric
method
Noroza
l
weight
taken(gm
)
Absorpanc
e
theoretical
concentration(μg/ml
)
Practica
l concn
(μg/ml)
percentag
e content
sample
1 0.1708
0.716
5.999 5.5847 93.09%
sample
2 0.171
0.715
6 5.5832 93.00%
sample
3 0.1712
0.717
6.013 5.5925 93.00%
19
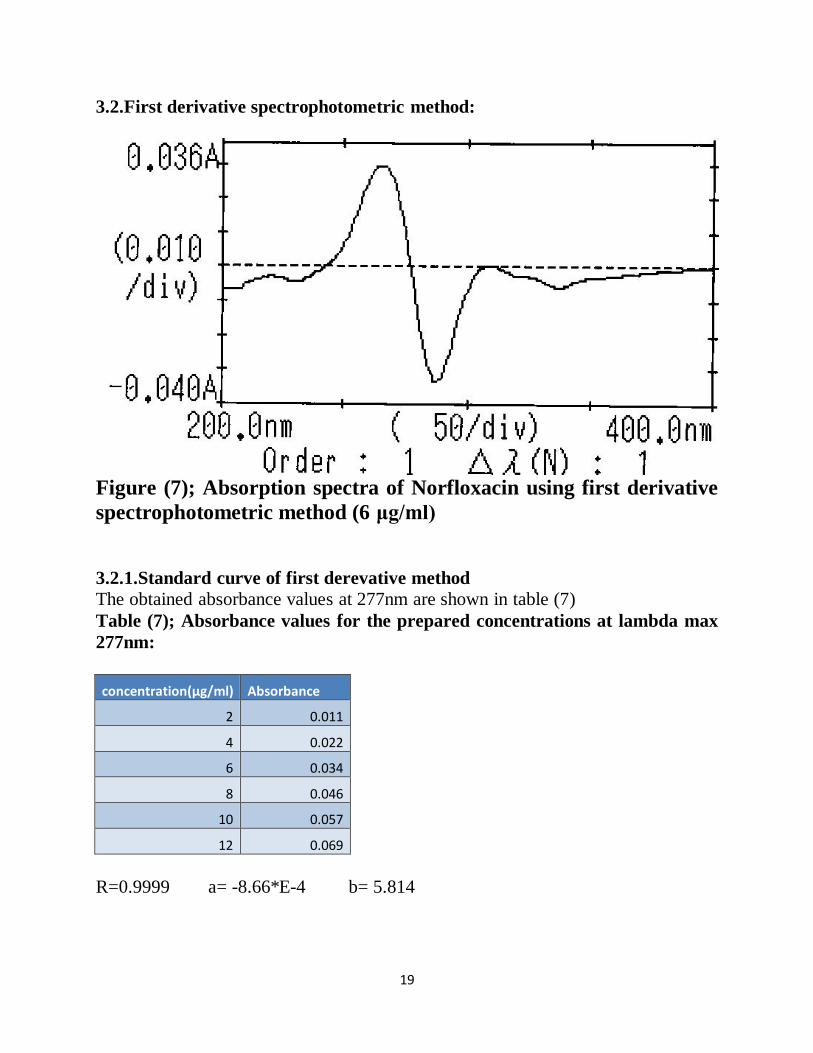
3.2.First derivative spectrophotometric method:
Figure (7); Absorption spectra of Norfloxacin using first derivative
spectrophotometric method (6lμg/ml)
3.2.1.Standard curve of first derevative method
The obtained absorbance values at 277nm are shown in table (7)
Table (7); Absorbance values for the prepared concentrations at lambda max
277nm:
concentration(μg/ml) Absorbance
2 0.011
4 0.022
6 0.034
8 0.046
10 0.057
12 0.069
R=0.9999 a= -8.66*E-4 b= 5.814

20
Figure (8) Standard curve of NOR for first derivative method
3.2.2. Assay of Norfloxacin tablets using first derivative
spectrophotometric method:
The % content of tablets were determined using calibration curve .results obtained
are shown in tables(8-11)
3.2.2.1.Trizolin
Table (8); Calculation of percentage content of Norfloxacin in
Trizolin using first derivative spectrophotometric method.
Trizolin
Weight
taken(gm)
Absorbance
Theoretical
concentration(μg/ml)
practical
concn
(μg/ml)
Percent-
age
content
sample
1 0.1527
0.038
6.4586 6.6846 103.50%
sample
2 0.1507
0.038
6.3552 6.6846 105.00%
sample
3 0.1561
0.039
6.6022 6.8566 103.70%
y = 0.0058x - 0.0009R² = 0.9998
0
0.01
0.02
0.03
0.04
0.05
0.06
0.07
0.08
0 2 4 6 8 10 12 14
Series1
Linear (Series1)

21
3.2.2.2.ANQUIN
Table (9); Calculation of percentage content of Norfloxacin in Anquin using
first derivative spectrophotometric mthod
Anqui
n
weight
acually
taken(gm
)
Absorbanc
e theoretical
concentration(μg/ml
)
Practic-
al
concn
(μg/ml)
Percentag
-e content
sample
1 0.1504
0.035
6.069 6.1687 101.60%
sample
2 0.1668
0.039
6.732 6.8566 101.85%
sample
3 0.1629
0.038
6.574 6.6846 101.68%
3.2.2.3.YESNORF
Table (10); Calculation of percentage content of Norfloxacin in Yesnorf using
first derivative spectrophotometry
Yesnorf
weight acually taken(gm)
Absorbance theoretical concentration(μg/ml)
practical concn (μg/ml)
percentage content
sample 1 0.1685
0.036 5.956122 6.340704 106.40%
sample 2 0.1691
0.036 5.97732 6.340704 106.00%
sample 3 0.1679
0.036 5.9349 6.340704 106.80%

22
3.2.2.4.NOROZAL
Table (11); Calculation of percentage content of Norfloxacin in Norozal using
first derivative spectrophotometric method
norozal
weight
acually
taken
(gm)
Absorbance
theoretical
concentration
(μg/ml)
practical
concn
(μg/ml)
percentage
content
sample
1 0.1716
0.034
6.0144 5.9445 98.80%
sample
2 0.1712
0.034
6.0009 5.9445 99.00%
sample
3 0.171
0.034
5.9935 5.9445 99.17%

23
3.3.statistical analysis
Table (12): ANOVA table for Trizolin and Anquin..for tables (3, 4,8,9))
Anova: Single Factor for Trizolin
SUMMARY
Groups No. of
determinant sum of
% Average Variance
zero order 3 292.8 97.6 0.03
first order 3 312.2 104.0667 0.663333
ANOVA
Source of Variation SS df MS F P-value F crit
Between Groups 62.72667 1 62.72667 180.9423 0.000177 7.708647
Within Groups 1.386667 4 0.346667
Total 64.11333 5
Anova: Single Factor for Anquin
SUMMARY
Groups No. of
determinant sum of
% Average Variance
zero order 3 304.29 101.43 0.4447
first order 3 305.13 101.71 0.0163
ANOVA
Source of Variation SS df MS F P-value F crit
Between Groups 0.1176 1 0.1176 0.510195 0.514522 7.708647
Within Groups 0.922 4 0.2305
Total 1.0396 5

24
Table (13): ANOVA table for Yesnorf and Norozal..for tables
(5,6,10,11)
Anova: Single Factor for Yesnorf
SUMMARY
Groups Count Sum Average Variance
zero order 3 294.6 98.2 0.43
first order 3 319.2 106.4 0.16
ANOVA
Source of Variation SS df MS F P-value F crit
Between Groups 100.86 1 100.86 341.8983 5.03E-
05 7.708647
Within Groups 1.18 4 0.295
Total 102.04 5
Anova: Single Factor for Norozal
SUMMARY
Groups Count Sum Average Variance
zero order 3 279.09 93.03 0.0027
first order 3 296.97 98.99 0.0343
ANOVA
Source of Variation SS df MS F P-value F crit
Between Groups 53.2824 1 53.2824 2880.13 7.22E-
07 7.708647
Within Groups 0.074 4 0.0185
Total 53.3564 5
Ss= sum of squares df= degree of freedom ms=mean square p-value=propability Fcrit= F critical
25
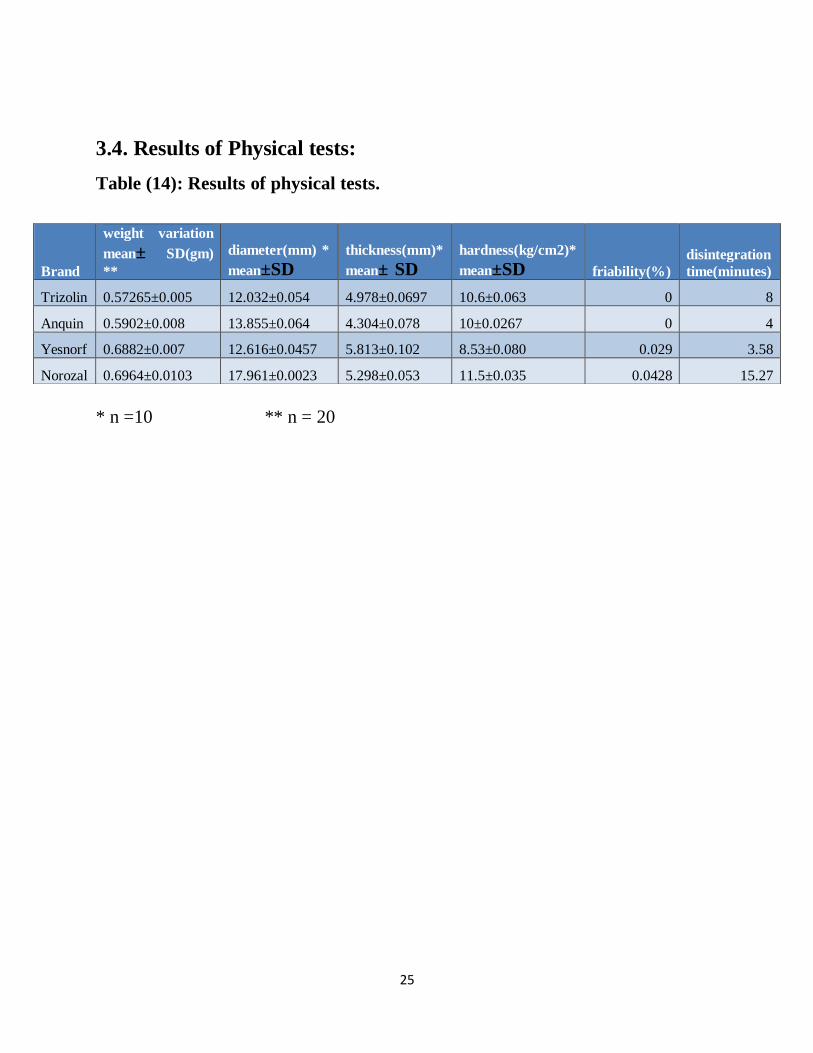
3.4. Results of Physical tests:
Table (14): Results of physical tests.
* n =10 ** n = 20
Brand
weight variation
mean± SD(gm)
**
diameter(mm) *
mean±SD
thickness(mm)*
mean± SD
hardness(kg/cm2)*
mean±SD friability(%)
disintegration
time(minutes)
Trizolin 0.57265±0.005 12.032±0.054 4.978±0.0697 10.6±0.063 0 8
Anquin 0.5902±0.008 13.855±0.064 4.304±0.078 10±0.0267 0 4
Yesnorf 0.6882±0.007 12.616±0.0457 5.813±0.102 8.53±0.080 0.029 3.58
Norozal 0.6964±0.0103 17.961±0.0023 5.298±0.053 11.5±0.035 0.0428 15.27

26
Chapter Four
DISSCUSION ,CONCLUSION and
RECOMMENDATIONS

26
4.1.Discussion:
Pharmaceutical Analysis may be defined as the application of analytical
procedures used to determine the purity, safety and quality of drugs and chemicals.
In recent years, the number of counterfeit drugs has increased dramatically,
including not only "lifestyle" products but also vital medicines. Besides the threat
to public health, the financial and reputational damage to pharmaceutical
companies is substantial. The lack of robust information on the prevalence of fake
drugs is an obstacle in the fight against drug counterfeiting. It is generally accepted
that approximately 10% of drugs worldwide could be counterfeit, but it is also well
known that this number covers very different situations depending on the country,
the places where the drugs are purchased, and the definition of what constitutes a
counterfeit drug. The chemical analysis of drugs suspected to be fake is a crucial
step as counterfeiters are becoming increasingly sophisticated, rendering visual
inspection insufficient to distinguish the genuine products from the counterfeit
ones. Analytical methods employed to control the quality of drug formulations, .a
broad panel of techniques, ranging from simple and cheap in-field ones include:
spectroscopic methods UV/Visible spectrophotometry(zero ,first,second…etc
orders) to more advanced laboratory methods (mass spectrometry, nuclear
magnetic resonance, and vibrational spectroscopies) through chromatographic
methods, which remain the most widely used. (32).
For all these reasons mentioned above it was deemed important to carry post
marketing surveillance for important class of antibiotics ( Flouroquinolones)..the
target drug in these work brands of Norfloxacin.
The results of the conducted post marketing surveillance of Norfloxacin in sudan
are summarized in tables (2-11) and figures(5-8).
As shown in the above mentioned tables and figures , all brands were complying
with specifications of the BP (95-105%) and/or USP(90-110%).
27
Anquin shows the best percentage content with mean percentage = 101.43% ±
0.44(when assayed by zero order UV.Visible spectrophotometry) and 101.71% ±
0.02(when assayed by 1st derivative spectrophotometry).
The results for the other brands were as follow, Trizolin
97.6±0.03 and 103. 8%±1.08, Yesnorf 98.2%±0.43 and 106.4%±0.16 , Norozal
93.03%±0.003 and 98.99%±0.03 for zero order and 1st derivative
spectrophotometry respectively .
Statistical analysis of the results obtained for the four brands (table 12 and 13). The
statistical analysis for Trizolin using Anova single factor revealed that F calculated
=180.94 which more than F tabulated= 7.7 and P-value =0.00017 which less than
0.05 at 95% confidance interval , thus there is significant difference in the results.
For Anquin F calculated = 0.510195 less than Ftabulated= 7.7 and P-value= 0.5145
more than 0.05 , thus there is no significant difference in the results.
For Yesnorf F calculated=341.8 more than F tabulated= 7.7 and P-value = 5.03E-
05 less than 0.05 , thus there is significant difference between results.
For Norozal F calculated = 2880.13 more than F tabulated 7.7 and P value =7.22E-
07 less than 0.05 and hence there is significant difference between results.
These significant difference in % content may be due to that zero order and first
order assay are not carried out in the same day with same sample ,but they done in
different days ,also may be due to inconsistency of the scale in first derivative
spectrophotometry.
The results of the physical test carried( thickness, hardness, friability, weight
variation, uniformity of content and disintegration time) are summarized in table
(14).
Variation between tablet with respect to dose and weight must be reduced to a
minimum through good manufacturing practice (GMP) .Uniformity of weight is a

28
parameter which ensures consistency of dosage units during compression and in
finished product.(33)
As shown in the mentioned above table the weight lies between 0.565 mg -0.581
mg (Trizolin) , 0.574 mg - .612 mg (Anquin) , 0.679 mg – 0.707 mg (Yesnorf) and
0.679 mg – 0.712 mg (Norozal) .However, all the tablets passed weight variation
test as the % weight variation was within the Pharmacopoeial limits. The weight of
all the tablets was found to be comply with the BP and USP standards (uniform,
with low standard deviation values indicating efficient mixing of drug,
superdisintegrants and excipients) the percentage deviatiorn not exceed ± 5%
(tablet weight more than 250 mg in BP and more than 324 mg in USP).(26,34)
Diameters are also important feature in quality testing of tablets. based on the
results obtained and calculated, the diameter lies in the range of 11.97 mm and
12.14 mm for trizolin. 13.81 mm and 14.03 mm for anquin.17.85 mm and 18.01
for norozal.12.59 mm and 12.71 for yesnorf. The percentage deviation from
average not exceeded ± 3%.the four brands comply with the standard that if tablet
diameter more thn 12mm ,the percentage deviation should not exeed ± 3%.(33)
Tablets thickness should be controlled to ensure uniformity in tablets appearance
and fitting into the containers for packaging process. for Anquin 4.3±0.07 ,
Trizolin 4.97±0.06 , Yesnorf 5.8±0.1 and Norozal 5.29±0.05. (33) all brands of
NOR have uniform thickness with low SD .
Hardness is also one of the important parameters measured. Averagely, all the
tablets are strong enough to withstand the pressure applied. The hardness of tablets
is important to withstand the mechanical shocks during the tablets manufacturing,
packaging and transport. If the tablets are too hard, it may not disintegrate in
required period of time and if it is too soft, it may break during the handling of
manufacturing or packaging process.

29
The brand Yesnorf required the least pressure before fracture 8.53±0.08 while
brand Norozal required the most pressure before fracture 11.5±0.0354. A force of
about 4 kg is the minimum requirement for a satisfactory tablet (33)
Friability test is used to determine the physical strength or tablets resistance to
abrasion.All four brands of NOR passed the test with no cracked, cleaved or
broken tablet ,and the weight loss was less than 1%w/w (33)
Disintegration test was done to determine whether tablets disintegrate within the
prescribed time and conditions when placed in a liquid medium.
Disintegration could be directly related to dissolution and subsequent
bioavailability of a drug. A drug incorporated in a tablet is released rapidly as the
tablet disintergrates. This is a crucial step for immediate release dosage forms
because the rate of disintegration affects the dissolution and subsequently the
therapeutic efficacy of the medicine. All the brands complied with the compendial
specifications for disintegration. The BP specification is that uncoated tablets
should disintegrate within 15 min and film coated in 30 min while USP specifies
that uncoated and film coated tablets should disintegrate within 30 min. and if there
is a residue remaining it should be soft mass having no palpably firm core) and
satisfying the criteria of fast dissolving tablets.(26,34)
The four brands of NOR passed the test with the least time for disintegration
showed by Norozal (4 minutes) and longest time for Anquin with (15.2 minutes) .8
minutes for Trizolin and 3.58 minutes for Yesnorf.

30
4.2.Conclusion
This study proved that the four brands (Trizolin , Anquin ,Yesnorf and Norozal )
comply with the pharmacopieal standards in percentage content of APIs (BP and/or
USP)and physical tests including weight uniformity, hardness , friability , diameter
, thickness and disintegration time .
The presented quality control methods (zero order and 1st derivative UV.Visible
spectrophotometry) proved to be useful in monitoring the production consistency
of batch-to-batch product release of each brand of Norfloxacin and in comparing
the quality characteristics of different brands marketed.
4.3.Recommendations:
It is very important to do post marketing surveillance of drugs especially for those
drugs used in chronic diseases and antibiotic ,this is because of the universally
reported counterfeit and substandard drugs.

31
6.References
1. Hennessy , Garcia . Post marketing drug surveillance: an epidemiologic
approach .Clin .Ther.20(suppl 3):32-39.
2 . Cock burn R , Newton PN , Agyarko EK ,Alkunyili D , White NJ,. (2005)the
Global Threat of counterfeit drugs : why industry and Government Must
Communicate the Dangers . ,Plos Med .2 (4) p100 .
3. World Health organization(2004-2007) ,WHO medicines strategy , countries at
the core ..p.68.
4. US Food and drug administration (2003). Center for drug evaluation and
research ,FDA ,.
5. Meredith P.,(2003).Bioequivalence and other unresolved issues in generic drug
substitution .;25(11):2875-2890.
6. US Pharmacopeia National formulary,.(1995) USP 23/NF 18, United States
pharmacopieal convention lnc.Rockville ,
7. United State Pharmacopoeia.,(2003), 26th Edn., Asian Edn., United State
Pharmacopoeial Convention Inc., Twin Brook Parkway, RockVille, MD,pg 1334.
8. Pavithra BH, Prakash N, Jayakumar K (2009) Modification of pharmacokinetics
of norfloxacin following oral administration of curcumin in rabbits. J Vet Sci 10:
293-297.
9. O'Neil, M.J. (ed.). (2006)The Merck Index - An Encyclopedia of Chemicals,
Drugs, and Biologicals. Whitehouse Station, NJ: Merck and Co., Inc.,., p. 1158.
10. Lewis, R.J. Sr. (ed) (2004)., Sax's Dangerous Properties of Industrial Materials.
11th Edition. Wiley-Interscience, Wiley & Sons, Inc. Hoboken, NJ.., p. 333.
11. Boyd LB, Maynard MJ, Morgan-Linnell SK, Horton LB, Sucgang R, et al.
(2009) Relationships among ciprofloxacin, gatifloxacin, levofloxacin, and

32
norfloxacin MICs for fluroroquinolone-resistant Escherichia coli clinical isolates.
Antimicrob Agents Chemother 53: 229-234.
12. Qadri SM, Johnson S (1989) Antibacterial activity of norfloxacin against
bacterial isolates from the urinary tract. J Natl Med Assoc 81: 382-385.
13. Nicolle LE, Harding GK, Thompson M, Kennedy J, Urias B, et al. (1989)
Prospective, randomized, placebo-controlled trial of norfloxacin for the
prophylaxis of recurrent urinary tract infection in women. Antimicrob Agents
Chemother 33: 1032-1035.
14.Hsu YH, Chung MW, Li TK (2006) Distribution of gyrase and topoisomerase
IV on bacterial nucleoid: implications for nucleoid organization. Nucleic Acids
Res 34: 3128-3138.
15. Morgan-Linnell SK, Boyd LB, Steffen D, Zechiedrich L (2009) Mechanisms
accounting for fluoroquinolones resistance in Escherichia coli clinical isolates.
Antimicrob Agents Chemother 53: 235-241.
16. Leeming JP, Diamond JP, Trigg R, White L, Hoh HB, et al. (1994) Ocular
penetration of topical ciprofloxacin and norfloxacin drops and their effect upon
eyelid flora. Br J Ophthalmol 78: 546-548.
17. Willard-Hobart H, Merritt Jr Lynne L, Dean John A (1974) Instrumental
Methods of Analysis. (5thedn), Von Nostrand, University of Michigan.
18. ChatwalGR, Anand S (2002) Instrumental Methods of Chemical Analysis.
(5thedn), Himalaya Publishing House, New Delhi.
19. SKeeg , Douglas A; Holler, F.Jrnes;Crouch , Stanley R. (2007) Principles of
instrumental analysis (6 thed).Belmont .;Thomson Brooks pp.169-173.
20. Metha ,Akul . PrinciplepharmaX change .info.13 Dec 2011.

33
21. Metha ,Akul.Derivatives of Beers lambert law. pharmaX change .
22. Snelleman W, .Rains TC..Yee K W ,.Cook H D and .Menis O ibid
.a970;42,394.
23. Haver T.C.O and T.Begley.ibid.,1981;53,1876.
24. Fundamentals of modern UV visible spectroscopy. Tony owen, Germany
publication no.5980-1397E P 8-10.
25. NgoziNwodo ,IkemUzochkwn and Edwin OgechnkwnOmeje ,Quality control
assessement and the possibility of interchangeability between
multisourcedNorfloxacin tablets in Nigeria.
26. USP 29-NF 24,Norfloxacin tablet, page 1560 .USP pharmacopieal
convention,page 905,2040.
27. Wankhede SB , Prakash A, Chilange SS; Simultaneous spectrophotometric
estmation of Norfloxacin and OrnidazoleI in tablet dosage form, International
journal of chem. Tech Research V1,1no.4.pp 937-940.
28. Saad A.AL-Tamrah, Mohammed A.Abdalla,Abdallah A.AL-Otibi,
Simultaneous determination of trace norfloxacin, pefloxacin and ciprofloxacin by
TLC fluorescence spectrodesitometry,Arabian journal of chemistry .
29. Wang P,Feng Y, .Chen L(1997) , Bioequivalence of Norfloxacin by HPLC-UV
method, Microchem, j 56(2),;p 229.
30. Inamullaha, Sunil Singha*, SurabhiSharmab, Ajit Ku. Yadavc,
HemendarGautamd(2012), Estimation of norfloxacin in tablet dosage form by
using UV-VisSpectrophotometer, Scholars Research Library, Der Pharmacia
Lettre, , 4 (6):1837-1842.

34
31. Andriole, V. T. (1988) Clinical overview of the newer quinoloneantibacterial
agents. In The Quinolones, 1st ed.;Andriole, V. T., Ed.; Academic Press Ltd.:
London, UK,; pp 155–200.
32. Martino R1 ,Malet .Martino M ,Gilard V ,Balayssacs.,(2010 sep). Counterfeit
drugs ,analytical techniques for their identification , Anal Biocinal chem., 398 (1)
:7792.
33. Allen LV, Popovich NG, Ansel HC. (2004). "Ansel's pharmaceutical dosage
forms and drug delivery systems" in, 8th Edition edn, Lippincott Williams &
Wilkins, Philadelphia.; p. 236,240.
34.British Pharmacopiea, ,(2011), consistency of formulated preparation .