post-pandemic project prioritization: how economic
TRANSCRIPT
Post-Pandemic Project Prioritization:
How Economic Modeling Assess
Socioeconomic Indicators (SEI) for
Long-term Planning
Regional Economic Models, Inc.
James Clark-Stewart, Associate I
Guyesha Blackshear, Analyst
Guyesha Blackshear
Analyst
Speakers
James "Jim" C. Stewart
Associate I
Introduction
Methodology
Case study
Topic overview
Notable results
Conclusion
Q&A
Agenda
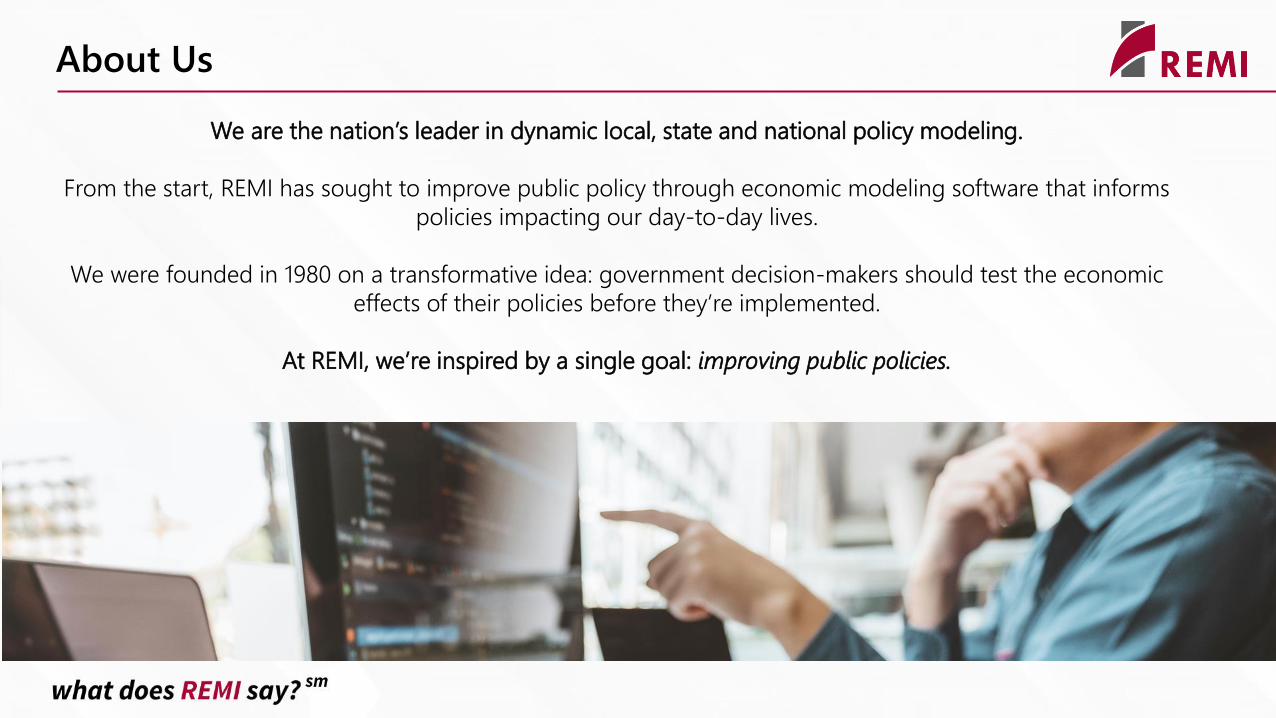
About Us
We are the nation’s leader in dynamic local, state and national policy modeling.
From the start, REMI has sought to improve public policy through economic modeling software that informs
policies impacting our day-to-day lives.
We were founded in 1980 on a transformative idea: government decision-makers should test the economic
effects of their policies before they’re implemented.
At REMI, we’re inspired by a single goal: improving public policies.
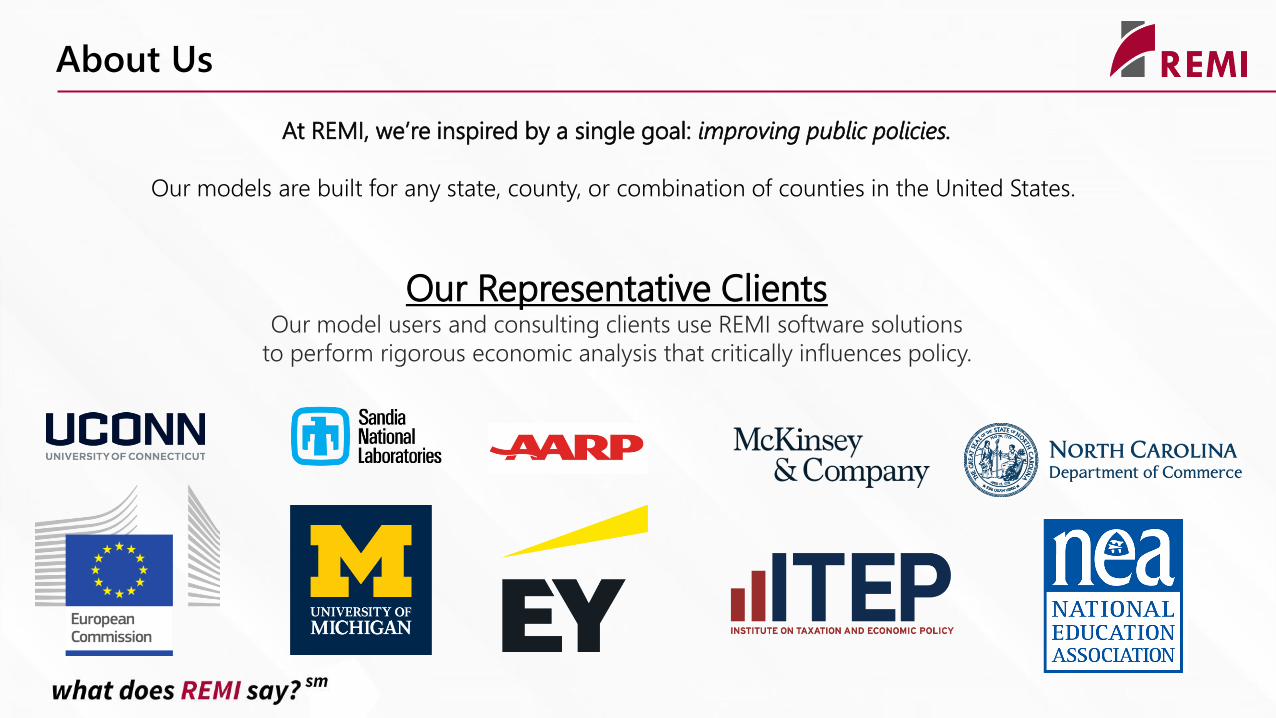
About Us
At REMI, we’re inspired by a single goal: improving public policies.
Our models are built for any state, county, or combination of counties in the United States.
Our Representative ClientsOur model users and consulting clients use REMI software solutions
to perform rigorous economic analysis that critically influences policy.
Introduction
Methodology
Case study
Topic overview
Notable Results
Conclusion
Q&A
Agenda
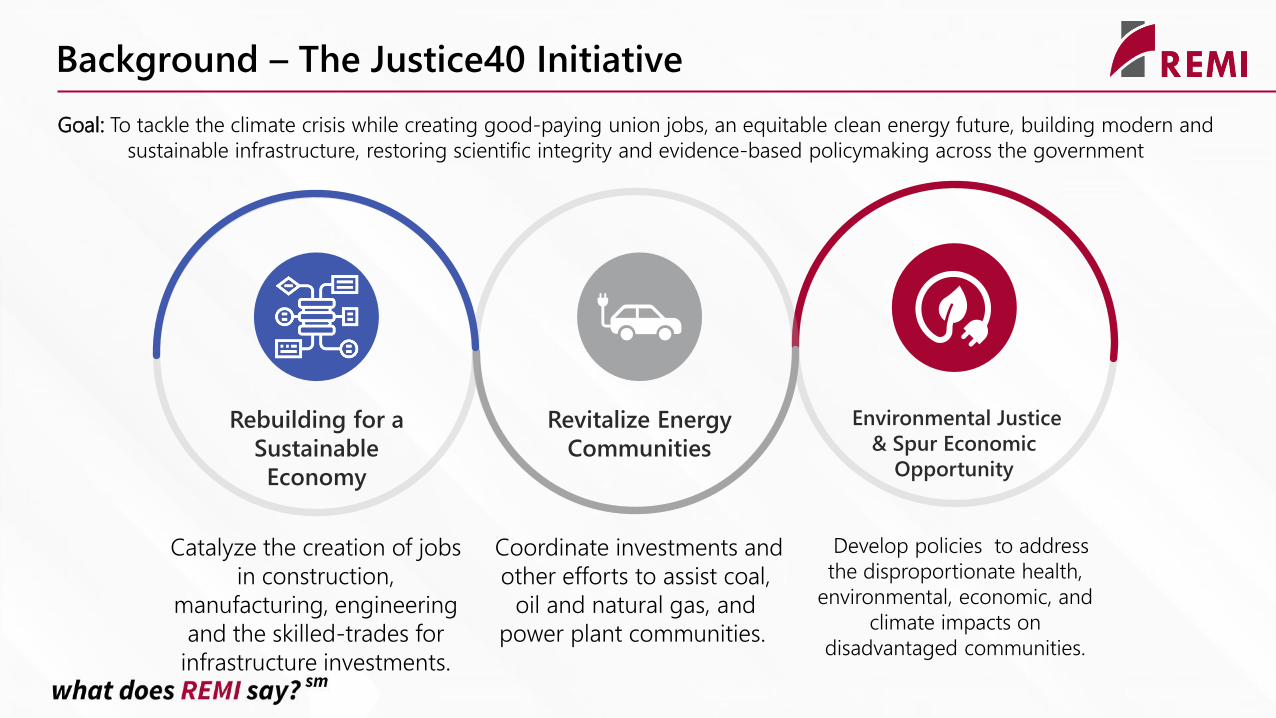
Catalyze the creation of jobs
in construction,
manufacturing, engineering
and the skilled-trades for
infrastructure investments.
Coordinate investments and
other efforts to assist coal,
oil and natural gas, and
power plant communities.
Develop policies to address
the disproportionate health,
environmental, economic, and
climate impacts on
disadvantaged communities.
Rebuilding for a
Sustainable
Economy
Revitalize Energy
Communities
Environmental Justice
& Spur Economic
Opportunity
Background – The Justice40 Initiative
Goal: To tackle the climate crisis while creating good-paying union jobs, an equitable clean energy future, building modern and
sustainable infrastructure, restoring scientific integrity and evidence-based policymaking across the government
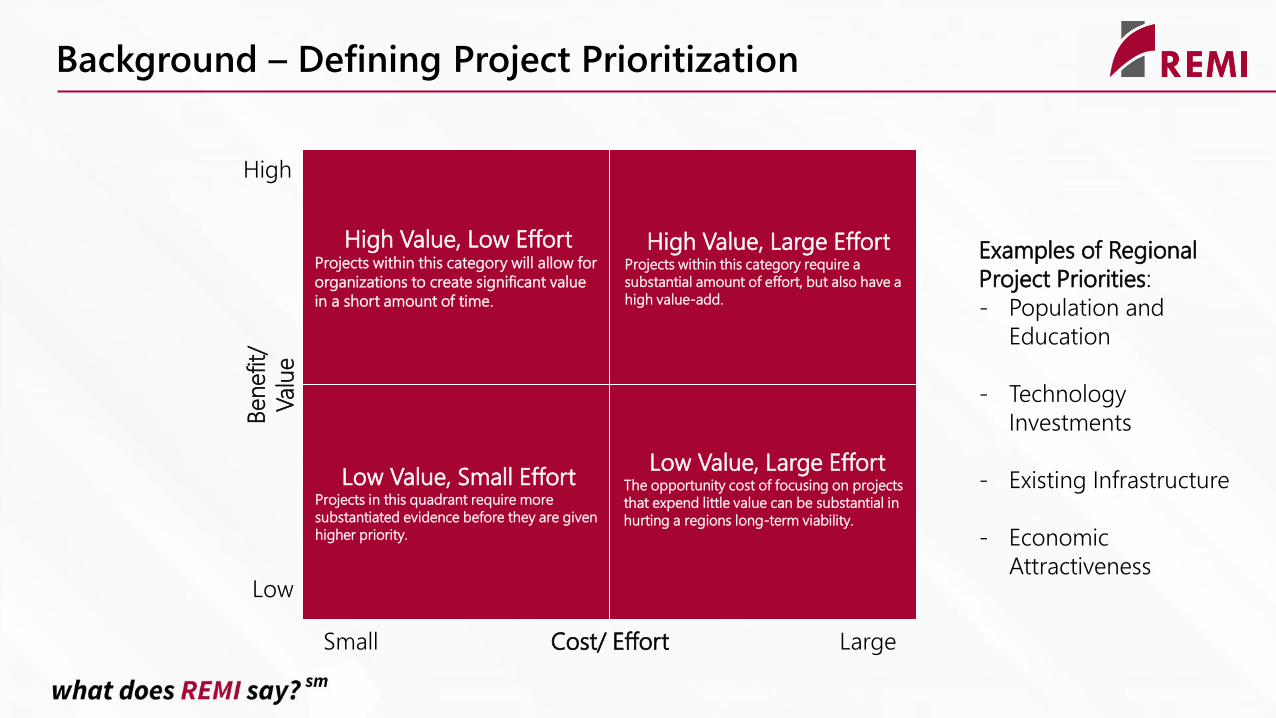
Low Value, Large EffortThe opportunity cost of focusing on projects
that expend little value can be substantial in
hurting a regions long-term viability.
Low Value, Small EffortProjects in this quadrant require more
substantiated evidence before they are given
higher priority.
High Value, Low EffortProjects within this category will allow for
organizations to create significant value
in a short amount of time.
High Value, Large EffortProjects within this category require a
substantial amount of effort, but also have a
high value-add.
Benefit/
Valu
e
High
Small Cost/ Effort
Low
Large
Background – Defining Project Prioritization
Examples of Regional
Project Priorities:
- Population and
Education
- Technology
Investments
- Existing Infrastructure
- Economic
Attractiveness
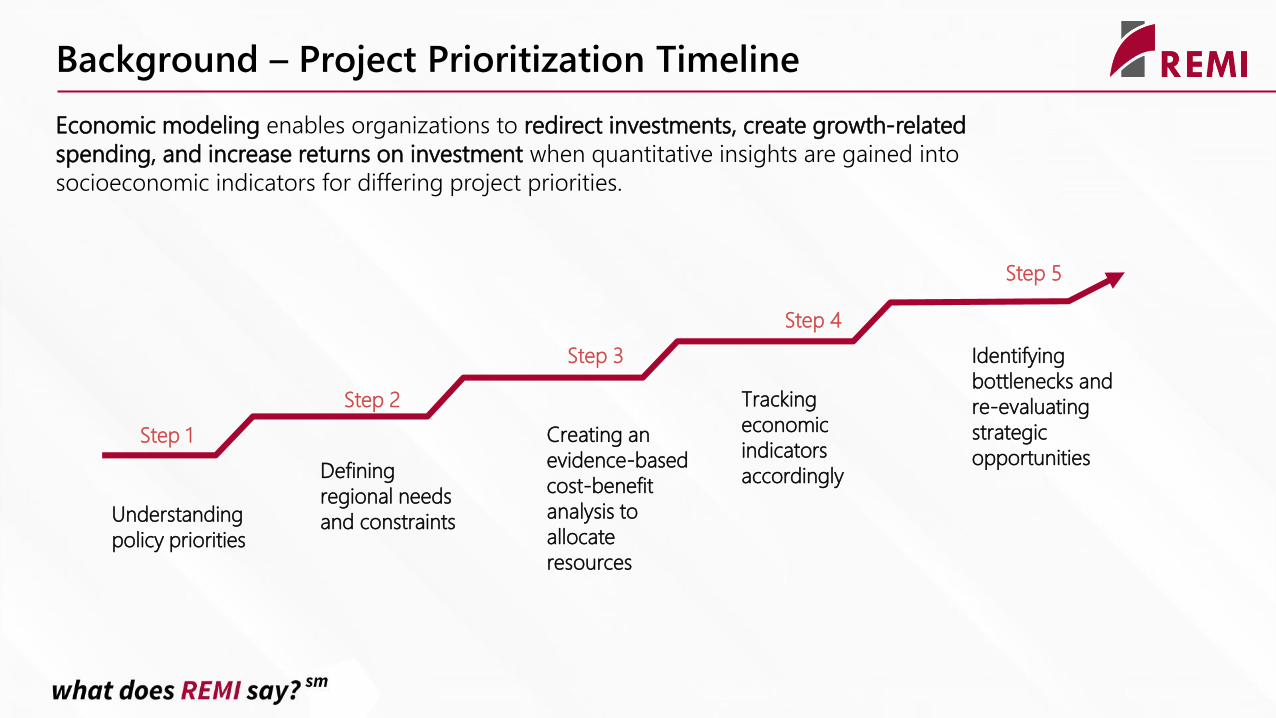
Step 1
Step 2
Step 3
Step 4
Step 5
Understanding
policy priorities
Defining
regional needs
and constraints
Tracking
economic
indicators
accordingly
Creating an
evidence-based
cost-benefit
analysis to
allocate
resources
Identifying
bottlenecks and
re-evaluating
strategic
opportunities
Background – Project Prioritization Timeline
Economic modeling enables organizations to redirect investments, create growth-related
spending, and increase returns on investment when quantitative insights are gained into
socioeconomic indicators for differing project priorities.
Introduction
Methodology
Case Study
Topic overview
Notable Results
Conclusion
Q&A
Agenda
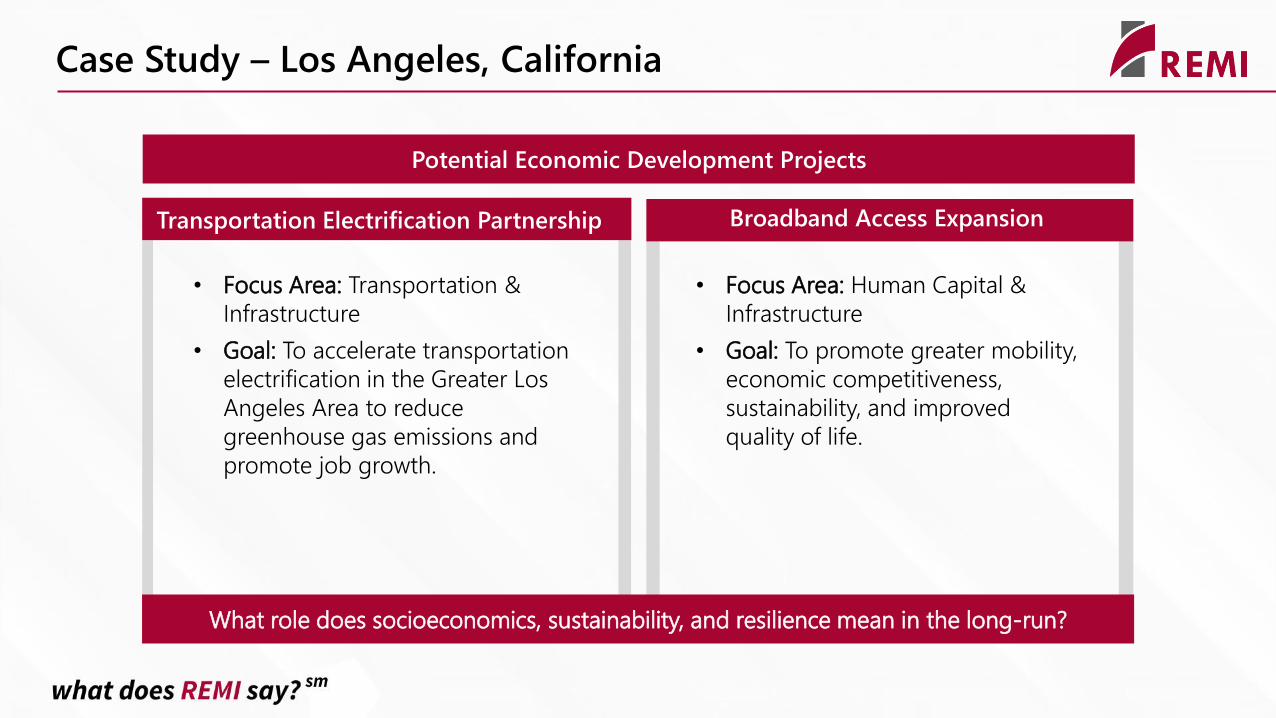
Case Study – Los Angeles, California
Transportation Electrification Partnership Broadband Access Expansion
• Focus Area: Transportation &
Infrastructure
• Goal: To accelerate transportation
electrification in the Greater Los
Angeles Area to reduce
greenhouse gas emissions and
promote job growth.
• Focus Area: Human Capital &
Infrastructure
• Goal: To promote greater mobility,
economic competitiveness,
sustainability, and improved
quality of life.
Potential Economic Development Projects
What role does socioeconomics, sustainability, and resilience mean in the long-run?
Introduction
Methodology
Case Study
Topic overview
Notable Results
Conclusion
Q&A
Agenda
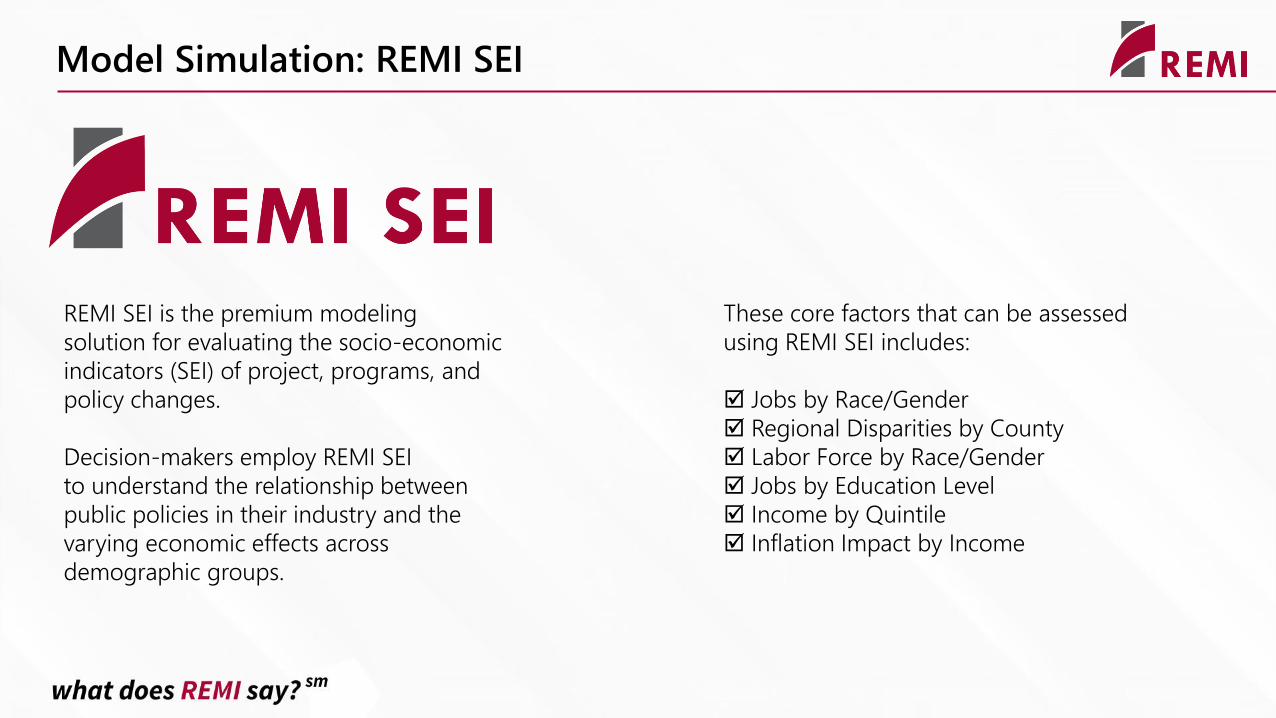
Model Simulation: REMI SEI
REMI SEI is the premium modeling
solution for evaluating the socio-economic
indicators (SEI) of project, programs, and
policy changes.
Decision-makers employ REMI SEI
to understand the relationship between
public policies in their industry and the
varying economic effects across
demographic groups.
These core factors that can be assessed
using REMI SEI includes:
Jobs by Race/Gender
Regional Disparities by County
Labor Force by Race/Gender
Jobs by Education Level
Income by Quintile
Inflation Impact by Income
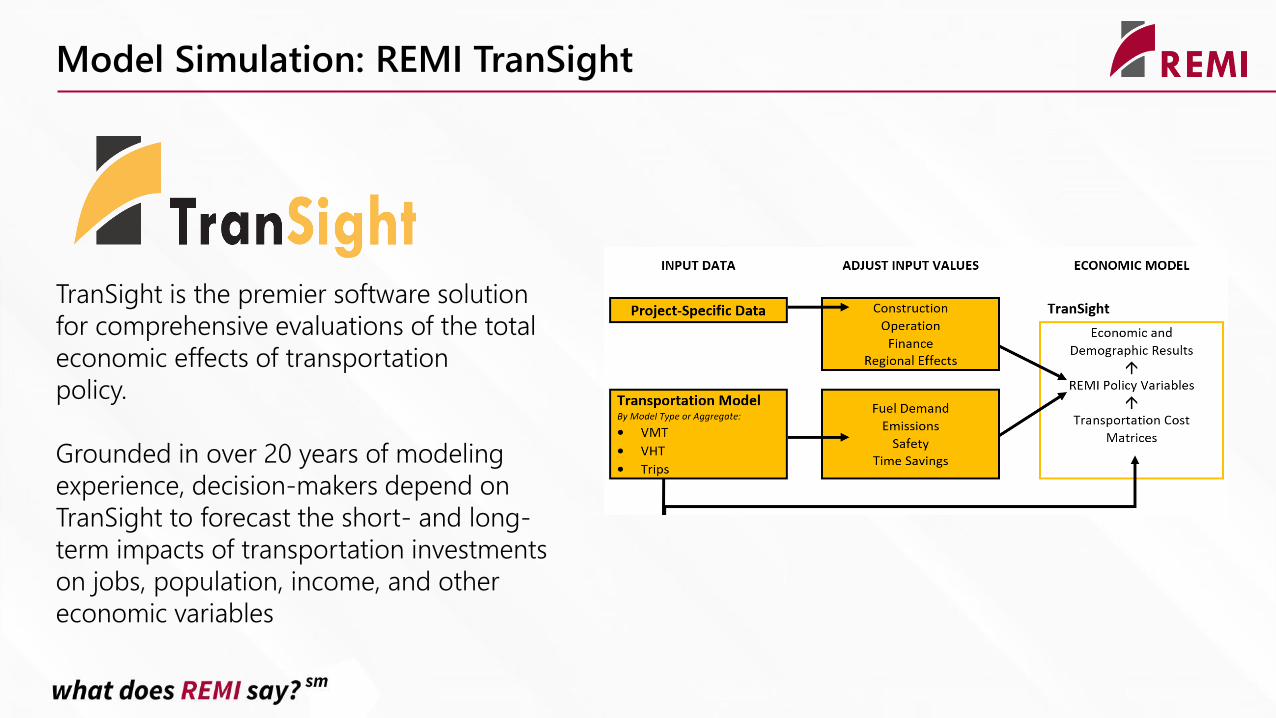
Model Simulation: REMI TranSight
TranSight is the premier software solution
for comprehensive evaluations of the total
economic effects of transportation
policy.
Grounded in over 20 years of modeling
experience, decision-makers depend on
TranSight to forecast the short- and long-
term impacts of transportation investments
on jobs, population, income, and other
economic variables
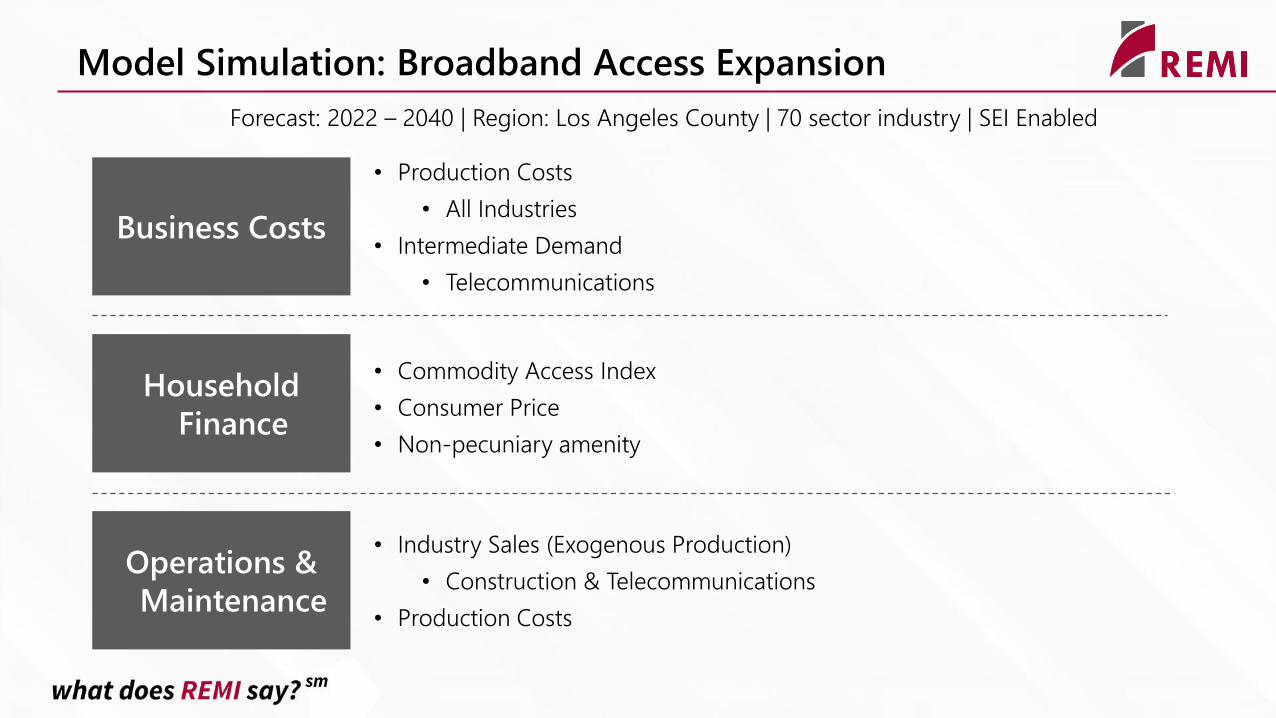
Business Costs
• Production Costs
• All Industries
• Intermediate Demand
• Telecommunications
Operations &
Maintenance
• Commodity Access Index
• Consumer Price
• Non-pecuniary amenity
Household
Finance
• Industry Sales (Exogenous Production)
• Construction & Telecommunications
• Production Costs
Model Simulation: Broadband Access Expansion
Forecast: 2022 – 2040 | Region: Los Angeles County | 70 sector industry | SEI Enabled
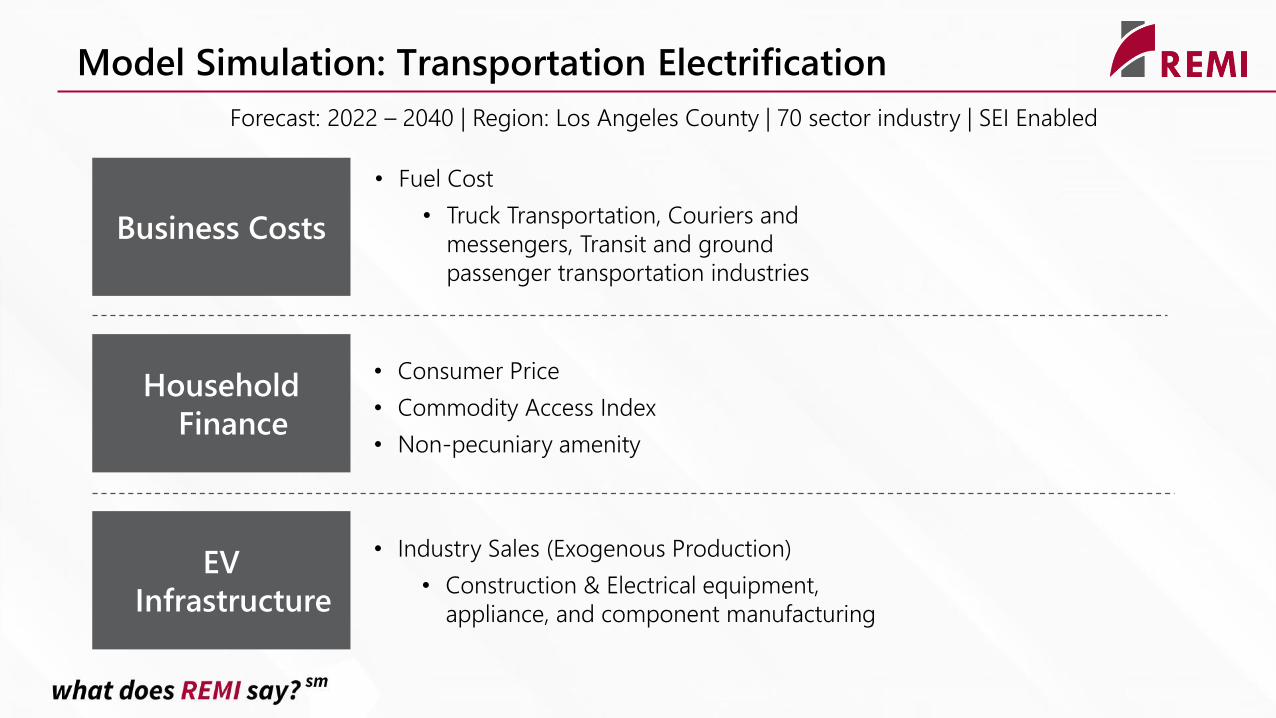
Business Costs
• Fuel Cost
• Truck Transportation, Couriers and
messengers, Transit and ground
passenger transportation industries
EV
Infrastructure
• Consumer Price
• Commodity Access Index
• Non-pecuniary amenity
Household
Finance
• Industry Sales (Exogenous Production)
• Construction & Electrical equipment,
appliance, and component manufacturing
Model Simulation: Transportation Electrification
Forecast: 2022 – 2040 | Region: Los Angeles County | 70 sector industry | SEI Enabled
Introduction
Methodology
Case Study
Topic overview
Notable Results
Conclusion
Q&A
Agenda
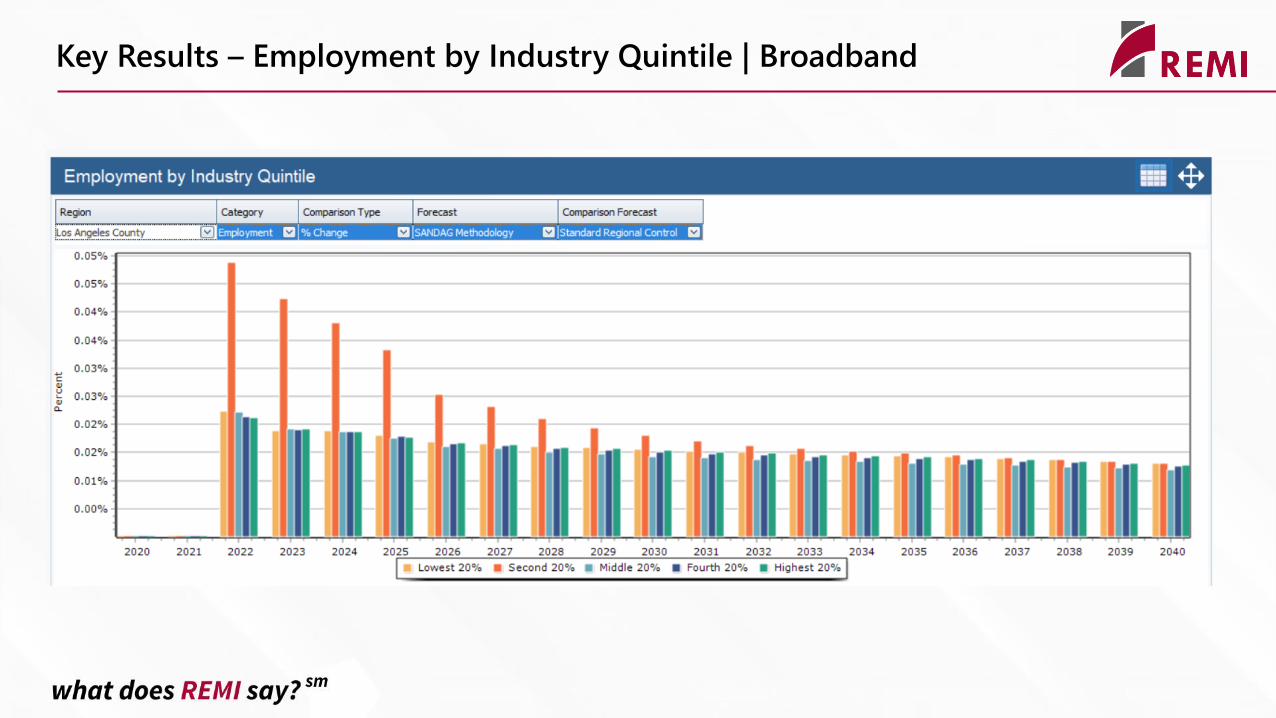
Key Results – Employment by Industry Quintile | Broadband
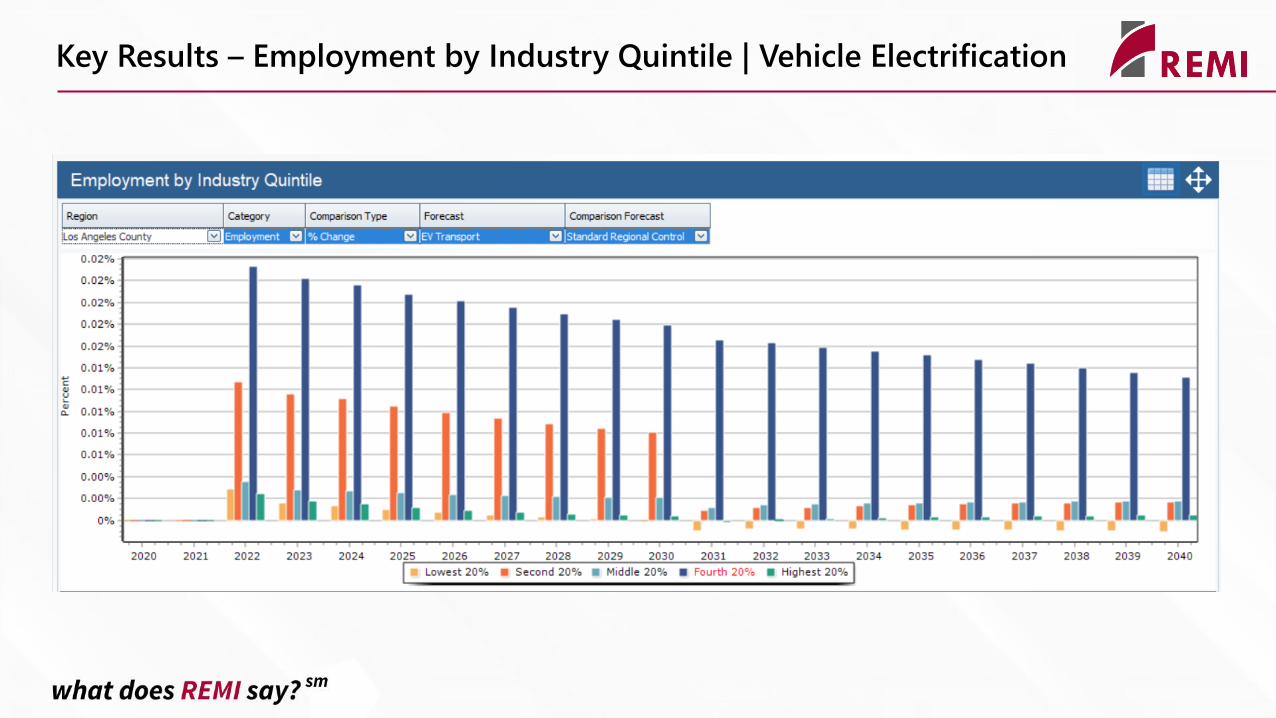
Key Results – Employment by Industry Quintile | Vehicle Electrification
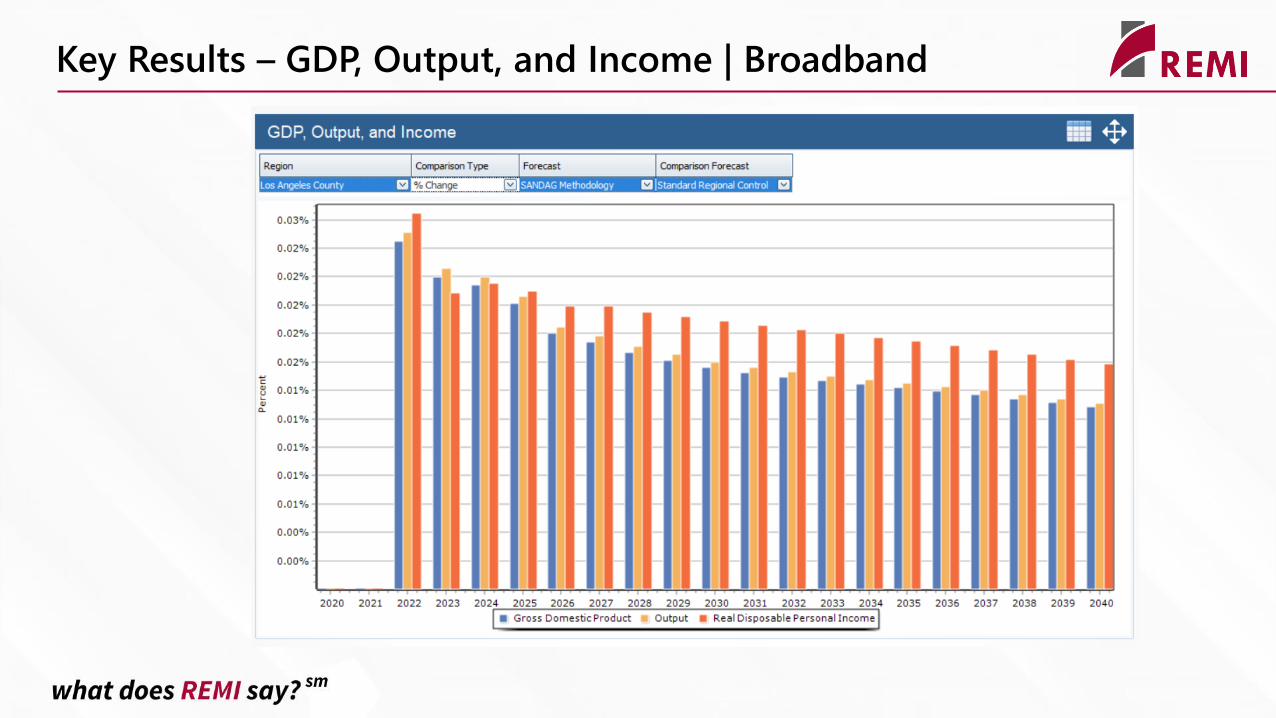
Key Results – GDP, Output, and Income | Broadband
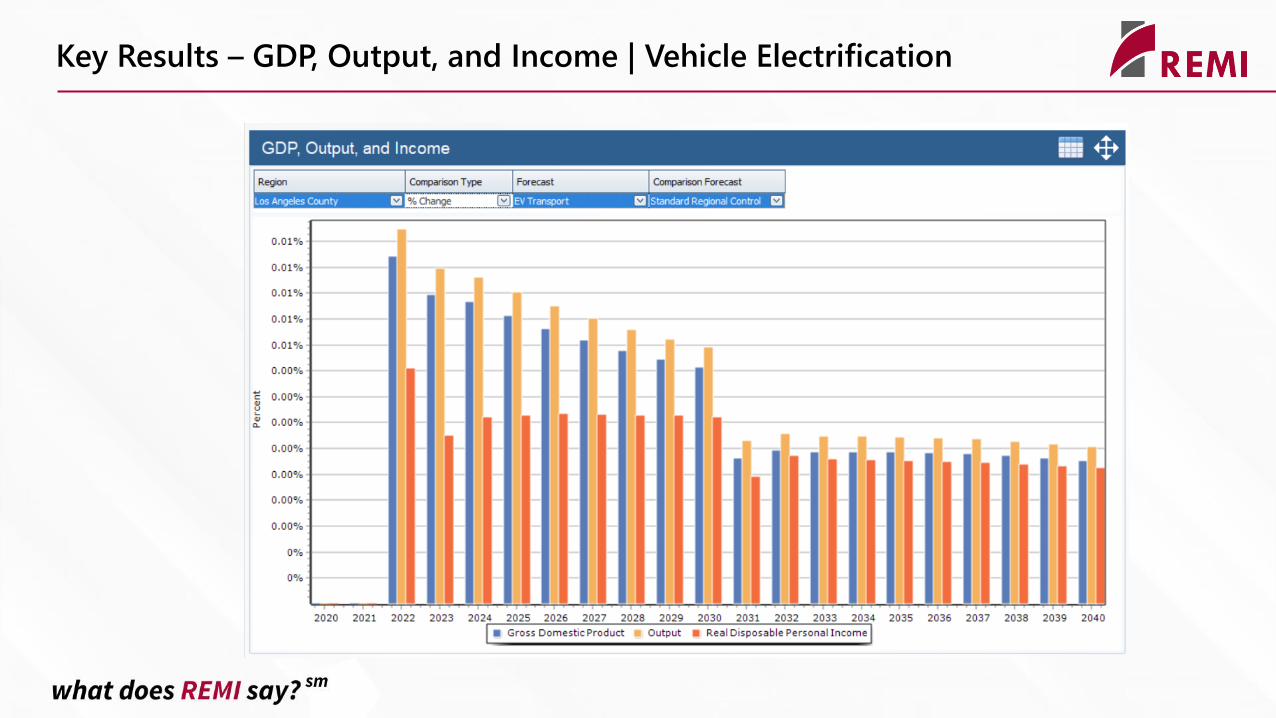
Key Results – GDP, Output, and Income | Vehicle Electrification
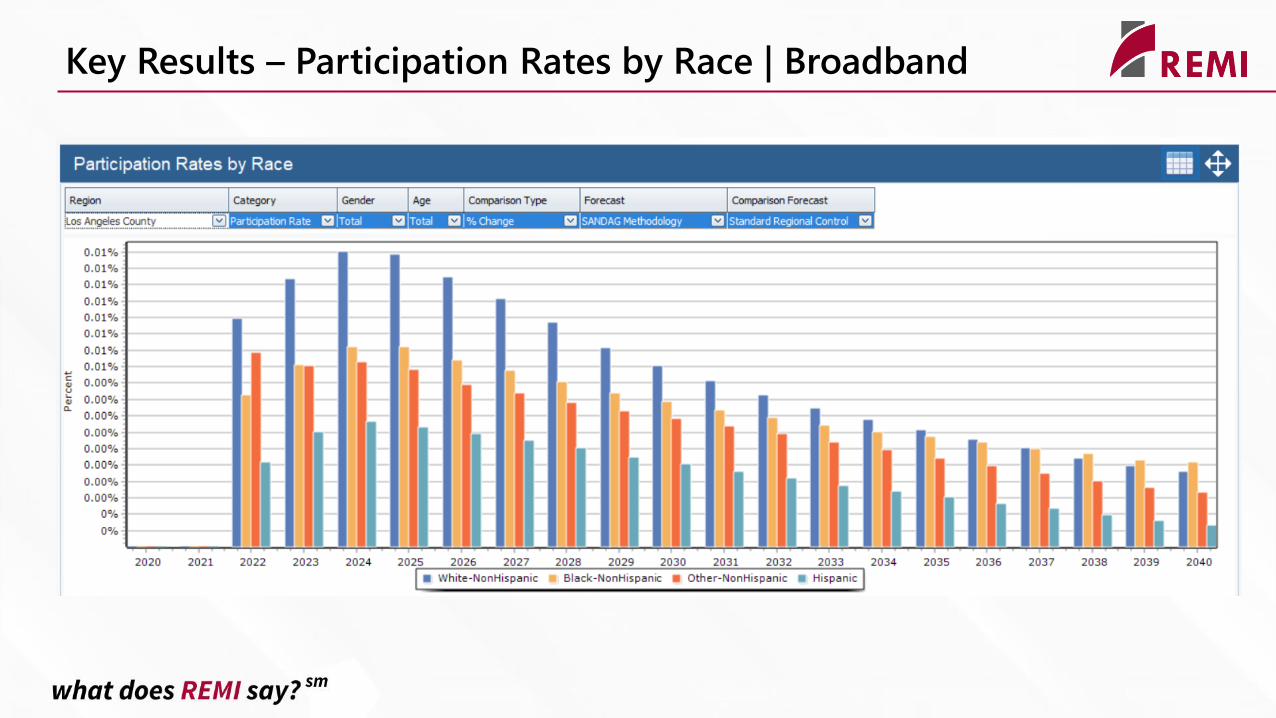
Key Results – Participation Rates by Race | Broadband
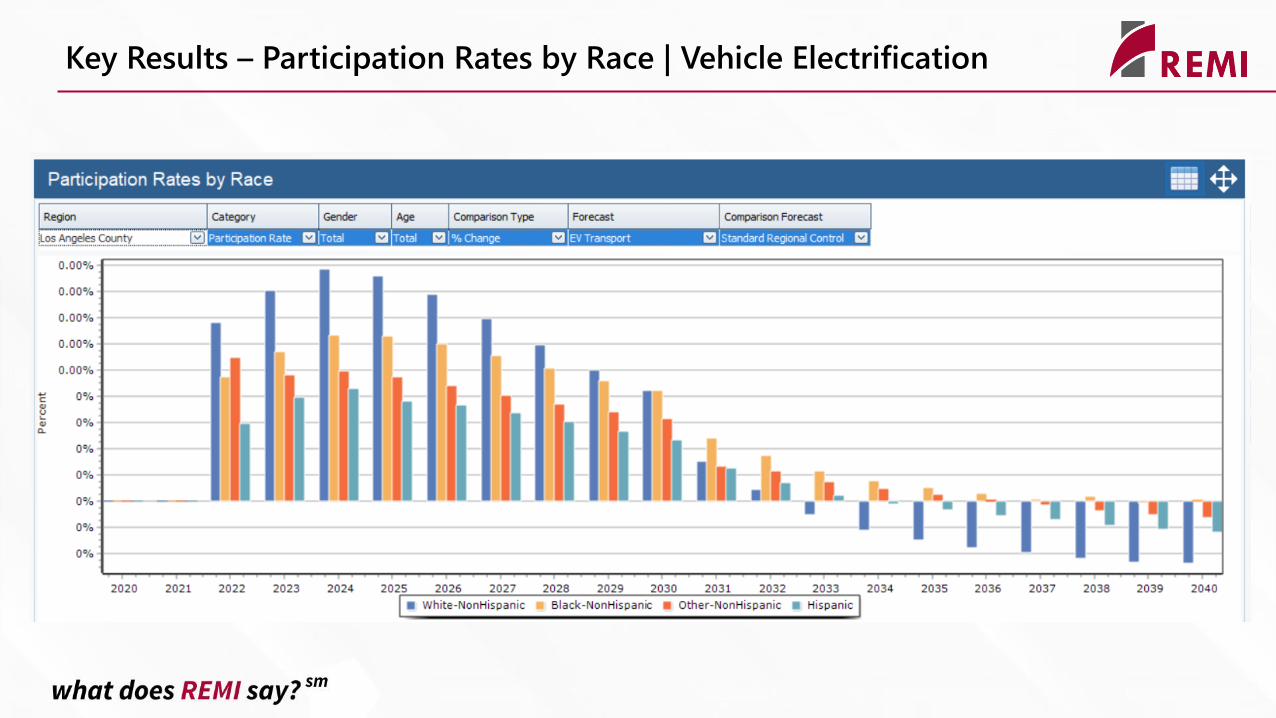
Key Results – Participation Rates by Race | Vehicle Electrification
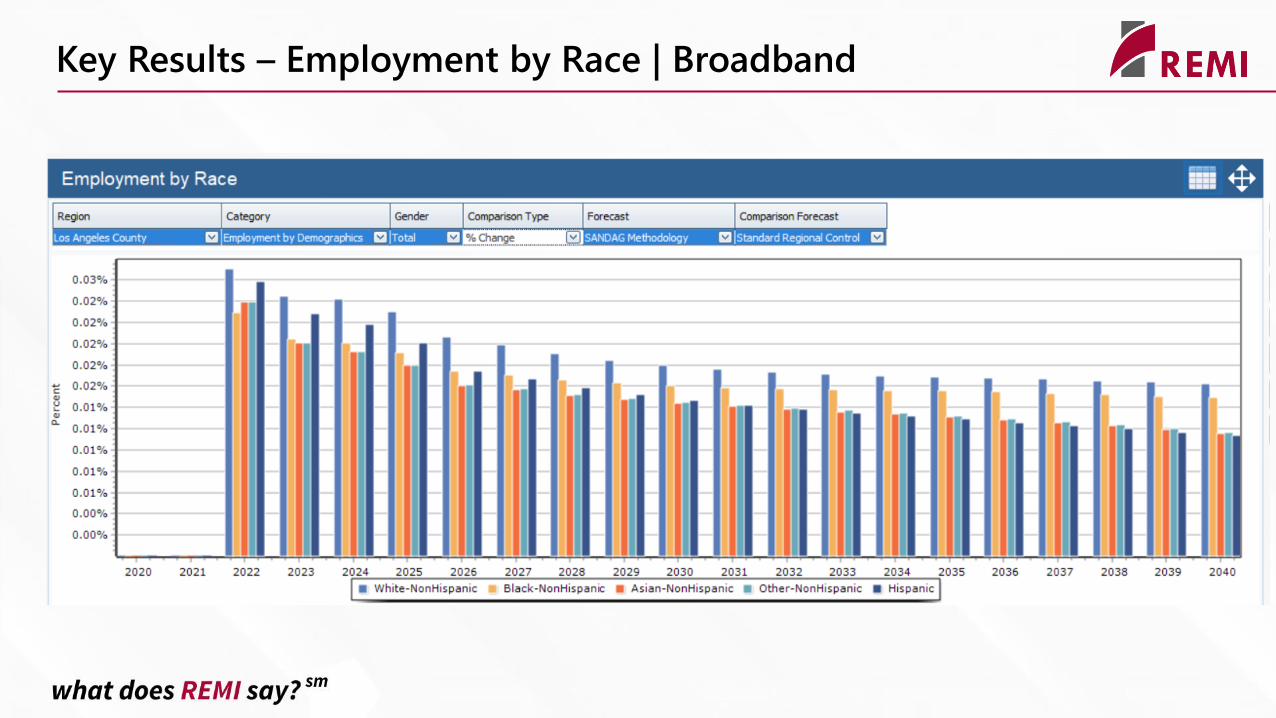
Key Results – Employment by Race | Broadband
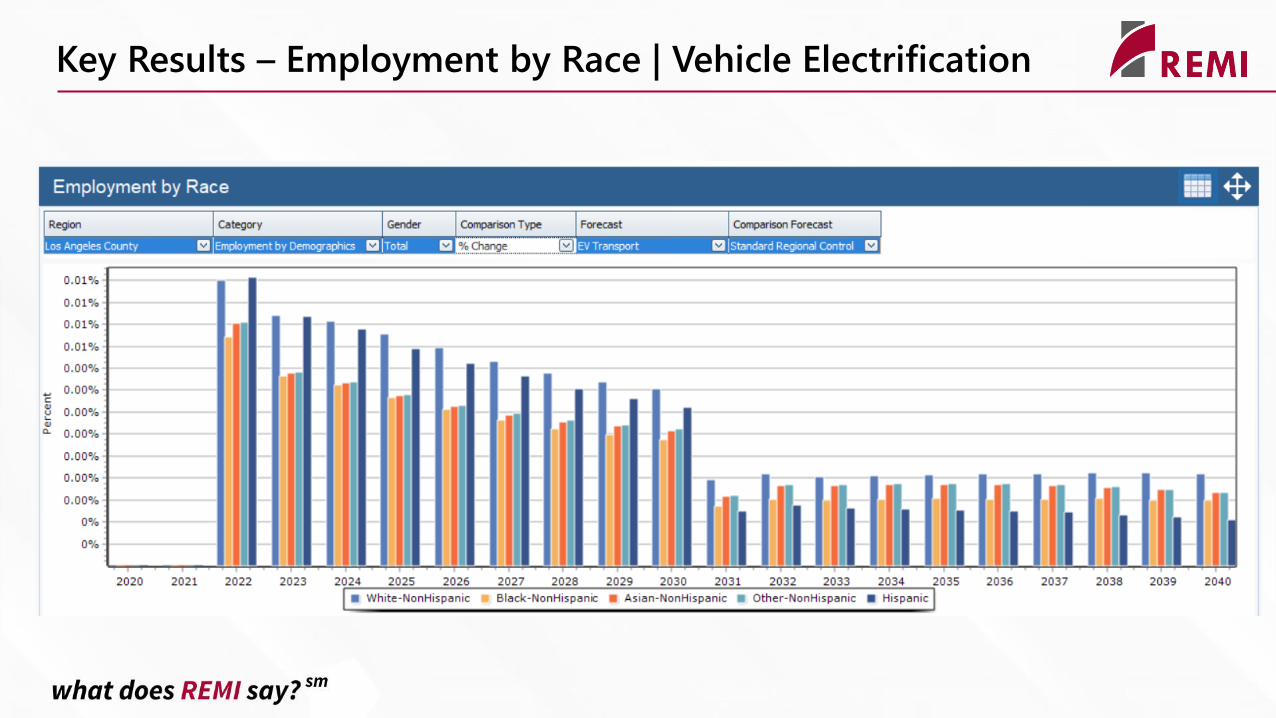
Key Results – Employment by Race | Vehicle Electrification
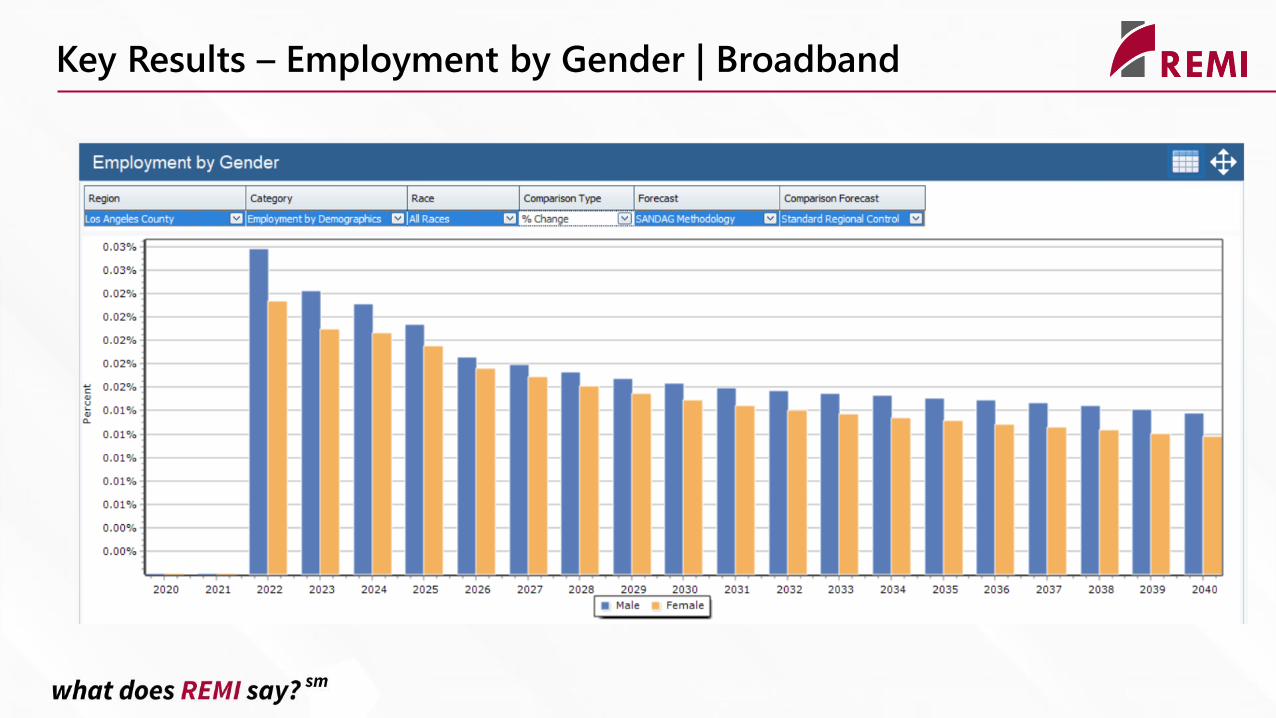
Key Results – Employment by Gender | Broadband

Key Results – Employment by Gender | Vehicle Electrification
Introduction
Methodology
Case Study
Topic Overview
Notable Results
Conclusion
Q&A
Agenda
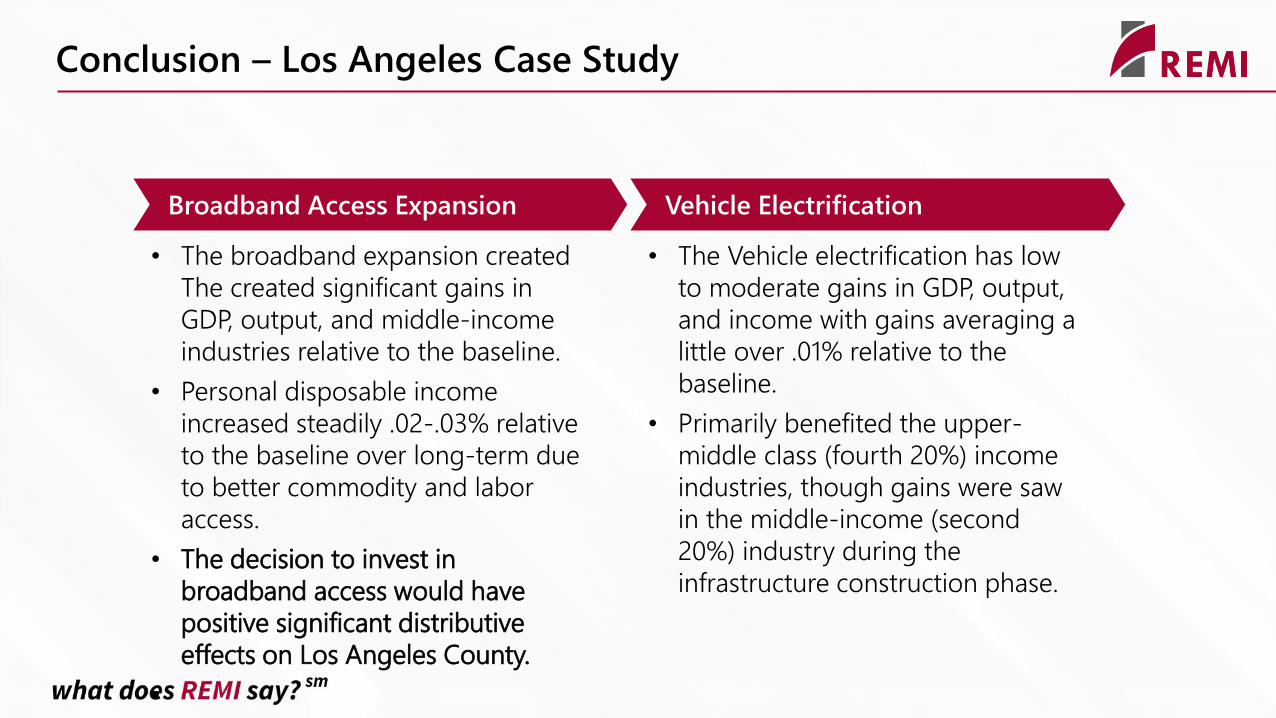
Vehicle ElectrificationBroadband Access Expansion
• The broadband expansion created
The created significant gains in
GDP, output, and middle-income
industries relative to the baseline.
• Personal disposable income
increased steadily .02-.03% relative
to the baseline over long-term due
to better commodity and labor
access.
• The decision to invest in
broadband access would have
positive significant distributive
effects on Los Angeles County.
•
• The Vehicle electrification has low
to moderate gains in GDP, output,
and income with gains averaging a
little over .01% relative to the
baseline.
• Primarily benefited the upper-
middle class (fourth 20%) income
industries, though gains were saw
in the middle-income (second
20%) industry during the
infrastructure construction phase.
Conclusion – Los Angeles Case Study
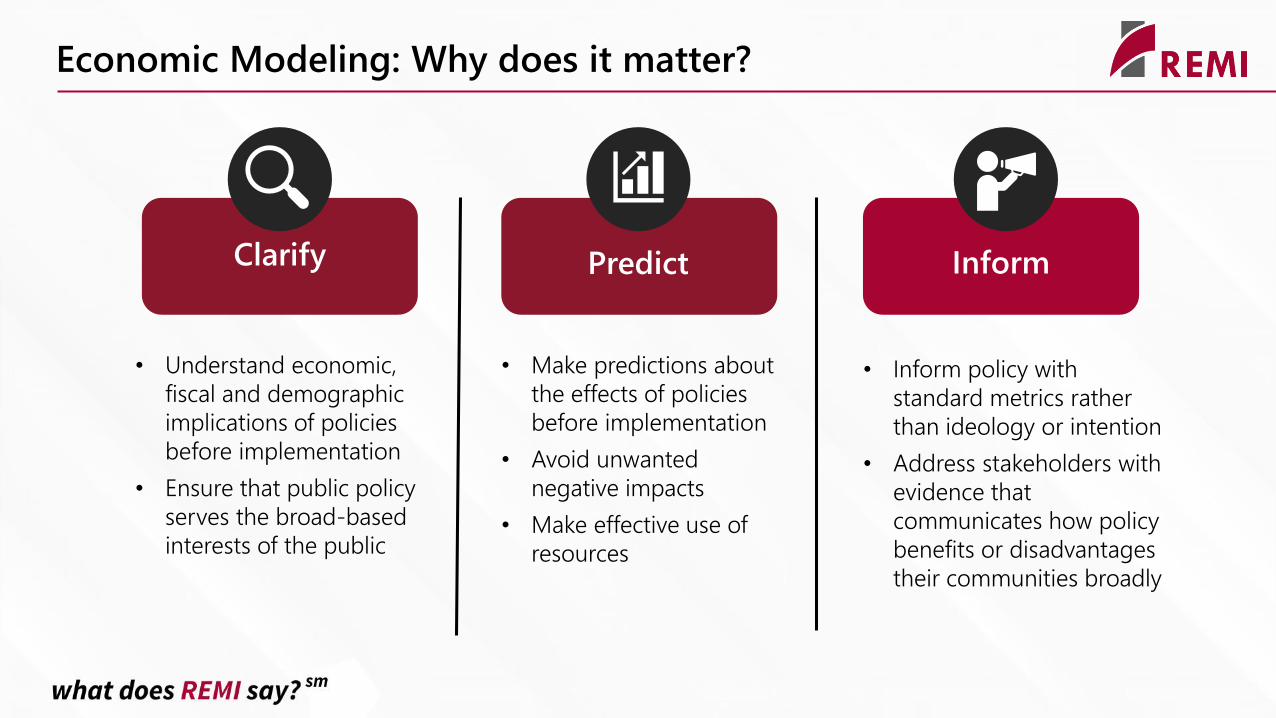
Clarify Predict Inform
• Understand economic,
fiscal and demographic
implications of policies
before implementation
• Ensure that public policy
serves the broad-based
interests of the public
• Make predictions about
the effects of policies
before implementation
• Avoid unwanted
negative impacts
• Make effective use of
resources
• Inform policy with
standard metrics rather
than ideology or intention
• Address stakeholders with
evidence that
communicates how policy
benefits or disadvantages
their communities broadly
Economic Modeling: Why does it matter?
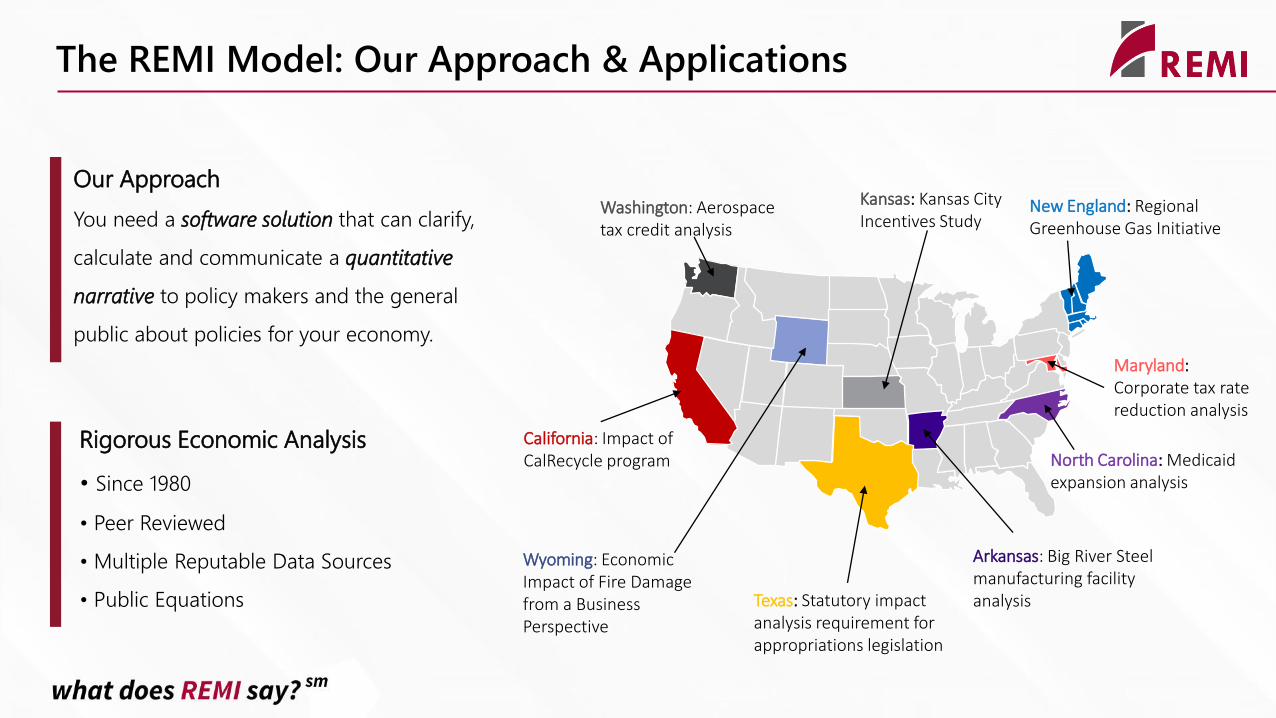
The REMI Model: Our Approach & Applications
Our Approach
You need a software solution that can clarify,
calculate and communicate a quantitative
narrative to policy makers and the general
public about policies for your economy.
Rigorous Economic Analysis
• Since 1980
• Peer Reviewed
• Multiple Reputable Data Sources
• Public Equations
North Carolina: Medicaid expansion analysis
Arkansas: Big River Steel manufacturing facility analysis
Maryland: Corporate tax rate reduction analysis
Washington: Aerospace tax credit analysis
Texas: Statutory impact analysis requirement for appropriations legislation
California: Impact of CalRecycle program
New England: Regional Greenhouse Gas Initiative
Kansas: Kansas City Incentives Study
Wyoming: Economic Impact of Fire Damage from a Business Perspective
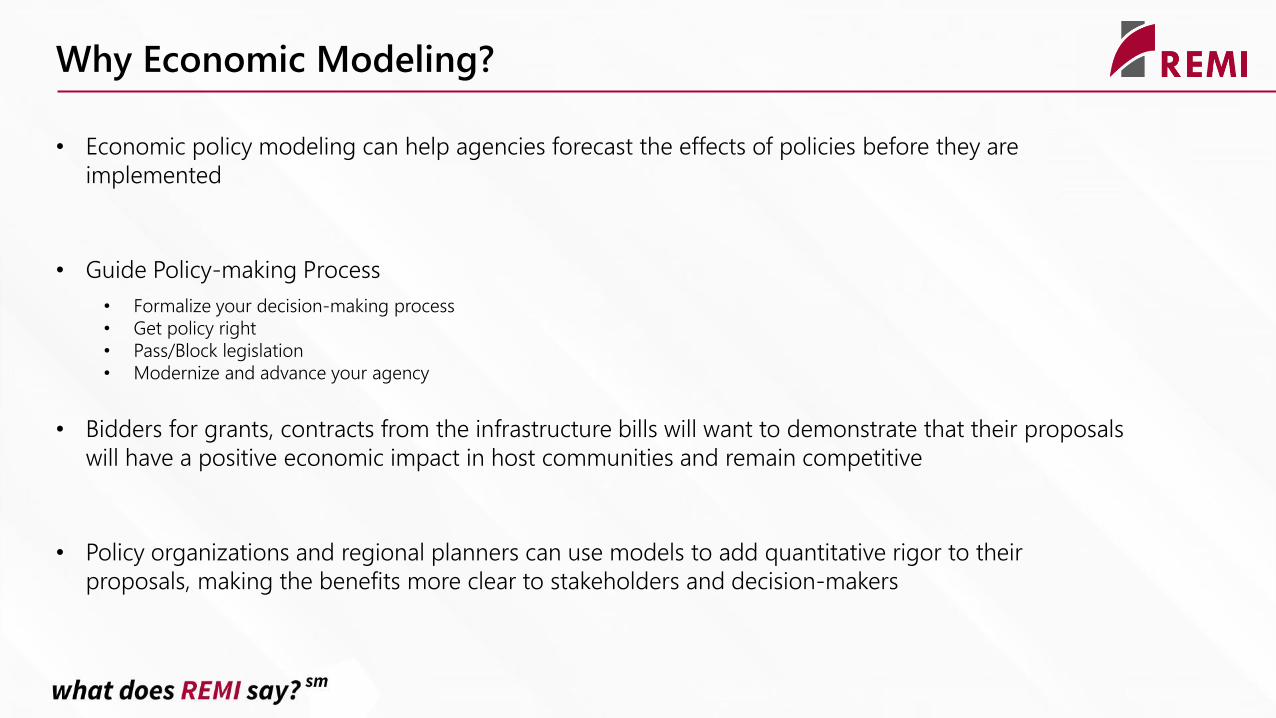
Why Economic Modeling?
• Economic policy modeling can help agencies forecast the effects of policies before they are
implemented
• Guide Policy-making Process
• Formalize your decision-making process
• Get policy right
• Pass/Block legislation
• Modernize and advance your agency
• Bidders for grants, contracts from the infrastructure bills will want to demonstrate that their proposals
will have a positive economic impact in host communities and remain competitive
• Policy organizations and regional planners can use models to add quantitative rigor to their
proposals, making the benefits more clear to stakeholders and decision-makers