post-remedial action report for the chapman valve site
TRANSCRIPT

for Post-Remedial Action Report
the Chapman Valve Site
E I P I I I t I 1 I I I 1 I li I I Pnnted on recycledkecyclable paper
24 19 0186 1
DOE/OW21949-408
Formerly Utilized Sites Remed Contr:
al Action Program (FUSRAP) LCt NO. DE-AC05-91 OR21 949
Indian Orchard, assac h.usetts
November 1996

DOE/OR/2 1949-408
POST-REMEDIAL ACTION REPORT
FOR THE
CHAPMAN VALVE SITE
INDIAN ORCHARD, MASSACHUSETTS
NOVEMBER 1996
Prepared for
United States Department of Energy
Oak Ridge Operations Office
Under Contract No. DE-AC05-91 OR2 1949
Bechtel National, Inc.
Oak Ridge, Tennessee . .
Bechtel Job No. 14501

CONTENTS
Page .
FIGURES ................................................................................... 1 .............................................................. iv
TABLES ..................................................................................................................................................... v
ACRONYMS ........................................................................................ : .................................................... vi
UNITS OF MEASURE ...................................................................................................... .................... ;.. vii . . .
1 .O INTRODUCTION .............................................................................................................................. 1 1 . I BACKGROUND .......................................................................................................................... 1 1.2 HISTORY ................. i ................................................................................ : ................................. 1
I .3 EXTENT OF CONTAMINATION ................... '.; ....................................................................... 2
2.0 REMEDIAL ACTION GUIDELINES ...................................................... 1 .......................... : ............. 3
3.0 REMEDIAL ACTION ...... .'..: ........................ ;..:. ................................................................................ 3'. 1 DECONTAMINATION ACTIVITIES .............................................................. : ........................ .4 . 3.2 CONTAMINATION CONTROL DURING REMEDIAL ACTION .................... : ....................
3
6 . . . .
4.0 POST-REMEDIAL ACTION SAMPLING/SURVEYING RESULTS ................................. 1 .......... 7 4. I 8 4.2 HAZARD ASSESSMENTEXPOSURE SCENARIOS .............. ............................... .. ......... ; ..... .9 4.3 CONCLUSIONS OF HAZARD ASSESSMENT ..... .. ................................................................. 1 1
5-.O POST-REMEDIAL ACTION STATUS ............................................................................................. 12 .
POST-REMEDIAL ACTION SURVEY DATA, ..................................... ..................................
6.0 REFERENCES.: ................................................................................................................................. 13
GLOSSARY ............................................................................................................................................... 14
... 133-000 1 .DOC ( 1 1/27/96) 111

Figure
1
2
3
4
5
6
7
8
9
10
FIGURES
Title Page
Approximate Location of Chapman Valve.Site ............................................................ 19
Chapman Valve Building 23 - Plan View ..................................................................... 21
Chapman Valve - 1994 Characterization Results -’ Plan Views: ................................... 23
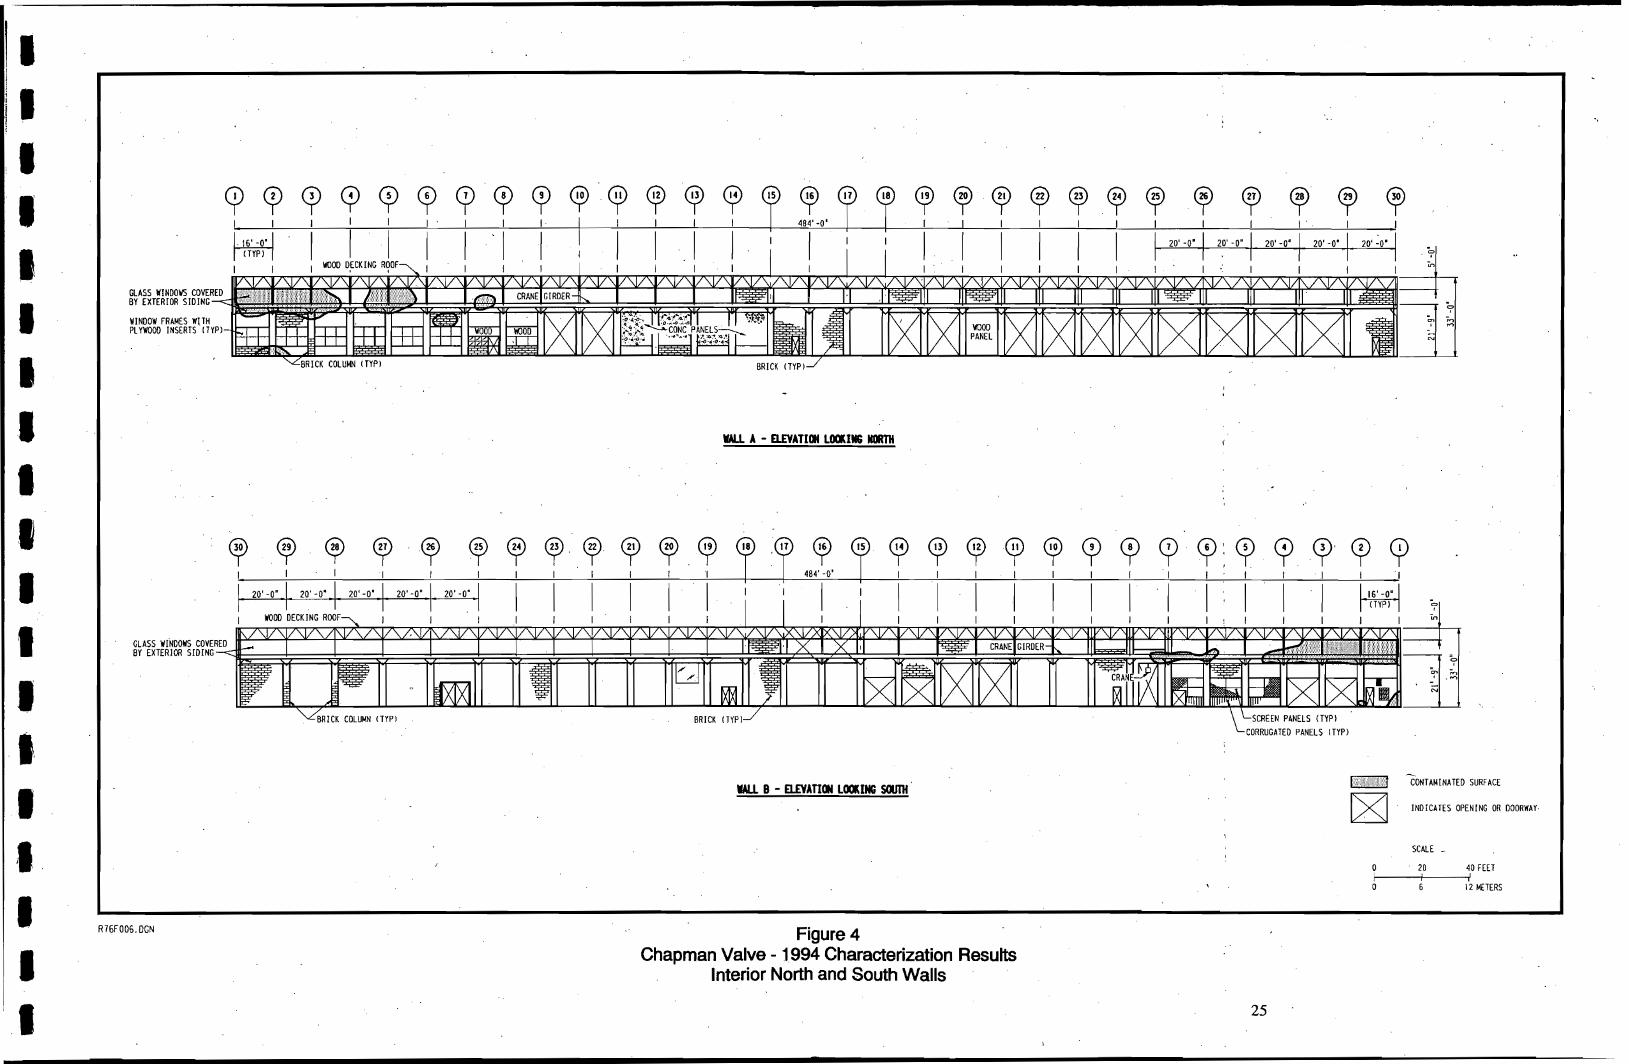
Chapman Valve - 1994 Characterization Results - Interior North and South Walls ............................ ; ........ :..; ......................... . .......................... ...................... 25
Chapman Valve - 1994 Characterization Results - Interior West Wall ................ : ....... 27
Post-Remedial Action Survey Locations on Overhead Crane ...................................... 29
Post-Remedial Action Survey Locations - Interior West Wall ..................................... 3 I
Post-Remedial Action Survey Locations - Interior North Wall .................................... 33
Post-Remedial Action Survey Locations - Interior South Wall ................ i ........ : .......... 34
.
Chapman Valve Post-Remedial Action Floor Survey ...................... ............................ 35
133-0001.DOC (1 1/27/96)

TABLES
li
‘1‘
Table
1
. 2
3
4
5
6
7
8
9
10
1 1
Title Page
Summary of Residual Contamination Guidelines ................... ...................................... 39
Decontamination Techniques Used at the Chapman Valve Site ................................... 4 1
Cost of Remedial Action at the Chapman Valve Site ................................................... 42
Post-Remedial Action Survey Data - Crane ...... :. .. ... . . .’. . .. .... .. . .. . ... . .. .... .... ... . . . . . . ... ..; .... . . . 43.
Post-Remedial Action Survey Data - Trusses and Overheads ...................................... 46
Post-Remedial Action Survey Data - West Wall ........ : ...................... .......................... 47
Post-Remedial Action Survey Data - North Wall ............................. ........ . ................... 48
Post-Remedial Action Survey Data - South Wall ........................................................ : 50 .
Post-Remedial Action and Bench - Scale Sampling Results ........................................ 52
Hazard Assessment Summary .............. ; ...................................................................... ;. 53
Remedial Action Summary ....................................................... , ................................... 54 . .
133-0001 .DOC ( I 1/27/96) V

AEC ALARA BNI CHV DAC DCG DOE FUSRAP HEPA IVC ORNL PMC PPE RCRA TCLP
. .
. . 133-0001 .DOC ( I 1/27/96)
ACRONYMS.
U.S. Atomic Energy Commission as low as reasonably achievable Bechtel National, Inc. Chapman Valve Site derived air concentration derived concentration guide U.S. Department of Energy Formerly Utilized Sites Remedial Action Program high-efficiency particulate air independent verification contractor Oak Ridge National Laboratory project management contractor personal protective equipment Resource Conservation and Recovery Act toxicity characteristic leaching procedure
. .
vi
P ;I$

UNITS OF MEASURE
cm
dPm fi g in. L
. pci Pg ml mrem pCi
'Yr
centimeter desintegrations per minute foot gram inch liter microcurie microgram mill i 1 iter mi 11 i rem picocurie year
, . I .
. . . .
. . ' 133-0001.DOC ( I 1/27/96) vii
1.0 INTRODUCTION
1.1 BACKGROUND
This report documents the remedial action conducted at the Chapman Valve site (CHV) in Indian Orchard, Massachusetts, from July to September 1995. The remedial action was conducted following the expedited protocol, which is an efficient, cost-effective, and environmentally acceptable approach for this small site. Use of this approach complied with state and local regulations.
Remedial activities at'CHV were perfoped as part of the U.S. Department of Energy (DOE) Formerly Utilized Sites Remedial Action Program (FUSRAP). -FUSRAP was established to identify and
clean up or otherwise control sites where residual radioactive contamination remains from the early years of the nation's atomic energy program or from commercial operations causing conditions that Congress has authorized DOE to remedy. FUSRAP .was established in 1974 and currently includes 46 sites in 14 states. CHV was designated for remedial action under FUSRAP in 1992. ' '
FUSRAP objectives for CHV were to
remove or otherwise control radioactive contamination. above .current DOE guidelines, and . '
. .
. . I .
0 achieve and maintain compliance with applicable criteria for the protection of human health and the environment.
. .
Bechtel National, Inc. (BNI), the project management contractor (PMC) for FUSRAP, assisted DOE'S Oak Ridge Operations Office in the planning, management, and implementation of the cleanup of CHV. Oak Ridge National Laboratory (ORNL) was the independent verification contractor (IVC) for the remedial action.
1.2 HISTORY
CHV is located in Indian Orchard, a suburb of Springfield, Massachusetts, at 203 Hampshire Street (Figure 1). The site was formerly owned and operated by the Chapman Valve Manufacturing Company. The Crane Company has owned the site since 1981 but vacated the building in 1987. In 1991, the building was still standing and in reasonably good condition; however, harsh winter conditions had resulted in the deterioration of the building, and a structural inspection indicated that the roof was unsafe (Klotsas to Boyer 1992).
133-0001.DOC ( I 1/27/96) 1

In 1948, Chapman Valve set aside an area in the western end of building 23 (Figure 2) for the machining of uranium rods for the Atomic Energy Commission's (AEC's) Brookhaven National Laboratory. Uranium operations were terminated on November 8, 1948, at which time Chapman Valve had in its possession more than 27,000 pounds of metal scrap, oxides, and sweepings. This material was removed from the site several months after the contract was completed.
1.3 EXTENT OF CONTAMINATION
A 1992 survey indicated that the residual uranium contamination found at CHV was typical of Manhattan Engineer DistricUAEC operations (ORNL 1992). The contamination was limited to interior areas and included floors, walls, and overhead beams.
The PMC performed additional radiological surveys in November and December 1994 to supplement and refine existing survey information (BNI 1995). Characterization findings confirmed the presence of contamination in the western end of Building 23 (Figures 2 ,3 ,4 , and 5). These findings are in agreement with historical process information obtained during interviews conducted with a former Chapman Valve supervisor. According to the supervisor, a temporary wall was constructed across the center portion of the building from floor to ceiling between columns A-7 and B-7 (Figure 2).
Additional contamination was identified in the southwest comer of grid A-1 at the former location of a chip burner .that exhausted to the atmosphere through a nearby window. (Grid numbers are derived from the northwestern column number of the grid.) The exhaust location and the shape of the roof of the building caused more contamination to be deposited on the south roof than on the north roof, as indicated by characterization measurements. The uranium storage area was located in Room B-4 on the south side of the building between columns B-4 and B-7 (Figure 2). Characterization results showed no subsurface soil contamination below the floor slab.
Levels of contamination decreased from west to east in the building, and survey and sampling results from the east end indicated near-background radiological conditions. The exterior of the building, except for the roof and several locations on the west and south exterior walls, indicated near-background radioactivity.
. Chemical sampling results indicated the presence of lead-based paint on' the cranes; electric.al '
boxes, and structural steel. Asbestos was found in the composite roof material and the electrical box insulation.
133-0001.DOC ( I 1/27/96) 2

t \ u P;
2.0 REMEDIAL ACTION GUIDELINES
Radioactive Contamination at CHV consisted primarily of natural uranium. Table 1 lists the DOE residual contamination guidelines for release of formerly contaminated properties for use without radiological restrictions. The guidelines listed in Table 1 were applied to the crane, floor, and drain lines. These guidelines were adopted by DOE based on their compatibility with U.S. Environmental Protection Agency (EPA) criteria for remedial action found in 40 CFR 192, “Uranium Mill Tailings Remedial Action Program,” and are contained in DOE Order 5400.5, “Radiation Protection of the Public and the Environment.”
The remedial action approach for the Chapman Valve site was somewhat unique. Site characterization was performed in 1995, and the results were documented in a technical memorandum (BNI 1995a). A hazard assessment, which focused on future use radiological dose, was completed to assist in determining the appropriate remedial action methods (BNI 1996b). Based on this hazard assessment, supplemental standards as defined in DOE Order 5400.5 were approved by DOE-HQ (Wagoner to Price 1995). Under the future use scenario involving a demolition worker performing commercial operations with no radiological controls, the predicted radiological dose was 5.6 mrem/yr. The predicted dose for a worker at a facility where steel from the building would be smelted was 16 mrem/yr (O’Connell to Kopotic 1995). These scenarios were considered conservative but realistic given future plans for the structure. Based on the results of the hazard assessment and the approved supplemental standards, and consistent with DOE’S policy of reducing contaminant levels as low as reasonably achievable (ALARA), the remedial action efforts focused on eliminating removable contamination and decontaminating the most highly contaminated areas of the building. Further details of the remedial action are provided in Section 3.0.
.
3.0 REMEDIAL ACTION
Because of the potential for salvage and reuse of the crane and the possibility that the base slab would remain intact following future building demolition, the crane and floor were decontaminated to comply with the DOE residual contamination guidelines listed in Table 1. It was determined that a supplemental guideline of 15,000 dpm/lOO cm2 average for the horizontal surfaces of an entire truss was protective of a future demolition worker and that contamination on the walls and roof contributed only a negligible dose to the worker; therefore, decontamination of the wall and roof surfaces was not necessary. However, in accordance with DOE’S ALARA policy, removable contamination on horizontal wall surfaces was remediated. This remedial action approach w& approved by the Massachusetts Department of Environmental Protection (Weinberg to Pantaleoni 1995) and the Massachusetts Department of Public Health (O’Connell to Kopotic 1995).
During remedial action, areas under failing roof sections were identified, and appropriate precautions such as posting, barricadin‘g, and limiting access were taken to ensure the safety of workers. ’
133-0001.DOC ( I 1/27/96) 3 .

3.1 DECONTAMINATION ACTIVITIES
Decontamination activities at CHV lasted approximately eight weeks, from July to September 1995. All remediation efforts were confined to the interior of Building 23. Designation and characterization surveys revealed contamination on interior building’surfaces in the western third of Building 23, between columns 1 and 8, and on a bridge crane located in grid A-23 (see Figure 2). During floor removal, contamination above criteria was found under a concrete ramp just inside the west equipment door and in a drain line in room B-4. Techniques used in the remedial action are summarized in Table 2.
Volume reduction, waste minimization, and cost saving techniques employed during the remedial action included segregating, sampling, and surveying the wastes produced. Using washable protective clothing and a personnel contamination monitor were also implemented as cost saving and waste minimization techniques. Total costs for remedial action are presented in Table 3. Specific examples of waste minimization and cost saving measures at CHV are described below.
0 Concrete and debris were surveyed to deteni.line whether contaminant levels were above criteria. The material below criteria was placed inside the building and left onsite, with property owner concurrence.
0 Paint removed from the crane was treated by acid dissolution and solidified with concrete to reduce the content of leachable lead to the extent that toxiciv characteristic leaching procedure (TCLP) results were below the limits specified in the Resource Conservation and Recovery Act (RCRA). The levels of lead in the resulting concrete monoliths were determined to be below radiological guidelines, and the monoliths were left onsite, with the concurrence of the property owner and the State of Massachusetts.
0 Remediation workers wore washable Protech-2000 coveralls rather than standard Tyvek protective clothing. Using the washable coveralls reduced waste volumes associated with disposable protective clothing. As an additional benefit, workers found that the Protech-2000 fabric coveralls were more comfortable to wear than Tyveks. Interstate Nuclear Services was contracted to provide laundry service for the washable protective clothing.
,&. I
.d
I 1’ 0 An Eberline PCM-2 personnel contamination monitor was used at the access control point instead of a
standard manual frisk, reducing the time required to ensure that workers exiting the controlled area are not contaminated. The PCM-2 monitor completes the contamination check in one minute; a standard hand frisk takes approximately five minutes. The PCM-2 also ensures a more consistent exit survey than the conventional hand frisk performed by the individual.
3, The following sections contain descriptions of decontamination techniques for each remediated area.
133-0001.DOC ( I 1/27/96) 4

10-Ton Bridge Crane
Residual surface contamination was removed from the bridge crane located at grid A-23 (see Figure 2) by hand scraping with putty knives and vacuuming. The crane was decontaminated without disturbing painted surfaces except for several small areas where it was necessary to remove the paint along with the contamination. Before the paint was removed, the high-efficiency particulate air- (HEPA-) filtered vacuums were emptied to minimize the amount of material requiring treatment. Very-small- quantity-generator status permitted treatment and disposal of the lead-based paint onsite. The paint was dissolved in an acid solution and then mixed with concrete. The resulting concrete monoliths were surveyed and determined to be below the DOE residual surface contamination guidelines listed in Table 1. With the concurrence of the property owner and the State of Massachusetts, the concrete monoliths were left onsite. The wooden decking was removed from the crane and decontaminated using the same technique that was used on the crane. The decontaminated boards were also left onsite.
Overhead Trusses
The upper horizontal surfaces of trusses in the main bay of Building 23 from truss 1 to truss 8 were decontaminated by using HEPA-filtered vacuums to remove contaminated dust. In one area of truss 2, abrasive decontamination was required to meet the supplemental limits set for CHV. The 'radioactive dust generated from the operation was mixed with concrete to eliminate the potential for fugitive dust during transport and handling of the waste. The concrete/dust was placed in an intermodal container for disposal at a licensed disposal facility.
Horizontal Wall Surfaces
Horizontal surfaces on the walls of the main bay from column 1 to column 8 were decontaminated with a HEPA-filtered vacuum. Decontaminated surfaces included the crane rail, window sills, radiators, and a large pipe on the north wall. Preliminary hazard assessment calculations indicated that the wall contamination did not contribute significantly to the dose to a future demolition worker; however, because the dose to the demolition worker was primarily from removable contamination, the horizontal surfaces were vacuumed to remove the contamination, in accordance with DOE'S ALARA policy. The radioactive dust generated from the operation was mixed with concrete to eliminate the potential for fugitive dust during transport and.handling of the waste. The concrete/dust was placed in an intermodal container for disposal at a licensed disposal facility.
Floor
A backhoe and skid steer loader equipped with a hoe-ram attachment were used to remove the wooden block and concrete pads above the base slab in the main bay and the B-series rooms on the south side of Building 23 between columns 1 and 8. The wooden blocks and concrete pads were considered clean material based on volumetric sampling results (BNI 1995b) and were placed in a clean pile. This
133-0001.DOC ( 1 1/27/96) 5

material was left onsite, with the concurrence of the property owner. The floor was vacuumed with HEPA- filtered vacuums, and the dust was collected.
Self-tapping steel floor anchors were removed with a jackhammer and surveyed. Any floor anchors containing above-background contamination were placed in the intermodal container for disposal at the licensed disposal facility. Areas of the floor that required further decontamination were mechanically cleaned with side grinders equipped with vacuum shrouds connected to HEPA-filtered vacuums. During the survey.of the floor, it was determined that part of the ramp at the west equipment door of Building 23 needed to be removed to provide access to contamination under the ramp. The portions of the ramp requiring removal were broken up with a jackhammer and a skid steer loader equipped with a hoe-ram attachment.
Shovels were then used to remove the contaminated soil below the ramp. All radioactive dust collected during the decontamination of the floor was mixed with concrete to eliminate the potential for fugitive dust during transport and handling of the waste. The concrete/dust was then placed in an intermodal container for disposal at a licensed disposal facility.
Drain Line
A ductile iron drain line discovered in Room B-4 (see Figure 3) after removal of the wooden blocks was determined to be contaminated above criteria. The drain line was removed by breaking the concrete with jackhammers and a skid steer loader equipped with a hoe-ram attachment. Lead seals in the joints of the pipe were segregated by breaking the pipe away from the seal. A total of 145 fi of 4-in. drain line was removed and placed in an intermodal container for shipment to the disposal facility. The lead seals were surveyed and released for recycling at a local lead recycling company.
3.2 CONTAMINATION CONTROL DURING REMEDIAL ACTION
During the remedial action, engineering and administrative controls such as dust control, hazardous work permits, and personal protective equipment (PPE) were used to protect remediation workers and members of the public from exposure to radiation in excess of applicable standards and in accordance with a site-specific safety and health plan for CHV.
All personnel working in contaminated areas were required to wear protective coveralls, hard hats, safety glasses, hearing protection, boots, and gloves. If conditions warranted, additional PPE such as face shields were used. Site conditions did no; necessitate the use of personnel respiratory protection except in the HEPA-filtered vacuum changeout tent.
Workers leaving radioactively restricted work areas were scanned at the control point by a personnel contamination monitor and subjected to a hand'and foot frisk to ensure that they were not contaminated and to prevent the spread of contamination.
' I '
133-0001 .DOC ( 1 1/27\96) 6

The potential primary exposure pathways from radioactive material to workers and members of the general public were inhalation and ingestion of radioactively-contaminated airborne dust generated during the remedial action. HEPA filtration units were used to control the spread of dust and minimize the potential for contaminants to become airborne. In addition, a fine water mist was sprayed to control dust during floor removal and during transport of material to the intermodal container. All equipment used in the controlled area was surveyed before being released from the site.
During remediation, particulate air monitoring devices were placed in the areas being remediated. Monitoring locations were selected to provide data for the worst-case scenario. Concentrations of uranium-238 ranging from 1.5 x 1 O-I4 to 5.8 x 1 013 pCi/ml were conservatively derived by collecting air
-particulate samples daily from lapel air samplers worn by workers. After gross activity per volume of air passing through the filter was determined, the source of all activity on the filter was conservatively assumed to be uranium-238. The derived air concentrations (DACs) were then compared with the applicable DOE guideline, which is a DAC of 2.0 x IO-" hCi/ml for occupational exposures to airborne uranium-238 (DOE Order 5480.1 I) .
Area air particulate sampling was also performed adjacent to areas being remediated to ensure that no member of the general public was exposed to radioactivity above DOE guidelines (DOE Order 5400.5). Because all remediation activities were conducted inside Building 23 and there were no open vents in the building, it was determined that exterior air particulate monitoring was not required. Data were collected daily from an Eberline RAS-I high-volume monitor and counted after four days to allow for radon decay. The limits in DOE Order 5400.5 are derived concentrations guides (DCGs); a DCG is the concentration of a particular radionuclide that would provide an effective dose equivalent of 100 mrem/yr (the DOE basic dose limit) to an individual continuously exposed to the radionuclide by one pathway for an entire year. Concentrations of uranium-238 measured by area particulate monitors ranged from 1.5 x lo-'' to 3.1 x pCi/ml. The DCG is 2.0 x lo-'* pCi/ml for uranium-238.
4.0 POST-REMEDIAL ACTION SAMPLING/SURVEYING RESULTS
After each portion of the property was decontaminated, a radiological survey of the area was conducted to confirm that all radioactive contamination above the cleanup criteria had been removed. Initial post-remediation surveys were conducted by Thermo Nuclear Services (TN) on behalf of the PMC. Survey techniques used during post-remediation and verification surveys included direct surface contamination measurements, removable contamination measurements, external gamma radiation exposure rate measurements, and soil sampling. The initial post-remediation surveys were conducted in accordance with TN procedures and PMC instruction guides. The JVC performed independent verification surveys of the floor, trusses, and bridge crane using survey techniques that were similar or identical to those used by TN. The IVC survey data will be issued in a separate verification report for CHV.
.
133-0001 .DOC ( 1 1/27/96) 7

4.1 POST-REMEDIAL ACTION SURVEY DATA
Post-remedial action survey data for each decontaminated.area are discussed in the following sections. .
10-Ton Bridge Crane
Post-remedial action activities on the crane included surveys of direct and removable contamination and sampling of paint and dust residues to determine whether the waste should be classified as a RCRA mixed waste. Figure 6 shows the survey locations, and Table 4 presents the survey data. A total of 169 locations were surveyed. Direct alpha and beta-gamma average surface contamination readings were 44 and 520 dpmll00 cm’, respectively. Average removable alpha and beta-gamma readings were 3 and 42 dpmll00 cm’, respectively. The crane was decontaminated to comply with the DOE residual contamination guidelines listed in Table 1 .
Table 9 presents sampling results used in bench-scale tests to determine whether treatment of the paint and dust residues was a feasible waste minimization technique. After the material was dissolved in acid and stabilized in a concrete monolith, a sample was collected to determine the classification of the waste. The sample result for TCLP lead was 338 p a ; for cadmium the result was 3.0 pg/L. Both results are well below the RCRA limits of 5,000 pg/L for lead and 1,000 p g L for cadmium.
Overhead Trusses
Surveys of fixed and removable contamination were conducted on the trusses to determine the effectiveness of the decontamination effort. The results of these surveys are included in Table 5. The maximum fixed averages per truss for alpha and beta-gamma contamination were 2,114 and 12,261 dpm/l00 cm’, respectively. Both of these readings, which were from truss 2, were below the supplemental limit of 15,000 dpm/l00 cm’ average per truss. All readings for removable contamination were below 1,000 dpmll00 cm’. An additional survey conducted on non-horizontal surfaces and between welded angles of the trusses confirmed that the supplemental limits had not been exceeded and that these areas did not require decontamination.
Horizontal Wall Surfaces
The ALARA approach to decontamination of the horizontal wall surfaces was to remove the contamination that exhibited a potential for resuspension or migration. Survey locations for the west, north, and south walls are shown in Figures 7, 8, and 9. Survey results for the west, north, and south walls are presented in Tables 6, 7, and 8. The maximum and average removable alpha measurements for the west wall were 164 and 17 dpm/lOO cm’; for the north wall, the maximum and average measurements were 850 and 35 dpm/lOO cm’; and measurements on the south wall were 1 1 1 and 17 dpm/lOO cm’, respectively. The maximum and average removable beta-gamma measurements for the west wall were
133-0001.DOC ( 1 1/27/96) ‘ 8

191 and 70 dpm/l00 cm’; for the north wall, the measurements were 3,197 and 58 dpm/l00 cm’; and measurements on the south wall were 3 19 and 45 dpm/lOO cm2, respectively. Except for a single reading on the north wall, all measurements were below the criterion of 1,000 dpml100 cm’ for removable contamination.
Floor
Figure 10 shows survey results of 1,598 survey locations on the floor of Building 23; all results were below DOE Order 5400.5 criteria. Fixed beta-gamma contamination was the contaminant of concern on the floor; therefore, only fixed beta-gamma measurements are summarized in Figure 10. The average fixed beta-gamma measurement was 914 dpm/l00 cm’; the minimum was -872 dpm/100 cm’; and the maximum was 4,934 dpm/lOO cm’. (Negative numbers indicate that the measurement was less than the minimum detectable activity and that after background was subtracted, the numerical value was negative.) A soil sample was also collected in the area where part of the west equipment door ramp was removed. Analytical results are presented in Table 9. The analytical result for uranium-238 was 2.0 pCi/g; for radium-226, the result was 0.47 pCi/g; and for thorium-232, the result was 0.41 pCi/g. A site-specific uranium guideline for CHV was not determined; however, these results were well below the typical uranium-238 guideline of 35 to 50 pCi/g for a FUSRAP site. The radium-226 and thorium-232 results are below the DOE Order 5400.5 criterion of 5 pCi/g for surface soils.
Drain Line
Following the removal of 145 ft of the 4-in. drain line in room B-4, three composite samples were collected in the trench to determine whether the decontamination effort was successful (see Table 9). The maximum level for uranium-238 was 0.62 pCi/g; for radium-226, the maximum was 0.47 pCi/g; and for thorium-232, the maximum was 0.50 pCi/g. A site-specific uranium.guideline for CHV was not determined; however, the results are well below the typical uranium-238 guideline of 35 to 50 pCi/g for a FUSRAP site. The radium-226 and thorium-232 results are below the DOE Order 5400.5 criterion of 5 pCi/g for surface soils. Contaminated drain piping was placed in an intermodal container and shipped to a licensed facility for disposal.
4.2 HAZARD ASSESSMENT/EXPOSURE SCENARIOS r
A hazard assessment was prepared to document the post-remediation condition of CHV (BNI 1995b). A summary of the exposure scenarios is included in this PRAR, and the results of the hazard assessment are summarized in Table 10. The hazard assessment also includes calculations to determine the total mass of uranium at CHV and the volumetric aciivity of the rubble resulting from building demolition.
133-0001.DOC (11127196) 9

The hazard assessment is based on the fact that contamination at CHV is found only in limited portions of Building 23. The total curie content of all affected building components is approximately 6 pCi. In addition, Building 23 is deteriorating, abandoned, and likely to be demolished.
The hypothetical demolition phases representing each of the building components, potential reuse or recycling of the components, and significant conditions and assumptions are described in the following exposure scenarios.
Roof De'molition
Contamination is consolidated into built-up roofing material. The primary exposure pathway is inhalation of contaminated dust. The primary dust-producing activities would be destroying the roof with heavy equipment (allowing the roof components to fall to the ground) and using heavy equipment to load the roof rubble into trucks. This scenario is plausible but conservative because the roof contains asbestos and the likely scenario would include appropriate asbestos controls, which would mitigate the release of airborne radioactivity and limit worker exposure.
Wall Demolition
Large quantities of dust would be produced during the use of a'wrecking ball (or other forceful demolition technique) to dismantle the walls of Building 23. The impact'of the ball would. be approximately 20 ft above the ground and would dislodge surface contami.nation on the walls and glass, surface. More dust would be produced as clean portions of the brick, mortar, arid.glass were pulverized.
and the rubble from one wall is removed before the next wall is demolished. In addition to the initial plume, contaminated dust would be requspended as rubble is removed.
-. To maximize the potential exposure scenario, it is assumed that demolition is performed one wall at a time, .
Structural Steel Demolition
No airborne contamination would result from demolition of the exposed steel surfaces because the surfaces were decontaminated during remedial action. Some areas such as gusset plates and intersections of steel members that were difficult to access could be a source of airborne contamination as the trusses are removed; therefore, it is assumed that some of the contamination from inaccessible areas will be dislodged as the steel building framework is dismantled. The contamination on the inaccessible surfaces is assumed to be the same as that on the exposed surfaces surveyed during characterization. The contamination is from deposited dust, which is assumed to be 0.1 cm thick.
The primary potential exposure pathways are inhalation and ingestion. The activity generating the most airborne contamination will be toppling the supporting beams and allowing the trusses to fall to the ground, where they will subsequently be salvaged for scrap. It is assumed that torch cutting will be performed to size the metal for transport. Airborne contamination will be released during the felling,
133-0001.DOC ( 1 1/27/96) - 1 0

cutting, and removal of the trusses. Assuming that all trusses are felled in a very short time period, the contaminated plume from the felling of any one truss will not have dissipated when the next truss is felled; therefore, the plume of airborne contamination will include all the contamination released from the trusses.
Personal contamination (and subsequent ingestion) will potentially occur as the trusses are handled during cutting and removal.
Steel Recycling
Potential exposures from reuse or recycling of the steel were considered for three'activities:
0
0
torch cutting the steel to the size necessary for smelt'ing, sand blasting the steel to remove lead-based paint so that the smelter will accept the steel, and disposing of the slag after the steel is smelted.
Floor Removal
The floor of Building 23 is composed of concrete, fire brick, or wooden blocks, with wooden blocks covering more than 90 percent of the floor area. A concrete base slab is under the fire bricks and wooden blocks. Isolated areas of contamination were found on the surface of the floor, in adhesive between the wooden blocks, in gaps in the fire brick, and possibly on the concrete base slab. The dose was calculated for a potential future worker removing the blocks left onsite during remedial action.
Reuse of Building Materials
The dose was calculated for an individual living in a small building constructed with the contaminated materials from CHV (Table 10). The building walls are constructed of materials from the west wall, the ceiling includes the roofing material, and the floor is constructed of the wooden blocks from the floor of Building 23.
4.3 CONCLUSIONS OF HAZARD ASSESSMENT
Residual contamination on the roof and walls of Building 23 will not result in a radiation dose above 100 mrem to any member of the general public. The maximum dose to a hypothetical demolition worker is estimated to be 5.6 mrem, and offsite exposure to the general public would be much less. Brick comprises approximately 64 percent of the mass of the contaminated portion of Building 23. The natural (background) radioactivity found in brick at the site is approximately 6.4 pCi/g. The radioactivity added by the surface contamination ranged from 0.1 8 to 1.5 pCi/g: an increase of approximately 23 percent. Because of the low radiation dose calculated for roof and wall contamination (and the fact that these calculations were very conservative and likely overestimated the dose), supplemental limits for these
133-0001 .DOC ( 1 1/27/96) 11

- . . .
building components would probably be the same as those used for the current,contamination levels, and no remedial action would need to be performed in these areas. The use of a hazard assessment and the development of supplemental limits resulted in a cost saving of $2 million for the remedial action at CHV.
5.0 POST-REMEDIAL ACTION STATUS
Analytical results from post-remedial action surveys indicate that the levels of radioactivity in the remediated areas meet applicable DOE cleanup guidelines. A summary of remedial action at CHV is provided in Table 1 1 . The IVC has reviewed the post-remedial action surveys and results and has verified that the remediated areas comply with the established DOE guidelines for the site. No areas of contamination above DOE guidelines or supplemental limits remain at the site.
After completing the verification survey, the IVC will report its findings and recommendations to DOE Headquarters and the DOE Oak Ridge Operations Office. DOE will review the report to verify that the remedial action was successful, and a certification docket will then be prepared. The certification docket officially certifies that the site has been successfully remediated to established criteria. The issuance of the certification docket will be documented through publication of a notice'in the Federal Register.
133-0001.DOC ( I 1/27/96) 12

, ,-.
REFERENCES
Bechtel National, Inc. (BNI), 1995a, FUSRAP Technical Memorandum - Chapman Valve Characterization Results, TM 133-45-003, Oak Ridge, Tenn. (May 4).
BNI, 1995b, Hazard Assessment for Chapman Valve Site, Calculation 133-CV-001 , Rev. 1
Klotsas, G . T. (Alderman and MacNeish), to J . L. Boyer (Con-Test, Inc.), 1994, Re: Roof Collapse, Crane Company, Indian Orchard, Massachusetts (April 28).
Oak Ridge National Laboratory, 1992, Results of the Radiological Survey at the Former Chapman Valve Manufacturing Company, Indian Orchard, Massachusetts, ORNL/RASA-92/1 , Oak Ridge, Tenn. ( July).
O'Connell, T. F. (Massachusetts Dept. of Public Health), letter to J. D. Kopotic (DOE-FSRD), 1995, Re: Concurrence with Proposed Remedial Action at Crane Company, BNI CCN 13 1 136, (June 14).
U.S. Department of Energy, 1995, Technical Study for the Remedial Action at the Chapman Valve Site, Indian Orchard, Massachusetts (May).
Wagoner, J. W. (DOE-HQ), memorandum to L. K. Price (DOE-FSRD), 1995, Suppleme-ntal Limits for Residual Uranium at the Chapman Valve Site, lndian Orchard Massachusetts, BNI CCN 132753 (July 27).
Weinberg, A. (Massachusetts Dept. of Environmental Protection), letter to Pantaleoni, A. D. (Crane Company), 1995, Re: Springfield 1-01 70, Crane Company, Pinevale, Goodwin, Moxon Sts., BNI CCN I31 136 (June 15).
13

GLOSSARY *
Alpha-emitting - See Radiation
Ambient Background Radiation - Ambient background radiation refers to naturally occurring radiation emitted from either cosmic (e.g., from the sun) or terrestrial (i.e., from the earth) sources. Exposure to this type of radiation is unavoidable, and its level varies greatly depending on geographic location. For example, New Jersey typically receives 100 millirem per year (mrem/yr), Colorado receives about 1 15 mrem/yr, and some areas in South America receive up to 7000 mrem/yr. Naturally occurring terrestrial radionuclides include uranium, radium, potassium, and thorium (see Radionuclide). The dose levels do not include the concentrations of naturally occurring radon inside buildings.
Beta-gamma-emitting - See Radiation
Centimeter - A centimeter (cm) is a metric unit of measurement for length; 1 inch is equal to 2.54 cm; 1 foot is equal to approximately 30 cni.
Contamination - The term “contamination” is used generally to mean a concentration of one or more radioactive materials that exceeds naturally occurring levels. Contamination may or may not exceed the DOE cleanup guidelines.
Disintegrations per minute - Disintegrations per.minute (dpm) is the measurement indicating the amount of radiation being released from a substance per minute.
Dose - As used in this report, dose is actually dose equivalent and is used to relate absorbed dose (mrad) to an effect on the body. Dose is measured in mrem. For comparison, a dose of 500,000 mrem to the whole body within a short time causes death in 50 percent of the people who receive it; a dose of 5,000,000 mrem may be delivered to a cancerous tumor during radiation treatment; normal background radiation at or near sea level results in an annual dose of about 100 mrem; DOE radiation protection standards limit the dose that may be received by members of the general public to 100 mrem/yr above background levels; living in a brick house typically results in a dose of about 75 mredyr above the background level.
Exposure Rate - Exposure rate is the rate at which radiation imparts energy to the air. Exposure is typically measured in microroentgens (pR1,’and exposure rate is typically expressed as pR/hr. The dose to the whole body can be approximated by multiplying the exposure rate by the number of hours of exposure. For example, if an individual were exposed to gamma radiation at a rate of 20pFUhr for 168 hr/week (continuous exposure) for 52 weeks/yr, the whole-body dose would be approximately 175 mrem/yr.
Gamma Radiation - See Radiation
Meter - A meter (m) is a metric unit of length; 1 m is equal to approximately 39 inches.
133-0001.DOC ( I 1/27/96) ‘ 14
Microroentgen - A microroentgen (pR) is a unit used to measure radiation exposure. For further information, see Exposure Rate.
Millirem - The millirem (mrem) is the unit used to measure radiation dose to man. The DOE dose limit is 100 mrem above background radiation levels within any one-year period for members of the general public. Naturally occurring radioactive substances in the ground result in a yearly exposure of about 100 mrem to each member of the population. To date, no difference can be detected between the health of population groups exposed to 100 mrem/yr above background and the health of groups who are not exposed.
Natural Background Radiation - Natural background radiation refers to radiation emitted from the naturally occurring radionuclides found in manmade materials. The concentrations of the radionuclide, and thus the radiation, will vary widely because of variation in the composition of the materials.
Radiation - There are three primary types of radiation: alpha, beta, and gamma. Alpha radiation travels less than an inch in air before it stops, and it cannot penetrate the outer layers of human skin. Beta radiation can penetrate the outer layers of skin but cannot reach the internal organs. Gamma radiation, the most penetrating type, can usually reach the internal organs.
Radionuclide - Radioactive elements are also referred to as radionuclides. For example, uranium-235 is a radionuclide, uranium-238 is another, thorium-232 is another, and so on.
Remedial Action - Remedial action is a general term used to mean cleanup of contamination that exceeds DOE guidelines. It refers to any action required so that a property may be certified as being in compliance with guidelines and may therefore be released for future use. Remedial action also includes restoring remediated properties to their original conditions as far as possible. .
.
Uranium - Uranium is a naturally occurring radioactive element. The principal use of refined uranium is for the production of fuel for nuclear reactors. Uranium in its natural form is not suitable for use as a fuel source.
,
. .
133-0001.DO;C (1 1/27/96) 15

FIGURES .

0 I 2 M I L E S
0 1.5 3 . KILOt4ETERS
R76F 01 0. DGN
Figure 1 Approximate Location of Chapman Valve Site
19
. .

I +- E 0 z
I 8 I e i I I
5 EO BAYS @ 20' -O"=lOO' -0" I I
I I I
I I I I I I I BLOC 40 CONSTRUCTION TRAILER 7
\ I I I I I l l A WOOD WALL I f I/ I e-- @--. ]I
e- I \
' I . n,.
X INTERMODAL
I 40' SEA VAN lc i
I TEMPORARY WALL DURING MED/AEC A C T I V I T I E S STEEL COLUMN WITH
BRICK FACE ITYP)
FURNACE
STEEL PLATES
D I P TANK
SUMP
SHOT BLAST ROOM
- - - I o
,m GENERAL AREA OF CONTANINATION
CHIP BURNER
P I P E TUNNEL
I
STEEL RAILS (USED BY GOND~LAS
P I P E TRENCH I . I
SHOWERS AN0 CHANGE I
TO LOAD METAL INTO FURNACE) I
HOUSE ON SECOND FLOOR ,
'k- SECURITY FENCE
/// FLOOR PLAN
I X
E t
P T =
ROTO BLASTER
CONTAMINATION CONTROL BOUNDARY
SCALE
0 50 FEET
0 -5 1.5 METERS
1 I I
R76F009. DGN Figure 2 Chapman Valve
Building 23 - Plan View
: 21

B t D
I I-
0 z a
0-
@- 0-
STEEL COLUMN WITH BRICK FACE (TYP)
3 SCREEN WALLS
P I P E TUNNEL
FLOOR P L A N
4E
@- 0- 0- 0- a- @-
ROOF FRAMING P L A N
i :
. I
1
I
I
I
I
AREA- OF CONTAMINATION ’ CONTAMINATED ROOF TRUSS
DEGRADED ROOF
BIASED BOREHOLES SYSTEMATIC BOREHOLES COLUMN P I P E TRENCH FURNACE DRAIN L I N E S REMOVED DURING RA MANHOLE PIPE TUNNEL
STEEL R A I L S IUSEO BY GONDOLAS TO LOA0 METAL INTO FURNACE) STEEL PLATES
D I P TANK
SUMP SHOT BLAST ROOM
ROTO BLASTER
SHDKRS AND CHANGE HOUSE ON SECOND FLOOR
SCALE
0 30 60 FEET
0 9 18 METERS -
R76F007. DGN Figure 3 Chapman Valve - 1994 Characterization Results
Plan Views 23
GLASS WINDOWS COVERED BY EXTERIOR S I D I N G
WINDOW FRAMES WITH PLYWOOD INSERTS LTYP)
WLL A - ELEVATION Lo(r(IwG NORTH
GLASS WINOOWS COVE BY EXTERIOR S ID ING
'JBRICK COLUMN (TYPI BRICK ITYP)-/
I
- E ] CONTAMINATED SURFACE
INDICATES OPENING OR DOORWAY
SCALE -
0 40 FEET
0 6 12 METERS \ k
R76F006. DGN Figure 4 Chapman Valve - 1994 Characterization Results
Interior North and South Walls
25

k
I I 96' -0' 0 96' -0' 0
I I
22' -0' I 17' -0' 18' -0' 11' -0' I 22' -0' I
-GLASS WINDOWS COVERED BY EXTERIOR S I D I N G (TYP)
\BRICK ITYPI
WALL 1 - ELEVATION LOOKING WEST COLUN 3 - ELEVATION LOOKING WEST
1-1 CDNTAHINATEO SURFACE
0 8 16 FEE1
SCALE
R76F008.OGN , I Figure 5 Chapman Valve - 1994 Characterization Results
Interior West Wall
27

\
40 ' 39 38
BOTTOM V.IEW
f
85 . 86
H O I S T 84 83 92
I 2 6 . 87 125 88 1 2 4 123 89
82 127 81 128 80
WEST V I E W
CONTROL
36 9 7 BOOTH
NOTE: APPROXIMATE LENGTH OF CRANE 52 F T
% ' 3 ' ~ 3 0 1 2 0 1 2 9 1 3 2 95 1 2 1 . EAST GIRDER 122 94 33 JI 29 27 25 23 21 19
26 24 2 2 .20 34 32 CATWALK , 35=
R76F01 I .DGN
I CONTROL
BOOTH
Figure 6 Post-Remedial Action Survey Locations
on Overhead Crane
7
29

I 1
- c - - - - -4 -. =
1
- - - I r
-
I
I
-
I i
R76F005. DGN
I
I I
I - + I . '
I I I
I i ' I
,--- CRANE GIRDER
I
I !
I
- & A S S WINDOWS COVERED BY E X T E R I O R S l O l N C (TYP)
4 8 FEET 0 I I
SCALE
Figure 7 Post-Remedial Action Survey Locations
Interior West Wall

w w
Q I
@ I
@ I
@ I
J I I I I I I
I I I. I ( I Y P ) I .
I I I
I I I
I I I I
GLASS WINDOWS COVE RED^ BY EXTERIOR S I D I N G 7 I
I I
I I I
I I 1 WOOD DECKING ROOF -1 .
I I I
I I I I
I .I
@ R I C K COLUMN ( T Y P )
8 15 f E C 1
SCALE
Figure 8 Post-Remedial Action Survey Locations
Interior North Wall
R76F003.DGN

w P
@ I
Q I
0 I
@ I
0 I
0 I Q I '
I I
I j I
i SCREEN PANELS ( T Y P l
CORRUGATE0 PbNELS (IYPI
0 8 . 1 6 F E E i Ud
SCALE
R76F004. DGN Figure 9
Post-Remedial Action Survey hterior South Wall
-0cations

I 8
I
- H O R i H
@-
0-
0- <'
-1
c
c
SCALE
10 20 F E E T P i 0 5 i M E T E X
y::
A < 5000 d ~ m i l O O cm2 4000 aDm/loc Cill
3000 dpm/ I00 Cm * 2000 dpm/lOO cm 1000 dpm/lOi) cm2 A . C A M M I ; EXPOSURE R A T E
SUiWEY LOCPTIONS
Figure 10 Chapman Valve Post-Remedial Action Floor Survey
35

I 1 1 U 1 1
. . TABLES

TABLE 1 SUMMARY OF RESIDUAL CONTAMINATION GUIDELINES
BASIC DOSE LIMITS
The basic limit for the annual radiation dose (including all pathways except radon) received by an individual member of the general public is 100 mrem/yr above background. In implementing this limit, DOE applies as-low- as-reasonably achievable principles to set site-specific guidelines.
SOIL GUIDELINES
Radionuclide
Radium-226 Radium-228 Thorium-230 Thorium-232
. Total Uranium
Soil Concentration (pcilg) Above
5 pCi/g when averaged over the first 15 cm of soil below the surface and over any contiguous 100-m2 surface area; 15 pCi/g when averaged over any 15-cm-thick soil layer below the surface layer and over any contiguous 100-m2 surface area.
Site-specific uranium guideline for Chapman Valve was not determined.
STRUCTURE GUIDELINES
Airborne Radon Decay Products . ,
. .
Generic guidelines for concentrations of airborne radon decay products shall apply to existing occupied or, habitable structures on private property that has no radiological restrictions on its use; structures that will be demolished or buried are excluded. The applicable generic guideline '(40 CFR 192) is: In any occupied or habitable building, the objective of remedial action shall 'be, and reasonable effort shall be made to achieve, an annual average (or equivalent) radon decay product concentration (including background) not to exceed 0.02 WLd. In any case; the radon decay product concentration (including background) shall not exceed 0.03 WL. Remedial actions are not required in order to comply with this guideline when there is reasonable assurance that residual' radioactive materials are not the cause.
External Ga,mma Radiation
The average level of gamma radiation inside a building or habitable structure on a site that has no radiological restrictions on its use shall not exceed the background level by more than 20 pR/h and will comply with the basic dose limits when an appropriate-use scenario is considered.
IndoorlOutdoor Structure Surface Contamination 1
Allowable Surface Residual Contaminatione
Radionuclide' AveraqegYh Maximumhfi Remova,blehii
(dpmll00 .cm2)
. . . .
Transuranics, Ra-226, Ra-228, Th-230, Tht228 100 . ' 300 20
Th-Natural, Th-232, Sr-90, Ra-223, Ra-224 1,000 3,000 200
U-Natural, U-235, U-238, and. associated decay products 5,000 a 15,000 a 1,000 a
Pa-231, Ac-227, 1-125, I-12gk
U-232, 1-126, 1-131, 1-133 ,
Beta-gamma emitters (radionuclides' with decay modes other than alpha emission or spontaneous fission) except Sr-90 and others noted above'
5,000 I3 - y 15,000 I3 - y 1,000 I3 - y
24.19 4392.5 39

TABLE 1 (CONTl NU ED)
aThese guidelines take into account ingrowth of radium-226 from thorium-230 and of radium-228 from thorium-232, and assume secular equilibrium. If either thorium-230 and radium-226 or thorium-232 and radium-228 are both present, not in secular equilibrium, the guidelines apply to the higher concentration. If other mixtures of radionuclides occur, the concentrations of individual radionuclides shall be reduced so that (1) the dose for the mixtures will not exceed the basic dose limit, or (2) the sum of ratios of the soil concentration of each radionuclide to the allowable limit for that radionuclide will not exceed 1 ("unity").
layer to any depth and over any contiguous 100:m2 surface area.
authorized limit or guideline by a factor of (1O0/A)ln, where A is the area of the elevated region in square meters, limits for "hot spots" shall also be applicable. Procedures for calculating these hot spot limits, which depend on the extent of the elevated local concentrations, are given in the DOE Manual for Implementing Residual Radioactive Materials Guidelines, DOE/CH/8901. In addition, every reasonable effort shall be made to remove any source of radionuclide that exceeds 30 times the appropriate limit for soil, irrespective of the average concentration in the soil.
dA working level (WL) is any combination of short-lived radon decay products in 1 liter of air that will result in the ultimate emission of 1 . 3 ' ~ l o5 MeV of potential alpha energy.
eAs used in this table, dpm (disintegrations per minute) means the rate of emission by radioactive material as determined by correcting the counts per minute measured by an appropriate detector for background, efficiency, and geometric factors associated with the instrumentation.
alpha- and beta-gamma-emitting radionuclides should apply independently.
.
b-rhese guidelines represent allowable residual concentrations above background averaged across any 15-cm-thick
'If the average concentration in any surface or below-sudace area less than or equal to 25'm2exceeds the
fWhere surface contamination by both alpha- and beta-gamma-emitting radionuclides exists, the limits established for
gMeasurements of average contamination should not be averaged.over an area of more than 1 m2: For objects of
hThe average and maximum dose rates associated with surface contamination resulting from beta-gamma emitters should not exceed 0.2 mrad/h .and 1 .O mrad/h, respectively, at a depth of .1 cm.
'The maximum contamination level applies to an area of not more than 100 cm2.
less surface area, the average should be derived for each such object. . .
.
.
h h e amount of removable radioactive material per 100 cm2 of surface area should be determined by wiping an area of that size with dry filter or soft absorbent paper, applying moderate pressure, and measuring the amount of radioactive material on the wipe with an appropriate instrument of known efficiency. When removable contamination on objects of surface area less than 100 cm2 is determined, the activity per .unit area should be based on the actual area, and the entire surface should be wiped. It is not necessary to use wiping techniques to measure removable. contamination levels if direct scan surveys indicate that total residual surface Contamination levels are within the limits for removable contamination.
KGuidelines for these radionuclides are not given in DOE Order 5400.5; however, these guidelines are considered applicable based on "DOE Guidelines for Residual Radioactive Materials at FUSRAP and Remote SFMP Sites," Revision 2, March 1987.
'
I This category of radionuclides includes mixed fission products, including the Sr-90 which is present in them. It does not apply to Sr-90 which has been separated from the other fission products or mixtures where the Sr-90 has been enriched.
Source: DOE Order 5400.5 and 40 CFR 192
24.19 4392.6 40

Table 2 Decontamination Techniques Used at the Chapman Valve Site
TY Pe Description .
HEPA Vacuuming High-efficiency particulate air- (HEPA-) filtered vacuum cleaners were used to remove loose contamination and dust. HEPA-filtered vacuums were also used in conjunction with other techniques (grinding, wire brushing, etc.) to eliminate the airborne contamination associated with these techniques.
Jackhammering
Excavation
Wire Brushing
Scraping
Conventional jackhammers were used on small areas to remove anchor bolts from the concrete slab. Skid steer loaders equipped with hoe-ram attachments were used to remove the wooden blocks from the floor and to break up the concrete pads to expose the base slab.
Contaminated concrete and debris were removed from the building with a skid steer loader. Removal of contaminated soil from the west ramp and excavation of the pipe were performed with shovels.
Small areas on the overhead trusses requiring rework were wire brushed to remove contamination.
Putty knives were used to scrape contamination from the surface of the 10-ton crane and from wooden planks removed from the crane deck.
41
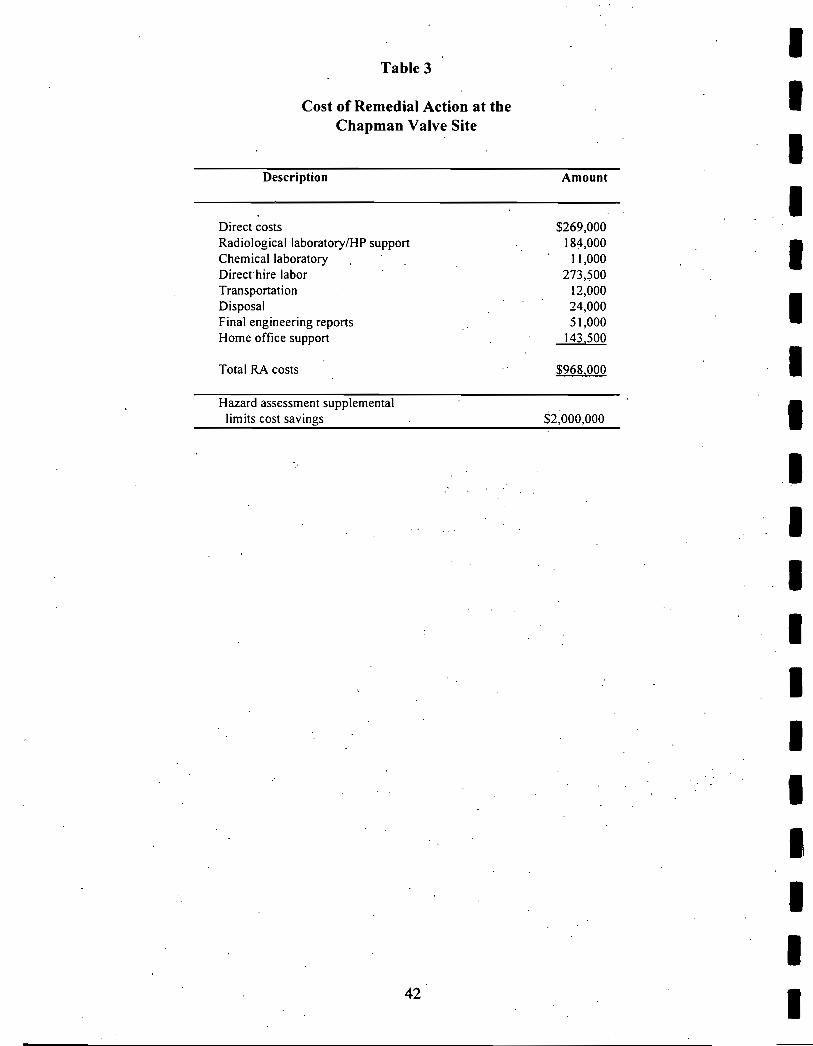
Table 3
Cost of Remedial Action at the Chapman Valve Site
Description Amount
Direct costs $269,000 Radiological laboratory/HP support 184,000
Direct hire labor 273,500
Disposal 24,000 Final engineering reports 5 1,000 Home office support 143,500
Total RA costs $968,000
Chemical laboratory 1 1,000
Transportation 12,000
Hazard assessment supplemental limits cost savings $2;000,000
. . . .
. .
42

Table 4 Post-Remedial Actic
Location Direct (dDmll00 cm2) Removable (dDml100 cmL)I) Number
1 2 3 4 5 6 7
8
9
10 . 11
12
13 14 15 16 17
18
19
20
21
22
23
24
25
26
27
28
29
30
31 32
e
. . . . Alpha BetalGamma Alpha BetalGamma
201 2 16 1 -6 9 1 -6 -6
-6
-6 16
9 1
9 9 1
37 9
-6 15
-5
48
15
21
1 21
55
15
8
21
35
28
48.
51 3 31 3 223 335 112 201
402
380 491 31 3
134 357 201 290 0
112
290 1670
-329
1771
177
607
633 253
3416.
329 2049 -278
1619 1569
531
2 -1 2 -1 -1 -1
-1
-1
2
5 -1 2 2 -1 2 2
-1
-2 b - - 4 b
b
b
b
_ - - - - - - - 1 b - - 1 b _ _
10 4 b - -
-1 9 20 -53 -45 15 41
110
3 80
50 114 11 -15 33 .20
24
7 . b - -
. 15. b
- b
b
b
- - - - - - - - 45 b - -
-53 b - -
63 11 b - -
84 110 '
Survey Data - Cranea Direct (dpm/lOO cm') Removable (dpmll00 cm')" Location
Number 33
. .
34 35 36 37 38 39 40
41
42 43 44
45 46 47 48 49
50
51
5 2
53 .
54 55
56
57 58
59
60 61
62 63 64
Aloha BetalGamma 8 15 15 15 1 -5 8 21
26
12 19
-3 4 4
134 220 163
55
4
12
19
19
19
-3
12
148
91
26 19
62 12 -3
-177 25
-354 -76 354 -101 -380
708 101
557 -1 27
177
633 48 1 1493 2378 2606
. 708
936
354
734
91 1
405
607
53 1
1695
2075
253 0
354 177 633
Abha BetalGamma

Table 4 - Continued Post-Remedial Action Survey Data - Cranea
Location Direct (dpmll00 cm2) Removable (dpmll00 cm2)b
Number Alpha BetalGamma Alpha
65
66 67
68
69. 70
71
72
73
74 . 75
76 77
78
79
80
81
82 83 84
85 86
t
. 87 88
89
90 . 91
92
93 94
95
4
19 26
270
83
-3
-3
148
40
12.
62
19 4
12
-3
199
98. 40'
26 12
91' 62
-3 . 19. 4
33
12 12 4 "
12
12'
860
734 961
3238 .
1189
886
759
3669
. 3087
202 .
936
101 582 .
127
329
3719
1645
1113.
. 961 810
, 1898
31 37 633
481
708
25
329
506 177
582
734
Location
Number
96
97 98
99
100 . 101
102
103
104
105
106
I07
108
109
110 111
112
113 114
1 I5 116
117
118 119
120 121
122
123
124
125
126
=
Direct fdDml100 cm? Removable fdomll 00 cm2)b
Alpha BetalGamma
4
-3 12
112
4
19.
40
26
19
55
, -43
-43
-33
-43
-43
-43
-24
-43 -43 -33 -24
-24
-43 -33
22
-43
-43
-24
4
13
-43
m m
~
531
405 304
2758
455
354
810
810
683
860
-578
-509
-254
-462
-185
-162
-624
-509 -971 ,
-948 -879
-462
-486 -832'
-254
-624
-555
-786 .
-809
-439
-254 -
Alpha . BetalGamma
m m

Table 4 - Continued Past-Remedial Action Survev Data - Cranea
P 'VI
I
Number Alpha BetalGamma Alpha b b . - _ - - - 127 -24 -786
128 129
130 131
132
133
134
135
136 137 138
139 140
141.
142
143
144
145 146
147
-33 -647
. 689 -324
198 -69
143 23
319 -92 87 -370
235 3237
161 671 13 1156
4 324 -43 69
-33 -254 4 3 -925
-43 -416
13 -879
172 651
24 31 1
43 481 6 1471
89 396 12 b _ _ b b - _ _ - 148 302 283,
. . -. . - .
b b - _ - - 149 459 736 150 552 5348 9 ' -1 7
151 , . 274 4641 1 58 b b
b b
b b
b -b-
_ - - _ 152 98 368
' 153 43 -57
15 85 154 -4 -1 70 155
156 24 538 1 57 24 -31 1
158 24 -226
- - _ - _ - _ _
- - b
b b
b b .
. -b- - - _ _ - - - - - -
159 . 70 1585 1 31
538 256 160 161 . ' 89 198 162 61 - -113 .
163 98 31 1
b b
b b .
b b
b b
- - - _ _ - - - - - - -
. .
- _ - - . 164 172 , . 1330 12 20
b b
b b
b b
b b
b b
b b
- _ -170 - - 165 80 166 43 -85'
167 33 ' 283 168 70 -198
169 ' 61 -198
- - _ - - _ - - _ - _ _
- - - - - - - _
4VERAGE 44 520 3 42
IOE Guideline 5000 5000 1000 1000 a
b ' Transferable surface readings were not taken beduse direct readings were less than the transferable criterion of 1000 dpd100 cm2
Negative numbers indicate that the measurement was less than fhe minimum detectible activity and that after background was subtracted,
. the numerical value.was negative.
for that location. . .

Table 5 Post-Remedial Action Survey Data - Trusses and Overheads'
Horizontal Surfaces Non-Horizontal Surfaces Light Fixtures (dpdl00 cm2) (dpm/l00 cm2) (dpm/l 00 cm2)
Number Direct Removable Direct Removable Direct Removable
Truss of Betal Betal Betal Betal Betal Betal Number Locations Alpha Gamma Alpha Gamma Alpha Gamma Alpha Gamma Alpha Gamma Alpha Gamma
1 160 Average 452 5657 24 112 702 3173 27 128 859 3758 65 227 Maximum 2221 27841 101 302 1776 7330 78 244 1471 481 0 117 339 Minimum 4 139 -2 0 4 -277 -2 41 161 2798 35 132
- ---- - - ---
2 101 Average . 2114 12261 18 125 1869 6175 20 107 794 2336 2 62 Maximum 17577 1 1 1967 193 539 17397 . 18280 88 573 1300 3677 7 79 Minimum -9 277. -2 -25 102 948 -2 -1 7 59 -1 85 -2 44
3 69 Average 907 4266 29 70 , 889 ,5383 17 . 61 129 Maximum 9973 28806 368 634 5916 27419 55
Minimum 26 113 -2 -20 7 -85 -2 0 48
MaximDm 7024, 17827 . 42 180 1450 10017 192 Minimum . 26 -792 -2 14 . 7 -481 0 -1 9
b b b b
b b b b
b b b b
b b b b
b b b '-b-
. b b .
- _ - - - - - - _ _ - - - - _ _
* - _ - - _ - _ - _ - - _ - _ _
- - _ - 4 68 Average 361 1773 1 1 55 483 2221 21
502 _ - b b - - - - _ - - _
5 150 Average 422 1783 7 27 316 1245 3 19 432 1186 18 17 Maximum 4724 14591 58 98 . '741 41 85 9 62 808 4324 35 49 Mini m u m 17 -347 -2 -36 -7 -162 -1 -1 9 4 -254 -1 -39
P o\
b b b b
b b b b
b b b b
- - - - - - - _ 6 67 Average 243 1395 9 27 114 81 5 1 lo - _ - - - - - _ Maximum 1400 17940 131 31 0 715 8319 8 76 - - - - - - - _ Minimum -8 -453 -1 -16 . -7 -283 -1 -29
b b
b b b b
b b b ' b
- - b ' b - - - _ . - _ 2 18 _ - - - - _
7 71 Average 329 1923 ' 3 ' 36 201 865 902. 5263 9 156 - -
- _ _ _ Maximum 1773 12507 15 173
- - - - Minimum 13 -509 -1 -31. -6 -509 -1 -14 b b b b
b b b b
b b b b
C C C C C C C C
C C C C C C C C
C C C C C C C C
- - - - _ _ - _ 8 43 Average 344 2567 14 -32 . 287 1592 10 -1 0 - - - _ - - - _ Maximum 1389 20141 42 123 556 5388 28 42 - - - - _ _ - _ Minimum 0 -439 0 -33 93 -90 -1 -1 14
- - - - _ - - - -.# - - - _ - - 1 to 8' 40 Average 161 627 2 8 - - - - _ - - - - - - - - _ - _ Maximum 1895 11084 25 256 - _ - - - - - - - - _ _ - - - - Minimum -22 -31 5 0 -62
Supplemental Limitd 15000 15000 1000 . 1000 15000 15000 1000 , 1000 15000 15000 1000 1000 a Negative numbers indicate that the measurement was less than the minimum detectible activity and that after background was subtracted the numerical value
was negative. ,
These truss areas did not contain light fixtures. This'survey was performed on the underside of horizontal surfaces and in the area between back-to-back welded angles on all eight trusses. Non-horizontal
surfaces and light fixtures were not surveyed. The supplemental limit is an average for the truss; there is no maximum limit.

Table 6 Post-Remedial Action Survey Data -West Walla
Location Direct (dDm/l00 cm') Removable (dpmll00 cm')" Location Direct (dpmll00 cm') Removable (dpm1100 cm')' Number Alpha BetalGamma Alpha BetalGamma
1 100 2 82 . 3 193 4 137
5 1304
6 878 7 2508
8 693
9 600
10 2230
11 4824 12 3731 13 44 14 248 15' 359 16 433 17 1 74
18 63
19 137
20 433
4075
3792
8489 14375
37295
61 743 15903 22977
59479 130787
60045 5433 5999 . 4301 34692 10922 14997
16921
22354
6508 .
-1 -1
-1
5 12
42
9 5
75
164
9 138 5 -1 2 2 9 5
5
- 5
18
24 4
45
119
401 .
123 106
22 1
919
113 594 38 28 89 14 31
92 . . 102,
18 85 21 878 151.67 2 . '
I
BetalGamma Number Alpha BetalGamma Alpha
22 989 8263 19 187 23 878 80985 9 119
24 322 5490 -1 -6 25 626 23147 19 52 26 774 11 149 2 65 27 4470 14544 108 170
28 6 2999 2 -30
29 6 6112 12 18
30 70 4980 2 18 31 43 1471 -1 18
61 170 - - 32 33 6 1075 9 18 34 154 30730 2 -37 35 302 12620 2 -16 36 395 26033 15 4 37 376 10413 9 31 38 24 4075 9 4
39 43 3679 5 -9
40 43 1585 2 -64
41 61 6452 -1 -57 42 24 2999 2 -30
- - b b
Average 708 19410 17 70 C C - - C - - C Doe Guideline _ - - -
a Negative numbers indicate that the measurement was less than the minimum detectible activity and that after background, was subtracted, . . the numerical value was negative. , .
Removable surface readings were not taken because direct readings were less than the removable criteria of 1000'dpml100 cm2 for that location.
'The walls were decontaminated to comply with DOE'S AURA policy, and the data collected are intended to be used in the final hazard assessment calculation; therefore, there are no specific surface criteria that apply to the walls.
b

Table 7 Post-Remedial Action
Location Direct (dpmll00 cm') Removable (dpmMI100 cm')" Number' Alpha BetalGamma Alpha BetalGamma
1 20 '
2 3
4 . 5 6 7
8
9
10 11
12
13 14
. 15 P 00 16
' 17
18 19
20 21 22
23 24
25
26 27
28
29 30 31 32
48 104 187 2 39 2
57
2 113
39
30 104 94 113 57 11
57
11
178
94 85
2
48
233
919 243
122
39 326 345 317
m
5018 5 2428 15 2914 22 2336 9 3839 .-1 2243 2 2752
261 3
2729
3839 2312
2567 '.
2798 1896 2613 2891 3908
2359 2474
1734 2914
2497,
2289
3006 12071
10082 3422
856 5272
5365 1688 1526
2 12
-1.
?2 9
5 15 2 12
5 . 2
1 5 . 2 '
-1 .
5 2 -1
.12 32
15
'25
9
5 35 '
5 2
n
-16 -3 -3
-1 3 -9 -1 6 -1 6 -37
-23
11
-57 , *
11
-43 45 -30 .
-9
4 -6 -9
4 '
11 '
-23 '
' 31
-64
-40
4 .
48
18
' -9 72
-43. -9
urvey Data - North Walla Direct ( d p d l 0 0 cmL) Removable (dpmll00 anL)' Location
Number 34 35 36 37 38 39 40
41 . 42
43
44 .
45
46 47 48 49 50 51
' 52'
53
'54 ' 55
56
57
58
59
60
61
62 63 64 65
D
Alpha BetalGamma 419 1711 270 622 270 76 1 270 94 187
21 5 57 743
' 919
1762 39
, 947 1104 965
11
11
30
2 21 5
30 ' 1 1
11
76
11 48 150
530 307
30
=
2844 2960 3908 2567 3307 3422 4902
4394
1156 3006
8949
36698 301
25714 3839 6914
1781 1017
185
1295 '
1457
925
1226
, 6 4 7
139
439 69
1017
1503 717
301
Alpha BetalGamma 19 22 12 29 22
' 2 2
12
32
9
5 12
850 " b - _ . 15
65 -1
5 -2 b - - 1
.ll b - - 1 b
b
b
b
.- - - - - - - - 11
28 b
. b
_ _ - -
=
-16 18 18 68 24 -32 -23
62
18
126
143 11

m I ’ :
,
m
Table 7 - continued Post-Remedial Action
Location Direct (dpmll00 cm2) Removable (dpmll00 cm2)b
Number Alpha BetalGamma Alpha BetalGamma - 33 919 1503 22 79 67 363 740
68 132 763
69 539 1434 -2 33 70 11 2127 5 -5
71 178 1064 8 22
72 280 1202 18 39
73 243 2428 21 9 74 94 555 75 30 1804 11 -59
76 169 532 77 85 2405 18 -28
78 94 -1 85
79 910 2012 38 -45 80 11 1526 -2 39 81 335 1896 11 46
b b ’
b b
- - - - - - - -
b b - - - -
b b - - _ -
b b - - _ _
urvey Data - North Walla Location Direct (dpmll00 cm’) Removable (dpmll00 cm2)b
Number Alpha BetalGamma Alpha BetalGamma b b - - - - 66 104 856
82 169 1064 18 -35 83 39 509 - - 84 548 6544 31 185 85 132 1572 21 29
86 48 23
87 1021 14268 31 155 88 48 3645 15 39 89 576 3076 15 -62
90 20 -416 91 1437 27749 25 243
92 2595 4648 213 266
93 345 4 6
94 372 2359 34 100
95 446 7307 101 209 96 48 41 16 5 -32
b _ - b
b - - b - -
b b - _ _ -
b b - - - -
Average 1001 2823 35 58 C c - _ C -c- lee Guideline - - - -
a Negative numbers indicate that the measurement was less than the minimum detectible activity and that after background was subtracted,
the numerical value was negative.
Removable surface readings were not taken because direct readings were less than the removable criterion of 1000 dpmll00 cm2
for that location.
The walls were decontaminated to comply with DOE’S AURA policy, and the data.collected are intended to be used in the final hazard assessment calculation; therefore, there are.no,specific surface criteria that apply to the walls.
. .
C ’

Table 8
VI 0
Post-Remedial Action Location Direct (dpmll00 cm') Removable (dpm1100 cm')D Number Aloha BetalGamma Aloha BetalGamma
r :
2564 1 2 3 4 .5 6 7
8 9
10
11
12
13 14 15 16 17
18
19
20 21
22
23 24
25
26 27
28
29 30
31 32
7 2230 44 304 82 545
3710 191
3358
691.
209
1450 135 432 80
7804
784 580 :
2228 5414
691
11
196
67 '
187' 39
67
1067 104 . '
178 -7 .
=
41 709 22 283
7074 12677 7866 3056 2264
17714
849
, 9508
26005 .
3735
9508 2490 ,2490 1471
20543
14488 44822
67572. .
' 11375
13639
' 2867 467 1
324
2428 2960 ' . 2035 1202 2821
531 9 721 5
b _ _ 5 -1 5 -1 -1
5
39
111
9 '
5
22 15 72 9
88
12. ,
19 32 '
25
22
1 1 b _ -
11 -2
5 8 1
15 -2
=
. b _ _ 102 11 52 1
-23
55
150
319
31
24
153 52 252 -3
241
72 126
153 99
24
-59 ' :62
b
-1 5 4 5
-1 2 26
16
- _
-52 2
=
265
uwey Data - South Walla Direct (dpmll00 cm') Removable (dDmll00 cmLID
35 36 37 38 39 40
' 41
42
43 44
45
h6 47 48 49 50
51
52
53
54 55
56 57
58 59 60
61 62
63
64 65
Location Number
34
. . Alpha BetalGamma 354 740 261 761 67 428 196 483
122
539
215
85
122
641 122 132 30 39
. 67
446
558 1947
-7
354 169
409 48 261
372 187.
30
2 169
=
1272 8140 1665 4255 5850 7538
971
2451
694
. 971
2336
2497 6428 1873 1734 3214
-1 62
4509
925
5758 '
-324
1665 902
5943. -370 2127
2197
2359
763 .
-624 694
. . Alpha BetalGamma
D . n _ _ 21 34 11 18 15 28 11
8 Lb-
b - - ' . 1
28 ' 8
1 5 8
' b - - 38 b . - -
68 b - - 5 b _ -
44 b _ _ 5
21 18 b
b
. b
- - - - _ -
=
_ _ 33 134 -39 5
94 -5
-25
-56 b
b
- - - - -25
-1 -8 -35 -1 26 -b-
56 b _ _
161 b
-76 b
_ _ - - 175
b - - 49
16
138 b
. b
b
- - _ - _ _
I-

Table 8 - Continued Post-Remedial Action Sunrev Data - South Walla
Location Direct (dpm/l00 cm') Removable (dpmll00 cm2)b
Number Alpha BetalGamma Alpha BetalGamma - 33 567 4278 11 121 67 283 . 1188 32 . ' 106
6 . 4358 2 -50 68 69 1469. 3452 12 45
70 580 1075 9 -30'
71 265 1981 9 .85 72 . 450 ' 10696 12 . 75
a
Location Direct (dpmll00 cm2) Removable (dpm/100 cm2)b Number Alpha BetalGamma Alpha BetalGarnma
b b - - - - 66 104 578 73. 450 22864 2 " 11 74 43 ' 3679 2 -23
75 98 2320 15' -6
77 . 6 1358 -1 -37
Average 642 6387 17 45
76 43 2037 5 -9
- C C C C - - - - - - Doe Guideline - -
.. for that location.
The walls were decontaminated to comply with DOES AURA policy', and the data collected are intended to be used in the final hazard assessment calculation; therefore, there are no specific surface criteria that apply to the walls.
VI ' I -
'
. . .

. Table 9
Post-Remedial Action and Bench - Scale Sampling Resultsa
Location
Dust from crane (mixed with concrete) Bench,Scale Test (Ratio 2) Bench Scale Test (Ratio 4)
Bench Scale Test (Ratio 6) Bench Scale Test (Ratio 3) Bench Scale Test (Ratio.5) Bench Scale Test (Ratio 1) West Equipment Door Ramp Room 84 Room B4
Room B4
TCLP Pb uglL
338 ' 315
' 102 302
94.2 < 46.6
171 b
b
. b
b
- _ . - -
- _ _ _
TCLP Cd uglL
< 3.0
3.0 < 3.0 < 3:o < 3.0 < 3.0 < 3.0
-
b
b
b
b
_ - - - - - - -
C d C ' DOE Soil Guideline - _ - - - - -9- -9-
RCRA TCLP Limits 5000 1000 -c- - _ C
a Less than values ( 5 ) are results less than the minimum detectable activity, and the number reported is less than the minimum detectable activity. Sample was not analyzed for this analyte.
This set of guidelines does not apply to this analyte.
There was no site-specific uranium guideline developed for CHV. A typical U-238 guideline .
. '
for FUSRAP sitesranges from 35 to 50 pCVg. ' . . e DOE soil cleanup guideline for radium and thorium is 5 pCVg in the top 6 inches of soil and
15 DCVa areater than 6 inches below the surface of the soil
1
1
I I I I

I
Table 10 Hazard Assessment Summary
Dose Calculated Number Units Scenario
Building Demolition - mrem
Wall Demolition 0.02 . mrem 0.76 mrem Structural Steel Demolition
Roof Demolition 4.9
- . ~
Removal of Floor Blocks Total
Structural Steel Recycling Torch Cutting of Trusses Sand Blasting of Trusses Slag From Melting Trusses Total
1 I I I I I I I 1 I I I I I I 1 I I
0.0007 mrem 5.6 mrem
5.3 mrem 10.7 mrem 0.29 mrem 16.3 . mrem
Reuse of Building Materials' 17.3 mremlyr
4.4 pCi/g 20 Ibs
Activity of Building Rubble Mass of Uranium in Rubble
. .
. .
53

TABLE 11
ACTION
REMEDIAL ACTION SUMMARY
DATE 1 RESP0,NSIBLE 'ENTITY
WBS u.3 REMEDIATION AUTHORITY SITE Chapman Valve IXI NEPNCERCLA
OWNER - 0 RCRA SITE ADDRESS 203 H m i r e Street CITY, STATE
0 SUPERFUND
Jndian orchard. MA 055 15
May 4,1995
September 1996
ORNL Results of Radiological Survey at the Former Chapman Valve Manufacturing Company, Indian Orchard, Massachusetts
BNI FUSRAP Technical memorandum - Chapman Valve Characterization Results
Chapman Valve Post-Remedial Action Report
DOE/ORNL/BNI FUSRAP Technical n~morandum -
DESIGNATION
CHARACTERIZATION
CHARACTERIZATION
FINAL RA
DOCUMENT
December 15, 1992 DOE I Authorization for RA
July 1992
TOTAL VOLUME m To Remain In Situ - 2 m Y Documentation Used: Hazard Assessment in Volume Reduction 0 FUSR4P Technical
I I I I 1 I I I I 1 I
Net Disposal a Mernomdum - Chapman
I Valve Post-Remedial Action Report
TYPE OF WASTE FOR NET DISPOSAL:
REGULATORY VOLUME DISPOSAL SITE IXI LLRW 19 cv Clive. Utah
0 MIXED Clive. Utah 0 CHEMICAL
0 ll(E)2 1 I
PHYSICAL BUILDING RUBBLE 6 CY Clive. Utah SOIL 3 cv Clive. Utah
0 LIQUID OTHER Dust Mixed with Concrete 10 cy Clive. Utah
TREATMENT TECHNOLOGIES APPLIED AT THE SITE: Chemical Stabilization
54
I I