post-war american influence on public health, medicine …hsph.jp/jt2009/documents/post-war american...
TRANSCRIPT
Post-War American Influence on Public Health, Medicine
and Health Trends in Okinawa

16:00
Room 112

Post-War American Influence on
Public Health, Medicine and Health Trends
in Okinawa

Part 1 Title: Post-War American Influence on Population Health in Okinawa: The Early Years 1945-1972 1. Influence of US Occupation of the Ryukyu Islands for 27 Years From 1945 to 1972 on Health Problem in Okinawa. Seizo Sakihara, Ph.D. Professor Emeritus University of the Ryukyus Professor of Okinawa International University, Okinawa, Japan 2. The effects to people’s health of the establishment of public health centers in Okinawa after the World War the Second Seisho Higa, M.D., M.P.H. Director of Okinawa North Public Health & Welfare Office, Okinawa, Japan 3.Contribution of U.S. Administration on the training of physicians and nurses in Okinawa Masao Maeshiro, M.D., FACS University of Hawaii, Okinawa Chubu Hospital, Okinawa, Japan 4. The U.S. occupation and its influence to Okinawan longevity --Transition of Okinawan longevity under the U.S. governing-- Makoto Suzuki, M.D., Ph.D. Professor Emeritus University of the Ryukyus Okinawa Research Center of Longevity Science, Okinawa, Japan

Part 2 Title: Health in Danger? Recent Health Transitions in Okinawa 1972-Present 5. Caloric Restriction, Energy Balance and Healthy Aging: Evidence for an Impact on Preand Post-War Generations of Okinawans in Okinawa and Hawaii Bradley Willcox, M.D. Pacific Health Research Institute, Department of Geriatric Medicine and Medicine, John A. Burns School of Medicine,University of Hawaii, Honolulu, Hawaii 6. Longevity in Peril: An Exploration of Mortality Changes in Okinawa 1985-2000 Craig Willcox, Ph.D. Okinawa Prefectural College of Nursing, Okinawa, Japan 7. The Nutrition Transition in Postwar Okinawa: The Relationship between Dietary Changes and Body Weight Hidemi Todoriki, Ph.D. Department of Environmental and Preventive Medicine, Faculty of Medicine, University of the Ryukyus, Okinawa, Japan 8. Recent Trends in Health Status of Okinawa: Comparison with whole nation Tomohiro Hirao, M.D. Ph.D. Health Policy and Management, Kagawa University, Japan

Influence of US Occupation of the Ryukyu Islands for 27 Years from 1945 to 1972 on Health Problems in Okinawa
Seizo Sakihara, PhD
Okinawa International University
Background: After World War II, the United States had occupied Japan and “the Ryukyu Islands” for seven years and 27 years respectively. This different period of occupation had brought about different effects on social and everyday life of Japanese and Okinawans. In addition, the US Military Government in the Ryukyu Islands had kept all powers in political, economic, and social activities of civilians. GHQ in Tokyo, however, had indirectly controlled over Japan. Although US Occupation in Japan was terminated according to the Peace Treaty with the Allied Powers and the US-Japan Security Treaty in 1952, the Ryukyu Islands had been under the US administration without a break. The US policy toward the Ryukyu Islands after conclusion of the peace treaty with the Allied Powers in 1951 was as follows: 1) Maintenance of permanent military installation, 2) Support Okinawans to meet humanitarian minimum needs, and 3) Improvement of the standard of living of Okinawans to that in prewar level. Health and Medical Services: At first stage of Military Government, all health and medical manpower was under the US Military Government management, and also medical care services were provided by the US Military Government with assistance of local medical personnel. They had carried out intensive mosquito-borne disease control program with DDT spraying to all shelters in Okinawa island both military barracks and native houses. They also paid much attention to control sexually transmitted disease (STD) and therefore public health centers were founded where the STD cases were detected and treated. In general, the first priority was given to protection of US military personnel. In December 1950, the US Military Government Organization in the Ryukyu Islands had shifted to the United States Civil Administration of the Ryukyu Islands (USCAR) headed by a Military Officer as the High Commissioner. This political change had emerged according to the SCAP Directives of the GHQ to accomplish the Military purposes. Accordingly, various provisional civilian administrative organizations and services had changed to permanent systems for civilian populations to maintain stable US Military functions in the Islands. Influences of the US Administration in the Ryukyu Islands on health problems: A long period of US Occupation in the Ryukyu Islands caused positive effects and also adverse effects on health and lifestyle of Okinawans today as described.

I. Positive Effects: 1. Provided survived civilians with food by ration during and immediately after
the hostilities in the southern area of Okinawa Island. 2. Improvement of environmental sanitation with Island-wide piped water supply
and intensive mosquito-borne disease control program. 3. Development of community-based public health nursing program. 4. Improvement of tuberculosis control program. 5. Development of health manpower by scholarships to study in the United States
and Mainland Japan. 6. Improvement of training programs for medical doctors including postgraduate
training at the Chubu Hospital
II. Adverse Effects: 1. Hastening westernized food habits such as high consumption of fast-food and
fat-rich animal meet. 2. Motorized society contributed to the highest rate of obesity in the country. 3. Lack of active leadership of Shi-Cho-Son’s mayors in community health
planning due to that responsibility had been carried out by the Central Government through Public Health Centers under the US Administration.
4. No universal health insurance program existed until 1972. 5. Continued aircraft noise pollution around US military bases. 6. The migration program planned by the USCAR triggered off the outbreak of the
second epidemic of malaria in postwar Yaeyama Islands from 1952 to 1958.

1
Influence of US Occupation of the Ryukyu Islands for 27 Years from 1945 to 1972
on Health Problems in Okinawa
Seizo Sakihara, Ph.DOkinawa International University
Collection Centers for Civilians Survived
• Ryukyuan Civilians were under US Military Government control and were held in collection centers in 1945 and 1946.
• They were provided with camp and ration, but without water supply, electricity and sanitary toilet.
Military Government Proclamation No.9 “Public Health and Sanitation” (1945)
Physicians, dentists, pharmacists, nurses, midwives and others engaged in treatment of the sick, treatment in prevention of disease, or the dispensing of drugs who have been licensed to perform such service in the occupied territory will continue in their respective professions until further orders are issued by my Military Government.
Naha City was destroyed by fierce US bombing on October 1944
On 1 April 1945, US troops ashore west coast of Okinawa Island

2
US Military Government in the Ryukyu Islands(1945 ~ 1972)
April 1945- June 1946US Naval Military Government
July 1946- December 1950US Army Military Government
December 1950-May 1972United States Civil Administration of theRyukyu Islands (USCAR)
3
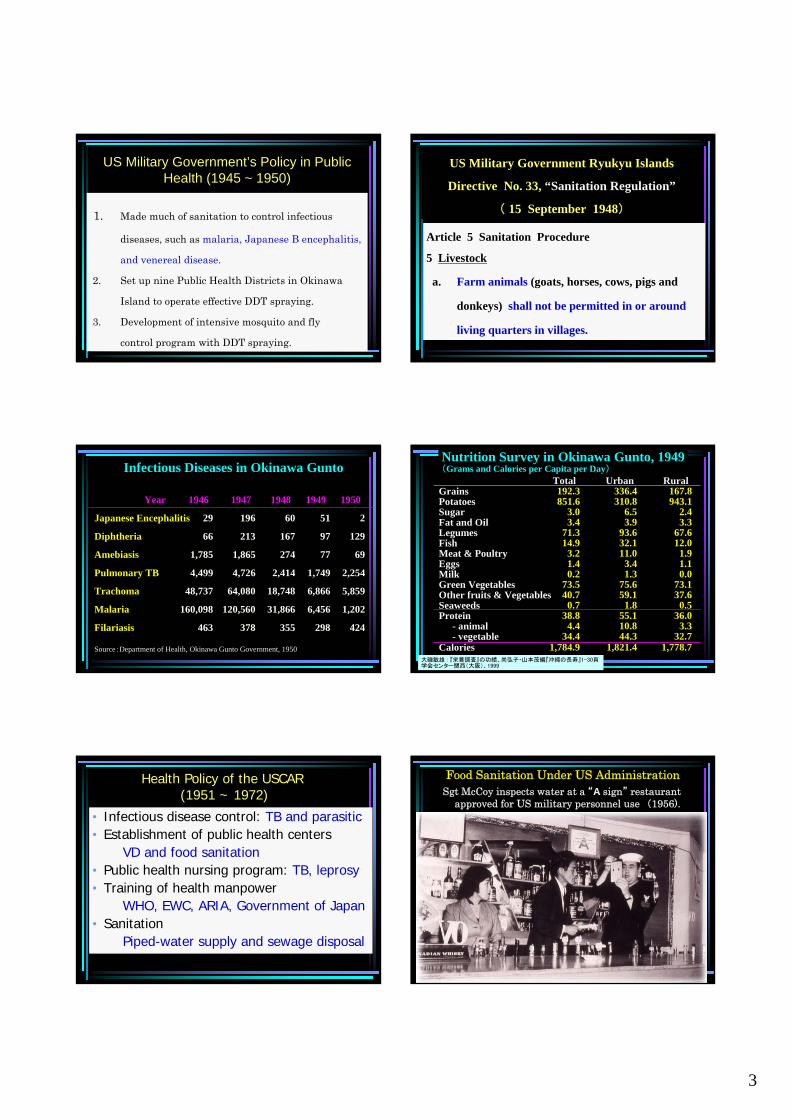
US Military Government’s Policy in Public Health (1945 ~ 1950)
1. Made much of sanitation to control infectious
diseases, such as malaria, Japanese B encephalitis,
and venereal disease.
2. Set up nine Public Health Districts in Okinawa
Island to operate effective DDT spraying.
3. Development of intensive mosquito and fly
control program with DDT spraying.
US Military Government Ryukyu Islands
Directive No. 33, “Sanitation Regulation”
( 15 September 1948)
Article 5 Sanitation Procedure
5 Livestock
a. Farm animals (goats, horses, cows, pigs and
donkeys) shall not be permitted in or around
living quarters in villages.
Infectious Diseases in Okinawa Gunto
Year
Japanese Encephalitis
Diphtheria
Amebiasis
Pulmonary TB
Trachoma
Malaria
Filariasis
1946
29
66
1,785
4,499
48,737
160,098
463
1947
196
213
1,865
4,726
64,080
120,560
378
1948
60
167
274
2,414
18,748
31,866
355
1949
51
97
77
1,749
6,866
6,456
298
1950
2
129
69
2,254
5,859
1,202
424
Source:Department of Health, Okinawa Gunto Government, 1950
Nutrition Survey in Okinawa Gunto, 1949(Grams and Calories per Capita per Day)
GrainsPotatoesSugarFat and OilLegumesFishMeat & PoultryEggsMilkGreen VegetablesOther fruits & VegetablesSeaweedsProtein
- animal- vegetable
Calories
Total192.3851.6
3.03.4
71.314.9
3.21.40.2
73.540.7
0.738.8
4.434.4
1,784.9
Urban336.4310.8
6.53.9
93.632.111.0
3.41.3
75.659.1
1.855.110.844.3
1,821.4
Rural167.8943.1
2.43.3
67.612.0
1.91.10.0
73.137.6
0.536.0
3.332.7
1,778.7大磯敏雄 : 『栄養調査』の功績、尚弘子・山本茂編『沖縄の長寿』1-30頁学会センター関西(大阪)、1999
Health Policy of the USCAR(1951 ~ 1972)
• Infectious disease control: TB and parasitic• Establishment of public health centers
VD and food sanitation• Public health nursing program: TB, leprosy• Training of health manpower
WHO, EWC, ARIA, Government of Japan• Sanitation
Piped-water supply and sewage disposal
Food Sanitation Under US AdministrationSgt McCoy inspects water at a “A sign” restaurant
approved for US military personnel use (1956).
4
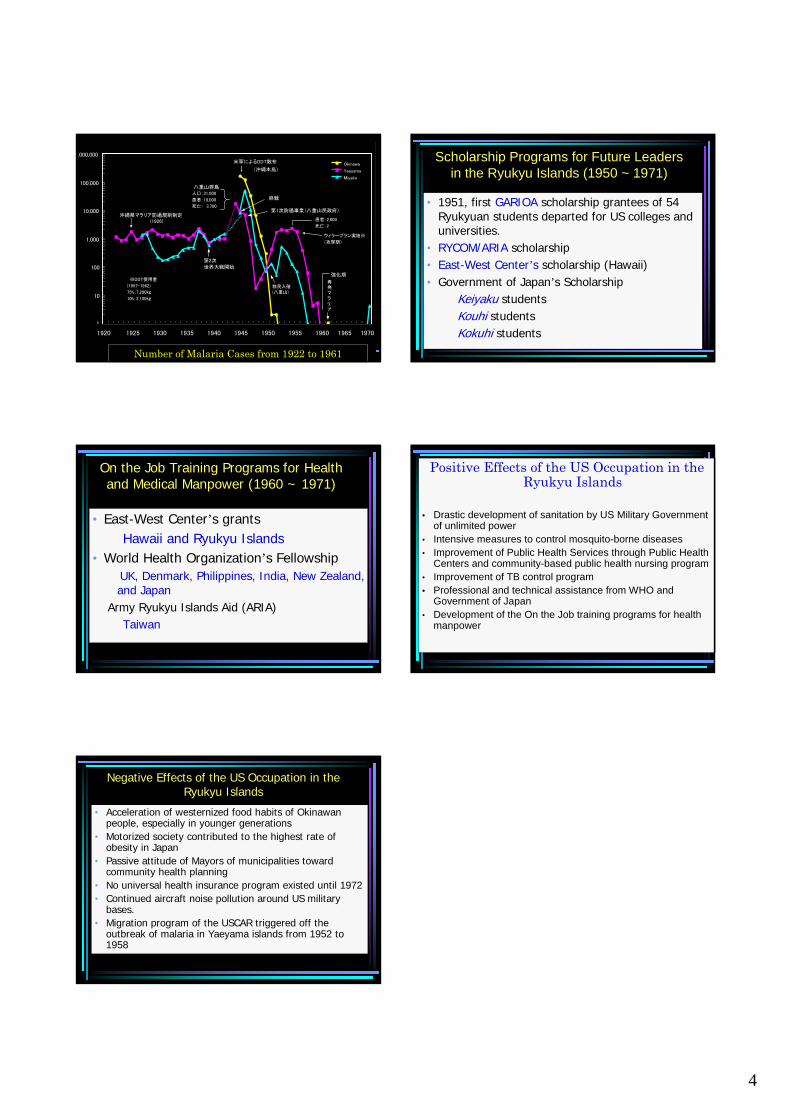
1
10
100
1,000
10,000
100,000
1,000,000
Okinawa
Yaeyama
Miyako
人口:31,000
患者:18,000
死亡: 3,700
沖縄県マラリア防遏規則制定(1926)
第2次
世界大戦開始
※DDT使用量
(1957-1962)
75%:7,200㎏
10%:2,100㎏
移民入殖(八重山)
再発マラリア
強化期
終戦
第1次防遏事業(八重山民政府)
患者:2,000
死亡:2
ウィラープラン実施※
(攻撃期)
八重山群島
米軍によるDDT散布
↓ (沖縄本島)
0
1920 1925 1930 1935 1940 1945 1950 1955 1960 1965 1970
Number of Malaria Cases from 1922 to 1961
Scholarship Programs for Future Leaders in the Ryukyu Islands (1950 ~ 1971)
• 1951, first GARIOA scholarship grantees of 54 Ryukyuan students departed for US colleges and universities.
• RYCOM/ARIA scholarship• East-West Center’s scholarship (Hawaii)• Government of Japan’s Scholarship
Keiyaku studentsKouhi studentsKokuhi students
On the Job Training Programs for Health and Medical Manpower (1960 ~ 1971)
• East-West Center’s grantsHawaii and Ryukyu Islands
• World Health Organization’s FellowshipUK, Denmark, Philippines, India, New Zealand, and Japan
Army Ryukyu Islands Aid (ARIA)Taiwan
Positive Effects of the US Occupation in the Ryukyu Islands
• Drastic development of sanitation by US Military Government of unlimited power
• Intensive measures to control mosquito-borne diseases• Improvement of Public Health Services through Public Health
Centers and community-based public health nursing program• Improvement of TB control program• Professional and technical assistance from WHO and
Government of Japan • Development of the On the Job training programs for health
manpower
Negative Effects of the US Occupation in the Ryukyu Islands
• Acceleration of westernized food habits of Okinawanpeople, especially in younger generations
• Motorized society contributed to the highest rate of obesity in Japan
• Passive attitude of Mayors of municipalities toward community health planning
• No universal health insurance program existed until 1972• Continued aircraft noise pollution around US military
bases.• Migration program of the USCAR triggered off the
outbreak of malaria in Yaeyama islands from 1952 to 1958
The effects to people’s health of the establishment of public health centers in Okinawa after the World War the Second
Seisho Higa, M.D., M.P.H. Director of Okinawa North Public Health & Welfare Office
1 The establishment of health centers in Okinawa 1951
1-1 The stationing Public Health Nurses activities in municipal areas supported by their health center stuffs such as physicians, dentist, dietician, laboratory technicians, radiologists, etc. devoted the improvement of health of community people. 1-1-1 The immunizations
1-1-1-1 Small pox vaccine in 1952 1-1-1-2 Single vaccine for diphtheria and pertusis in 1953 1-1-1-3 DPT triple combined vaccine in 1957 1-1-1-4 Japanese encephalitis vaccine and Salk’s vaccine for
poliomyelitis in 1961 and polio live vaccine in 1963 1-1-2 The health guidance, consultation, clinic and others for infant care 1-1-2-1 Health guidance by home visits 1-1-2-2 Health clinic for infant 1-1-2-3 Health consultation and guidance for infants by PHN 1-1-2-4 Health activities after promulgation of The Child Welfare Law in 1953 1-1-3 The treatment of venereal diseases Notification from designated hospitals in Okinawa indicated 5,536 venereal diseases in 1953,4,368 of which were gonorrhea,912 syphilis. After setting up of public health center, serum test for syphilis, gonorrhea
staining test and treatment with follow up on infectious sources was conducted in the center.
Further, the U.S. military government created the ”A-sign system”. To receive a license for food handling business, the businessman had to receive certification of free of venereal disease after checking of STS and smear test for gonorrhea of his workers from the public health center. The Venereal Prevention Law legislated by the Ryukyu Government in 1962, made possible free examinations and treatment at public health centers for the general public. As a result, those women working in entertainment areas without A-sign accreditation also started to receive examinations and

treatment at public health centers. 1-1-4 The treatment and administration of tuberculosis cases In 1951,a study conducted in order to measure the tuberculosis prevalence rate in Okinawa by follow up 10,000 residents revealed the estimated number 0f patients requiring treatment were 1% of the population that indicated 7,000 cases. At the time, sanatoriums in Okinawa had 240 beds. One program to overcome this was to designate public health centers as treatment institutions and to use public health nurses to conduct treatment the cases at home. Tuberculosis sanatoriums also increased their bed turnover rate by examining inmates and limiting stay for around 6 months. Public health nurses stationed in municipal areas visited tuberculosis cases who were discharged from sanatoriums, newly diagnosed and receiving treatment at home. Some patients with sputum smear positive were referred to sanatorium around mainlandJapan.During1962 to 1983 , approximately 2,800 cases were sent outside the prefecture. By all the efforts, including hard work of public health nurses in Okinawa, help of medical specialists from sanatoriums in Japan, assistance from the research center of tuberculosis of Japan anti-tuberculosis association, etc, the tuberculosis incidence rate and prevalence rate of Okinawa today became almost average level of Japan.
1-2 Environmental health and food sanitation activities by health inspectors 1-2-1 Public health centers took on pest eradication activities under the
environmental section cooperated with municipal offices. 1-2-1-1 Malaria eradication activities
Indoor residual DDT spray was continued twice a year for seven years. 1-2-1-2 Control of filariasis
In Miyako islands , using malathion, indoor residual spray was conducted. 1-2-1-3 Dealing with Japanese encephalitis on Okinawa Island
Traditional larvae eradication methods were strengthened with the eradication of adult mosquitoes also launched using dusting machines in the evening.
1-2-2 Environmental health activities through public health organization 1-2-2-1 Distribution of safe water in the community Chlorination of drinking water by village chief 1-2-2-2 Proper treatment of waste 1-2-2-3 Proper treatment of night soil

1-2-3 Food sanitation activities 1-2-3-1 Based on the Food Sanitation Law, public health centers began
handling the issuance of permit for foodservice establishments.

1
The effects of the establishment of Public Health Centers on
people’s health in Okinawa after the World War the Second
Seisho Higa, M.D., M.p.h.Director of Okinawa North Public
Health & Welfare Office
The Effect of the Establishment of Public Health Centerson People’s Health in Okinawa
1 Reduction of Number of Deaths from Acute Infectious Diseases During Childhood1-1 The effect of immunization through PHN activities1-2 The effect of health guidance, consultation, maternity and
child clinics and others, for infant and childhood care1-3 Prevention of extra uterine pregnancy and miscarriage
through proper treatment of STD and health education1-4 The pest eradication activities such as malaria and filaria,
safe water supply and proper treatment of wastes andnight soil
2 Prevention of Tuberculosis Death2-1 Domiciliary treatment by PHN2-2 Treatment at sanatoria in mainland of Japan 2-3 TB specialists from mainland of Japan2-4 Assistance from the Japan Research Institute of Tuberculosis
3 Control of the progress of degenerative diseases such as cerebro-vascular accidents, heart diseases, etc.
The Effect of Social Factor and Eradication Measures on Malaria Incidence in Miyako and Yaeyama
Year Miyako Yaeyama Remark Meathods of Erad.
19451946 7985 90501947 46231 6594 Larva Eradication1948 10590 799 Larva Eradication1949 616 17 Immigration Larva Eradication1950 206 35 Immigration Larva Eradication1951 67 74 Immigration Larva Eradication1952 123 405 Immigration Larva Eradication1953 50 1610 Immigration Larva Eradication1954 500 2039 Immigration Larva Eradication1955 313 1865 Immigration Larva Eradication1956 124 2211 Immigration Larva Eradication1957 66 1730 Residual Spray1958 12 370 Residual Spray1959 1 58 Residual Spray1960 0 4 Residual Spray1961 0 5 Residual Spray1962 0 01963 0 01964 0 0
Data Source: Takao Kishimoto
Filaria Parasite identified by Blood Screening in each Health Center Areas1965-1979, Okinawa Prefecture
Fiscal Year Miyako Yaeyama Nago Ishikawa Koza Naha Chuou Total1965 12607 126071966 3105 31051967 1282 3400 46821968 1116 11161969 177 133 1005 13151970 136 160 2961971 107 1071972 1 9 1 53 641973 8 6 3 14 311974 2 2 0 0 3 6 131975 3 0 0 0 0 20 231976 1 6 0 0 1 2 0 101977 1 3 0 1 0 0 0 51978 0 0 1 0 0 0 11979 0 0 0 0 0 0 0
Total 17323 4942 1009 69 4 28 0 23375
Data Source: Takao Kishimoto
The Number of Reported main acute Infectious Diseasesby Years
2 1 1
56
0
20
40
60
80
100
120
140
160
180
1945 1950 1955 1960 1965 1970 1975 Years
Nu
mbe
r o
f R
epo
rte
d C
ase
s
Diphtheria
JapaneseEncph.Poliomyelitis
1957 DPT 1964 DT
1961 Japanese Encph .&Oral Po l io
Publ ic Health Center
1951
OkinawaComparison of Age Specific Pneumonia Death Rate
in Okinawa (1960 and 2000)
0 .0
10 .0
20 .0
30 .0
40 .0
50 .0
60 .0
70 .0
80 .0
90 .0
0-4 5-9 10-
14
15-
19
20-
24
25-
29
30-
34
35-
39
40-
44
45-
49
50-
54
55-
59
60-
64
65-
69
20001960
Age Groups

2
Trend of Tuberculosis Home Visit by PHN
89.8
81.2
58.7
40.8
24.0
11.8
8.5
5.6
83.1
0.0 20.0 40.0 60.0 80.0 100.0
1955
1960
1965
1970
1975
1980
1985
1990
1995
Tuber
Others
Tuberculosis
Okinawa
0.0
10.0
20.0
30.0
40.0
50.0
60.0
70.0
0-
45
-9
10
-1
41
5-
19
20
-2
42
5-
29
30
-3
43
5-
39
40
-4
44
5-
49
50
-5
45
5-
59
60
-6
46
5-
69
70
-7
47
5-
79
80
-8
48
5-
89
90
+
1960年
2000年
Comparison of Age Specific Death Rate of Tuberculosis1960 & 2000, OkinawaDeath Rate per 100,000 Pop.
0.0
500.0
1000.0
1500.0
2000.0
2500.0
3000.0
0-4
10-1
4
20-2
4
30-3
4
40-4
4
50-5
4
60-6
4
70-7
4
80-8
490
+
1970年
2000年
Comparison of Age Specific Death Rate of C.V.A.1970 & 2000 OkinawaDeath Rate per 100,000 Pop.
Comparison of Piped Water Supply RateJapan & Okinawa
0
10
20
30
40
50
60
70
80
90
100
110
1961 1965 1970 1975 1980 1985 1990 1995 2000 2004
Years
%
Japan
Okinawa
Comparison of The Trend of Infant Death Rate Japan & Okinawa
0.0
2 .0
4 .0
6 .0
8 .0
10 .0
12 .0
14 .0
1972 1975 1980 1985 1990 1995 2000 2004
Years
Infa
nt
Death
s p
er
1,0
00 L
ive B
irth
s
Okinawa
Japan
102.594.2
86.597.5 100.3
85.6
70.8 70.1 74.1 73.7 77.5 76.9
0
20
40
60
80
100
120
1972 1982 1988 1993 1998 2003
Okinawa Japan
Transition of Meat Intake(Comparison of Okinawa and Japan)
National Nutritional Survey
102.594.2
86.597.5 100.3
85.6
70.8 70.1 74.1 73.7 77.5 76.9
0
20
40
60
80
100
120
1972 1982 1988 1993 1998 2003
Okinawa Japan
Gram
Data: Hachiro SakiyamaData: Hachiro Sakiyama

3
61.2 63.974.9 79.9 75.1
67.4
92.7 90.296.1 96.2 95.9
86.7
0
20
40
60
80
100
120
1972 1982 1988 1993 1998 2003
Okinawa Japan
Transition of Seafood Intake(comparison of Okinawa and Japan)
National nutritional Survey
61.2 63.974.9 79.9 75.1
67.4
92.7 90.296.1 96.2 95.9
86.7
0
20
40
60
80
100
120
1972 1982 1988 1993 1998 2003
Okinawa Japan
GramGram
Data Source : Hachiro Sakiyama
The Comparison of Trend of Death Rate Cerebral Infarction Japan & Okinawa
0
20
40
60
80
100
120
140
1970 1975 1980 1985 1990 1995 2000Years
Death
Rate
per
100,0
00 P
op.
Japan Male
Japan Female
Okinawa Male
Okinawa Female
The Trend Comparison of Death Rate ofIntracerebral Haemorrhage Japan & Okinawa
0
10
20
30
40
50
60
70
1970 1975 1980 1985 1990 1995 2000 Years
Death
Rate
per
100,0
00 P
op.
Japan Male
Japan Female
Okinawa Male
OkinawaFemale
Comparison of The Trend of Death Rate Acute Myocardial Infarction Japan & Okinawa
0.0
5.0
10.0
15.0
20.0
25.0
30.0
35.0
40.0
45.0
1970 1975 1980 1985 1990 1995 2000 Years
Death
Rate
per
100,0
00 P
op.
Japan Male
Japan Female
Okinawa Male
Okinawa Female
Age Adjuste d Death
The Trend of Death Rate of Diabetes Mellitus Japan & Okinawa
0.0
2 .0
4 .0
6 .0
8 .0
10 .0
12 .0
14 .0
1960 1965 1970 1975 1980 1985 1990 1995 2000Years
De
ath
Rate
pe
r 1
00
,000
Po
p.
Japan Male
Japan Female
Okinawa Male
Okinawa Female
Age Adju sted Death
Rate
Comparison of Age Specific Death RateDiabetes Mellitus By Sex, Japan & Okinawa
0.1
1 .0
10 .0
100 .0
1000 .0
40-
44
45-
49
50-
54
55-
59
60-
64
65-
69
70-
74
75-
79
80-
84
85+ Age Groups
De
ath
Rate
pe
r 1
00
,00
0 P
op.
Japan Male
Japan Female
Okinawa Male
Okinawa Female
Year of 2000
4
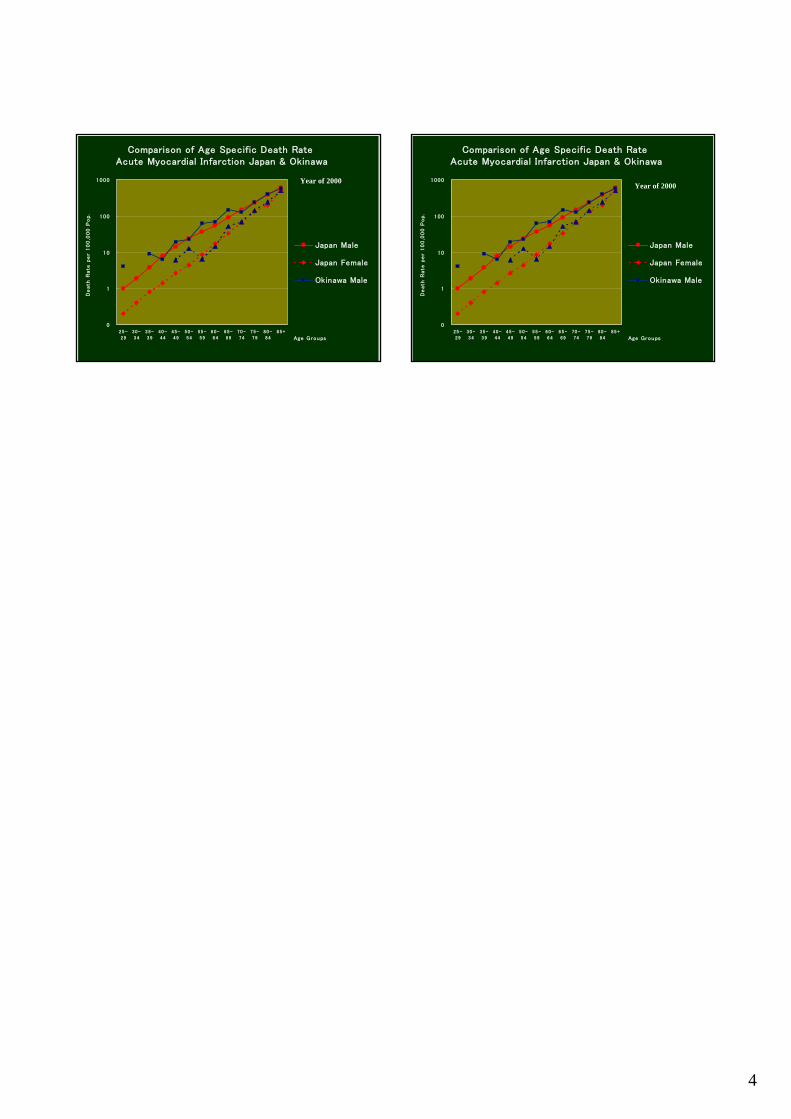
Comparison of Age Specific Death Rate Acute Myocardial Infarction Japan & Okinawa
0
1
10
100
1000
25-
29
30-
34
35-
39
40-
44
45-
49
50-
54
55-
59
60-
64
65-
69
70-
74
75-
79
80-
84
85+
Age Groups
De
ath
Rate
pe
r 1
00
,000
Po
p.
Japan Male
Japan Female
Okinawa Male
Year of 2000
Comparison of Age Specific Death Rate Acute Myocardial Infarction Japan & Okinawa
0
1
10
100
1000
25-
29
30-
34
35-
39
40-
44
45-
49
50-
54
55-
59
60-
64
65-
69
70-
74
75-
79
80-
84
85+
Age Groups
De
ath
Rate
pe
r 1
00
,000
Po
p.
Japan Male
Japan Female
Okinawa Male
Year of 2000

Contribution of U.S. Administration on the training of physicians and nurses in Okinawa
Masao Maeshiro., M.D., FACS
University of Hawaii, Okinawa Chubu Hospital I Physician 1945 to 1967 End of the War till the opening of formal training hospital 1947 Dispatch of scholarship students to Medical Schools in Japan Succeeded by GOJ scholarship students in 1953 and lasted till 1972 Total number of graduates 1092 1952 Dispatch of GARIOA students to U.S.A. till 1972 Total number 10 physicians, mostly observer for 1 year 1953 Started training at US Army Hospital till 1960? Total number 1963 WHO fellowship training at Denmark and Great Britain, South East Asia,
South Pacific Total number 15 physicians 1965 Training at National Hospital in Tokyo 1967 Founding Medical Library till 1972 Individual contract with specialist as a teacher 1959 Leprosy 3 months at Airakuen 1963 General surgeon 6 months at Naha Hospital 1967 to 1971 Founding of formal training hospital to secure the physicians to practice locally Contract with University Hawaii to provide teaching staffs, 12 to 15 each year Total number trained till 1971, 75 physicians 1967 Dispatch of physicians to Hawaii as observer, 3 physicians, 4 months 1969 Dispatch of physicians for further residency or fellowship training to the U.S.
started in.U.S. Administration days and continuing until now total number 97 physicians
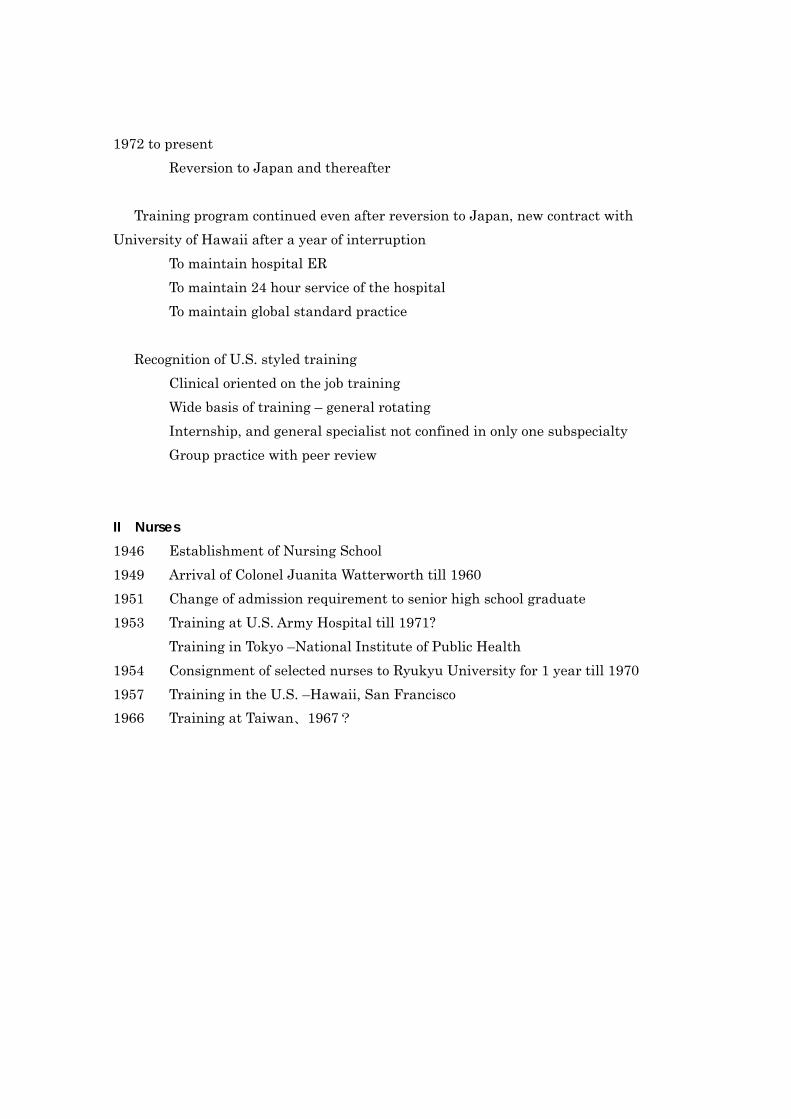
1972 to present Reversion to Japan and thereafter Training program continued even after reversion to Japan, new contract with University of Hawaii after a year of interruption To maintain hospital ER To maintain 24 hour service of the hospital To maintain global standard practice Recognition of U.S. styled training Clinical oriented on the job training Wide basis of training – general rotating Internship, and general specialist not confined in only one subspecialty Group practice with peer review II Nurses 1946 Establishment of Nursing School 1949 Arrival of Colonel Juanita Watterworth till 1960 1951 Change of admission requirement to senior high school graduate 1953 Training at U.S. Army Hospital till 1971? Training in Tokyo –National Institute of Public Health 1954 Consignment of selected nurses to Ryukyu University for 1 year till 1970 1957 Training in the U.S. –Hawaii, San Francisco 1966 Training at Taiwan、1967?
1
Contribution and Influence of U.S. administration on the Training of Physicians and
Nurses in Okinawa
Masao Maeshiro, M.D., F.A.C.S.University of Hawaii
Okinawa Chubu Hospital
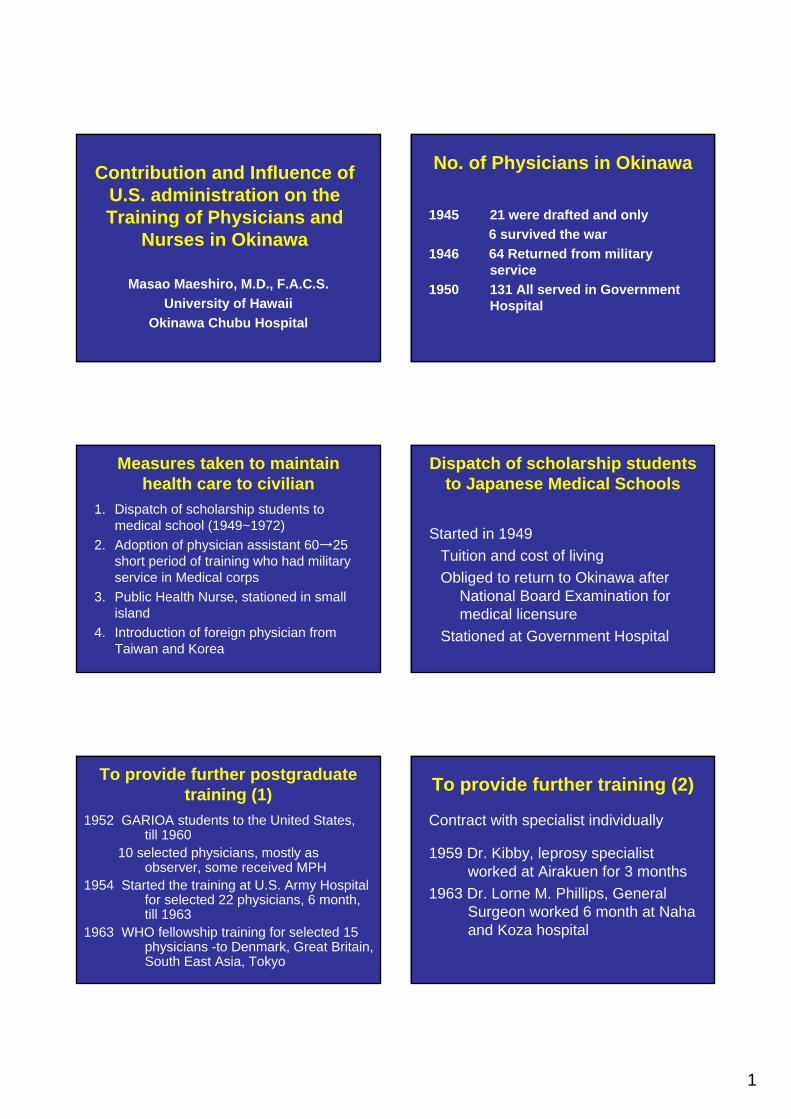
No. of Physicians in Okinawa
1945 21 were drafted and only 6 survived the war
1946 64 Returned from military service
1950 131 All served in Government Hospital
Measures taken to maintain health care to civilian
1. Dispatch of scholarship students to medical school (1949~1972)
2. Adoption of physician assistant 60→25 short period of training who had military service in Medical corps
3. Public Health Nurse, stationed in small island
4. Introduction of foreign physician from Taiwan and Korea
Dispatch of scholarship students to Japanese Medical Schools
Started in 1949Tuition and cost of livingObliged to return to Okinawa after
National Board Examination for medical licensure
Stationed at Government Hospital
To provide further postgraduate training (1)
1952 GARIOA students to the United States, till 1960
10 selected physicians, mostly as observer, some received MPH
1954 Started the training at U.S. Army Hospital for selected 22 physicians, 6 month, till 1963
1963 WHO fellowship training for selected 15physicians -to Denmark, Great Britain, South East Asia, Tokyo
To provide further training (2)
Contract with specialist individually
1959 Dr. Kibby, leprosy specialist worked at Airakuen for 3 months
1963 Dr. Lorne M. Phillips, General Surgeon worked 6 month at Naha and Koza hospital

2
18611175Pharmacy
1456580Dentist
958216742Physician
TotalSelf financed
studentsScholarship
students
3642
17
25
7 6 8
21
8
19
7
14
11
14
10
12
8
11
24
6
25
5
35
15
34
16
57
13
50
20
50
21
50
15
51
14
60 59 60
0
10
20
30
40
50
60
70
80
1949 1951 1953 1955 1957 1959 1961 1963 1965 1967 1969 1971
year
Scholarship students & Self financed students
physicians (self financed students)
physicians (scholarship students)
Drop in the return rate of scholarship student
1950 97%1958 90%1965 44%1964 Recommendation by Dr. Shoei Yamauchi,
criticized severely the management of health care of civilian
1. Establishment of Training Hospital2. Foundation of Medical Library3. Consideration to build Medical School 1965 North Wing under construction
1965 North Wing under construction 1966 Koza Nursing School

3
Foundation of Postgraduate Training Hospital
1967Contract with University of Hawaii and
Pentagon and State Department to provide teaching staffs in Medicine, Surgery, Pediatrics, OB-GYN, Physical Therapy and Pathology, Laboratory Technician, 15 in total
1967 3 physicians sent out to Hawaii for training 4 monthsMedical Library opened ~1972
1968 ECFMG Test Center was approved until 1994
1969 Started sending to the U.S. for further formal residency or fellowship training, lasting even now, 97 physicians studied in U.S.
Table of No. of Consultants
2
3 3
1 11
3
1
8
2
5
4
9
4
6
3
8
5
8
5
16
4
13
4
14
4
12
6
15
3
17
4
11
7
13
6
10
5
17
4
16
6
11
5
11
5
12
4
12
1
10
2
14
3
9
3
13
1
11
2
6
1
12
2
12
2
14
2
11
2
12
2
12
2
0
2
4
6
8
10
12
14
16
18
67 69 71 73 75 77 79 81 83 85 87 89 91 93 95 97 99 2001 2003 2005
year
Consultants 384
Faculties 124
Reversion to Japan in 1972 and thereafter
Training program continued, new contract with University of HawaiiTo maintain active ER of the hospital To maintain 24 hour service of the hospitalTo maintain global standard practice
The hospital without training program can not be regarded as FIRST CLASS
- Wm. Osler -
Recognition of U.S. styled training
Clinically oriented on the job training Wide basis of skill and knowledge
not confined in narrow specialtygeneral medicine, general surgery, etc.
Group practice with peer review

4
Table of No. of Trainees
8
19
2528
2528
3135
3941 41
48 4850
54555859
6460 61
65686970
63 62616060 6058
636259
64 65
78
9289
0
10
20
30
40
50
60
70
80
90
100
67 69 71 73 75 77 79 81 83 85 87 89 91 93 95 97 99 2001 2003 2005
3rd
2nd
1st resident
intern
Result of Training Program
No. trained at Chubu Hospital 692No. stayed in Okinawa 514 (74.3%)Students visited as observer 70~200/yearStudents for Clinical Clerkship
6 Medical SchoolsVisitors from mainland Japan 39 hospital
Training for the nurses
1945 On the job training to care the injured
1946 Establishment of Nursing School, 3 years
1949 Arrival of Colonel Juanita Watterworth, RN
1951 Change of admission requirement to senior high school graduate
1953 Training at U.S.Army Hospital started 4 months, 4 nurses Dispatch of nurses to Tokyo
1954 Consignment of selected nurses to Ryukyu University for 1 year until 1971
1957 Training in the U.S. -Hawaii, San Francisco
1964 Training in Taiwan
U.S. influence on the Nursing care in Okinawa before reversion to Japan
Improvement in basic nursing skill
Global standard charting, much superior than Japanese standard of the era
Higher status of hospital nurses
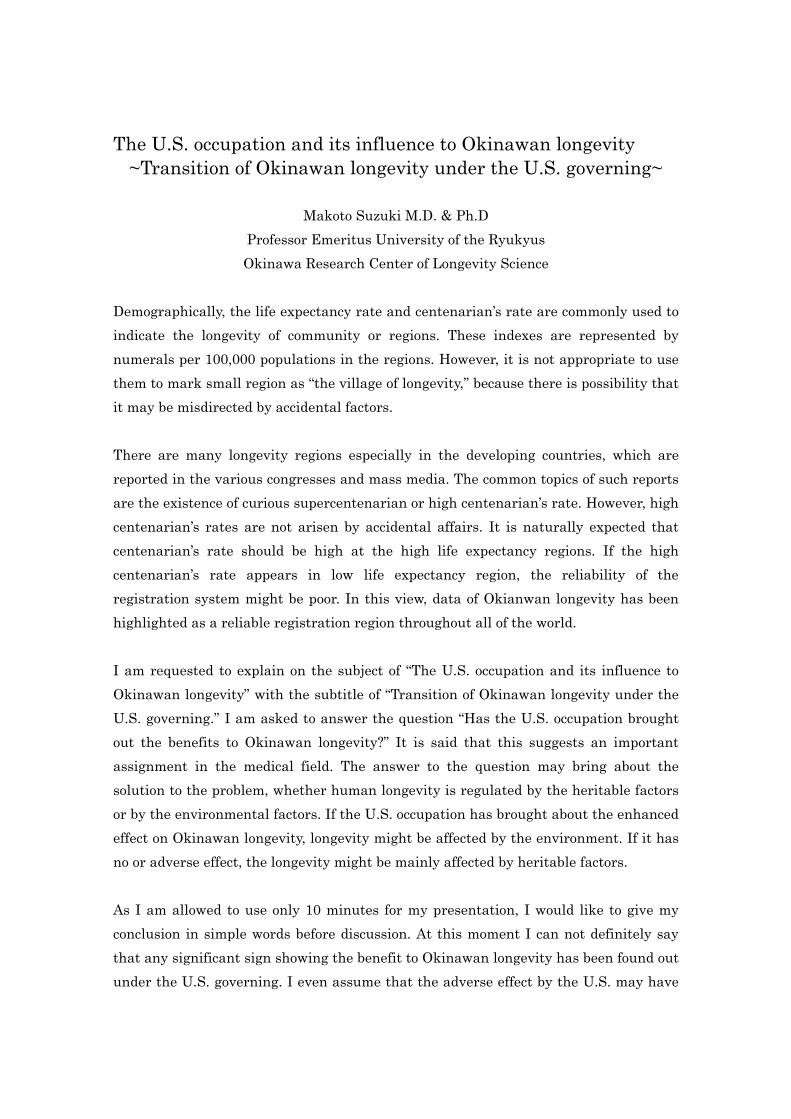
The U.S. occupation and its influence to Okinawan longevity ~Transition of Okinawan longevity under the U.S. governing~
Makoto Suzuki M.D. & Ph.D Professor Emeritus University of the Ryukyus Okinawa Research Center of Longevity Science
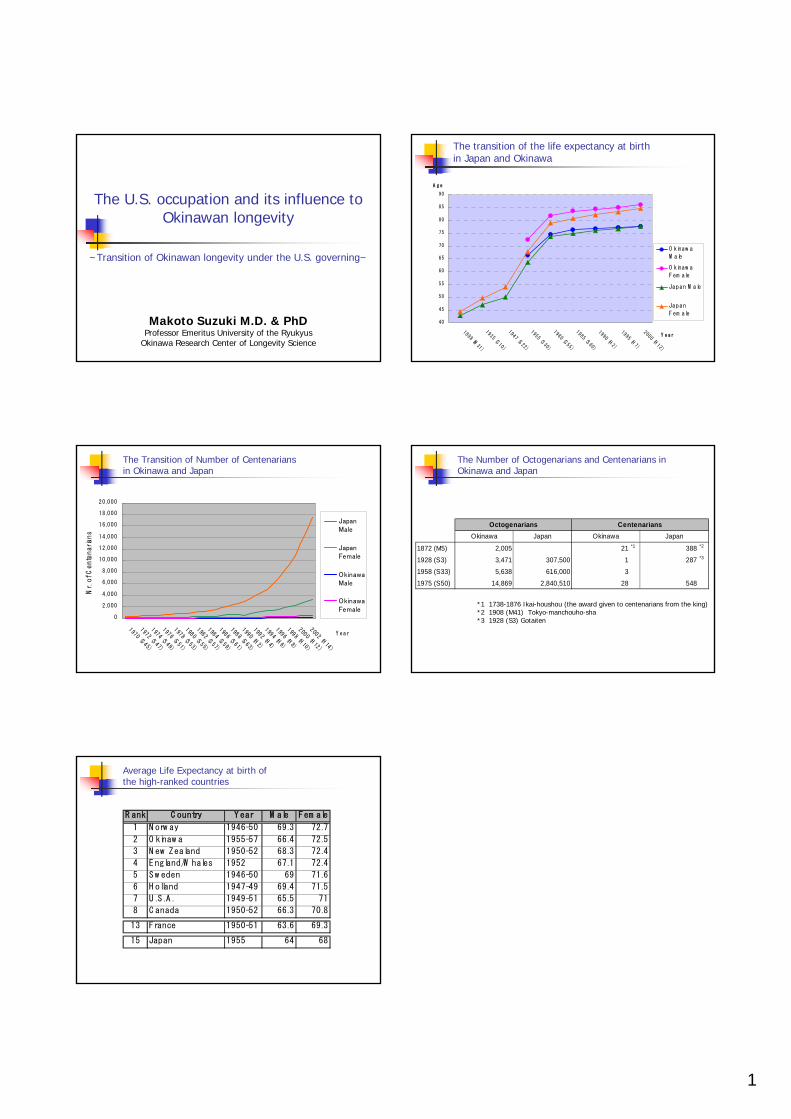
Demographically, the life expectancy rate and centenarian’s rate are commonly used to indicate the longevity of community or regions. These indexes are represented by numerals per 100,000 populations in the regions. However, it is not appropriate to use them to mark small region as “the village of longevity,” because there is possibility that it may be misdirected by accidental factors. There are many longevity regions especially in the developing countries, which are reported in the various congresses and mass media. The common topics of such reports are the existence of curious supercentenarian or high centenarian’s rate. However, high centenarian’s rates are not arisen by accidental affairs. It is naturally expected that centenarian’s rate should be high at the high life expectancy regions. If the high centenarian’s rate appears in low life expectancy region, the reliability of the registration system might be poor. In this view, data of Okianwan longevity has been highlighted as a reliable registration region throughout all of the world. I am requested to explain on the subject of “The U.S. occupation and its influence to Okinawan longevity” with the subtitle of “Transition of Okinawan longevity under the U.S. governing.” I am asked to answer the question “Has the U.S. occupation brought out the benefits to Okinawan longevity?” It is said that this suggests an important assignment in the medical field. The answer to the question may bring about the solution to the problem, whether human longevity is regulated by the heritable factors or by the environmental factors. If the U.S. occupation has brought about the enhanced effect on Okinawan longevity, longevity might be affected by the environment. If it has no or adverse effect, the longevity might be mainly affected by heritable factors. As I am allowed to use only 10 minutes for my presentation, I would like to give my conclusion in simple words before discussion. At this moment I can not definitely say that any significant sign showing the benefit to Okinawan longevity has been found out under the U.S. governing. I even assume that the adverse effect by the U.S. may have

acted as a brake to the longevity. There is no place to oppose the idea that Okinawan livelihood and public health were significantly improved by the support of the U.S. governing. However they have not contributed to the longevity. Figure 1 shows the rapid increase of the number of centenarians in Okinawa and Japan. In 1970 (S45), the centenarians were officially counted for the first time. At that time, Okinawa had totally nine centenarians. Before this census survey, Dr. N. Nagata privately made a research of longevity at Okinawa in 1962, and reported one centenarian named Matsu Teruya (Female / 102 years old). Dr. Nagata expressed that “Such a centenary life was once in a blue moon.” Therefore it is impossible for us to investigate the effect on Okinawan centenarians under the U.S. governing.
Figure 2 shows the increasing transition of the life expectancy at birth between Japan and Okinawa. The original data were cited from the life table recorded by Department of Statistic at Government of the Ryukyu Island and Japanese Health and Welfare Ministry. In 1891, the first life table was made by Japanese government. In 1947 (S22), Japanese life expectancy reached to age 50. Before 1950 (S25), due to the inadequacy of the registration system in Okinawa, there was a wide discrepancy between the numbers reported by
F igure 2 : T he transition of the life expectancy at birth
Japan and O kinaw a
40
45
50
55
60
65
70
75
80
85
90
1898 (M31)
1935 (S 10)
1947 (S 22)
1955 (S 30)
1980 (S 55)
1985 (S 60)
1990 (H2)
1995 (H7)
2000 (H12)
Y ear
A ge
O kinaw a
M ale
O kinaw a
Fem ale
Japan M ale
Japan
Fem ale
F ig u re 1 : T h e T ra n sitio n o f N u m b e r o f C e n te n a ria n s
in O kin a w a a n d Ja p a n
0
2,000
4,000
6,000
8,000
10,000
12,000
14,000
16,000
18,000
20,000
1970 (S 45)
1972 (S 47)
1974 (S 49)
1976 (S 51)
1978 (S 53)
1980 (S 55)
1982 (S 57)
1984 (S 59)
1986 (S 61)
1988 (S 63)
1990 (H2)
1992 (H4)
1994 (H6)
1996 (H8)
1998 (H10)
2000 (H12)
2002 (H14)
Y ear
Nr. of Centenarians
JapanMale
JapanFemale
OkinawaMale
OkinawaFemale

the local governmental administration office and the department of public health at that time. Therefore, these numbers cannot be used to statistic analysis. Consequently I have used the data after 1955 (S30), when the registration system was properly operated. The data of 1955 shows that Okinawan life expectancies of both male and female are higher than that of Japanese. Also the life expectancy of Okinawa was much higher than it of the U.S. in both male and female, and was ranked as high as the countries with advanced welfare system such as Norway, Sweden, and Denmark at that period. In 1977, Okinawa returned to Japan from the U.S. In 1980, both Japanese life expectancy and Okinawan life expectancy grew upward rapidly. However the growing rate both in Japanese and Okinawa were almost same grade. That is the reason why I express that no particular sign of the U.S. influence in Okinawa, was recognized during the U.S. governing period. Thereafter both Japanese and Okinawan life expectancies have still steadily grown up, but the gap between Japan and Okinawa life expectancies have been gradually narrowing down. At 2000, the life expectancy of Japanese male has overtaken it of Okinawan male. The growth of life expectancy of Okinawan female has slowed down, and it is concerned that it may be overtaken by Japanese female as well in the near future. Moreover another trend has been recognized. That is a gap between male and female life expectancies has widened over the years especially in Okinawa. It can be easily considered these two gaps are due to the prevalence of the metabolic syndrome caused by adapting too much Western life style. For this reason, now a days, many of Western countries have been taken strong interest in “Okinawa Way” of the traditional life style to adapt into own life style.
1
The U.S. occupation and its influence to Okinawan longevity
~Transition of Okinawan longevity under the U.S. governing~
Makoto Suzuki M.D. & PhDProfessor Emeritus University of the Ryukyus
Okinawa Research Center of Longevity Science
The transition of the life expectancy at birth in Japan and Okinawa
40
45
50
55
60
65
70
75
80
85
90
1898 (M31)
1935 (S 10)
1947 (S 22)
1955 (S 30)
1980 (S 55)
1985 (S 60)
1990 (H2)
1995 (H7)
2000 (H12)
Y e a r
A g e
O kinaw a
M ale
O kinaw a
F em ale
Japan M ale
Japan
F em ale
0
2,000
4,000
6,000
8,000
10,000
12,000
14,000
16,000
18,000
20,000
1970 (S 45)
1972 (S 47)
1974 (S 49)
1976 (S 51)
1978 (S 53)
1980 (S 55)
1982 (S 57)
1984 (S 59)
1986 (S 61)
1988 (S 63)
1990 (H2)
1992 (H4)
1994 (H6)
1996 (H8)
1998 (H10)
2000 (H12)
2002 (H14)
Y ear
Nr. of Centenarians
JapanMale
JapanFemale
OkinawaMale
OkinawaFemale
The Transition of Number of Centenarians in Okinawa and Japan
The Number of Octogenarians and Centenarians in Okinawa and Japan
1872 (M5) 2,005 21 *1 388 *2
1928 (S3) 3,471 307,500 1 287 *3
1958 (S33) 5,638 616,000 3
1975 (S50) 14,869 2,840,510 28 548
CentenariansJapan
OctogenariansOkinawa Japan Okinawa
*1 1738-1876 Ikai-houshou (the award given to centenarians from the king)*2 1908 (M41) Tokyo-manchouho-sha*3 1928 (S3) Gotaiten
Average Life Expectancy at birth of the high-ranked countries
R ank C ountry Y ear M ale Fem ale
1 N orw ay 1946-50 69.3 72.7
2 O kinaw a 1955-57 66.4 72.5
3 N ew Zealand 1950-52 68.3 72.4
4 E ngland/W hales 1952 67.1 72.4
5 S w eden 1946-50 69 71.6
6 H olland 1947-49 69.4 71.5
7 U .S .A . 1949-51 65.5 71
8 C anada 1950-52 66.3 70.8
13 France 1950-51 63.6 69.3
15 Japan 1955 64 68

Caloric Restriction, Energy Balance and Healthy Aging: Evidence for an Impact on Pre-and Post-War Generations of Okinawans in
Okinawa and Hawaii
Bradley Willcox, D. Craig Willcox, Makoto Suzuki, Hidemi Todoriki, Qimei He, Kamal Masaki, John Grove, Randi Chen, Katsuhiko Yano, J. David Curb.
Pacific Health Research Institute (B.W., D.C.W., K.M., K.Y., K.F, J.D.C.), Honolulu, Hawaii; Honolulu Heart Program, Kuakini Medical Center (B.W., K.Y., K.F., K.M., J.D.C), Honolulu, Hawaii; Department of Geriatric Medicine and Medicine, John A. Burns School of Medicine, University of Hawaii (B.W., K.M., J.D.C.), Honolulu, Hawaii; Department of Public Health, University of Hawaii (J.G.); College of Nursing, Okinawa Prefectural University (D.C.W.), Okinawa, Japan; University of the Ryukyus (M.K., H.T.) and Okinawa Research Center for Longevity Science (B.W., D.C.W., M.K.).
Background: Long-term “caloric restriction (CR)” also known as “under-nutrition without malnutrition,” is a robust means of reducing age-related diseases and extending lifespan in multiple species but the effects in humans are controversial. Most human populations who have experienced low calorie intake have suffered from malnutrition and poor health due to poor quality diets. However, the pre-World War 2 generation in Okinawa had a low calorie intake but a high quality diet, combined with high physical activity, and this generation exhibits several physical and health characteristics associated with the CR phenotype. These characteristics include: small body size, low BMI (body mass index) at younger ages, low risk for chronic diseases, high physical and cognitive function, and a very long life expectancy. These phenotypic characteristics appear to be disappearing in post-war generations. Therefore, we hypothesize that CR has contributed to the robust health seen in older Okinawans and that post-war lifestyle changes may eliminate many of these health advantages. Methods: We analyzed six decades of cross-sectional population data for evidence that CR may have played a role in the healthy aging seen in older Okinawans. We then tested several of these factors in a prospective study of longevity in Okinawan-and other Japanese Americans in Hawaii known as the Hawaii Lifespan Study (HLS). The HLS is a prospective cohort study within the Honolulu-Heart Program and Honolulu Asia Aging Study. We studied a total of 5,820 men (mean age of 54 years with range of 45-68 years) who were free of morbidity and functional impairments at baseline. These men were followed for up to 40 years (1965-2005) to assess overall and healthy survival in

relation to CR-linked factors identified in older Okinawans in Okinawa. Healthy survival was defined as survival to a specified age (75, 80, 85, or 90 years) without incidence of 6 major chronic diseases and without physical and cognitive impairment. Results: Data on caloric intake, energy expenditure, other nutritional variables, anthropometric measures, age-related hormones and morbidity/mortality outcomes support a caloric restriction phenotype for elderly Okinawans and suggest that CR may have contributed to their exceptionally healthy longevity. These data include: low caloric intake, an energy deficit at younger ages, low body mass index, and relatively high plasma DHEA levels at older ages with concomitant low risk for morbidity/mortality. These data in older Okinawans in Okinawa are supported by prospective findings of older Okinawans and other Japanese-Americans in the Hawaii Lifespan Study. Data from younger, post-war generations of Okinawans suggest that over-nutrition and lack of physical activity, resulting in positive energy balance may be undoing some of these CR-linked health attributes in Okinawa. Conclusions: These data are consistent with the well-known animal literature on CR-linked phenotypes and longevity and these findings provide support for the CR hypothesis in humans. Further study of the potential role of CR for improving human health and longevity is warranted. Further study of the potential health risks of over-nutrition and obesity in post-war generations of Okinawans and other populations is also warranted. This work was supported by contract N01-HC-05102 from the National Heart, Lung, and Blood Institute, contract N01-AC-4-2149 and grants5 U01 AC019349-O5, R01 AC027O60-01 (Hawaii Lifespan Study), and K08 A622788-02 from the National Institute on Aging, and grant 2004-0463frcm the Hawaii Community Foundation. Also supported by the Japan Ministry of Health, Labor and Welfare (Okinawa Centenarian Study) and the Obuchi Foundation (H. Todoriki).

1
Caloric Restriction, Energy Balance Caloric Restriction, Energy Balance and Healthy Agingand Healthy Aging
Evidence for an Impact on PreEvidence for an Impact on Pre--and Postand Post--War Generations War Generations of Okinawans in Okinawa and Hawaiiof Okinawans in Okinawa and Hawaii
B Willcox, D Willcox, H Todoriki, Q He, B Willcox, D Willcox, H Todoriki, Q He, R Chen, K Yano, K Masaki, R Chen, K Yano, K Masaki,
J Grove, T Donlon, J Curb, M Suzuki J Grove, T Donlon, J Curb, M Suzuki
Pacific Health Research Institute; Kuakini Medical Center; DeparPacific Health Research Institute; Kuakini Medical Center; Department of tment of Geriatric Medicine, John A. Burns School of Medicine, UniversityGeriatric Medicine, John A. Burns School of Medicine, University of Hawaii; of Hawaii;
Okinawa Prefectural University; Okinawa Research Center for LongOkinawa Prefectural University; Okinawa Research Center for Longevity evity Science; University of the RyukyusScience; University of the Ryukyus
Okinawa Centenarian Study Okinawa Centenarian Study The Research TeamThe Research Team
HYPOTHESESHYPOTHESES
Healthy aging in populations is related to common risk factor profiles including biological, lifestyle and sociodemographic factors
Assuming basic public health infrastructure and avoidance of risk-taking behavior (e.g. smoking), energy balance (calories consumed vs. calories expended) becomes a dominating factor
This is mediated through insulin-related metabolic pathways
The early influence of the US presence has been positive
Later dietary influence from both the US and mainland Japan contributed to obesity and metabolic syndrome
Age Standardized Mortality in Japanese Males Age Standardized Mortality in Japanese Males 19501950--19991999
年齢調整死亡率の年次推移年齢調整死亡率の年次推移
0
50
100
150
200
250
300
350
400
1950 '5
5'60
'65
'70
'75
'80
'85
'90
'95
Tuberculosis
Pneumonia
CerebrovasculardiseaseHeart disease
Cancer
Suicide
Early Gains in Life Expectancy were Early Gains in Life Expectancy were Largely Due to USLargely Due to US--based Public Health based Public Health
Interventions Interventions
% Contribution to Change in Average Life Expectancy by Age-group
(Years) 0-4 5-14 15-34 35-49 50-64 65+
1955-60 1.72 55.3 9.3 22.2 14.1 6.5 -7.4
1960-65 2.42 46.5 5.3 11.9 7.4 14.7 7.2
1965-70 1.58 32.0 3.8 5.9 7.1 22.0 28.0
1970-75 2.42 15.3 3.1 2.7 9.0 25.4 37.3
1975-80 1.62 16.4 3.3 3.6 12.1 17.1 40.4
1980-85 1.43 15.9 2.6 3.4 12.5 11.0 53.8
1985-90 1.14 7.0 2.0 1.0 15.6 18.4 50.3
TimeChange
in Average

2
Since the main health risks now are chronic diseases and Since the main health risks now are chronic diseases and aging affects all of themaging affects all of them-- We need to better understand We need to better understand
mechanisms of agingmechanisms of aging
Successful AgingSuccessful Aging
Rowe & Kahn (1998)Rowe & Kahn (1998)
Age Adjusted Death Rates (per 100,000 people)
Rank Location Life CHD Cancer Stroke AllExpectancy Causes
1 Okinawa 81.2 18 97 35 3352 Japan 79.9 22 106 45 3643 Hong Kong 79.1 40 126 40 3934 Sweden 79.0 102 108 38 4358 Italy 78.3 55 135 49 45910 Greece 78.1 55 109 70 44918 USA 76.8 100 132 28 520
WHO 1996, Japan Ministry of Health and Welfare 1996
Older Okinawans Tend to Avoid Disease High Physical Function and Active Engagement with Life
The Evolutionarily Conserved Insulin/IGF-1 Signaling Pathway*
_______________
* Barbieri M, Bonafe M, Franceschi C, Paolisso G. Insulin/IGF-I-signaling pathway: an evolutionarily conserved mechanism of longevity from yeast to humans. Am J Physiol Endocrinol Metab 2003;285:E1064-E1071.
Low Calorie Intake Turns on Genes that Leads to Slower AgingLee et al., Science 285, 1390 (1999)
Muscle biopsy at 30 months... (elderly)
Control
100 -
% S
urvi
ving
4020 60Lifespan (months)
0
Control: 33 MonthsRestricted: 45 Months
At 30 months muscle biopsy showed that with over 6,000 genes linked to aging
84% of genes had improved function in the low calorie group many affected by insulin signaling
Experimental (24 % CR from adult)

3
Science (1999) 285:1390-1393
Caloric restriction–induced alterations in gene expression
Okinawan Centenarian and Well Fed Okinawan Centenarian and Well Fed North Americans ResearchersNorth Americans Researchers
Caloric Intake, Energy Balance and BMI in Caloric Intake, Energy Balance and BMI in Okinawa 1949Okinawa 1949--19981998
(Willcox B et al. Mech Age Devp 2006 Submitted)(Willcox B et al. Mech Age Devp 2006 Submitted)Yearly changes of staple foods Yearly changes of staple foods (rice, sweet potato, and bread )(rice, sweet potato, and bread )
コメと甘藷の年次別摂取量推移(エネルギー密度換算)
0.0
10.0
20.0
30.0
40.0
50.0
60.0
70.0
1949 1960 1965 1967 1968 1969 1970 1972
年次
摂取
量割
合(エネル
ギー
%) コメ
甘藷
パン+菓子
Rice
Sweet potato
Bread
Caloric (Energy) Density in OkinawaCaloric (Energy) Density in OkinawaAA Key to Energy BalanceKey to Energy Balance
Willcox BJ, Willcox DC, Suzuki M The Okinawa Diet 2004
危険因子危険因子どうするどうする ??????

4
Significant Genetic Component to Significant Genetic Component to Exceptional Longevity Phenotype Exceptional Longevity Phenotype
(Centenarianism) in Okinawa(Centenarianism) in Okinawa
Willcox B, Hsueh WC et al. Internat Gen Epidem Soc Meeting, 2005
Hawaii Lifespan StudyHawaii Lifespan Study
Insights on Okinawan Insights on Okinawan Aging from longAging from long--lived lived Okinawans in HawaiiOkinawans in Hawaii
Healthy maleparticipant, 101 years
Nine Keys to a Healthy Old Age (Willcox B et al. JAMA 2006)
--------<.0011.59 (1.27 – 2.00)Unmarried
<.0011.56 (1.28 - 1.91)--------Low Education (< 12 Years)
Sociodemographic
0.0401.23 (1.01 - 1.52)<.0011.94 (1.72 - 2.18)Ever Smoker
0.0101.61 (1.11 - 2.34)<.0011.58 (1.34 - 1.88)High Alcohol (3+ drinks/day)
Lifestyle
0.0451.24 (1.01 - 1.52)<.0011.25 (1.11 - 1.40)Low Grip strength (< 39 kg)
<.0011.61 (1.29 – 2.00)<.0011.45 (1.29 - 1.63)Hypertension (≥ 140/90 or on meds)
0.0301.26 (1.03 - 1.54)0.081.11 (0.99 - 1.25)High Triglyceride (≥ 150 mg/dl)
0.0021.65 (1.21- 2.25)<.0011.64 (1.41 - 1.91)High Glucose (≥ 200 mg/dl)
<.0011.49 (1.19 - 1.86)0.0441.13 (1.00 - 1.28)Overweight at Mid-life (BMI ≥25)
Biological
pOR (95% CI)pOR (95% CI)Risk Factors
Poor Health Death
Maximizing Your Odds for a Long and Healthy Life
0
0.2
0.4
0.6
0.8
1
0 1 2 3 4 5 6 0 1 2 3 4 5 6 0 1 2 3 4 5 6 0 1 2 3 4 5 6
Survival Risk Score+ + +
Pro
babi
lity
+
Alive at Age 75 y Alive at Age 80 y
Alive at Age 85 y Alive at Age 90 y
Willcox B et al. JAMA 2006
ConclusionsConclusions
Early positive influence of US due to extensive public
health interventions, including water treatment, parasite
control, and infectious disease control
Later problems with metabolic syndrome (obesity, high
insulin levels, high blood sugar, high blood pressure, poor
cholesterol profile)
Future is uncertain
Same genes but different obesity outcomesGene--Environment Interactions are Key !

5
AcknowledgementsAcknowledgements
Supported by the Japan Society for Supported by the Japan Society for Promotion of Sciences, the US Promotion of Sciences, the US National Institutes of Health (NHLBI, National Institutes of Health (NHLBI, NIA), the Hawaii Community NIA), the Hawaii Community Foundation, the Foundation, the ObuchiObuchi Foundation Foundation and the people of Okinawa and Hawaii. and the people of Okinawa and Hawaii.
Nihei dehbiru!Nihei dehbiru!
Domo arigato!Domo arigato!
Mahalo!Mahalo!
Thank you very much !Thank you very much !
Longevity in Peril: An Exploration of Mortality Changes in Okinawa 1985-2000
Craig Willcox
Okinawa Prefectural College of Nursing, Okinawa, Japan Early post-war public health interventions by American and local Okinawan administrations that focused upon the building up of public health infrastructure and the elimination of infectious disease were largely responsible for the rapid increases in life expectancy experienced in the early post-war period. However, the longevity advantage experienced by Okinawa prefecture relative to other prefectures has been gradually eroding over the past couple of decades with life expectancy growth rates among the slowest in Japan. Men in particular have been experiencing slow increases in life expectancy. This has led to what is called the 26 Shock in Okinawa, reflecting the fact that Okinawan men dropped from among the top 5 prefectures within Japan in 1995 to 26th place (in life expectancy at birth) according to the most recent available statistics from the year 2000. Lifestyle changes that involve an uncoupling of energy intake and expenditure as well as other negative health behaviors may be contributing to emerging problems of obesity, diabetes, increased cardiovascular risk factors, higher rates of liver disease and higher suicide rates for large subsets of the population. An examination of specific causes of death that contributed to the sudden drop in life expectancy between 1995 and 2000 for Okinawan men reveals that lifestyle related diseases such as cerebrovascular disease, heart disease, liver disease and diabetes all played a role, particularly among middle-aged Okinawan men. Long term trends (since 1985) indicate that slower rates of decrease in cardiovascular diseases (stroke and heart disease), continuing high death rates from lung cancer, a slower rate of decrease in stomach cancer mortality and increasing rates of liver disease and suicide (compared to other prefectures) were important contributing factors. Without strong public health intervention that focuses upon both micro (health behavior) and macro (social structure and social policy) approaches, Okinawa will likely experience further decreases in average life expectancy relative to other prefectures in the coming decades.

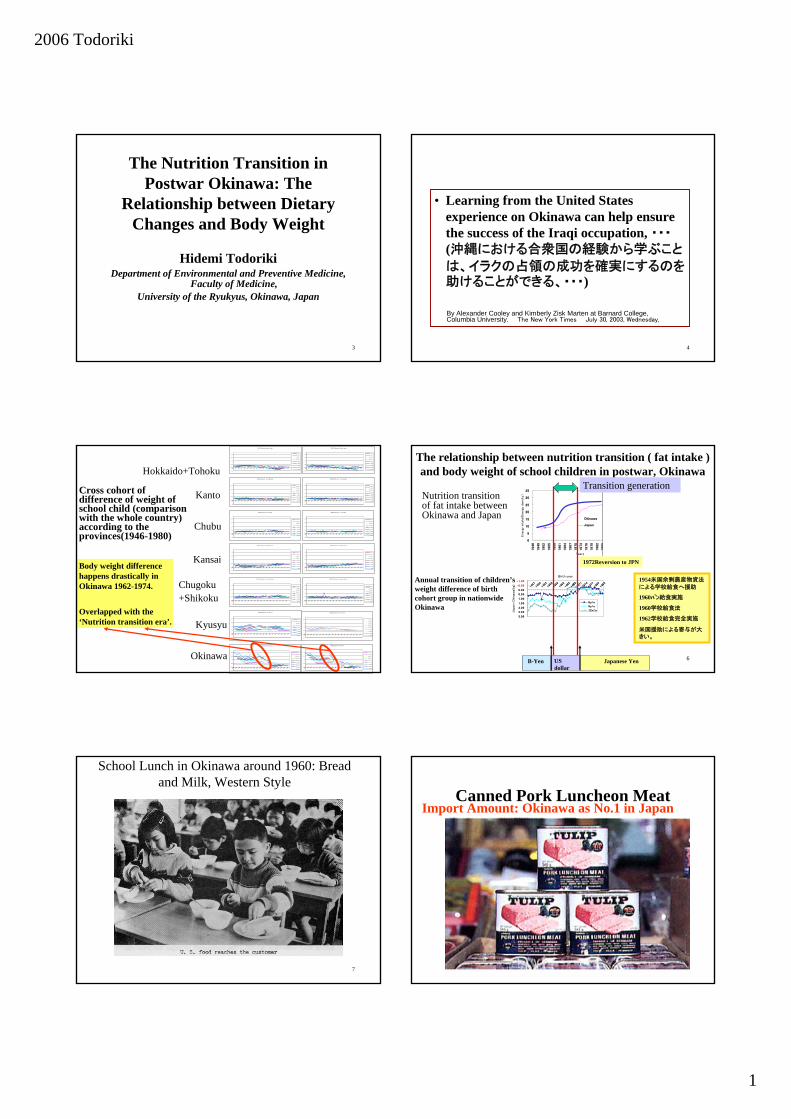
The Nutrition Transition in Postwar Okinawa: The Relationship between Dietary Changes and Body Weight
Hidemi Todoriki Department of Environmental and Preventive Medicine, Faculty of Medicine,
University of the Ryukyus, Okinawa, Japan
Background: Okinawa has among the world's longest-lived population. Recently, this has begun to change. The life expectancy of men in Okinawa Prefecture fell to 26th from 4th among the 47 prefectures of Japan, according to the most recent Ministry of Health, Labor and Welfare statistics (2000). Although life expectancy in Okinawa, particularly for men, had been slowing relative to other prefectures for around 17 years, the fall was none the less precipitous. Evidence of longevity in Okinawa has generally come from two indices, that of average life expectancy, and that of the centenarian ratio (number of centenarians per one hundred thousand population). Trend of Life Expectancy: As for growth in life expectancy, rates for both men and women in Okinawa have been slowing relative to other prefectures since 1985, and the growth between 1995 and 2000 was only 0.42 years for men(the lowest rate among the 47 prefectures of Japan) and 0.93 years for women(46th among the 47 prefectures of Japan). All-cause mortality for younger, post-war generations is higher than the national average while all-cause mortality for older people in Okinawa is lower, with the cross-over taking place at about 55 years of age. Although women in Okinawa currently remain the longest-lived in Japan, at current slow growth rates in life expectancy it is predicted that they too will relinquish their number one position in the not too distant future. As far as the other often used index of longevity, that is , the ratio of centenarians, for Okinawa the ratio for the year 2005 stood at 54.37 (per 100,000) vs. 51.88 for Kochi prefecture, and 22.23 for Japan as a whole thus it appears that although Okinawa still retains the lead in this area, other prefectures have been catching up here as well. The relative drop for younger generations seems to be due to multiple causes with increased risk for mortality from certain lifestyle related diseases figuring prominently. Nutrition Transition and Body Weight in Okinawa: Other aspects of the nutrition transition, such as changes in body weight and height, can also be seen in Okinawa by looking at school health statistics of children aged 6 to 15 years old. The weight of school children from Okinawa was lower than that of their mainland Japanese counterparts during the post-war period but differences contract rapidly in the first half of the 1970's, male and female school children from Okinawa then exceed the level of all-Japan in the

latter half of 1970's, and then fall slightly below all-Japan averages again in the mid to late 1980's. The yearly change in body height never exceeded that of all-Japan in the way that body weight did although similar trends can be witnessed. The nutrition transition in Okinawa, particularly with regards to increased fat intake and increased bodyweight, may be related to socio-political, socio-economic and socio-cultural changes that were set in motion either directly or indirectly during U.S. administration beginning in 1945 and although still being felt, were particularly strong up until reversion to Japan in 1972. Future of Okinawan Longevity: Life expectancy for men in Okinawa has fallen sharply relative to other prefectures and although at present women still retain their lead in Okinawa, if present trends continue, they too will fall. To put things in perspective, life expectancy rankings do not have a huge meaning anymore because differences between regions in the whole of Japan have been gradually decreasing. However, life expectancy is a comprehensible index that represents the concept of “longevity” and therefore has great appeal to the average person, after all, who doesn’t want to live a long and healthy life? In particular it is thought that the decrease in life expectancy rankings will exert a negative influence for Okinawa for the “longevity brands” of health food and the tourism industry. The “longevity crisis” that Okinawa has been dealing with since the latest life expectancy figures came out in 2000, was actually already pointed out as far back as ten years ago (or longer) by some investigators who have been following the health trends. Although public policy has been slow to respond and the meaning of "ten lost years" may be large for Okinawa. Public health authorities may also be limited in the extent to which they can counteract current lifestyle habits that are promoted by large multinational corporations (i.e. high-fat fast foods). On the other hand, the large life expectancy gains that took place in Nagano over the past few decades should not be overlooked, especially with regards to the beneficial effects that public health policy exerted in bringing about positive changes in health-promoting behavior. In that sense, it is necessary to look at things from a long-term perspective and plan ahead using the latest scientific knowledge and tools at our disposal. An epidemiological study with a large scale of population size is necessary, as is priority given to a population strategy of health education beginning with school children and aiming at life-long health promotion for the average person.
2006 Todoriki
1
3
The Nutrition Transition in Postwar Okinawa: The
Relationship between Dietary Changes and Body Weight
Hidemi TodorikiDepartment of Environmental and Preventive Medicine,
Faculty of Medicine, University of the Ryukyus, Okinawa, Japan
4
• Learning from the United States experience on Okinawa can help ensure the success of the Iraqi occupation, ・・・(沖縄における合衆国の経験から学ぶこと
は、イラクの占領の成功を確実にするのを助けることができる、・・・)
By Alexander Cooley and Kimberly Zisk Marten at Barnard College, Columbia University. The New York Times July 30, 2003, Wednesday,
5
MALES Nationwide-Northern Japan
-1.6
-0.6
0.4
1.4
2.4
3.4
1944
1946
1948
1 950
1952
1954
1956
1958
196 0
1962
1 964
1966
1968
1970
1972
1 974
1976
1978
1980
6 years
7 years
8 years
9 years
10 years
11 years
12 years
13 years
14 years
MALES Nationwide - Tokyo Metropolis
-1.6
-0.6
0.4
1.4
2.4
3.4
1944
1946
1948
195 0
1952
1 954
1956
1958
196 0
1962
1 964
1966
1968
197 0
1972
1 974
1976
1978
1980
6 years
7 years
8 years
9 years
10 years
11 years
12 years
13 years
14 years
MALES Nationwide-Central Japan
-1.6
-0.6
0.4
1.4
2.4
3.4
1944
1946
1948
195 0
1952
1 954
1956
1958
196 0
1962
1 964
1966
1968
197 0
1972
1 974
1976
1978
1980
6 years
7 years
8 years
9 years
10 years
11 years
12 years
13 years
14 years
MALES Nationwide - Osaka Metropolis
-1.6
-0.6
0.4
1.4
2.4
3.4
1944
1946
1948
195 0
1952
1 954
1956
1958
196 0
1962
1 964
1966
1968
197 0
1972
1 974
1976
1978
1980
6 years
7 years
8 years
9 years
10 years
11 years
12 years
13 years
14 years
MALES Nationwide - Chuugoku Sh ikoku
-1.6
-0.6
0.4
1.4
2.4
3.4
1 944
1946
1 948
1950
1 952
1954
195 6
1958
196 0
1962
1964
1966
1968
1970
1972
1974
1976
1978
6 years
7 years
8 years
9 years
10 years
11 years
12 years
13 years
14 years
MALES Nationwide - Kyushu Area
-1.6
-0.6
0.4
1.4
2.4
3.4
1944
1946
1948
195 0
1952
1 954
1956
1958
1 960
1962
1 964
1966
1968
1970
1972
1 974
1976
1978
1980
6 years
7 years
8 years
9 years
10 years
11 years
12 years
13 years
14 years
MALES Nationwide-Okinawa
-1.6
-0.6
0.4
1.4
2.4
3.4
1944
1946
1948
1950
1952
1954
1956
1958
1960
1962
1964
1966
1968
1970
1972
1974
1976
1978
1980
6 years
7 years
8 years
9 years
10 years
11 years
12 years
13 years
14 years
FEMALES Nationwide-Okin awa
-1.6
-0.6
0.4
1.4
2.4
3.4
1944
1946
1948
1950
1952
1954
1956
1958
1960
1962
1964
1966
1968
1970
1972
1974
1976
1978
1980
6 years
7 years
8 years
9 years
10 years
11 years
12 years
13 years
14 years
FEMALES Nationwide-Northern Japan
-1.6
-0.6
0.4
1.4
2.4
3.4
1944
1946
1948
195 0
1952
1 954
1956
1958
196 0
1962
1 964
1966
1968
197 0
1972
1 974
1976
1978
1980
6 years
7 years
8 years
9 years
10 years
11 years
12 years
13 years
14 years
FEMALES Nationwide - Tokyo Metropolis
-1.6
-0.6
0.4
1.4
2.4
3.4
1944
1946
1948
195 0
1952
1 954
1956
1958
196 0
1962
1 964
1966
1968
197 0
1972
1 974
1976
1978
1980
6 years
7 years
8 years
9 years
10 years
11 years
12 years
13 years
14 years
FEMALES Nationwide - Central Japan
-1.6
-0.6
0.4
1.4
2.4
3.4
1944
1946
1948
1950
1952
1954
1956
1958
1960
1962
1964
1966
1968
1970
1972
1974
1976
1978
1980
6 years
7 years
8 years
9 years
10 years
11 years
12 years
13 years
14 years
FEMALES Nationwide - Osaka Me tropo lis
-1.6
-0.6
0.4
1.4
2.4
3.4
1944
1946
1948
195 0
1952
1 954
1956
1958
196 0
1962
1 964
1966
1968
197 0
1972
1 974
1976
1978
1980
6 years
7 years
8 years
9 years
10 years
11 years
12 years
13 years
14 years
FEMALES Nationwide - Chuugoku Shikoku
-1.6
-0.6
0.4
1.4
2.4
3.4
1944
1946
1948
195 0
1952
1 954
1956
1958
196 0
1962
1 964
1966
1968
197 0
1972
1 974
1976
1978
1980
6 years
7 years
8 years
9 years
10 years
11 years
12 years
13 years
14 years
FEMALES Nationwide - Kyushu Area
-1.6
-0.6
0.4
1.4
2.4
3.4
1944
1946
1948
195 0
1952
1 954
1956
1958
196 0
1962
1 964
1966
1968
197 0
1972
1 974
1976
1978
1980
6 years
7 years
8 years
9 years
10 years
11 years
12 years
13 years
14 years
Hokkaido+Tohoku
Kanto
Chubu
Kansai
Chugoku+Shikoku
Kyusyu
Okinawa
Body weight difference happens drastically in Okinawa 1962-1974.
Overlapped with the ‘Nutrition transition era’.
Cross cohort of difference of weight of school child (comparison with the whole country) according to the provinces(1946-1980)
6
The relationship between nutrition transition ( fat intake ) and body weight of school children in postwar, Okinawa
0
5
10
15
20
25
30
35
1946
1949
1952
1955
1958
1961
1964
1967
1970
1973
1976
1979
1982
1985
1988
1991
1994
1997
Years
Ener
gy in
take
(Ene
rgy
dens
ity)
Okinawa
Japan
-1 .00
-0 .5 0
0 .0 0
0 .5 0
1 .0 0
1 .5 0
2 .0 0
2 .5 0
3 .0 0
1947
1950
1 953
1956
1959
1 962
1 965
1 968
1 971
1 974
1 977
1 980
1 983
Birth year
Japan-
Oki
naw
a(k
g)
6 y/o
9y/o
12y/o
1972Reversion to JPN
1954米国余剰農産物資法
による学校給食へ援助
1960パン給食実施
1960学校給食法
1962学校給食完全実施
米国援助による寄与が大きい。
US dollar
Japanese YenB-Yen
Transition generation
Annual transition of children’s weight difference of birth cohort group in nationwide Okinawa
Nutrition transition of fat intake between Okinawa and Japan
7
School Lunch in Okinawa around 1960: Bread and Milk, Western Style
8
Canned Pork Luncheon MeatImport Amount: Okinawa as No.1 in Japan

2006 Todoriki
2
9
Relationship between obesity and socioeconomic status
HighLow
Low
Hig
h
Socioeconomic Status
Prop
ortio
n of
Obe
sity
Developed societies
Pena M., Bacallao J. Obesity and Poverty: A New Public Health Challenge, PAHO & WHO 2000
Developing societies
Global + Obesity = Globesitynew ‘ malnutrition’ (WHO)
10
Factors of Rise and Fall of the Ranking of Okinawan Life Expectancy
Important factor : 27 year U.S. AdministrationReversion to Japan
Factor of Rise
•Decrease of infantntmortality
•Decrease of infectious disease), advantage from public health Factor of Fall
•Nutrition transition in post war
•Increase lifestyle-related disease ( lung cancer, diabetes, stroke)
11
Conclusions1)Descriptive statistical data indicate a
correlation between children’s body weight and body fat. These nutrition transitions occurred under the influence of socio-economic policy interventions of the US and later Japan.
2)Such nutrition and body weight/BMI changes are likely to have long-term consequences for the future health and longevity of these cohorts, already evident in cohort mortality data.
12
Nihei dehbiru!
Thank you very much !
お疲れ様

Recent Trends in Health Status of Okinawa: Comparison with whole nation
Tomohiro Hirao
Health Policy and Management, Kagawa University
Although Okinawa has been known as a land of longevity, the recent report from the ministry of health suggested that the reputation was questioned. The male ranking of life expectancy among 47 prefectures was dropped to 26th in 2000. Female still keeps the top of the country but the difference with the second place shrank. What is going on in the islands and when this trend started? Recently I have a chance to attend the Apple-Pineapple Project, in which causes of health outcome differences among Japanese 47 prefectures were investigated. In this presentation, I introduce the findings concerning Okinawa. Diseases and conditions contributed to the extension of the life expectancies
From 1975 to 2000, life expectancy of whole nation has been extended 5.92 years in male and 7.61 years in female. During the same period, the extension of life expectancy in Okinawa was 5.49 years in male and 7.05 years in female (prefecture ranks were 44th and 45th respectively). To understand what diseases and/or conditions contributed to the extension of life expectancies, we decomposed the life tables of 47 prefectures with Pollard method. In Okinawa, the contributions of stroke (especially cerebral infarction), ischemic heart disease, and suicide in both sexes and malignant neoplasms (especially stomach cancer) in female
Fig1. Contributed years for the extension of life expectancy (1975-2000)
-1.0
-0.5
0.0
0.5
1.0
1.5
2.0
2.5
0-14 15-34 35-64 65-74 75--1.0
-0.5
0.0
0.5
1.0
1.5
2.0
2.5
0-14 15-34 35-64 65-74 75-
-1.0
0.0
1.0
2.0
3.0
4.0
0-14 15-34 35-64 65-74 75--1.0
0.0
1.0
2.0
3.0
4.0
0-14 15-34 35-64 65-74 75-
Japan (male) Okinawa (male)
Japan (female) Okinawa (female)
Others
Perinatal
Injuries
Infections
Digestive
Stroke
IHD
Suicide
Respiratory
Malignancy
Fig2. Trend of CLSM ranking in male
0
10
20
30
40
50
1915 1925 1935 1945 1955 1965 1975
Birth year
Ran
k
AomoriNaganoOsakaOkinawa

were smaller than those of whole nation (Fig1). Above all ischemic heart disease and suicide shortened the life expectancy. Birth cohort contributed to the population health outcome
To understand the cohort effects for population health, we developed cohort life stage mortality (CLSM), which shows the expected mortality rate during certain period for each birth cohort. We estimated the CLSM of 1915-1975 birth cohorts and their ranking. In Okinawa, clear ranking shift occurred between 1935 and 1950 birth cohorts (Fig2). The birth cohorts born before the war (over 70 years old, the elderly) were in the top health status group but the cohorts born after the war (under 60 years old, the young) were in the worst group.
Characteristics of health status in the young To clarify the characteristics of health
status in Okinawan young, we analyzed the trends of age and disease specific Standardized Mortality Rate (SMR) for three periods, 1973-82, 1983-92 and 1983-2002. In both sexes, SMRs of 20-50 years old were higher than whole nation and increased in cerebral hemorrhage, diabetes, liver diseases and suicide.
What factors affected the heath status of the young? According to the trends of health-checkups results, numbers of high cholesterol (Total cholesterol >=220mgdl), diabetes (FBS>=126 or HbA1c>=6.5 or BS>=200), liver function abnormality and obesity (BMI>=25) were increasing. Especially the increase of obesity might be much higher than whole nation (Fig3). Although we do not have good evidence on the relationship between these factors and health outcomes, it is suggested that the rapid change of risk factors affected the health outcomes in Okinawan young. Furthermore, these changes might be affected by the rapid socio-economical and cultural changes after the war.
Okinawa experienced the drastic social changes in the short period. Rapid changes in
life style, diet, exercise, alcohol, smoking and so on, might be distal causes of health outcomes. Because same phenomenon might occurred in other areas of Japan in slower pace, we have to keep eyes on Okinawa as a mirror of whole nation.
0
10
20
30
40
50
60
20-29 30-39 40-49 50-59 60-69 70-
2000 Okinawa1995 Okinawa1990 Okinawa
%
Age
1985 Okinawa
1985 Japan1990 Japan
1995 Japan2000 Japan
Fig3.Trends of obesity % in male (1985-2000)Data source: Rojinhoken check-ups (Okinawa), National health and nutrition survey (Japan)

1
Recent Trends in Health Status of Okinawa:
Comparison with whole nationTomohiro Hirao,MD.,PhD.
Health Policy and Management, Faculty of Medicine, Kagawa University
Menu
1. Diseases and conditions contributed to the extension of the life expectancies
2. Birth cohort contributed to the population health outcome
3. Characteristics of health status in the young people
1. Diseases and conditions contributed to the extension of the life expectancies
Extension of Life Expectancy 1975-2000
68
70
72
74
76
78
80
1975 1980 1985 1990 1995 2000
76
78
80
82
84
86
88
1975 1980 1985 1990 1995 2000
female
male
From 1975 to 2000, life expectancy of Japan has been extended 5.92 years in male and 7.61 years in female. During the same period, the extension of life expectancy in Okinawa was 5.49 years in male and 7.05 years in female (prefecture ranks were 44th and 45th respectively)
Japan
Aomori
Nagano
Okinawa
Extension1975 2000
maleOkinawa 72.15 77.64 26 5.92 44Japan 71.79 77.71 5.49
femaleOkinawa 78.96 86.01 1 7.61 45Japan 77.01 84.62 7.05
Ranking in2000
Rnking ofExtension
Life expectancy
Diseases and conditions contributed to the extension of the life expectancies
-1.0
-0.5
0.0
0.5
1.0
1.5
2.0
2.5
0-14 15-34 35-64 65-74 75-
-1.0
0.0
1.0
2.0
3.0
4.0
0-14 15-34 35-64 65-74 75-
Japan (female) 7.61 Okinawa (female)7.05
Japan (male) 5.92 Okinawa (male) 5.49Others
Perinatal
Injuries
Infections
Digestive
Stroke
IHD
Suicide
Respiratory
Malignancy
-1.0
-0.5
0.0
0.5
1.0
1.5
2.0
2.5
0-14 15-34 35-64 65-74 75-
-1.0
0.0
1.0
2.0
3.0
4.0
0-14 15-34 35-64 65-74 75-
Cancers contributed to the extension of the life expectancies
Japan (female) Okinawa (female)
Japan (male) Okinawa (male)
-0.5
-0.4
-0.3
-0.2
-0.1
0.0
0.1
0.2
0.3
0.4
0.5
0-14 15-34 35-64 65-74 75-
-0.5
-0.4
-0.3
-0.2
-0.1
0.0
0.1
0.2
0.3
0.4
0.5
0-14 15-34 35-64 65-74 75-
-0.5
-0.4
-0.3
-0.2
-0.1
0.0
0.1
0.2
0.3
0.4
0.5
0-14 15-34 35-64 65-74 75-
-0.5
-0.4
-0.3
-0.2
-0.1
0.0
0.1
0.2
0.3
0.4
0.5
0-14 15-34 35-64 65-74 75-
Others
Uterine
Breast
Colon and rectum
Liver
Trachea, bronchus, lungStomach

2
CVDs contributed to the extension of the life expectancies
Japan (female) 2.67 Okinawa (female) 1.93
Japan (male) 2.3 Okinawa (male) 1.65
-0.2
0.0
0.2
0.4
0.6
0.8
1.0
1.2
1.4
1.6
0-14 15-34 35-64 65-74 75-
-0.2
0.0
0.2
0.4
0.6
0.8
1.0
1.2
1.4
1.6
0-14 15-34 35-64 65-74 75-
-0.2
0.0
0.2
0.4
0.6
0.8
1.0
1.2
1.4
1.6
0-14 15-34 35-64 65-74 75-
-0.2
0.0
0.2
0.4
0.6
0.8
1.0
1.2
1.4
1.6
0-14 15-34 35-64 65-74 75-
Others
Cerebral infarction
Cerebral bleedingSAH
2. Birth cohort contributed to the population health outcome
Age-Specific Mortality (qx) of Japanese male 40-70yo (birth year 1910-1949)
0
0.002
0.004
0.006
0.008
0.01
0.012
0.014
1915 1920 1925 1930 1935 1940 1945 1950 1955
404142434445464748495051525354555657585960616263646566
Birth Year
Recession in 70’s
Recession in 90’s Age
Cohort Life Table
qx
Hasegawa T 2005
Age-Specific Mortality (qx) of Japanese female 40-75yo (birth year 1910-1959)
40
41
4243
44
4546
47
484950
5152
5354
55565758
59
60
61
62
6364
6566
6768
69707172
7374
0
0.002
0.004
0.006
0.008
0.01
0.012
0.014
1910 1915 1920 1925 1930 1935 1940 1945 1950 19550
0.002
0.004
0.006
0.008
0.01
0.012
0.014
0
0.002
0.004
0.006
0.008
0.01
0.012
0.014
1910 1915 1920 1925 1930 1935 1940 1945 1950 1955
qx
Birth year Cohort Life Table
Age
Hanshin-Awaji Quake?
Recession?
Hasegawa T 2005
60
80
100
120
140
160
188
5
189
5
190
5
191
5
192
5
193
5
194
5
195
5
196
5
197
5
198
5
Birth year
cmExam for Conscription
2020歳歳1212歳歳
1313歳歳
1414歳歳
1515歳歳
1616歳歳
1111歳歳
10歳9歳
88歳歳77歳歳
66歳歳 55歳歳44歳歳33歳歳
22歳歳11歳歳
00歳歳
National Nutrition Survey
School health StatisticsB
ody Height
Trend of Body HeightJapanese male 0-20 yo (birth year 1888-1990)
Hasegawa T 2005
0
500
1000
1500
2000
2500
188
0
188
5
189
0
189
5
190
0
190
5
191
0
191
5
192
0
192
5
193
0
193
5
194
0
194
5
195
0
195
5
196
0
196
5
197
0
197
5
198
0
198
5
199
0
0
5
10
15
20
25
30
35
40
45
Energy intake
Animal protein intake
kcal
National Nutrition Survey
g
WWⅡ
Trend of nutrition intake

3
Trend of CLSM Ranking
0
10
20
30
40
50
1915 1930 1945 1960 1975Birth year
Rank
0
10
20
30
40
50
1915 1930 1945 1960 1975Birth year
Rank
Aomori Nagano Osaka Okinawa
male female
CLSM: cohort life stage mortality, which shows the expected mortality rate
during certain period for each birth cohort.
3. Characteristics of health status in the young people
Ratios of Mortality Rate (Okinawa vs. Japan)
male
0.00.51.01.52.02.53.0
00-04
10-14
20-24
30-34
40-44
50-54
60-64
70-74
80-84
1973-1982
1983-1992
1993-2002
female
0.00.51.01.52.02.53.0
00-0
4
10-1
4
20-2
4
30-3
4
40-4
4
50-5
4
60-6
4
70-7
4
80-8
4
1973-1982
1983-1992
1993-2002
male
0.0
0.5
1.0
1.5
2.0
2.5
3.0
00-04
10-14
20-24
30-34
40-44
50-54
60-64
70-74
80-84
1973-1982
1983-1992
1993-2002
female
0.00.51.01.52.02.53.0
00-04
10-14
20-24
30-34
40-44
50-54
60-64
70-74
80-84
1973-1982
1983-19921993-2002
Cerebral hemorrhage
Diabetes
Vital statistics
Ratios of Mortality Rate (Okinawa vs. Japan)Chronic liver diseases
Suicide
Vital statistics
male
0.00.51.01.52.02.53.0
00-0
4
10-1
4
20-2
4
30-3
4
40-4
4
50-5
4
60-6
4
70-7
4
80-8
4
1973-19821983-19921993-2002
female
0.00.51.01.52.02.53.0
00-04
10-14
20-24
30-34
40-44
50-54
60-64
70-74
80-84
1973-19821983-19921993-2002
male
0.0
0.5
1.0
1.5
2.0
2.5
00-0
4
10-1
4
20-2
4
30-3
4
40-4
4
50-5
4
60-6
4
70-7
4
80-8
4
1973-1982
1983-1992
1993-2002
female
0.0
0.5
1.0
1.5
2.0
2.5
00-0
4
10-1
4
20-2
4
30-3
4
40-4
4
50-5
4
60-6
4
70-7
4
80-8
4
1973-1982
1983-1992
1993-2002
Trends of check-ups results% of total cholesterol >=220mg/dl
% of diabetes (FBS>=126 or HbA1c>=6.5 or BS>=200)
0
5
10
15
20
25
30
35
40
20-24
*25-29
30-34
35-39
40-44
*45-49
*50-54
55-59
*60-64
*65-69
*70-74
75-79
80-84
85-89
0
10
20
30
40
50
60
*20-24
*25-29
*30-34
*35-39
*40-44
*45-49
*50-54
*55-59
*60-64
*65-69
*70-74
*75-79
*80-84
85-89
1990年 1995年 2000年 1990年 1995年 2000年male female
0
2
4
6
8
10
12
14
16
18
20
20-
24
25-
29
*30-
34
*35-
39
*40-
44
*45-
49
*50-
54
*55-
59
*60-
64
*65-
69
*70-
74
*75-
79
*80-
84
90-
94 0
2
4
6
8
10
12
14
16
18
20-
24
25-
29
30-
34
35-
39
40-
44
45-
49
50-
54
*55-
59
*60-
64
*65-
69
*70-
74
*75-
79
*80-
84
85-
89
90-
94
male female1999 年 2000 年 2001 年 2002 年 2003年
0
10
20
30
40
50
60
20-29 30-39 40-49 50-59 60-69 70-
2000 Okinawa1995 Okinawa
1990 Okinawa
%
Age
1985 Okinawa
1985 Japan
1990 Japan1995 Japan
2000 Japan
Data source: Rojinhoken check-ups (Okinawa), National health and nutrition survey (Japan)
Trend of obesity % in male (1985-2000)

4
Prefecture Ranking of Health Related Statistics (Okinawa)
male femaleBehavior
Life style
Intervention
Risk
Disability
Consultation
Subjective
Mortality
Behavior
Life style
Intervention
Risk
Disability
Consultation
Subjective
Mortality
Matsumoto.K, Hasegawa.T 2002
Prefecture Ranking of Health Related Statistics (Nagano)
Matsumoto.K, Hasegawa.T 2002
male femaleBehavior Behavior
Mortality Mortality
Subjective Subjective
Life style Life style
Intervention Intervention
Consultation Consultation
Disability Disability
Risk Risk
Summary and Conclusions
• Extension of life expectancy between 1975-2000 was small
• Contributions of cerebral infarction, ischemic heart disease and suicide were smaller than whole nation.
• Ischemic heart disease and suicide shortened the life expectancy.
Summary and Conclusions
• The cohorts born before the war (over 70 years old) were top health status in the country
• But the cohorts born after the war (under 60 years old) were in the worst group.
Summary and Conclusions
• Okinawa experienced the drastic social changes in the short period. Rapid changes in life style, diet, exercise, alcohol, smoking and so on, might be distal causes of today’s health outcomes.
• Because same phenomenon might occur in other areas of Japan in slower pace, we have to keep eyes on Okinawa as a mirror of whole nation.
Thank you!Tomohiro Hirao,MD.,PhD.
Health Policy and Management, Faculty of Medicine, Kagawa University
[email protected]://www.kms.ac.jp/~iryoukan/index.htm