postal regulatory commission analysis of the postal
TRANSCRIPT

POSTAL REGULATORY COMMISSION
Analysis of the Postal Service’s FY 2015 Annual Performance Report and
FY 2016 Performance Plan
May 4, 2016
Postal Regulatory CommissionSubmitted 5/4/2016 3:32:35 PMFiling ID: 95803Accepted 5/4/2016

- i -
TABLE OF CONTENTS Page
EXECUTIVE SUMMARY ....................................................................................................................................... 1
CHAPTER 1: INTRODUCTION........................................................................................................................... 3
A. Background ................................................................................................................................. 3
B. The FY 2015 Report and FY 2016 Plan ............................................................................ 6
CHAPTER 2: COMPLIANCE WITH LEGAL REQUIREMENTS ................................................................. 8
A. Legal Requirements ................................................................................................................. 8
B. Comments .................................................................................................................................... 9
C. Commission Analysis ........................................................................................................... 11
1. FY 2016 Plan ............................................................................................................. 12
2. FY 2015 Report ........................................................................................................ 14
CHAPTER 3: ANALYSIS OF POSTAL SERVICE PERFORMANCE ....................................................... 19
A. Deliver High-Quality Services ........................................................................................... 21
1. Background ............................................................................................................... 21
2. Comments .................................................................................................................. 23
3. Commission Analysis ............................................................................................. 25
B. Provide Excellent Customer Experiences .................................................................... 32
1. Background ............................................................................................................... 32
2. Comments .................................................................................................................. 38
3. Commission Analysis ............................................................................................. 39
C. Ensure a Safe Workplace and Engaged Workforce .................................................. 46
1. Background ............................................................................................................... 46
2. Comments .................................................................................................................. 49
3. Commission Analysis ............................................................................................. 50
D. Sustain Controllable Income ............................................................................................. 56
1. Background ............................................................................................................... 56
2. Comments .................................................................................................................. 58
3. Commission Analysis ............................................................................................. 60
CHAPTER 4: STRATEGIC INITIATIVES ...................................................................................................... 68
A. Background .............................................................................................................................. 68
B. Comments ................................................................................................................................. 74
C. Commission Analysis ........................................................................................................... 75
Appendix—Commission Findings and Recommendations

Analysis of FY 2015 Performance Report Executive Summary and FY 2016 Performance Plan
- 1 -
EXECUTIVE SUMMARY Each year the Postal Service must submit to the Commission its most recent annual performance plan and annual performance report. 39 U.S.C. § 3652(g). On December 29, 2015, the Postal Service filed its fiscal year (FY) 2015 annual performance report (FY 2015 Report) and FY 2016 annual performance plan (FY 2016 Plan) in Docket No. ACR2015. The FY 2016 Plan reviews the Postal Service’s plans for FY 2016. The FY 2015 Report discusses the Postal Service’s progress during FY 2015 toward its four performance goals:
Deliver High-Quality Services
Provide Excellent Customer Experiences
Ensure a Safe Workplace and Engaged Workforce
Sustain Controllable Income The Commission’s report contains four chapters. Chapter 1 provides background information about the FY 2015 Report and FY 2016 Plan. In Chapter 2, the Commission evaluates whether the FY 2015 Report and FY 2016 Plan comply with 39 U.S.C. §§ 2803 and 2804. In Chapter 3, the Commission evaluates whether the Postal Service met each performance goal in FY 2015. See 39 U.S.C. § 3653(d). In Chapter 4, the Commission examines strategic initiatives and cross-portfolio performance indicators, which measure the performance of strategic initiatives. In Chapter 2, the Commission finds that the FY 2016 Plan complies with all section 2803 requirements except for “covering each program activity set forth in the Postal Service budget… .” See id. § 2803(a). The FY 2015 Report complies with most section 2804 requirements, but fails to “set forth the performance indicators established in the Postal Service performance plan, along with the actual program performance achieved compared with the performance goals expressed in the plan for that fiscal year” for one of the performance goals. See id. § 2804(b)(1). Also, the FY 2015 Report does not “include actual results for the three preceding fiscal years [2012, 2013, and 2014]” for two of the performance goals. See id. § 2804(c). In Chapter 3, the Commission finds that the Postal Service partially met the Sustain Controllable Income performance goal. The Postal Service did not meet the Deliver High-Quality Services, Provide Excellent Customer Experiences, and Ensure a Safe Workplace and Engaged Workforce performance goals. The Commission provides recommendations for each performance goal to help the Postal Service meet the goal and better assess its performance in future years.

Analysis of FY 2015 Performance Report Executive Summary And FY 2014 Performance Plan
- 2 -
In Chapter 4, the Commission reiterates that strategic initiatives are properly considered in conjunction with annual performance plans and annual performance reports. It also recommends that each strategic initiative have a unique performance measure that only measures performance for that strategic initiative.

Analysis of FY 2015 Performance Report Introduction and FY 2016 Performance Plan
- 3 -
CHAPTER 1: INTRODUCTION A. Background
The Postal Service is required by title 39 of the United States Code to submit to the Commission an annual performance report for the previous fiscal year and an annual performance plan for the current fiscal year. 39 U.S.C. §§ 2803, 2804, and 3652(g). The Postal Service included its FY 2015 Report and FY 2016 Plan in its 2015 Annual Report to Congress.1 The FY 2015 Report discusses the Postal Service’s progress in meeting its performance goals for FY 2015. A performance goal is “a target level of performance expressed as a tangible, measurable objective, against which actual achievement shall be compared… .” 39 U.S.C. § 2801(3). In its FY 2015 Report, the Postal Service identifies four performance goals for FY 2015:
Deliver High-Quality Services
Provide Excellent Customer Experiences
Ensure a Safe Workplace and Engaged Workforce
Sustain Controllable Income
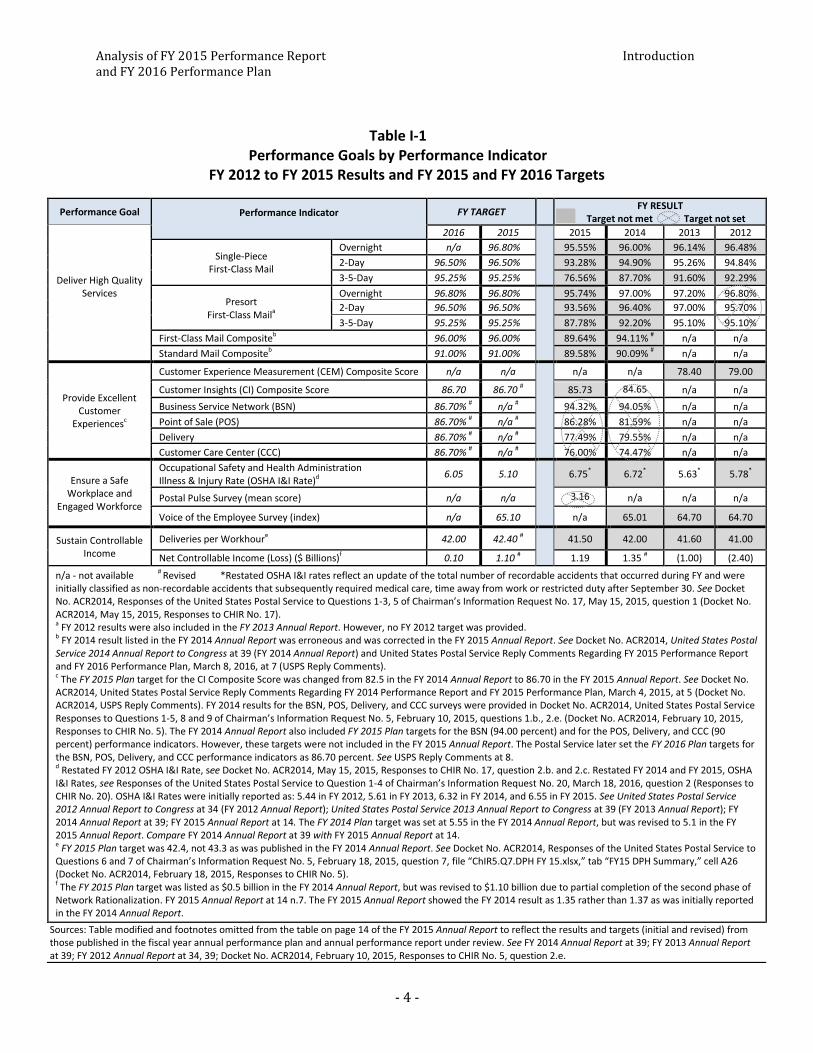
Each FY 2015 performance goal had at least one performance indicator used to measure output or outcome. See id. § 2801(4). For example, the performance indicators for Deliver High-Quality Services measure the percent of mail delivered on-time. Table I-1 lists the four performance goals, their corresponding performance indicators, results from FY 2012 to FY 2015, and targets for FY 2015 and FY 2016. Table I-2 shows a complete list of the corresponding performance indicator targets from FY 2012 to FY 2016. The FY 2016 Plan has the same four performance goals for FY 2016. The Postal Service will use almost all of the same performance indicators to assess FY 2016 progress toward each goal in the FY 2016 annual performance report (FY 2016 Report).2
1 United States Postal Service 2015 Annual Report to Congress at 11-28 (FY 2015 Annual Report); see Library Reference USPS–FY15–17, December 29, 2015. This Analysis cites to pages from the FY 2015 Annual Report when referring to the FY 2015 Report and FY 2016 Plan.
2 The Postal Service will discontinue Single-Piece First-Class Mail (Overnight) and will replace the Voice of the Employee (VOE) survey score with the Postal Pulse survey score. FY 2015 Annual Report at 14 n.1, 18.
Analysis of FY 2015 Performance Report Introduction and FY 2016 Performance Plan
- 4 -
Table I-1 Performance Goals by Performance Indicator
FY 2012 to FY 2015 Results and FY 2015 and FY 2016 Targets
Performance Goal Performance Indicator
FY TARGET FY RESULT
Target not met Target not set
Deliver High Quality Services
2016 2015
2015 2014 2013 2012
Single-Piece First-Class Mail
Overnight n/a 96.80% 95.55% 96.00% 96.14% 96.48%
2-Day 96.50% 96.50% 93.28% 94.90% 95.26% 94.84%
3-5-Day 95.25% 95.25% 76.56% 87.70% 91.60% 92.29%
Presort First-Class Maila
Overnight 96.80% 96.80%
95.74% 97.00% 97.20% 96.80%
2-Day 96.50% 96.50% 93.56% 96.40% 97.00% 95.70%
3-5-Day 95.25% 95.25% 87.78% 92.20% 95.10% 95.10%
First-Class Mail Compositeb 96.00% 96.00% 89.64% 94.11% # n/a n/a
Standard Mail Compositeb 91.00% 91.00% 89.58% 90.09% # n/a n/a
Provide Excellent Customer
Experiencesc
Customer Experience Measurement (CEM) Composite Score n/a n/a
n/a n/a 78.40 79.00
Customer Insights (CI) Composite Score 86.70 86.70 # 85.73 84.65 n/a n/a
Business Service Network (BSN) 86.70% # n/a # 94.32% 94.05% n/a n/a
Point of Sale (POS) 86.70% # n/a # 86.28% 81.59% n/a n/a
Delivery 86.70% # n/a # 77.49% 79.55% n/a n/a
Customer Care Center (CCC) 86.70% # n/a # 76.00% 74.47% n/a n/a
Ensure a Safe Workplace and
Engaged Workforce
Occupational Safety and Health Administration Illness & Injury Rate (OSHA I&I Rate)d
6.05 5.10
6.75* 6.72* 5.63* 5.78*
Postal Pulse Survey (mean score) n/a n/a 3.16 n/a n/a n/a
Voice of the Employee Survey (index) n/a 65.10 n/a 65.01 64.70 64.70
Sustain Controllable Income
Deliveries per Workhoure 42.00 42.40 #
41.50 42.00 41.60 41.00
Net Controllable Income (Loss) ($ Billions)f 0.10 1.10 # 1.19 1.35 # (1.00) (2.40)
n/a - not available # Revised *Restated OSHA I&I rates reflect an update of the total number of recordable accidents that occurred during FY and were initially classified as non-recordable accidents that subsequently required medical care, time away from work or restricted duty after September 30. See Docket No. ACR2014, Responses of the United States Postal Service to Questions 1-3, 5 of Chairman’s Information Request No. 17, May 15, 2015, question 1 (Docket No. ACR2014, May 15, 2015, Responses to CHIR No. 17). a FY 2012 results were also included in the FY 2013 Annual Report. However, no FY 2012 target was provided. b FY 2014 result listed in the FY 2014 Annual Report was erroneous and was corrected in the FY 2015 Annual Report. See Docket No. ACR2014, United States Postal Service 2014 Annual Report to Congress at 39 (FY 2014 Annual Report) and United States Postal Service Reply Comments Regarding FY 2015 Performance Report and FY 2016 Performance Plan, March 8, 2016, at 7 (USPS Reply Comments). c The FY 2015 Plan target for the CI Composite Score was changed from 82.5 in the FY 2014 Annual Report to 86.70 in the FY 2015 Annual Report. See Docket No. ACR2014, United States Postal Service Reply Comments Regarding FY 2014 Performance Report and FY 2015 Performance Plan, March 4, 2015, at 5 (Docket No. ACR2014, USPS Reply Comments). FY 2014 results for the BSN, POS, Delivery, and CCC surveys were provided in Docket No. ACR2014, United States Postal Service Responses to Questions 1-5, 8 and 9 of Chairman’s Information Request No. 5, February 10, 2015, questions 1.b., 2.e. (Docket No. ACR2014, February 10, 2015, Responses to CHIR No. 5). The FY 2014 Annual Report also included FY 2015 Plan targets for the BSN (94.00 percent) and for the POS, Delivery, and CCC (90 percent) performance indicators. However, these targets were not included in the FY 2015 Annual Report. The Postal Service later set the FY 2016 Plan targets for the BSN, POS, Delivery, and CCC performance indicators as 86.70 percent. See USPS Reply Comments at 8. d Restated FY 2012 OSHA I&I Rate, see Docket No. ACR2014, May 15, 2015, Responses to CHIR No. 17, question 2.b. and 2.c. Restated FY 2014 and FY 2015, OSHA I&I Rates, see Responses of the United States Postal Service to Question 1-4 of Chairman’s Information Request No. 20, March 18, 2016, question 2 (Responses to CHIR No. 20). OSHA I&I Rates were initially reported as: 5.44 in FY 2012, 5.61 in FY 2013, 6.32 in FY 2014, and 6.55 in FY 2015. See United States Postal Service 2012 Annual Report to Congress at 34 (FY 2012 Annual Report); United States Postal Service 2013 Annual Report to Congress at 39 (FY 2013 Annual Report); FY 2014 Annual Report at 39; FY 2015 Annual Report at 14. The FY 2014 Plan target was set at 5.55 in the FY 2014 Annual Report, but was revised to 5.1 in the FY 2015 Annual Report. Compare FY 2014 Annual Report at 39 with FY 2015 Annual Report at 14. e FY 2015 Plan target was 42.4, not 43.3 as was published in the FY 2014 Annual Report. See Docket No. ACR2014, Responses of the United States Postal Service to Questions 6 and 7 of Chairman’s Information Request No. 5, February 18, 2015, question 7, file “ChIR5.Q7.DPH FY 15.xlsx,” tab “FY15 DPH Summary,” cell A26 (Docket No. ACR2014, February 18, 2015, Responses to CHIR No. 5). f The FY 2015 Plan target was listed as $0.5 billion in the FY 2014 Annual Report, but was revised to $1.10 billion due to partial completion of the second phase of Network Rationalization. FY 2015 Annual Report at 14 n.7. The FY 2015 Annual Report showed the FY 2014 result as 1.35 rather than 1.37 as was initially reported in the FY 2014 Annual Report.
Sources: Table modified and footnotes omitted from the table on page 14 of the FY 2015 Annual Report to reflect the results and targets (initial and revised) from those published in the fiscal year annual performance plan and annual performance report under review. See FY 2014 Annual Report at 39; FY 2013 Annual Report at 39; FY 2012 Annual Report at 34, 39; Docket No. ACR2014, February 10, 2015, Responses to CHIR No. 5, question 2.e.

Analysis of FY 2015 Performance Report Introduction and FY 2016 Performance Plan
- 5 -
Table I-2
Performance Indicator Targets, FY 2012-FY 2016
Performance Goal Performance Indicator
FY TARGET
Deliver High Quality Services
2016 2015 2014 2013 2012
Single-Piece First-Class Mail
Overnight n/a 96.80% 96.80% 96.70% 96.65%
2-Day 96.50% 96.50% 96.50% 95.10% 94.15%
3-5-Day 95.25% 95.25% 95.25% 95.00% 92.85%
Presort First-Class Mail
Overnight 96.80% 96.80% 96.80% 96.70% n/a
2-Day 96.50% 96.50% 96.50% 95.10% n/a
3-5-Day 95.25% 95.25% 95.25% 95.00% n/a
First-Class Mail Composite 96.00% 96.00% 96.00% n/a n/a
Standard Mail Composite 91.00% 91.00% 91.00% n/a n/a
Provide Excellent Customer
Experiencesa
CEM Composite Score n/a n/a 82.50 82.50 82.00
CI Composite Score 86.70 86.70 # n/a n/a n/a
Business Service Network 86.70% # n/a
# n/a n/a n/a
Point of Sale 86.70% # n/a
# n/a n/a n/a
Delivery 86.70% # n/a
# n/a n/a n/a
Customer Care Center 86.70% # n/a
# n/a n/a n/a
Ensure a Safe Workplace and
Engaged Workforce
OSHA Illness & Injury Rateb 6.05 5.10 5.55 5.72
# 5.72
#
Postal Pulse Survey (mean score) n/a n/a n/a n/a n/a
Voice of the Employee Survey (index)c n/a 65.10 65.10 64.90
# 64.90
#
Sustain Controllable Income
Deliveries per Workhourd 42.00 42.40
# 42.90
# 42.70
# 42.20
Net Controllable Income (Loss) ($ Billions)e
($Billions)e
e
0.10 1.10 # 0.90
# (2.00)
# (3.00)
n/a - not available # Revised a The FY 2015 Plan target for the CI Composite Score was changed from 82.5 in the FY 2014 Annual Report to 86.70 in the FY 2015 Annual Report. See Docket No. ACR2014, USPS Reply Comments at 5. The FY 2014 Annual Report also included a FY 2015 Plan target for the BSN (94.00 percent) and for the POS, Delivery, and CCC (90 percent) composite components. However, the FY 2015 Annual Report listed “N/A” in the FY 2015 Target column for the composite components: BSN, POS, Delivery, and CCC. The Postal Service later identified FY 2016 Plan targets for the composite components and set each of the composite components’ targets as 86.70 percent. See USPS Reply Comments at 8. b The FY 2012 Plan target was listed as 5.57 in the FY 2011 Annual Report. See Docket No. ACR2011, United States Postal Service 2011 Annual Report to Congress and Comprehensive Statement on Postal Operations at 33 (FY 2011 Annual Report). In the FY 2012 Annual Report, the FY 2012 target was listed as 5.72. The FY 2013 Plan target was listed as “1% below SPLY” in the FY 2012 Annual Report. In the FY 2013 Annual Report, the FY 2013 target was listed as 5.72. The Postal Service confirmed that the FY 2012 target was 5.72 and was erroneously listed as 5.57 in the FY 2014 Annual Report. See Docket No. ACR2014, Responses to CHIR No. 17, May 15, 2015, question 2.a. The FY 2014 target is consistent with the FY 2013 and FY 2014 Annual Reports. c The FY 2012 Plan and FY 2013 Plan targets were listed as “TBD” in the FY 2011 and FY 2012 Annual Reports. The targets were listed as 64.90 in the FY 2012 and FY 2013 Annual Reports. d The FY 2013 Plan target was listed as 42.90 in the FY 2012 Annual Report. In the FY 2013 Annual Report, the FY 2013 target was changed to 42.70. The FY 2014 Plan target was listed as 43.30 in the FY 2013 Annual Report. In the FY 2014 Annual Report, the FY 2014 target was changed to 42.90 due to the postponement of the second phase of Network Rationalization. FY 2014 Annual Report at 39 n.5. The FY 2015 Plan target was 42.4, not 43.3 as was published in the FY 2014 Annual Report. See Docket No. ACR2014, Responses to CHIR No. 5, February 18, 2015, question 7, file “ChIR5.Q7.DPH FY 15.xlsx,” tab “FY15 DPH Summary,” cell A26. e The FY 2013 Plan target was listed as ($2.1) billion in the FY 2012 Annual Report. In the FY 2013 Annual Report, the FY 2013 target was changed to ($2.0) billion. The FY 2014 Plan target was listed as $1.1 billion in the FY 2013 Annual Report. In the FY 2014 Annual Report, the FY 2014 target was changed to $0.9 billion due to the postponement of the second phase of Network Rationalization. FY 2014 Annual Report at 39 n.5. The FY 2015 Plan target was listed as $0.5 billion in the FY 2014 Annual Report and was changed to $1.10 billion due to partial completion of the second phase of Network Rationalization. FY 2015 Annual Report at 14 n.7. Sources: Table modified and footnotes omitted from the table on page 14 of the FY 2015 Annual Report to reflect the targets (initial and revised) from those published in the fiscal year annual performance plan and annual performance report under review. See FY 2014 Annual Report at 39; FY 2013 Annual Report at 39; FY 2012 Annual Report at 34, 39; Docket No. ACR2014, February 10, 2015, Responses to CHIR No. 5, question 2.e.
Analysis of FY 2015 Performance Report Introduction and FY 2016 Performance Plan
- 6 -
Each year, the Commission must evaluate whether the Postal Service met the performance goals established in the annual performance plan and annual performance report. 39 U.S.C. § 3653(d). It considers the Postal Service to have met a performance goal if results of each performance indicator for that goal meet or exceed targets established in the applicable performance plan. The Commission may also provide recommendations to the Postal Service related to protecting or promoting public policy objectives in title 39. Id.
B. The FY 2015 Report and FY 2016 Plan Prior to Docket No. ACR2013, the Commission analyzed annual performance reports and performance plans as part of the Annual Compliance Determination (ACD). The Commission later determined that its obligations under 39 U.S.C. § 3653(d) are distinguishable from its ACD obligations under 39 U.S.C. § 3653(b). In Docket Nos. ACR2013 and ACR2014, the Commission issued separate reports analyzing the Postal Service’s annual performance reports and annual performance plans.3 By issuing separate reports, the Commission provided more in-depth analysis of the Postal Service’s progress toward meeting its performance goals and plans to improve performance in future years. As it did in Docket Nos. ACR2013 and ACR2014, the Commission issues its analysis of the FY 2015 Report and FY 2016 Plan separately from the FY 2015 ACD.4 In conducting this year’s review, the Commission designated a Public Representative and invited comments on whether the Postal Service met its performance goals and satisfied applicable statutory and regulatory provisions.5 It also sought input on public policy recommendations, observations on strategic initiatives, and other relevant matters. Order No. 3027 at 2-3. Several chairman’s information requests (CHIRs) were issued seeking clarification of the FY 2015 Report and FY 2016 Plan.6 The Postal Service filed responses to all information requests.7 The Public Representative submitted comments8 to which the Postal Service provided reply comments.9 3 Docket No. ACR2013, Postal Regulatory Commission, Review of Postal Service FY 2013 Performance Report and FY 2014 Performance Plan, July 7, 2014 (FY 2013 Review); Docket No. ACR2014, Postal Regulatory Commission, Analysis of the Postal Service’s FY 2014 Program Performance Report and FY 2015 Performance Plan, July 7, 2015 (FY 2014 Analysis).
4 Annual Compliance Determination, March 28, 2016 (FY 2015 ACD).
5 Notice and Order Regarding the Postal Service FY 2015 Annual Performance Report and FY 2016 Annual Performance Plan, January 14, 2016 (Order No. 3027).
6 Chairman’s Information Request No. 3, January 14, 2016 (CHIR No. 3); Chairman’s Information Request No. 5, January 21, 2016 (CHIR No. 5); Chairman’s Information Request No. 9, February 4, 2016 (CHIR No. 9); Chairman’s Information Request No. 13, February 11, 2016 (CHIR No. 13); Chairman’s Information Request No. 15, February 18, 2016 (CHIR No. 15); Chairman’s Information Request No. 17, February 24, 2016 (CHIR No. 17); Chairman’s Information Request No. 18, March 3, 2016 (CHIR No. 18); Chairman’s Information Request No. 20, March 11, 2016 (CHIR No. 20).
7 Several CHIR responses were accompanied by motions requesting late acceptance. These motions were granted in the FY 2015 ACD. FY 2015 ACD at 8 n.13.
8 Public Representative Initial Comments on the FY 2015 Performance Report and FY 2016 Performance Plan, February 26, 2016 (PR Comments).
9 USPS Reply Comments. The Postal Service also filed a motion for late acceptance of its reply comments. Motion of the United States Postal Service for Late Acceptance of Reply Comments to Public Representative Initial Comments on the FY 2015 Performance Report and FY 2016 Performance Plan, March 8, 2016. The motion is granted.
Analysis of FY 2015 Performance Report Introduction and FY 2016 Performance Plan
- 7 -
The Commission analyzes the FY 2015 Report and FY 2016 Plan in the following chapters:
Chapter 2 analyzes the FY 2015 Report and FY 2016 Plan for compliance with legal requirements.
Chapter 3 evaluates whether the Postal Service met its four performance goals in FY 2015.
Chapter 4 discusses the role of strategic initiatives in annual performance plans and annual performance reports.
The Commission also provides an appendix listing Commission findings and recommendations contained in this report.

Analysis of FY 2015 Performance Report Compliance with Legal Requirements and FY 2016 Performance Plan
- 8 -
CHAPTER 2: COMPLIANCE WITH LEGAL REQUIREMENTS
A. Legal Requirements The FY 2015 Report and FY 2016 Plan must meet the requirements of 39 U.S.C. §§ 2803 and 2804.10 Section 2803 establishes requirements for the Postal Service’s annual performance plans. The Postal Service must cover “each program activity set forth in the Postal Service budget…”11 and must:
Establish objective, quantifiable, and measurable performance goals that define a program activity’s performance level
Briefly describe the operational processes, skills and technology, and the human, capital, information, or other resources needed to meet the performance goals
Establish performance indicators to measure or assess each program activity’s relevant outputs, service levels, and outcomes
Provide a basis for comparing actual program results with established performance goals
Describe the means to be used to verify and validate measured values
39 U.S.C. § 2803(a). The Postal Service may use an alternative form if it determines that it is not feasible to express the performance goals for a particular program activity in an objective, quantifiable, and measurable form.12 Section 2804 sets forth several requirements for the Postal Service’s annual performance reports. First, it requires the Postal Service to prepare annual performance reports that
10 Chapter 28 of title 39, which includes sections 2803 and 2804, was added by the Government Performance and Results Act (GPRA) of 1993, Pub. L. 103-62, 107 Stat. 285 (1993). Sections 2803 and 2804 were not affected by the GPRA Modernization Act of 2010, which does not apply to the Postal Service. See Pub. L. 111-352, 124 Stat. 3866 (2011).
11 A “program activity” is “a specific activity related to the mission of the Postal Service[.]” 39 U.S.C. § 2801(5). The Postal Service’s mission is “to provide a reliable, efficient, trusted and affordable universal delivery service that connects people and helps businesses grow.” FY 2015 Annual Report at 10.
12 Id. § 2803(b). The alternative form must include separate descriptive statements of a minimally effective program and a successful program. Id. § 2803(b)(1). The alternative form must also “state why it is infeasible or impractical to express a performance goal in any form for the program activity.” Id. § 2803(b)(2).

Analysis of FY 2015 Performance Report Compliance with Legal Requirements and FY 2016 Performance Plan
- 9 -
review whether it has met the performance goals previously established by the performance plan for that fiscal year. Id. § 2804(d)(1). Second, the Postal Service must “set forth the performance indicators established in the Postal Service performance plan, along with the actual program performance achieved compared with the performance goals expressed in the plan for that fiscal year.” Id. § 2804(b)(1). Third, the Postal Service must include “actual results for the three preceding fiscal years.” Id. § 2804(c). Fourth, the Postal Service must evaluate the performance plan for the current fiscal year (in this case, the FY 2016 Plan) relative to the performance achieved toward those goals in the year covered by the performance report (in this case, the FY 2015 Report). Id. § 2804(d)(2). If the Postal Service does not meet a performance goal, it must explain why the goal was not met and its plans and schedules for achieving the performance goal.13 The Postal Service must also include summary findings of program evaluations completed during the fiscal year covered by the report. Id. § 2804(d)(4).
B. Comments FY 2016 Plan. The Public Representative concludes that the FY 2016 Plan satisfies the requirements of 39 U.S.C. § 2803. PR Comments at 17. However, she notes that the Postal Service did not set a measurable FY 2015 target for the Postal Pulse survey score. Id. For this reason, she argues that the Ensure a Safe Workplace and Engaged Workforce performance goal does not meet the requirements of section 2803(a)(2) because it is not expressed in an “objective, quantifiable, and measurable form … .” Id. Similarly, she contends that the Postal Pulse survey score performance indicator does not measure or assess “relevant outputs, service levels, and outcomes of each program activity[.]” Id.; see 39 U.S.C. § 2803(a)(4). Despite her concerns about compliance with 39 U.S.C. § 2803(a), the Public Representative contends that the Postal Pulse survey score performance indicator qualifies for an exception under 39 U.S.C. § 2803(b), which permits the Postal Service to use an “alternative form” if it is not feasible to express a performance goal in an “objective, quantifiable, and measurable form[.]” PR Comments at 17. She suggests that to ensure compliance and better transparency, the Postal Service should provide “separate descriptive statements” that meet the requirements of section 2803(b). Id. She also points out that the FY 2016 Plan does not include performance indicators for each program activity in its budget as required by section 2803(a). Id. at 18. She notes that the Postal Service provided this information in a response to a CHIR and suggests that the Postal Service include the required information in future annual performance plans. Id.
13 Id. § 2804(d)(3)(A) and (B). If the performance goal is impractical or infeasible, the Postal Service must explain why and recommend further action. Id. § 2804(d)(3)(C).

Analysis of FY 2015 Performance Report Compliance with Legal Requirements and FY 2016 Performance Plan
- 10 -
In its reply comments, the Postal Service states that the Commission is responsible for evaluating whether the Postal Service has sufficiently complied with the provisions of 39 U.S.C. §§ 2803 and 2804. USPS Reply Comments at 1. However, it contends that the Commission’s authority is “limited as merely evaluative” and concerns the content and presentation of annual performance plans and annual performance reports. Id. In response to the Public Representative’s comments concerning section 2803, the Postal Service argues that the FY 2016 Plan, as filed, meets the broad requirements of section 2803.14 The Postal Service asserts that in response to a CHIR, it explained how the FY 2016 Plan complies with section 2803 using an alternative definition of “program activity” found in GPRA, although it maintains that additional analysis was unnecessary for compliance with section 2803.15 FY 2015 Report. The Public Representative asserts that the FY 2015 Report does not meet all requirements of 39 U.S.C. § 2804. PR Comments at 18. First, she argues that for several performance goals, the FY 2015 Report does not compare FY 2016 targets with FY 2015 results as required by 39 U.S.C. § 2804(d)(2). Id. For the Provide Excellent Customer Experiences and Ensure a Safe Workplace and Engaged Workforce performance goals, the Public Representative observes that the Postal Service provided FY 2015 results but did not set FY 2016 targets for some performance indicators. Id. at 18-19. For the Deliver High-Quality Services performance goal, the Public Representative asserts that the Postal Service did not compare the FY 2016 target with the FY 2015 result for the Single-Piece First-Class Mail (Overnight) performance indicator due to changes to service standards in FY 2015. Id. at 19. Second, she argues that the FY 2015 Report does not “include actual results for the three preceding fiscal years” as required by 39 U.S.C. § 2804(c) for some performance indicators. Id. She observes that the Postal Service recently replaced some performance indicators for the Provide Excellent Customer Experiences and Ensure a Safe Workplace and Engaged Workforce performance goals. Id. She contends the FY 2015 Report does not include comparable results for these performance indicators for the three preceding fiscal years. Id. Third, she observes that the FY 2015 Report does not meet the requirements of 39 U.S.C. § 2804(d)(3), which applies to performance goals the Postal Service did not meet. Id. In those cases, section 2804(d)(3) requires the Postal Service to explain why it did not meet the goal and describe its plans and schedules for achieving the goal. The Public Representative contends that some of the Postal Service’s explanations for not meeting the
14 Id. at 13-14 (citing Responses of the United States Postal Service to Questions 1 and 2 of Chairman’s Information Request No. 5, February 3, 2016, question 1 (Responses to CHIR No. 5)).
15 USPS Reply Comments at 14; see Responses to CHIR No. 5, question 1.
Analysis of FY 2015 Performance Report Compliance with Legal Requirements and FY 2016 Performance Plan
- 11 -
goals were insufficient, and the Postal Service did not provide actual schedules for achieving the goals. Id. at 19-20. In response to the Public Representative’s contention that the FY 2015 Report does not comply with 39 U.S.C. § 2804(d)(2), the Postal Service maintains that the FY 2015 Annual Report does analyze FY 2015 results and FY 2016 targets. USPS Reply Comments at 6. It contends that the issue with the Single-Piece First-Class Mail (Overnight) performance indicator relates to data sufficiency rather than statutory compliance. Id. The Postal Service maintains that the FY 2015 Report complies with section 2804(d)(2) because it provides Congress and the public with enough information to evaluate whether the Postal Service is meeting its performance goals and making strides toward improvement. Id. For the Provide Excellent Customer Experiences performance goal, the Postal Service asserts that it has complied with section 2804(d)(2) by administering the Customer Insights (CI) surveys and implementing more efficient means of tracking data related to customer experiences. Id. at 9. It states that the “only accurate means of comparing...results would be to administer both [surveys] simultaneously.” Id. The Postal Service states this “would be an overly burdensome and inefficient weight on limited Postal Service resources.” Id. The Postal Service explains that it did not set a FY 2016 target for the Postal Pulse survey score because it has not adequately established the baseline performance for this performance indicator. Id. at 11. In response to the Public Representative’s contention that the FY 2015 Report does not comply with 39 U.S.C. § 2804(c), the Postal Service contends that “actual results” for the three preceding fiscal years under section 2804(c) do not need to be comparable across those fiscal years.16 It asserts that it adopted the new measurement systems to improve progress toward its performance goals. USPS Reply Comments at 9-10.
C. Commission Analysis Annual performance reports and annual performance plans are included as part of the Postal Service’s annual report to Congress (Annual Report to Congress). In FY 2015, the Postal Service includes headings distinguishing the FY 2015 Report from the FY 2016 Plan. See FY 2015 Annual Report at 15-22. These distinctions increase visibility for interested members of the public and facilitate the Commission’s evaluation of the FY 2016 Plan and FY 2015 Report individually for compliance with 39 U.S.C. §§ 2803 and 2804, respectively. The Commission finds the increased visibility of the FY 2015 Report and FY 2016 Plan an improvement compared to previous annual performance reports and annual performance
16 Id. at 9. The Postal Service makes similar arguments in the FY 2015 Annual Compliance Report. United States Postal Service Annual Compliance Report, December 29, 2015, at 60-62 (FY 2015 ACR).
Analysis of FY 2015 Performance Report Compliance with Legal Requirements and FY 2016 Performance Plan
- 12 -
plans. In the analysis that follows, the Commission finds that the FY 2015 Report and FY 2016 Plan meet most, but not all, of the requirements of 39 U.S.C. §§ 2803 and 2804.
1. FY 2016 Plan The Commission finds that the FY 2016 Plan meets almost all requirements of 39 U.S.C. § 2803. First, the FY 2016 Plan “establish[es] performance goals to define the level of performance to be achieved by a program activity” by setting targets for each performance indicator. See 39 U.S.C. § 2803(a)(1). Second, the FY 2016 Plan expresses each performance goal “in an objective, quantifiable, and measurable form” as the quantitative targets can be compared with the objectively measured results. See id. § 2803(a)(2). Although the Postal Service did not set a measurable FY 2016 target for the Postal Pulse survey score in response to a CHIR, the Postal Service provided FY 2016 targets for the Postal Pulse survey response rate and number of participating business units.17 These targets express the Ensure a Safe Workplace and Engaged Workforce performance goal “in an objective, quantifiable, and measurable form… .” Although the Postal Service did not provide this information in the FY 2016 Plan, the Commission finds that the information provided in response to the CHIR is sufficient to meet the requirements of 39 U.S.C. § 2803(a)(2). In future years, the Postal Service should include this information in annual performance plans. Third, the FY 2016 Plan “briefly describe[s] the operational processes, skills and technology, and the human, capital, information, or other resources required to meet the performance goals[.]” See 39 U.S.C. § 2803(a)(3). For example, to meet the Ensure a Safe Workplace and Engaged Workforce goal in FY 2016, the Postal Service states it will focus on illness and injury prevention and take a more proactive approach to employee safety. FY 2015 Annual Report at 18. Fourth, the FY 2016 Plan establishes one or more performance indicators for each performance goal “to be used in measuring or assessing the relevant outputs, service levels, and outcomes.”18 For example, the Provide Excellent Customer Experiences performance goal uses five performance indicators to measure customer experience and satisfaction across the most frequently used customer contact channels. Fifth, the FY 2016 Plan sets forth performance indicators that provide a basis for comparing FY 2016 results with the targets established in the FY 2016 Plan. See id. § 2803(a)(5). Sixth, the FY 2016 Plan describes how the Postal Service will “verify and validate” the results for each performance indicator based on objective measurement systems. See id. § 2803(a)(6).
17 Responses of the United States Postal Service to Questions 13-15 and 19 of Chairman’s Information Request No. 13, February 26, 2016, question 15 (February 26, 2016, Responses to CHIR No. 13).
18 See 39 U.S.C. § 2803(a)(4), which requires performance indicators for “each program activity.” The Commission discusses this issue on pages 13-14, infra.

Analysis of FY 2015 Performance Report Compliance with Legal Requirements and FY 2016 Performance Plan
- 13 -
For example, the Postal Service collaborates with an independent third party to objectively measure performance for the Single-Piece First-Class Mail ( 2-Day and 3-5-Day) performance indicators using the External First-Class Mail sampling system. See FY 2015 Annual Report at 15. Although the Postal Service contends that the Commission does not have authority to interpret 39 U.S.C. § 2803, it does not provide support for this contention. See Responses to CHIR No. 5, question 1. As the Commission discussed in detail in the FY 2014 Analysis, the Commission has the authority to evaluate the compliance of annual performance plans and annual performance reports with 39 U.S.C. §§ 2803 and 2804. FY 2014 Analysis at 8-9. In order for the Commission to produce “the meaningful and reliable performance evaluation envisioned by 39 U.S.C. § 3653(d)[,]” the Commission must assess whether the Postal Service’s annual performance plan complies with sections 2803 and 2804, including section 2803(a). See id. at 9. This evaluation includes interpreting what is required by each provision in order to assess the Postal Service’s compliance. As in previous years, the FY 2016 Plan does not “cover[] each program activity set forth in the Postal Service budget…” as required by 39 U.S.C. § 2803(a). See 39 U.S.C. § 2803(a). In its FY 2010 ACD, the Commission determined that the “Postal Service budget” means its operating budget that is part of the Postal Service’s Integrated Financial Plan.19 Thus, the FY 2016 Plan must cover each program activity in the FY 2016 Integrated Financial Plan. In both its FY 2013 Review and FY 2014 Analysis, the Commission found that the FY 2014 and FY 2015 Plans did not meet the requirements of section 2803(a) for this reason. FY 2013 Review at 40; FY 2014 Analysis at 10-11. The FY 2016 Plan does not explain how it covers each program activity in the FY 2016 Integrated Financial Plan. CHIR No. 5 requested this information. See CHIR No. 5, question 1. In response, the Postal Service asserts that it “is the only agency with authority to interpret [39 U.S.C. § 2803].” Responses to CHIR No. 5, question 1. It contends that the FY 2016 Plan, as filed, meets the requirements of section 2803(a). Id. Under an alternative argument, the Postal Service asserts that the FY 2016 Plan meets section 2803(a) requirements using the definition of program activities that applies to other federal agencies, which are projects and activities listed in the annual United States budget. Id. The Postal Service lists its program activities from the FY 2016 United States Budget and explains how they relate to the performance goals.20
19 Docket No. ACR2010, Annual Compliance Determination, March 29, 2011, at 50 (FY 2010 ACD); see United States Postal Service, Fiscal Year 2016 Integrated Financial Plan, November 20, 2015 (FY 2016 Integrated Financial Plan).
20 Id. The program activities are postal field operations, transportation, building occupancy, supplies and services, research and development, administrative and area operations, interest, service wide expenses, capital investment, and change in resources on order and inventory. Id.

Analysis of FY 2015 Performance Report Compliance with Legal Requirements and FY 2016 Performance Plan
- 14 -
Compared to past years, the Postal Service provides a more thorough explanation in its response to CHIR No. 5 to support its assertion that the FY 2016 Plan complies with 39 U.S.C. § 2803(a). The explanation takes steps to better link the Postal Service’s program activities to annual performance plans, as well as to the United States Budget. However, the Commission has consistently found that “Postal Service budget” means its operating budget that is part of the Postal Service’s Integrated Financial Plan rather than the United States Budget. To comply with 39 U.S.C. § 2803(a), the Postal Service should have explained how the FY 2016 Plan covers each of the program activities in the FY 2016 Integrated Financial Plan.21 The Commission finds that the FY 2016 Plan does not “cover[] each program activity set forth in the Postal Service budget” as required by 39 U.S.C. § 2803(a) and is not compliant in that respect. To ensure full compliance next year, the FY 2017 annual performance plan (FY 2017 Plan) must identify all program activities in the FY 2017 Integrated Financial Plan and explain how the FY 2017 Plan covers each one.
2. FY 2015 Report The Commission finds that the FY 2015 Report meets most, but not all, of the requirements of 39 U.S.C. § 2804. The FY 2015 Report reviews the Postal Service’s success in achieving its performance goals during FY 2015 by stating whether the Postal Service met targets for each performance goal. See 39 U.S.C. § 2804(d)(1). The FY 2015 Report provides summary findings of program evaluations completed during FY 2015. Id. § 2804(d)(4). “Program evaluations” are “assessment[s], through objective measurement and systematic analysis, of the manner and extent to which Postal Service programs achieve intended objectives.” Id. § 2801(6). For example, in the FY 2015 Report, the Postal Service states it “provided additional training for our retail employees in key markets and asked customers for their feedback by circling the Web address on their receipts.” FY 2015 Annual Report at 16. The Postal Service asserts that these programs were successful because they increased the response rate for the Point of Sale survey by approximately 500 percent. Id. If a performance goal has not been met, annual performance reports must explain why the Postal Service did not meet the goal and describe the plans and schedules for achieving the goal. 39 U.S.C. § 2804(d)(3). The Public Representative asserts that the FY 2015 Report does not comply with this provision because some of the Postal Service’s explanations for not meeting the goals were insufficient, and the Postal Service did not provide actual schedules for achieving the goals. PR Comments at 19-20. The FY 2015 Report does explain why performance goals were not met and what the Postal Service will do to achieve the goals in
21 The FY 2016 Integrated Financial Plan lists the following program activities: volumes and revenues for First-Class Mail, Standard Mail, Shipping and Packages, International mail, Periodicals, and other products; compensation and benefits; transportation; depreciation; supplies and services; rent, utilities, and other; retiree health benefits prefunding; Federal Employees Retirement System unfunded liability amortization, and non-cash workers’ compensation adjustments. FY 2016 Integrated Financial Plan at 3-5.

Analysis of FY 2015 Performance Report Compliance with Legal Requirements and FY 2016 Performance Plan
- 15 -
the future. See FY 2015 Annual Report at 15-22. For explanations that were insufficient, the Postal Service provided the necessary information in responses to CHIRs.22 The Postal Service does not explicitly provide “schedules for achieving the established performance goal” as required by 39 U.S.C. § 2804(d)(3)(B); however, in most cases, the Postal Service’s plans appear to apply to FY 2016. In future years, to fully comply with 39 U.S.C. § 2804(d)(3), the Postal Service should provide timelines for its plans to achieve performance goals if timelines fall outside of the fiscal year covered by the annual performance plan. Annual performance reports must “evaluate the performance plan for the current fiscal year relative to the performance achieved towards the performance goals in the fiscal year covered by the report[.]” 39 U.S.C. § 2804(d)(2). In other words, the Postal Service must evaluate the FY 2016 Plan relative to the performance achieved toward the four performance goals in FY 2015 by comparing FY 2016 targets with FY 2015 results. The Public Representative contends that the FY 2015 Report does not meet this requirement for the CI and Postal Pulse survey score performance indicators because the Postal Service did not set FY 2016 targets for these performance indicators. PR Comments at 18-19. She also states that the Deliver High-Quality Services performance goal does not meet this requirement because the Postal Service did not compare the FY 2016 target with the FY 2015 result for the Single-Piece First-Class Mail (Overnight) performance indicator. Id. at 19. In response, the Postal Service asserts that it did comply with section 2804(d)(2) and provides justifications for the information it provided in the FY 2015 Report. USPS Reply Comments at 6, 9, 11. The FY 2015 Report meets the requirements of 39 U.S.C. § 2804(d)(2). First, the Postal Service did not need to set a FY 2016 target for Single-Piece First-Class Mail (Overnight) because that performance indicator was removed in FY 2016. The FY 2015 Report sets forth FY 2016 targets and FY 2015 results for seven other performance indicators under the Deliver High-Quality Services performance goal. See FY 2015 Annual Report at 14. Second, the FY 2015 Report compares the FY 2016 target with the FY 2015 result for the CI Composite Score performance indicator. See id. The Postal Service explains that the targets for the other CI performance indicators will be the same as the target for the CI Composite Score.23 Third, the Postal Service provided FY 2016 targets and FY 2015 results for the Postal Pulse survey response rate and number of participating business units. February 26, 2016, Responses to CHIR No. 13, question 15.
22 For example, in response to CHIR No. 17, the Postal Service further explains why it did not meet OSHA’s illness and injury rate. See Responses of the United States Postal Service to Questions 1-6 of Chairman’s Information Request No. 17, March 3, 2016, question 1 (March 3, 2016, Responses to CHIR No. 17).
23 USPS Reply Comments at 8. The Commission recommends that the Postal Service also set individual targets for the Business Service Network, Point of Sale, Delivery, and Customer Care Center performance indicators. See Chapter 3, section B.3, infra.

Analysis of FY 2015 Performance Report Compliance with Legal Requirements and FY 2016 Performance Plan
- 16 -
The Postal Service compares FY 2016 targets with FY 2015 results for each performance indicator the Postal Service will use in FY 2016. For this reason, the Commission finds that the Postal Service provided the information necessary to meet the requirements of 39 U.S.C. § 2804(d)(2). In future years, the Postal Service should provide all of this information in its annual performance report. The FY 2015 Report does not meet two other requirements in 39 U.S.C. § 2804. First, it does not “set forth the performance indicators established in the Postal Service performance plan, along with the actual program performance achieved compared with the performance goals expressed in the plan for that fiscal year.” 39 U.S.C. § 2804(b)(1). Second, the FY 2015 Report does not “include actual results for the three preceding fiscal years.” Id. § 2804(c). Each statutory requirement is discussed below.
a. FY 2015 Target and Result Comparability
39 U.S.C. § 2804(b)(1) requires annual performance reports to “set forth the performance indicators established in the Postal Service performance plan, along with the actual program performance achieved compared with the performance goals expressed in the plan for that fiscal year.” Id. § 2804(b)(1). This provision requires results expressed in annual performance reports to be comparable with targets for that fiscal year. Thus, the FY 2015 Report must compare FY 2015 results for each performance indicator with FY 2015 targets. The FY 2015 Report does not comply with this requirement for the Ensure a Safe Workplace and Engaged Workforce performance goal. In FY 2014, the Postal Service stated it would replace the Voice of the Employee (VOE) survey score with the Postal Pulse survey score as the performance indicator for measuring employee engagement. FY 2014 Analysis at 39. In its FY 2014 Analysis, the Commission stated that to comply with section 2804(b)(1) in FY 2015, the Postal Service must develop a FY 2015 target using the Postal Pulse survey score to ensure that the result presented in the FY 2015 Report is comparable with the FY 2015 target. Id. However, the Postal Service set a FY 2015 target for the VOE survey score but did not set a FY 2015 target for the Postal Pulse survey score.24 Without comparable FY 2015 targets and results for the Postal Pulse survey score performance indicator, the FY 2015 Report does not comply with 39 U.S.C. § 2804(b)(1) for the Ensure a Safe Workplace and Engaged Workforce performance goal.25 To comply with 39 U.S.C. § 2804(b)(1) in FY 2016, the FY 2016 Report must express FY 2016 results that are comparable with the targets expressed in the Responses to CHIR No. 3, question 5.b. 24 See FY 2015 Annual Report at 14; Responses of the United States Postal Service to Questions 1-6 of Chairman’s Information Request No. 3, January 21, 2016, questions 5.b. and 5.c. (Responses to CHIR No. 3).
25 Chapter 3, section C.3.b., infra, explores this issue in greater detail.
Analysis of FY 2015 Performance Report Compliance with Legal Requirements and FY 2016 Performance Plan
- 17 -
b. Comparable 3-Year Results
39 U.S.C. § 2804(c) requires the FY 2015 Report to “include actual results for the three preceding fiscal years.” In its FY 2014 Analysis, the Commission found that “actual results” under section 2804(c) must also be comparable across the 3 preceding fiscal years. FY 2014 Analysis at 12. The Commission stated, “[f]or the FY 2015 Report to comply with 39 U.S.C. § 2804(c), the Postal Service must provide comparable results for each performance indicator for, at minimum, fiscal years 2012, 2013, 2014, and 2015.” Id. The Commission explained that the Postal Service can meet this requirement by providing all results using the same methodology or by explaining how results can be compared under different methodologies. Id. It noted that if the Postal Service makes any changes that affect comparability of results for any performance indicator, the Postal Service must do either of the following to ensure that the FY 2015 Report complies with section 2804(c):
Provide FY 2015 results using the old methodology, if available
Provide FY 2015 results using the new methodology and explain how results can be compared under the old and new methodologies
Id. at 12-13. The Commission also recommended that the Postal Service describe any methodology changes in its Annual Report to Congress and analyze the impact of methodology changes on results. Id. at 13. In the FY 2015 ACR, the Postal Service states that it considered the Commission’s recommendations in the FY 2014 Analysis regarding the annual performance report. FY 2015 ACR at 61. It asserts that it adopted new performance indicators for the Provide Excellent Customer Experiences and Ensure a Safe Workplace and Engaged Workforce performance goals. Id. The Postal Service represents that these new performance indicators are more modern, comprehensive systems that measure performance more fully than the previous measurement systems. Id. It contends that providing comparable results would require it to use both the old and new measurement systems during the same fiscal year, which is not an effective use of its resources.26 In addition, the Postal Service asserts that it “does not share the Commission’s interpretation of 39 U.S.C. 2804’s comparability requirement.” FY 2015 ACR at 61. The Postal Service notes that section 2804(c) does not explicitly require “actual results” to be comparable to the three preceding fiscal years. Id. at 62. It states that the Postal Service is sensitive to the Commission’s interest in meaningfully evaluating performance across fiscal years by reviewing comparable results. Id. However, the Postal Service maintains that
26 Id. The Postal Service reiterates these arguments in its reply comments. USPS Reply Comments at 9.
Analysis of FY 2015 Performance Report Compliance with Legal Requirements and FY 2016 Performance Plan
- 18 -
“postal management must also consider the most effective means of measurement with a view towards service improvement in a highly competitive environment.”27 The Commission appreciates that the Postal Service describes the methodology changes in the FY 2015 ACR and that the Postal Service continues to look toward improving its measurement systems. However, the Postal Service appears to misunderstand what the Commission found in its FY 2014 Analysis because the Commission did not require that the Postal Service use old and new measurement systems simultaneously. Rather, the Commission observed that providing the FY 2015 result using the old measurement system was one method of ensuring comparability across fiscal years. FY 2014 Analysis at 12-13. Alternatively, the Commission suggested that the Postal Service provide the FY 2015 result using the new measurement system and explain how to compare results between the old and new measurement systems. Id. The Commission explained that results must be provided on a comparable basis to enable meaningful evaluation of performance across fiscal years. Id. at 12. The Postal Service does not explain how to compare results under the old and new measurement systems across fiscal years 2012, 2013, 2014, and 2015 for performance indicators under the Provide Excellent Customer Experiences and Ensure a Safe Workplace and Engaged Workforce performance goals. See Chapter 3, sections B.3 and C.3.b. Without comparable results, the Commission finds that the FY 2015 Report does not “include actual results for the three preceding fiscal years” and thus does not comply with the requirements of 39 U.S.C. § 2804(c). Chapter 3 proposes ways to compare results across fiscal years 2012, 2013, 2014, and 2015 without using the old and new measurement systems during the same fiscal year. See Chapter 3, section B.3 (Provide Excellent Customer Experiences) and section C.3.b (Ensure a Safe Workplace and Engaged Workforce), infra. The Commission also observes that comparable results across the three preceding fiscal years would be helpful for related reports, such as the strategic plan. The strategic plan "shall be updated and revised at least every three years." 39 U.S.C. § 2802(b). Comparable results across three preceding fiscal years would provide the Postal Service with insight and additional information as it updates and revises the strategic plan. In particular, comparable data provide meaningful information that should inform “general goals and objectives” and “key factors...that could significantly affect the achievement of the general goals and objectives[.]” See id. §§ 2802(a)(2) and (5).28
27 Id. The Postal Service reiterates these arguments in its reply comments. USPS Reply Comments at 9-10.
28 The Postal Service's most recent strategic plan is dated April 16, 2013. United States Postal Service, Five-Year Business Plan, April 16, 2013; https://about.usps.com/strategic-planning/five-year-business-plan-2012-2017.pdf. The Postal Service confirmed that its strategic plan is the same as its Five-Year Business Plan. Docket No. ACR2014, United States Postal Service Responses to Questions 1-5, 12-14, 26, 27, and 31-33 of Chairman's Information Request No. 13, March 11, 2015, question 14.a. (Docket No. ACR2014, March 11, 2015, Responses to CHIR No. 13).
Analysis of FY 2015 Performance Report Analysis of Postal Service Performance and FY 2016 Performance Plan
- 19 -
CHAPTER 3: ANALYSIS OF POSTAL SERVICE PERFORMANCE The Postal Service’s four performance goals in FY 2015 were:
Deliver High-Quality Services
Provide Excellent Customer Experiences
Ensure a Safe Workplace and Engaged Workforce
Sustain Controllable Income
In this chapter the Commission evaluates whether the Postal Service met each performance goal in FY 2015 as required by 39 U.S.C. § 3653(d). The Commission considers the Postal Service to have met a performance goal if results for each performance indicator meet or exceed targets established in the applicable annual performance plan.29 The Commission finds that the Postal Service partially met the Sustain Controllable Income performance goal. The Postal Service did not meet the Deliver High-Quality Services, Provide Excellent Customer Experiences, and Ensure a Safe Workplace and Engaged Workforce performance goals. Table III-1 lists each performance goal, whether the goal was met in FY 2015, reasons provided by the Postal Service for not meeting the goal, and the Postal Service’s plans for achieving the performance goal in future years. See 39 U.S.C. § 2804(d)(3).
29 FY 2014 Analysis at 4. As discussed below, if the Postal Service revises a target after publishing it in the annual performance plan, the Commission evaluates Postal Service performance based on the revised target.

Analysis of FY 2015 Performance Report Analysis of Postal Service Performance and FY 2016 Performance Plan
- 20 -
Table III-1 FY 2015 Progress Toward Performance Goals
Performance Goal
Goal Met Postal Service’s Reasons for Not Meeting
Goal Postal Service’s FY 2016 Plans
Deliver High-Quality Services
No
Deferred completion of the second phase of the Network Rationalization Initiative; on-going growth in package mail impacted air and surface transportation networks; exceeded air transportation capacity; major changes in employee shifts due to mail processing operating window changes for the second phase of Network Rationalization; weather
Complete the second phase of Network Rationalization; rebalance air and surface transportation network; obtain additional air transportation space; continue to evolve Lean activities in processing and delivery
Provide Excellent Customer Experiences
No
Misdelivered mail and gaps in scanning processes, which led to lower customer satisfaction percentages for Delivery residential and small/medium business customers
Improve key drivers of customer satisfaction at Customer Care Centers; provide training for employees; make better use of agent quality program and technological advances in integrated voice recognition software and immediate agent coaching; develop videos, publications, service talks, and training for employees
Ensure a Safe Workplace and Engaged Workforce
No
Ensure a Safe Workplace: large number of at-risk employees; increase in motor vehicle accidents; major changes to the business such as expansion of Sunday delivery and other new delivery areas such as groceries Engaged Workforce: no reasons provided because FY 2015 target and result are not comparable
Ensure a Safe Workplace: Focus on prevention strategies and employees considered to be at higher risk for accidents; take a more proactive approach toward employee safety Engaged Workforce: Provide targeted leadership and training programs for executives, managers, and supervisors; implement communication and change management initiatives
Sustain Controllable Income
Partially
Overrun of the work hour plan; strong growth in Sunday package delivery; delay in plant consolidations; not capturing all savings from the second phase of Network Rationalization due to deferred completion; additional workhours from improving service and hiring, training, learning curve, and turnover rate of non-career workforce; arbitration award affecting Level 18 postmaster work rules
Capture work hour reductions from decreased volume as well as savings from operational initiatives; maximize non-career and Tier 2 career workforce; control non-personnel related spending and transportation usage
Sources: FY 2015 ACD at 157; FY 2015 Annual Report at 14-20; Responses of the United States Postal Service to Questions 15-26 of Chairman's Information Request No. 2, January 19, 2016, question 18.a.; Responses of the United States Postal Service to Questions 7-11 of Chairman's Information Request No. 9, February 12, 2016, questions 8.c., 9 (February 12, 2016, Responses to CHIR No. 9); March 3, 2016, Responses to CHIR No. 17, questions 1, 4; USPS Reply Comments at 13; Docket No. ACR2015, Reply Comments of the United States Postal Service, February 12, 2016, at 25, 27 n.71 (Docket No. ACR2015, February 12, 2016, USPS Reply Comments).
Analysis of FY 2015 Performance Report Analysis of Postal Service Performance and FY 2016 Performance Plan
- 21 -
In this chapter, the Commission provides recommendations for each performance goal to help the Postal Service meet the goal and better assess its performance in future years. One issue that arises for both the Provide Excellent Customer Experiences and Sustain Controllable Income goals is the Postal Service’s revision of FY 2015 targets. As discussed in sections B.1 and D.1, infra, the Postal Service revised FY 2015 targets for the performance indicators that measure progress toward these goals after setting them in the FY 2015 Plan. As a result, FY 2015 targets for these performance indicators differ between the FY 2015 Plan and FY 2015 Report. Revised targets have been a recurring issue.30 The Commission is concerned about inconsistencies in the presentation of targets between annual performance plans and annual performance reports covering the same fiscal year. Targets should not be routinely revised after they are established in annual performance plans. If circumstances necessitate a revision, the Postal Service should explain these circumstances in the applicable annual performance report. In other cases, such as changes that affect the Postal Service’s ability to meet a target, the Postal Service should explain why a performance goal was not met in the applicable performance report rather than revising the target to account for these changes. See 39 U.S.C. § 2804(d)(3)(A). Moreover, revised targets impede the Commission’s ability to “evaluate annually whether the Postal Service has met the goals established under” annual performance reports and annual performance plans. See 39 U.S.C. § 3653(d). For example, if targets are revised, the Commission must determine whether to evaluate performance based on initial or revised targets. In this Analysis, the Commission identifies both initial and revised FY 2015 targets, but evaluates whether the Postal Service met a performance goal based on revised targets. For these reasons the Commission recommends that the Postal Service not revise the FY 2016 targets that were set in the FY 2016 Plan. If circumstances merit revising a target for any fiscal year, the Postal Service should describe why the revision was necessary given the circumstances, and how the revision appropriately captures the changed circumstances.
A. Deliver High-Quality Services
1. Background Performance indicators. The Postal Service uses the percent of mail delivered on-time to assess whether its performance meets the Deliver High-Quality Services performance goal.31 Eight performance indicators measured progress toward this goal in FY 2015:
30 For example, the Postal Service also revised FY 2014 targets for the performance indicators that measure progress toward the Sustain Controllable Income goal to reflect deferral of the second phase of Network Rationalization. See FY 2015 Annual Report at 14 n.7.
31 The Postal Service also reports service performance on all Market Dominant products in the Annual Compliance Report. 39 U.S.C. § 3652(a)(2)(B)(i). Service performance reporting in the Annual Compliance Report is independent of service performance reporting in performance plans and program performance reports under 39 U.S.C. §§ 2803 and 2804.

Analysis of FY 2015 Performance Report Analysis of Postal Service Performance and FY 2016 Performance Plan
- 22 -
● Single-Piece First-Class Mail o Overnight o 2-Day o 3-5-Day
● Presort First-Class Mail32 o Overnight o 2-Day o 3-5-Day
● First-Class Mail Composite33 ● Standard Mail Composite34
Comparison of FY 2015 targets and results. In FY 2015, the Postal Service did not meet any of the targets it set for these performance indicators.35 FY 2015 Annual Report at 14; see Table I-1, supra. The Postal Service provides three reasons why it did not meet its FY 2015 targets. First, the continuing growth of packages resulted in the Postal Service’s need to continually balance its air and surface networks, which impacted mail with 2-Day and 3-5-Day service standards. FY 2015 Annual Report at 15. Second, the Postal Service maintains that weather continues to affect its service performance. Id. Third, the Postal Service also explains that its Network Rationalization initiative “resulted in complement [employee] shifts,” which “initially impacted [its] ability to achieve the targets.”36 FY 2016 targets. The Postal Service set its FY 2016 targets the same as its FY 2015 targets.37 Accordingly, results for each performance indicator must improve in order for the Postal Service to meet the FY 2016 targets. The improvement needed to meet each target ranges from 1.06 to 18.69 percentage points.
32 In FY 2015, the performance measure for Presort First-Class Mail included Presort First-Class Mail flats, instead of the proxy EXFC Flats. The impact of using Presort First-Class Mail flats was minimal. February 12, 2016, Responses to CHIR No. 9, question 10.a.
33 First-Class Mail Composite combines performance for Single-Piece First-Class Mail and Commercial First-Class Mail for an aggregate of Overnight, 2-Day, and 3-5-Day service. See FY 2015 Annual Report at 14 n.2. In FY 2015, the performance measure for First-Class Mail Composite included Presort First-Class Mail flats, instead of the proxy EXFC Flats. The impact of using Presort First-Class Mail flats was minimal. February 12, 2016, Responses to CHIR No. 9, question 10.a.
34 Standard Mail Composite combines Standard Mail destination entry for Section Center Facility letters and National Distribution Center letters and flats. See FY 2015 Annual Report at 14 n.3. In FY 2015, the performance measure for Standard Mail Composite included Every Door Direct Mail—Retail (EDDM—Retail). The inclusion of EDDM—Retail did not affect the overall Standard Mail Composite performance results. February 12, 2016, Response to CHIR No. 9, question 11.a.
35 The Postal Service also uses two non-public performance measures, one for a combined Priority Mail and Express Mail performance measure and another for Parcel Select. The Postal Service met one of these targets in FY 2015. Responses of the United States Postal Service to Questions 1-10 of Chairman’s Information Request No. 15, March 2, 2016, question 8 (Responses to CHIR No. 15), Library Reference USPS–FY15–NP38.
36 Id. The complement shift is the staffing realignment of employees at Phase II Network Rationalization mail processing locations for new operating windows that occurred in all 67 districts. Responses of the United States Postal Service to Questions 15-26 of Chairman’s Information Request No. 2, January 19, 2016, questions 18.b., 18.d. (January 19, 2016, Responses to CHIR No. 2).
37 Response of the United States Postal Service to Question 7 of Chairman’s Information Request No. 17, March 9, 2016, question 7 (March 9, 2016, Response to CHIR No. 17).
Analysis of FY 2015 Performance Report Analysis of Postal Service Performance and FY 2016 Performance Plan
- 23 -
The Postal Service identifies three plans for improving service and meeting its FY 2016 targets. First, the Postal Service contends that the completion of the second phase of Network Rationalization will allow it to meet FY 2016 targets. FY 2015 Annual Report at 15. Second, the Postal Service states that its efforts to rebalance its air and surface networks will allow it to meet targets. Id. Third, the Postal Service asserts that its continuing “evolution of Lean activities in processing and delivery” will also allow it to meet its FY 2016 targets. Id.
2. Comments Failure to meet performance indicators. The Public Representative states that the Postal Service did not meet service performance targets for any of the performance indicators used. PR Comments at 4. She notes that this “failure is made worse by the fact that all performance indicators were at their lowest level (since either FY 2011 or the year when the scores [were first] available).” Id. at 5. She further comments that “it is evident that the vast majority of the Postal Districts did not meet any performance indicators for Single-Piece First-Class Mail.” Id. at 8. The Postal Service replies that “implementation of major processing efficiency initiatives in 2015 resulted in tremendous shifts in employee resource work schedules.” USPS Reply Comments at 2. The Postal Service asserts that because of these changes percent on-time performance initially deteriorated. Id. However, since then, the Postal Service stresses that it has made improvements. Id. Winter weather. The Public Representative states “that inclement weather is not a sufficient justification for a failure to meet performance goals on an annual basis.” PR Comments at 6. She notes that for each performance indicator of the service goal, the Postal Service provided information as to which districts and areas met the performance target. Id. at 7. She comments that “[t]hese results are highly discouraging and, considering the complete geographic coverage, could not be explained by severe weather.” Id. at 7-8. The Postal Service responds by stating that it “did not report that bad weather was the sole justification for not meeting the service goals on an annual basis.” USPS Reply Comments at 4. The Postal Service restates that it considers “growth in package mail (which led to rebalancing of air and surface networks), efficiency-based employee complement shifts, and necessary delays in changes to the processing network” as additional reasons it did not meet its performance goals. Id. The Postal Service explains that its “service performance target indicators” were specifically affected by “the long and severe period of wintry weather in the Northeast and Great Lake Areas, as well as the ice storm in Memphis, which had national impact.” Id. The Postal Service concludes that these weather events, in addition to the aforementioned constraints, led to it not meeting its goals. Id.

Analysis of FY 2015 Performance Report Analysis of Postal Service Performance and FY 2016 Performance Plan
- 24 -
Network Rationalization. The Public Representative doubts the Postal Service’s claim “that ‘the eventual completion of the second phase of the network consolidation project in FY 2016 … will improve overall service performance and allow the Postal Service to meet its targets.’” PR Comments at 8. She identifies two reasons for her skepticism. First, she states that the Postal Service makes the opposite argument–it explains that it deferred additional processing network changes to allow for a “period of stabilization,” which it claims led to an overall improvement in service performance. Id. Second, she refers to the fact that the Postal Service has presently deferred the second phase of Network Rationalization and has not scheduled a date for completion. Id. at 9. The Postal Service states that “a lack of service-responsive aircraft capacity to support shifting volume as a result of Phase 2 network rationalization caused transportation capacity constraints.” USPS Reply Comments at 2-3. The Postal Service explains that “these network constraints also impacted mail arriving at destination prior to Critical Entry Time (CET).” Id. at 3. In addition, the Postal Service states that “in some instances, surface transportation between specific origin-destination pairs was not aligned to enter by destination CET.” Id. The Postal Service argues that “[t]he gap in air capacity in Quarter 2 of 2015 correlates with the service performance trend, which improved over Quarters 3 and 4, as the gap was closed.” Id.
FY 2016 Plan. The Public Representative is concerned that the Postal Service’s targets are unrealistic. PR Comments at 8. The Public Representative states that the Postal Service should explain, with greater detail, its plans to meet its FY 2016 service performance targets. Id. at 9. The Postal Service replies that “[w]hile the FY 2016 targets for First-Class Mail may appear challenging based upon the performance in FY 2015, they are not as challenging when compared to prior years.” USPS Reply Comments at 5. The Postal Service reiterates that “the eventual completion of the network consolidations is a piece in the broader strategy to improve service performance and target achievement. Although network consolidations are in a deferred status, the Postal Service is confident that the positive impacts from the planned service improvements will be achieved.” Id. at 5-6. Commission recommendation. The Public Representative states that “[t]he Commission specifically directed the Postal Service to ‘consider further analyzing the times and areas impacted by severe winter weather and includ[e] more comprehensive service performance information in its FY 2015 Report and FY 2016 Plan.’” PR Comments at 6. She concludes that the Postal Service did not follow the Commission’s directive. Id. The Postal Services responds that the Public Representative’s conclusion “is a misunderstanding of the Commission’s statement” because the statement referenced by the Public Representative “was not a directive, but a suggestion.” USPS Reply Comments at 4-5.

Analysis of FY 2015 Performance Report Analysis of Postal Service Performance and FY 2016 Performance Plan
- 25 -
3. Commission Analysis In this section, the Commission makes observations on the Postal Service's FY 2015 service performance and recommendations on its plans for meeting FY 2016 targets. As noted above, the Postal Service did not meet any of the targets set for its performance indicators in FY 2015. FY 2015 Annual Report at 11. Consequently, the Commission finds that the Postal Service did not meet the Deliver High-Quality Services performance goal in FY 2015.
a. Air/surface network balancing
The Postal Service states that “ongoing growth in package mail [] resulted in continual balancing between air and surface networks, impacting Two-day and Three-to-Five day categories.” FY 2015 Annual Report at 15. However, the Postal Service is confident that its “current efforts to re-balance [its] air and surface networks” will allow it to meet its FY 2016 targets. Id.
Table III-2 shows that in FY 2015, mail with a 3-5-Day service standard experienced the greatest decreases in the percent on-time performance compared to FY 2014.
Table III-2
FY 2015 Decrease in Percent On-Time by Service Performance Indicator
Service Performance Indicator Decrease Percent On-Time
FY 2015 FY 2014
Single-Piece First-Class Mail
Overnight -0.45% 95.55% 96.00%
2-Day -1.62% 93.28% 94.90%
3-5-Day -11.14% 76.56% 87.70%
Presort First-Class Mail
Overnight -1.26% 95.74% 97.00%
2-Day -2.84% 93.56% 96.40%
3-5-Day -4.42% 87.78% 92.20%
First-Class Mail Composite -4.47% 89.64% 94.11%
Standard Mail Composite -0.51% 89.58% 90.09%
Source: FY 2015 Annual Report at 14.
For FY 2015, the Postal Service forecasted continuing growth in package mail, specifically in Priority Mail, Parcel Select and First-Class Package Service, which were “all expected to

Analysis of FY 2015 Performance Report Analysis of Postal Service Performance and FY 2016 Performance Plan
- 26 -
grow by double-digit rates[.]”38 As Table III-3 shows, the volume of competitive products increased by over half a billion pieces in FY 2015. This was primarily due to growth in Parcel Select. In addition, total weight increased by nearly 1.3 billion pounds since FY 2014, primarily due to growth in Parcel Select. As the Postal Service forecasted for FY 2015, Priority Mail, Parcel Select, and First-Class Package Service volume grew by double-digit rates.
Table III-3 Selected Categories, FY 2015 Pieces, Weight, and Pound per Piece
Compared with FY 2014
Categorya Pieces
in thousands
Change: Pieces in thousands
Weight: Pounds in thousands
Change: Weight Pounds in
thousands Pound per Piece
FY 2015 over FY 2014
FY 2015 over FY 2014
Total Market Dominant Mailb
FY 2015 FY 2014 Amount Percent FY 2015 FY 2014 Amount Percent FY 2015 FY 2014
150,197,938 152,135,884 (1,937,946) (1.3) 14,917,177 15,118,060 (200,883) (1.3) 0.0993 0.0994
Total Competitive Mail
3,959,042 3,402,788 556,253 16.3 6,744,664 5,480,263 1,264,401 23.1 1.7036 1.6105
Total Parcel Select Mail 1,876,634 1,482,669 393,965 26.6 3,578,361 2,599,846 978,515 37.6 1.9068 1.7535
Total Priority Mail 992,190 897,900 94,290 10.5 2,227,771 1,938,968 288,803 14.9 2.2453 2.1594
Total First-Class Package Service
708,423 616,280 92,143 15.0 248,779 212,672 36,106 17.0 0.3512 0.3451
a Pieces, Weight and Pound per Piece also increased in FY 2014 compared with FY 2013 for the same competitive product categories as shown in Table III-3; however, the FY 2014 increases were not of the same magnitude as those in FY 2015. Category totals include negotiated service agreements.
b Some Market Dominant products within the total did increase in FY 2015. Decrease in amounts is denoted by ( ).
Source: Library Reference USPS–FY15–42, December 29, 2015, file “USPS–FY15–42.RPW.Public.xlsx.”
Despite forecasting ongoing growth in package mail, the Postal Service explains that in FY 2015, it “exceeded the demand that our air network partners could commit to carry. In order to accommodate the volume, analysis and decisions were made to shift mail from the air network to move on surface transportation.” February 12, 2016, Responses to CHIR No. 9, question 8.a.
To mitigate the effect of its network constraints on its service performance, the Postal Service states it “onboarded new commercial air carriers, purchased dedicated charters to offset the shortage of capacity and continued to negotiate additional capacity from air network integrators.” January 19, 2016, Responses to CHIR No. 2, question 19.c. The Postal Service also states that it “worked with its logistics providers to expand its capacity to transport mail and adjust to changes in transportation needs on a lane-by-lane basis.”39 In addition, beginning in 2016, the Postal Service added new contract parameters with its partner air networks to ensure it receives extra needed capacity and worked with
38 FY 2015 Integrated Financial Plan, November 24, 2014, at 3.
39 Docket No. ACR2015, February 12, 2016, USPS Reply Comments at 27. The Postal Service states it increased average daily capacity by 340,000 cubic feet. Id. at n.71.

Analysis of FY 2015 Performance Report Analysis of Postal Service Performance and FY 2016 Performance Plan
- 27 -
alternate air suppliers for supplemental capacity. February 12, 2016, Responses to CHIR No. 9, question 8.c.
Because the Postal Service relies entirely on third parties for air transportation, it is subject to its air partners’ business operations and contract agreements for the given fiscal year.40 As a result, the Postal Service had limited ability to adjust to changes in mail characteristics or mail volumes. Given these limitations, the Commission recommends that the Postal Service closely examine and monitor the reasons why the FY 2014 and FY 2015 year-to-year changes in mail characteristics or mail volumes were underestimated or unplanned.
b. Weather
The Postal Service contends that “[w]eather incidents continue to affect performance… .” FY 2015 Annual Report at 15. In its FY 2015 ACD, the Commission cautioned that because severe winter weather is an annual occurrence, it is critical that the Postal Service prepare adequately for expected seasonal variations in weather to avoid adverse impacts to service performance. FY 2015 ACD at 137. Moreover, the Commission stated that the quarterly district level service performance reports that the Postal Service provides illustrate that all quarters, not just quarters where severe weather occurs, have reported results less than the target.41 FY 2015 ACD at 137. The Commission stated that these quarterly reports demonstrate that the problem is more widespread than one that can be explained by severe winter weather. Id. For three out of the eight service performance measures the Postal Service uses to assess whether it meets the Deliver High-Quality Services goal, no districts (or areas) met the target for FY 2015.42
The Commission recommends that when districts do not meet their service performance targets due, in whole or in part, to severe weather, the Postal Service show when and to what extent severe weather affected service performance results. By doing so, the Postal Service should distinguish between severe weather causes of poor service performance, and other ongoing causes throughout the fiscal year in its performance reports.
c. Network Rationalization
The Postal Service explains that its Network Rationalization initiative “resulted in complement [employee] shifts,” which “initially impacted [its] ability to achieve the targets.” FY 2015 Annual Report at 15. However, the Postal Service “believe[s] that the
40 United States Postal Service, 2015 Report on Form 10-K, November 13, 2015, at 9 (Postal Service FY 2015 Form 10-K).
41 See USPS Quarterly Service Performance Reports Quarters 1-4 of FY 2012 to FY 2015; http://www.prc.gov/documents/quarterly-performance. See also Figure V-4 First-Class Flats with a 3-5-Day Service Standard Service Performance Results per Quarter, FY 2012-FY2015.
42 See February 12, 2016, Responses to CHIR No. 9, question 7, file “CHIR.9.Q7.Attachment.xlsx.”

Analysis of FY 2015 Performance Report Analysis of Postal Service Performance and FY 2016 Performance Plan
- 28 -
eventual completion of the second phase of Network Rationalization project in FY2016” will allow it to meet targets. Id. The Postal Service further explains that it implemented major changes to make its mail processing more efficient. Id. These changes, the Postal Service states, resulted in changes in employee shifts, which initially impacted its ability to achieve its service performance targets.43 The Postal Service states that it deferred any additional processing network changes “to provide a period for stabilization of our workforce and service performance.” FY 2015 Annual Report at 15. The Postal Service contends that since then, it has shown continual improvement in service performance results. Id. The Postal Service explains service performance will improve as a result of the eventual completion of the second phase of Network Rationalization because that initiative will reduce the number of distribution nodes and will also reduce the number of separations done each day. Response to CHIR No. 5, question 2. The Postal Service states that each node and separation are a potential failure point and “reduction of these points will decrease failures.” Id. In addition, the Network Rationalization consolidations will relocate available equipment to other sites to improve quality and capacity. Id. The Postal Service does not provide a time frame for when it anticipates setting a schedule for these consolidations.44 The Postal Service states that “Phase 2 consolidations remain in a deferred status at this time. Prior to resuming consolidation activities, the Postal Service will notify all stakeholders (including the Commission) in advance, so that affected mailers will have a reasonable time to make necessary adjustments in advance of implementation.” Responses to CHIR No. 15, question 9.b. In addition, the Postal Service anticipates that the remainder of the consolidations associated with the second phase of Network Rationalization may impact 21 partially consolidated facilities plus an additional 44 processing facilities that have been unaffected to date. FY 2015 Annual Report at 21. Rather than precisely explaining these effects, the Postal Service explains that each facility consolidation is unique because of the specific mail affected, mail volumes processed, and whether affected operations are originating or destinating in nature. Responses to CHIR No. 15, question 9.b. However, by not including any information concerning how additional facilities may be impacted, and an anticipated date for the second phase of Network Rationalization, increased uncertainty for interested stakeholders may occur. The Postal Service states that it “does not anticipate any service performance degradation or negative customer impacts resulting from the remaining Phase 2 consolidations, beyond changes that conform service to the new service standards.” Responses to CHIR No. 15, question 9.b. Although the Postal Service explains that the FY 2015 staffing
43 See id.; see also February 12, 2016, Responses to CHIR No. 9, question 9.
44 Responses to CHIR No. 15, question 9.b.; see also http://about.usps.com/news/electronic-press-kits/our-future-network/welcome.htm.
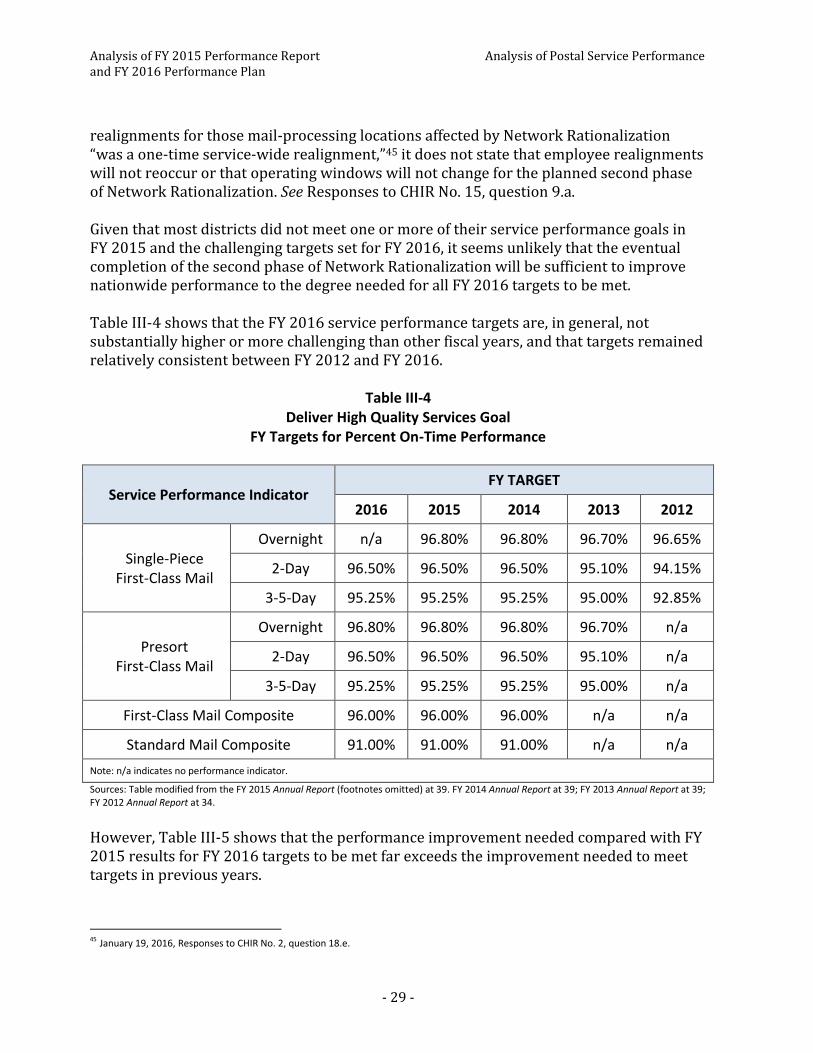
Analysis of FY 2015 Performance Report Analysis of Postal Service Performance and FY 2016 Performance Plan
- 29 -
realignments for those mail-processing locations affected by Network Rationalization “was a one-time service-wide realignment,”45 it does not state that employee realignments will not reoccur or that operating windows will not change for the planned second phase of Network Rationalization. See Responses to CHIR No. 15, question 9.a. Given that most districts did not meet one or more of their service performance goals in FY 2015 and the challenging targets set for FY 2016, it seems unlikely that the eventual completion of the second phase of Network Rationalization will be sufficient to improve nationwide performance to the degree needed for all FY 2016 targets to be met. Table III-4 shows that the FY 2016 service performance targets are, in general, not substantially higher or more challenging than other fiscal years, and that targets remained relatively consistent between FY 2012 and FY 2016.
Table III-4 Deliver High Quality Services Goal
FY Targets for Percent On-Time Performance
Service Performance Indicator FY TARGET
2016 2015 2014 2013 2012
Single-Piece First-Class Mail
Overnight n/a 96.80% 96.80% 96.70% 96.65%
2-Day 96.50% 96.50% 96.50% 95.10% 94.15%
3-5-Day 95.25% 95.25% 95.25% 95.00% 92.85%
Presort First-Class Mail
Overnight 96.80% 96.80% 96.80% 96.70% n/a
2-Day 96.50% 96.50% 96.50% 95.10% n/a
3-5-Day 95.25% 95.25% 95.25% 95.00% n/a
First-Class Mail Composite 96.00% 96.00% 96.00% n/a n/a
Standard Mail Composite 91.00% 91.00% 91.00% n/a n/a
Note: n/a indicates no performance indicator.
Sources: Table modified from the FY 2015 Annual Report (footnotes omitted) at 39. FY 2014 Annual Report at 39; FY 2013 Annual Report at 39; FY 2012 Annual Report at 34.
However, Table III-5 shows that the performance improvement needed compared with FY 2015 results for FY 2016 targets to be met far exceeds the improvement needed to meet targets in previous years.
45 January 19, 2016, Responses to CHIR No. 2, question 18.e.
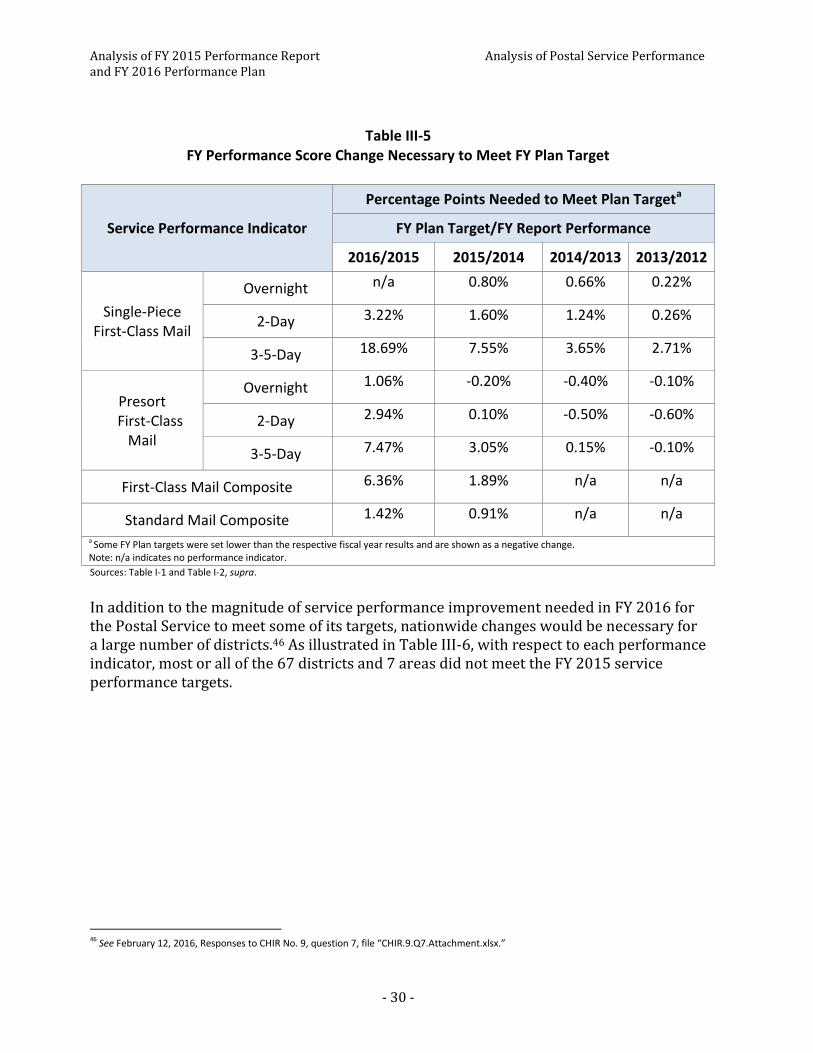
Analysis of FY 2015 Performance Report Analysis of Postal Service Performance and FY 2016 Performance Plan
- 30 -
Table III-5 FY Performance Score Change Necessary to Meet FY Plan Target
Service Performance Indicator
Percentage Points Needed to Meet Plan Targeta
FY Plan Target/FY Report Performance
2016/2015 2015/2014 2014/2013 2013/2012
Single-Piece First-Class Mail
Overnight n/a 0.80% 0.66% 0.22%
2-Day 3.22% 1.60% 1.24% 0.26%
3-5-Day 18.69% 7.55% 3.65% 2.71%
Presort First-Class
Overnight 1.06% -0.20% -0.40% -0.10%
2-Day 2.94% 0.10% -0.50% -0.60%
3-5-Day 7.47% 3.05% 0.15% -0.10%
First-Class Mail Composite 6.36% 1.89% n/a n/a
Standard Mail Composite 1.42% 0.91% n/a n/a
a Some FY Plan targets were set lower than the respective fiscal year results and are shown as a negative change. Note: n/a indicates no performance indicator.
Sources: Table I-1 and Table I-2, supra.
In addition to the magnitude of service performance improvement needed in FY 2016 for the Postal Service to meet some of its targets, nationwide changes would be necessary for a large number of districts.46 As illustrated in Table III-6, with respect to each performance indicator, most or all of the 67 districts and 7 areas did not meet the FY 2015 service performance targets.
46 See February 12, 2016, Responses to CHIR No. 9, question 7, file “CHIR.9.Q7.Attachment.xlsx.”

Analysis of FY 2015 Performance Report Analysis of Postal Service Performance and FY 2016 Performance Plan
- 31 -
Table III-6 Postal Districts/Areas that Met the FY 2015 Targets for the
Performance Goal “Deliver High-Quality Services” (% On-Time)
Performance Indicator Number of
Postal Districts Number of
Postal Areasa
Single-Piece First-Class Mail
Overnight 4 0
2-Day 2 0
3-5-Day 0 0
Presort First-Class Mail
Overnight 17 1
2-Day 8 0
3-5-Day 0 0
First-Class Mail Composite 0 0
Standard Mail Composite 34 2 a Eastern Area met both Presort First-Class Mail Overnight and Standard Mail Composite performance targets. Capital Metro Area met the Standard Mail Composite target. There are 10 postal districts in the Eastern Area and 8 postal districts in the Capital Metro Area.
Sources: PR Comments at 7; February 12, 2016, Responses to CHIR No. 9, question 7, file “CHIR.9.Q7.Attachment.xlsx.”
Because of the magnitude of annual performance improvement needed in FY 2016 for some performance indicators to meet FY 2016 targets, the Commission is concerned that the Postal Service’s plans for service improvement will be insufficient for all service performance indicators and all postal areas to meet the FY 2016 targets. For those service performance indicators that do not meet FY 2016 targets, the Commission recommends that the Postal Service include the number of districts where the annual service performance indicator target was met in its FY 2016 Report. By doing so, the Postal Service can show where progress was made in FY 2016, even if targets are not met on a nationwide basis.
d. Lean activities
The Postal Service states it will continue its “evolution of Lean activities in processing and delivery along with customer-focused operations to provide an efficient and consistent experience.” FY 2015 Annual Report at 15. The Postal Service does not specify which “Lean” processing and delivery initiatives it references in its FY 2016 Plan to meet its FY 2016 targets. However, the “Lean” delivery activities the Postal Service discussed in the FY 2015 Annual Report are not new initiatives to FY 2015, and by themselves, do not appear to have caused sufficient or comprehensive service performance improvement.47
47 The Postal Service did not specify to which of its “Lean” delivery initiatives would improve its service performance scores. The Postal Service does discuss its “Delivery Optimization,” “Mode Conversions,” and “Route Evaluations and Adjustments.” See FY 2015 Annual Report at 47.
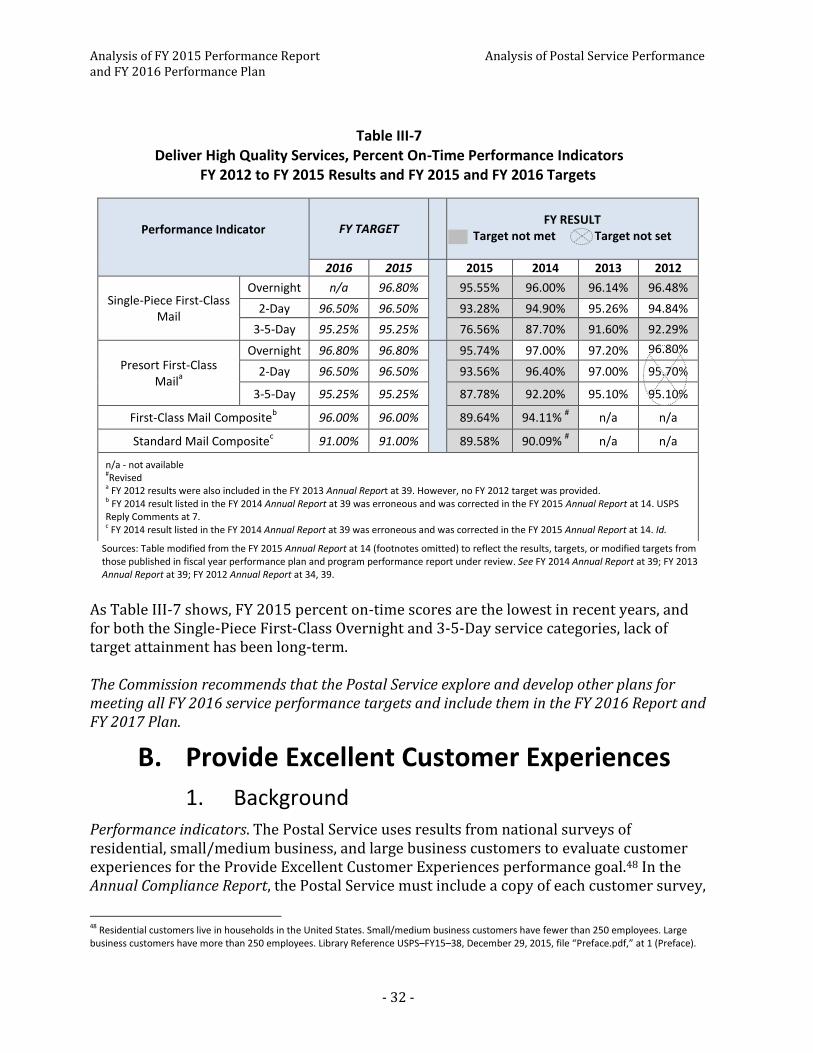
Analysis of FY 2015 Performance Report Analysis of Postal Service Performance and FY 2016 Performance Plan
- 32 -
Table III-7 Deliver High Quality Services, Percent On-Time Performance Indicators
FY 2012 to FY 2015 Results and FY 2015 and FY 2016 Targets
Sources: Table modified from the FY 2015 Annual Report at 14 (footnotes omitted) to reflect the results, targets, or modified targets from those published in fiscal year performance plan and program performance report under review. See FY 2014 Annual Report at 39; FY 2013 Annual Report at 39; FY 2012 Annual Report at 34, 39.
As Table III-7 shows, FY 2015 percent on-time scores are the lowest in recent years, and for both the Single-Piece First-Class Overnight and 3-5-Day service categories, lack of target attainment has been long-term. The Commission recommends that the Postal Service explore and develop other plans for meeting all FY 2016 service performance targets and include them in the FY 2016 Report and FY 2017 Plan.
B. Provide Excellent Customer Experiences
1. Background Performance indicators. The Postal Service uses results from national surveys of residential, small/medium business, and large business customers to evaluate customer experiences for the Provide Excellent Customer Experiences performance goal.48 In the Annual Compliance Report, the Postal Service must include a copy of each customer survey,
48 Residential customers live in households in the United States. Small/medium business customers have fewer than 250 employees. Large business customers have more than 250 employees. Library Reference USPS–FY15–38, December 29, 2015, file “Preface.pdf,” at 1 (Preface).
Performance Indicator
FY TARGET
FY RESULT Target not met Target not set
2016 2015
2015 2014 2013 2012
Single-Piece First-Class Mail
Overnight n/a 96.80% 95.55% 96.00% 96.14% 96.48%
2-Day 96.50% 96.50% 93.28% 94.90% 95.26% 94.84%
3-5-Day 95.25% 95.25% 76.56% 87.70% 91.60% 92.29%
Presort First-Class Mail
a
Overnight 96.80% 96.80%
95.74% 97.00% 97.20% 96.80%
2-Day 96.50% 96.50% 93.56% 96.40% 97.00% 95.70%
3-5-Day 95.25% 95.25% 87.78% 92.20% 95.10% 95.10%
First-Class Mail Compositeb 96.00% 96.00% 89.64% 94.11%
# n/a n/a
Standard Mail Compositec 91.00% 91.00% 89.58% 90.09%
# n/a n/a
n/a - not available #Revised a FY 2012 results were also included in the FY 2013 Annual Report at 39. However, no FY 2012 target was provided. b FY 2014 result listed in the FY 2014 Annual Report at 39 was erroneous and was corrected in the FY 2015 Annual Report at 14. USPS Reply Comments at 7. c FY 2014 result listed in the FY 2014 Annual Report at 39 was erroneous and was corrected in the FY 2015 Annual Report at 14. Id.

Analysis of FY 2015 Performance Report Analysis of Postal Service Performance and FY 2016 Performance Plan
- 33 -
a description of the customer type targeted by the survey, the number of surveys initiated and received, and in the case of multiple choice questions, the number of responses received for each question, disaggregated by each of the possible responses. 39 C.F.R. § 3055.92. The Postal Service provided this information in Library Reference USPS–FY15–38. Library Reference USPS–FY15–38, December 29, 2015. From FY 2010 to FY 2013, the Postal Service evaluated customer experiences using the Customer Experience Measurement (CEM) measurement system and established performance indicators based on results of CEM customer surveys. In FY 2014, the Postal Service changed to the Customer Insights (CI) measurement system.49 According to the Postal Service, the CI measurement system “provides a comprehensive view of the customer experience across the most frequently used customer contact channels.” FY 2015 Annual Report at 16. Under the CI measurement system, the Postal Service evaluates customer experiences using five customer surveys. Table III-8 lists each survey and the customer experience it measures.
Table III-8 Customer Insights Measurement System
Survey Names and Descriptions
Customer Survey Name Description
Business Service Network Measures business customers’ level of satisfaction with their Business Service Network account representatives
Point of Sale Measures retail customers’ level of satisfaction at locations with Point of Sale equipment
Delivery (Residential) Measures residential customers’ level of satisfaction with receiving mail
Delivery (Small/Medium Business) Measures small/medium business customers’ level of satisfaction with receiving mail
Customer Care Center Measures residential customers’ satisfaction with their interaction with Postal Service live agents when calling the Customer Care Center
Sources: Preface at 2; FY 2015 Annual Report at 16.
In FY 2014, the Postal Service replaced the CEM performance indicators with five new performance indicators based on results of CI customer surveys. Beginning in FY 2014, the Postal Service measured progress toward the Provide Excellent Customer Experiences performance goal using the following performance indicators:
Business Service Network (BSN)
Point of Sale (POS)
49 In its FY 2014 Analysis, the Commission described the change from the CEM measurement system to the CI measurement system in detail. FY 2014 Analysis at 22-24.
Analysis of FY 2015 Performance Report Analysis of Postal Service Performance and FY 2016 Performance Plan
- 34 -
Delivery
Customer Care Center (CCC)
CI Composite Score
Results of the BSN, POS, and Delivery performance indicators are expressed as the percentage of customers who responded “Very Satisfied” or “Mostly Satisfied” to a question on the corresponding customer survey.50 Results of the Delivery performance indicator combine responses from both the Residential and Small/Medium Business customers.51 Results of the CCC performance indicator are expressed as the percentage of customers who selected the top three survey question responses.52 The BSN, POS, Delivery, and CCC performance indicators are each assigned a percentage weight and aggregated to create the CI Composite Score performance indicator. FY 2015 Annual Report at 16. The BSN performance indicator constitutes 40 percent of the CI Composite Score, while the POS, Delivery, and CCC performance indicators are each weighted 20 percent. Table III-9 lists the survey question used to measure the results of each performance indicator. The applicable questions used to measure results for the BSN, POS, Delivery, and CCC performance indicators are the same as those used to create the CI Composite Score performance indicator.53
50 See Docket No. ACR2014, February 10, 2015, Responses to CHIR No. 5, question 1.b., Library Reference USPS–FY14–47, file “ChIR5.Q1b.Calculation Worksheet.xlsx;” Library Reference USPS–FY15–38, file “CI Question Response Counts_FY15.xlsx.” The FY 2014 CCC counts shown in file “ChIR5.Q1b.Calculation Worksheet.xlsx” differ from Docket No. ACR2014, Library Reference USPS–FY14–38, file “CI Question Counts FY2014.xlsx.” See Docket No. ACR2014, April 14, 2015, Responses to CHIR No. 16, question 1, 2.
51 See Docket No. ACR2014, February 10, 2015, Responses to CHIR No. 5, question 1.b., Library Reference USPS–FY14–47, file “ChIR5.Q1b.Calculation Worksheet.xlsx, tab “Delivery.”
52 The CCC response scale changed from a 5-point to a 9-point scale in FY 2015. Compare Docket No. ACR2014, Library Reference USPS-FY14-38, question 6 in file “CCC-USPS FY14 CCC Web Survey.pdf” with Library Reference USPS-FY15-38, question 11 in file “CCC Live Agent Survey-FY2015.pdf.” The CCC count and result in file “CI Question Response Counts FY15.xlsx,” tab “CCC” do not match exactly those in the Preface and FY 2015 Annual Report at 14-15.
53 See Docket No. ACR2014, February 10, 2015, Responses to CHIR No. 5, question 1.b., Library Reference USPS–FY14–47, file “ChIR5.Q1b.Calculation Worksheet.xlsx”; Library Reference USPS-FY15-38, file “CI Question Response Counts_FY15.xlsx.”

Analysis of FY 2015 Performance Report Analysis of Postal Service Performance and FY 2016 Performance Plan
- 35 -
Table III-9
Provide Excellent Customer Experiences Performance Indicators Performance Indicator Customer Survey Question
Used for Performance Indicatora
Business Service Network
“When thinking about your specific interaction with (name of BSN Representative), how satisfied are you with the OVERALL service provided during this interaction?”
Point of Sale “Thinking about this visit to the Post Office, overall, how satisfied were you?”
Delivery
“Just thinking about your overall experience with the mail or packages you recently RECEIVED, how satisfied are you with USPS performance?”
Customer Care Center
“Now, think only about the agent who handled your recent call. On a scale from 1 to 9, how would you rate the agent’s overall quality of service?”
a Surveys were provided in Library Reference USPS–FY15–38. The calculation methodology for the CI Composite Score was shown in Docket No. ACR2014, Library Reference USPS–FY14–47, February 10, 2015, file “ChIR5.Q1b.Calculation Worksheet.xlsx.” The Commission reviewed the FY 2015 CI Composite Score methodology to assess consistency between FY 2014 and FY 2015 using the survey results in Library Reference USPS–FY15–38, file “CI Question Response Counts FY15.xlsx.”
Sources: Docket No. ACR2014, United States Postal Service Responses to Question 1-5, 8 and 9 of Chairman's Information Request No. 5, February 10, 2015, question 1.a. (Docket No. ACR2014, February 10, 2015, Responses to CHIR No. 5); Library Reference USPS–FY15–38, files “BSN – USPS FY15 BSN Web Survey.pdf,” “CCC Live Agent Survey – FY2015.pdf,” “Delivery – USPS FY 15 Residential Delivery SURVEY.pdf,” “Delivery – USPS FY15 Small Business Delivery SURVEY.pdf,” and “POS – USPS FY15 POS Web Survey.pdf.”
In addition to the BSN, POS, Delivery, and CCC surveys, the Postal Service also began surveying large business customers in the last quarter of FY 2015. In Docket No. ACR2014, several information requests sought information about large businesses to help the Commission evaluate whether the Postal Service met the Provide Excellent Customer Experiences performance goal in FY 2014.54 The Postal Service states that it began conducting the Large Business survey in response to these information requests. FY 2015 ACR at 59. However, the Postal Service explains that it did not include Large Business surveys in the CI measurement system because Large Business survey results were not included in the CI Composite Score in FY 2014. Responses to CHIR No. 3, question 1.g. The Postal Service states that it will consider including the Large Business survey in the
54 See, e.g., Docket No. ACR2014, Chairman's Information Request No. 13, March 2, 2015.

Analysis of FY 2015 Performance Report Analysis of Postal Service Performance and FY 2016 Performance Plan
- 36 -
Customer Insights measurement system in FY 2016. Id. The Large Business survey is described in detail in Section B.3.b.v, below. Comparison of FY 2015 targets and results. FY 2015 targets for the Provide Excellent Customer Experiences performance indicators are not consistently presented between the FY 2015 Plan and the FY 2015 Report. In the FY 2015 Plan, the Postal Service set FY 2015 targets for each of the five performance indicators. See FY 2014 Annual Report at 39. However, these targets were revised in the FY 2015 Report. First, the Postal Service noted that it changed the FY 2015 CI Composite Score target from 82.50 to 86.70 after the FY 2015 Plan was published.55 The FY 2015 Report lists the revised FY 2015 CI Composite Score target. FY 2015 Annual Report at 14. Second, the FY 2015 Report omits the FY 2015 targets for the BSN, POS, Delivery, and CCC performance indicators that had been set in the FY 2015 Plan.56 Instead, the FY 2015 target for each of these performance indicators is listed as “N/A.” Id. at 14, 17. In FY 2015, the CI Composite Score result of 85.73 did not meet the revised target of 86.70.57 Table III-10 compares targets from FY 2014 to FY 2016 and results from FY 2014 and FY 2015 for each Provide Excellent Customer Experiences performance indicator.
55 Docket No. ACR2014, USPS Reply Comments at 5.
56 See FY 2015 Annual Report at 14. The Postal Service includes a note in another table that states “[t]argets for the four subcomponents categories of Customer Insights (BSN, POS, Delivery and Customer Care Centers) are set and compensated at unit level” but does not specify the values of the FY 2015 targets. See id. at 17.
57 The Postal Service met initial FY 2015 Plan targets for the BSN and CI Composite Score performance indicators. It missed initial FY 2015 Plan targets for the POS, Delivery, and CCC performance indicators.

Analysis of FY 2015 Performance Report Analysis of Postal Service Performance and FY 2016 Performance Plan
- 37 -
Table III-10 Provide Excellent Customer Experiences Performance Indicators
Comparison of Targets and Results
Performance Indicator
FY 2016 Targets
FY 2015 Targets as presented in the
FY 2015 Report | Plan
a
FY 2015 Results
FY 2014 Results
FY 2014 Targets
Customer Insights Composite Score
86.70 86.70 | 82.50 85.73 84.65 Not
Developed
Business Service Network
86.70% N/A | 94.00% 94.32% 94.05% Not
Developed
Point of Sale 86.70% N/A | 90.00% 86.28% 81.59%
Not Developed
Delivery 86.70% N/A | 90.00% 77.49% 79.55%
Not Developed
Customer Care Center
b
86.70% N/A | 90.00% 76.00% 74.47% Not
Developed a The FY 2015 Plan was provided in Docket No. ACR2014, Library Reference USPS-FY14-17; FY 2014 Annual Report at 39. b The FY 2014 CCC results in Docket No. ACR2014, February 10, 2015, Responses to CHIR No. 5, question 1.b., Library Reference USPS–FY14–47, file “ChIR5.Q1b.Calculation Worksheet.xlsx, tab “CCC” and Docket No. ACR2014, February 10, 2015, Responses to CHIR No. 5, question 2.e. differ from those in Docket No. ACR2014, Library Reference USPS-FY14-38. See Docket No. ACR2014, April 14, 2015, Responses to CHIR No. 16, questions 1, 2. The FY 2015 CCC result is slightly lower (73.31%) in Library Reference USPS-FY15-38, file “CI Question Response Counts FY15.xlsx,” tab “CCC” than that shown in FY 2015 Annual Report at 14, 17.
Sources: FY 2015 Annual Report at 14; USPS Reply Comments at 8; FY 2014 Annual Report at 39; Docket No. ACR2014, Responses to CHIR No. 5, question 2.e.
While acknowledging that it missed the revised FY 2015 CI Composite Score target, the Postal Service points to substantial improvements in the response rates of the POS survey, which it contends “provide a more accurate picture of customer insights and experiences.” USPS Reply Comments at 8. The Postal Service explains that it significantly increased response rates for the POS survey by providing additional training for retail employees, using QR codes and interactive voice response systems, and expanding ways customers could respond to some customer surveys. FY 2015 Annual Report at 16. FY 2016 Plan. The FY 2016 Plan lists one FY 2016 target for the CI Composite Score performance indicator of 86.70, but does not provide FY 2016 targets for the BSN, POS, Delivery, and CCC performance indicators.58 The lack of FY 2016 targets indicates that the Postal Service planned to use the CI Composite Score as the only performance indicator for the Provide Excellent Customer Experiences performance indicator in FY 2016. However, in its reply comments, the Postal Service represents that it will retain the BSN, POS,
58 See id. at 14. FY 2016 targets for these performance indicators are listed as “N/A.”

Analysis of FY 2015 Performance Report Analysis of Postal Service Performance and FY 2016 Performance Plan
- 38 -
Delivery, and CCC as performance indicators and that each will have the same FY 2016 target as the CI Composite Score. USPS Reply Comments at 8. In the FY 2016 Plan, the Postal Service states that it will improve customer experience in FY 2016 by addressing three key drivers of customer satisfaction: accessibility, knowledge, and professionalism. FY 2015 Annual Report at 17. It states that CCCs will make even better use of its agent quality program, agent refresher training, technological advances in integrated voice recognition software, and immediate agent coaching. Id. It notes that it will continue to work to improve response rates for all customer surveys and develop videos, publications, service talks, and training for employees to educate them and highlight elements of visits that matter most to customers.59
2. Comments The Public Representative states that the FY 2015 CI Composite Score result of 85.73 was almost 1 percentage point lower than the revised FY 2015 target of 86.70. PR Comments at 10. She notes that FY 2015 results for the POS, Delivery, and CCC performance indicators did not meet initial FY 2015 targets. Id. For this reason, she concludes that the Postal Service did not meet the Provide Excellent Customer Experiences performance goal in FY 2015. Id. The Public Representative asserts that there are inconsistencies in the presentation of targets for FY 2015 and FY 2016. Id. She notes that the Postal Service set targets for the BSN, POS, Delivery, and CCC performance indicators for FY 2015 but not FY 2016. Id. at 11. She contends that calculating the CI Composite Score would not be possible if results of these performance indicators were not known. Id. She recommends that the Postal Service set targets for the BSN, POS, Delivery, and CCC performance indicators because they “will not only increase transparency, but also help the Postal Service better control the achievements of the overall [CI Composite Score] target.” Id. The Public Representative critiques the Postal Service’s assertion that FY 2015 and FY 2016 results will be directly comparable. Id. She contends that comparing FY 2016 results for the BSN, POS, Delivery, and CCC performance indicators will not be possible because the Postal Service did not set FY 2016 targets for them. Id. at 11-12. She recommends that the Postal Service provide a methodology for comparing FY 2015 and FY 2016 survey results. Id. at 12. The Postal Service acknowledges that the FY 2015 CI Composite Score result narrowly missed the revised FY 2015 target. USPS Reply Comments at 8. It clarifies that the targets for the BSN, POS, Delivery, and CCC performance indicators will be the same as the target for the CI Composite Score. Id.
59 Id. In the FY 2016 Plan, the Postal Service also states it will revamp the Delivery survey. Id. It clarified in a CHIR response that it reconsidered this plan and decided not to implement changes to the Delivery survey and the underlying scoring methodology for FY 2016. Responses to CHIR No. 20, question 3.

Analysis of FY 2015 Performance Report Analysis of Postal Service Performance and FY 2016 Performance Plan
- 39 -
3. Commission Analysis In this section, the Commission evaluates whether the Postal Service met the Provide Excellent Customer Experiences performance goal in FY 2015. It also describes each customer survey (including the Large Business survey) and makes observations and recommendations for improving customer experience results in future years.
a. Evaluating FY 2015 Performance
The Commission considers the Postal Service to have met a performance goal in FY 2015 if results for each performance indicator meet or exceed FY 2015 targets. As previously discussed, when there are both initial and revised targets, the Commission evaluates whether the Postal Service met a performance goal based on revised targets. The Provide Excellent Customer Experiences performance goal has one revised FY 2015 target for the CI Composite Score. In FY 2015, the CI Composite Score result of 85.73 did not meet the revised target of 86.70. For this reason, the Commission finds that the Postal Service did not meet the Provide Excellent Customer Experiences performance goal in FY 2015. The revised and omitted FY 2015 targets between the FY 2015 Plan and FY 2015 Report impeded the Commission’s evaluation of whether the Postal Service met the Provide Excellent Customer Experiences performance goal. The Commission reiterates its recommendation that the Postal Service not revise FY 2016 targets. If circumstances merit revising a target, the Postal Service should describe why the revision was necessary given the circumstances, and how the revision appropriately captures the changed circumstances. The BSN, POS, Delivery, and CCC performance indicators share the same FY 2016 target as the CI Composite Score. However, setting individual targets for each of these performance indicators is preferable because the performance indicators measure different areas of performance and perform differently. For example in FY 2015, the BSN performance indicator result was 94.32, whereas the CCC performance indicator result was 76.00. Because of the disparity in results, having separate targets for the BSN and CCC performance indicators would provide greater clarity as to how each is performing. This is best accomplished by the Postal Service setting targets geared specifically to the individual surveys, taking into account past results. To ensure that each aspect of customer experience progresses, the Commission recommends that the BSN, POS, Delivery, and CCC performance indicators each have individual targets in future performance plans.

Analysis of FY 2015 Performance Report Analysis of Postal Service Performance and FY 2016 Performance Plan
- 40 -
b. Customer Surveys
This section explores each customer survey in more detail, including the Large Business survey. Although the Large Business survey is not a FY 2015 performance indicator, it is a key measurement of customer experience. In the FY 2015 ACD, the Commission stated that “[s]urveying large business customers improves the Postal Service’s measurement of customer satisfaction with Market Dominant products because it considers feedback from all three major customer groups that use these products.” FY 2015 ACD at 156. The Commission makes observations and recommendations for improving results in future years.
(1) Business Service Network
The BSN helps business customers by resolving service issues and answering information requests. FY 2014 Annual Report at 39. It provides services for approximately 23,000 accounts that are organized into four categories based on revenue generated and service activities: Area Proactive, District Proactive, District Transactional, and Reserve.60 All BSN accounts are eligible to complete the BSN survey except for Reserve accounts, which are ineligible because they have lower levels of revenue and service activities. Id. The BSN survey measures the customer’s level of satisfaction with their BSN account representative.61 After initiating a service request with the BSN, eligible customers receive an email invitation to complete the BSN survey online. Preface at 2. The BSN survey consists of 11 evaluation questions and 3 open-ended customer supplied responses. Id. Customer experience for BSN customers improved with the performance indicator result increasing from 94.05 percent in FY 2014 to 94.32 percent in FY 2015.62 Also, the total number of BSN service requests declined from 168,770 in FY 2014 to 158,885 in FY 2015, which indicates fewer overall service issues.63 The average resolution time for BSN service requests improved from 5 days in FY 2014 to 3.4 days in FY 2015. Id. The Commission commends the Postal Service’s progress in improving customer experience for BSN customers. However, a more comprehensive assessment could be made if customers with Reserve accounts were eligible to complete the BSN survey.64 Excluding Reserve accounts may impact BSN performance indicator results. In future years, the Commission recommends that the Postal Service include all BSN customers in the
60 Docket No. ACR2014, March 13, 2015, Responses to CHIR No. 13, question 20.
61 FY 2015 Annual Report at 16. The BSN survey is in Library Reference USPS–FY15–38, file “BSN - USPS FY15 BSN Web Survey.pdf.”
62 Compare FY 2015 Annual Report at 14 with FY 2014 Annual Report at 39.
63 Compare Docket No. ACR2014, March 13, 2015, Responses to CHIR No. 13, question 21 with Responses of the United States Postal Service to Questions 1-12, 16-18 of Chairman’s Information Request No. 13, February 18, 2016, question 5 (February 18, 2016, Responses to CHIR No. 13).
64 In a 2014 audit report, the United States Postal Service Office of Inspector General stated, “the BSN customer experience survey excludes a large percentage of BSN customers, because it focuses on larger accounts, and only covers recently closed service requests.” United States Postal Service Office of Inspector General, Business Service Network Audit Report (Report No. MS-AR-14-005), July 9, 2014 at 2.
Analysis of FY 2015 Performance Report Analysis of Postal Service Performance and FY 2016 Performance Plan
- 41 -
survey. Alternatively, the Postal Service should provide the number of BSN accounts that are not eligible to complete the BSN survey.
(2) Point of Sale
The POS survey measures customer experience at retail locations that use POS equipment.65 After completing a retail transaction, customers receive a receipt inviting them to complete the POS survey online through a URL or QR Code printed on the bottom of the receipt. Preface at 2. The POS survey contains five questions evaluating the visit and one open-ended question asking customers how the retail location could improve their satisfaction with the service received.66 In FY 2015, approximately 17,762 retail locations participated in or administered the POS survey.67 The POS performance indicator result improved from 81.59 percent in FY 2014 to 86.28 percent in FY 2015. The POS survey also measures time spent waiting in line, which the Postal Service states is a key measure of a customer’s retail experience. FY 2015 Annual Report at 32. The Postal Service states that the service standard for wait time in line is “Five Minutes or Less.”68 Id. However, as discussed in the FY 2015 ACD, results from the POS survey indicate that customer wait times increased in FY 2015. FY 2015 ACD at 153. In FY 2015, 18.9 percent of POS survey customers reported wait times of more than 5 minutes. Id. Table III-11 lists the monthly percent and number of POS survey responses that reported wait times in line more than 5 minutes.
65 FY 2015 Annual Report at 16; Preface at 2. The POS survey is one method the Postal Service uses to measure retail performance. Another method is the Retail Customer Experience (RCE) program, which employs private “mystery shoppers” to conduct mailing transactions at over 8,000 large retail locations. FY 2015 Annual Report at 32. The Postal Service analyzes data from these transactions and provides feedback to retail locations to help improve retail performance. Id.
66 Id.; see Library Reference USPS–FY15–38, file “POS - USPS FY15 POS Web Survey.”
67 February 18, 2016, Responses to CHIR No. 13, question 10.a.
68 FY 2015 Annual Report at 32.The Postal Service measures wait time in line performance at its larger retail facilities using mystery shoppers through the RCE program rather than the POS survey. See FY 2015 ACD at 151-52. Direct monthly or quarterly comparisons between the POS and RCE program results are not possible because the RCE program results are reported in the FY 2015 Annual Report, at 32, and to the Commission in Library Reference USPS–FY15–33 as an average cumulative year-to-date quarterly result rather than by month or single quarter result. Currently, no single measure or comparably-tabulated result for wait time in line for both large and smaller retail facilities is filed with the Commission. See Responses of the United States Postal Service to Questions 1-4 of Chairman’s Information Request No. 18, March 8, 2016, questions 4.a-c. (Responses to CHIR No. 18); February 18, 2016, Responses to CHIR No. 13, question 10.d.; Library Reference USPS–FY15–38, file “CI Question Response Counts FY15.xlsx,” tab “POS,” cells B57-B62; Library Reference USPS–FY15–33, December 29, 2015, file “WaitTimeInLineFY2015.xlsx.”

Analysis of FY 2015 Performance Report Analysis of Postal Service Performance and FY 2016 Performance Plan
- 42 -
Table III-11 Point of Sale Survey Responses
Wait Time in Line More Than 5 Minutes by Month
Month
Wait Time in Line More Than 5 Minutes
a
Total POS Surveys Completed
Percent / Number Number
January 20.5% /13,276 64,642
February 21.7% / 15,907 73,386
March 19.6% / 16,400 83,720
April 18.7% / 15,376 82,328
May 16.5% / 11,298 68,340
June 17.5% / 11,917 68,025
July 15.8% / 11,286 71,201
August 16.7% / 12,540 75,268
September 17.5% / 15,216 86,816
October 14.6% / 8,068 55,201
November 15.3% / 8,378 54,633
December 28.8% / 24,997 86,941
Overall Total 18.9% / 164,659 870,501 a The POS survey responses: “6-10 minutes”, “11-15 minutes”, and “16 or more minutes” to question 4: “How long did you wait in line for a sales associate? (pick one)” are combined.
Source: Commission tabulated from January 21, 2016, Responses to CHIR No. 3, question 2, Library Reference USPS–FY15–NP32.
Based on its analysis of POS survey wait times in line by month, the Commission observes that the percentage of POS survey customers waiting in line for more than 5 minutes was lowest in October and November and highest in December, January, and February. For most months shown in Table III-11, nearly half of those grouped in the monthly total for the “more than a five-minute wait-time in line” responses chose the “11-15 minutes” or “16 or more minutes” response for the “How long did you wait in line for a sales associate?” question. December, January, and February had the highest percentage of respondents who chose the “16 or more minutes” wait time in line option (8 percent in December; just over 5 percent in January, and nearly 6 percent in February). To help meet the “Five Minutes or Less” standard, the Commission recommends that the Postal Service closely monitor and reduce wait times in line during peak months by, for example, including more staff at retail locations or adding additional window retail hours.
(3) Customer Care Center
The CCC survey is completed by residential customers who call the Postal Service’s CCC at 1 (800) ASK-USPS and speak to a live agent. FY 2014 Annual Report at 40. The CCC survey measures customers’ level of satisfaction with their interactions with live agents. FY 2015 Annual Report at 16. Invitations to complete the CCC survey are sent by phone on a random basis to customers who call the CCC and speak to a live agent. Preface at 2.
Analysis of FY 2015 Performance Report Analysis of Postal Service Performance and FY 2016 Performance Plan
- 43 -
The CCC performance indicator result increased from 74.47 percent in FY 2014 to 76.00 percent in FY 2015.69 This improvement may have resulted from the Postal Service restructuring each CCC and staffing them entirely with Postal Service employees in FY 2015. See FY 2015 Annual Report at 36. In FY 2015, the Postal Service revised the CCC survey by adding new questions, rephrasing some questions, and changing the response scale from a 5-point scale to a 9-point scale.70 For example, new questions in the FY 2015 survey asked customers to evaluate the length of time needed on the phone to resolve their question or concern, as well as how well the CCC connected them to a representative.71 By contrast, the FY 2014 CCC survey did not ask for this information. However, neither the FY 2015 Annual Report nor FY 2015 ACR indicated that the Postal Service revised the CCC survey. The Commission finds that the revisions to the FY 2015 CCC survey may improve its utility as a measurement of customer experience. In future years, if the Postal Service revises a customer experience survey, the Commission recommends that the Postal Service describe these changes in the methodology section of the Preface document of that fiscal year’s ACR, Library Reference USPS-FY16-38 (customer experience surveys), and in the report(s) where the survey is discussed. Any customer experience-related survey, data collection, sampling or other methodological change description should also include an explanation as to how the changes improve the survey and the results. If new survey questions are added, the Postal Service should explain how results of those questions will measure and improve customer experiences. This would improve transparency and facilitate comparisons of results across fiscal years. In FY 2015, the Postal Service changed its employee survey from the VOE to the Postal Pulse survey, which impacted comparability of results for the employee engagement performance indicator. See Section C.3.b.ii, infra. The changes made to the CCC survey between FY 2014 and FY 2015 illustrate how the Postal Service can change surveys while maintaining some comparable performance results across several fiscal years. Although the Postal Service added new questions and made other changes to the CCC survey, the Postal Service retained similar questions to facilitate comparisons and continued to use the result of the same survey question to develop the FY 2015 CI Composite Score.72 The Postal Service should adopt a similar approach if it makes changes to the surveys that affect comparability across fiscal years.
69 Compare Docket No. ACR2014, February 10, 2015, Responses to CHIR No. 5, question 2.e. with FY 2015 Annual Report at 14.
70 Compare Docket No. ACR2014, Library Reference USPS-FY14-38, file “CCC – USPS FY14 CCC Web Survey.pdf” with Library Reference USPS–FY15–38, file “CCC Live Agent Survey – FY2015.pdf.”
71 Library Reference USPS–FY15–38, file “CCC Live Agent Survey - FY2015.pdf,” questions 1, 3.
72 Compare Docket No. ACR2014, Library Reference USPS–FY14–38, file “CCC – USPS FY14 CCC Web Survey.pdf,” question 6 with Library Reference USPS–FY15–38, file “CCC Live Agent Survey FY2015.pdf,” question 11.
Analysis of FY 2015 Performance Report Analysis of Postal Service Performance and FY 2016 Performance Plan
- 44 -
(4) Delivery (Residential and Small/Medium Business)
The Delivery performance indicator result declined from 79.55 percent in FY 2014 to 77.49 percent in FY 2015. It was the only performance indicator for the Provide Excellent Customer Experiences performance goal where the result declined between FY 2014 and FY 2015. As previously discussed, the Postal Service changed from the CEM to the CI measurement system in FY 2014. See Section B.1, supra. Surveys for both the CEM and CI Delivery measurement systems measure the level of satisfaction with receiving mail for residential and small/medium business customers.73 For the CEM surveys used during FY 2010 through FY 2013, residential and small/medium business customers were randomly selected, mailed surveys, and given the option of returning them by mail or completing them online.74 Similarly, for the CI Delivery surveys used after FY 2013, residential and small/medium business customers are also randomly selected and mailed a survey invitation, but they are given the option of completing the survey by phone or online. Preface at 2. Several survey questions from the old CEM Delivery surveys were carried over into the new CI Delivery surveys. The Postal Service acknowledges that results of these questions may be comparable.75 However, it explains that when it switched to the CI measurement system, “[t]he survey methodology changed from a paper-based survey return system to a technology-based survey return system.” Id. question 29.a. Although both CEM and CI Delivery surveys were able to be completed online, CEM surveys could also be returned by mail. By contrast, CI Delivery surveys cannot be returned by mail and can also be completed by phone. The Postal Service asserts that this survey response methodology change may generate different results between the CEM paper survey returned by mail and the CI Delivery Surveys completed online. Responses to CHIR No. 14, question 14.a. 39 U.S.C. § 2804(c) requires the FY 2015 Report to include comparable results across fiscal years 2012, 2013, 2014, and 2015. As discussed in Chapter 2, supra, the Postal Service did not meet this requirement for the Provide Excellent Customer Experiences performance goal. The Postal Service takes the position that providing comparable results would require administering the CEM and CI Delivery surveys in the same fiscal year and that results for comparable questions may differ due to the different survey response modes (paper versus online). USPS Reply Comments at 9; Responses to CHIR No, 14, question 14.a. To the contrary, the Commission observes that the Postal Service could have
73 Preface at 2; see Library Reference USPS–FY15–38, files “Delivery - USPS FY15 Residential Delivery SURVEY.pdf” and “Delivery - USPS FY15 Small Business Delivery SURVEY.pdf”; Docket No. ACR2013, Library Reference USPS–FY13–38, December 27, 2013, files “residential-survey-english-11-26-2013.pdf” and “smallbusinessl-survey-english-112013.pdf.”
74 The Postal Service implemented the new CEM surveys in FY 2010 and discontinued the surveys at the end of FY 2013. See Docket No. ACR2010, United States Postal Service 2010 Comprehensive Statement on Postal Operations at 37 (FY 2010 Comprehensive Statement); Docket No. ACR2014, Library Reference USPS–FY14–38, file “USPS–FY14–38.Preface.pdf.,” “C. Methodology” section.
75 Responses of the United States Postal Service to Questions 1-5 of Chairman’s Information Request No. 14, February 23, 2016, question 14.a. (Responses to CHIR No. 14).; Docket No. ACR2014, February 13, 2015, Responses to CHIR No. 13, question 29.c.

Analysis of FY 2015 Performance Report Analysis of Postal Service Performance and FY 2016 Performance Plan
- 45 -
provided comparable year-to-year CEM and CI Delivery results by disaggregating the results by response mode and comparing the results of those surveys submitted using the same response mode (if it believes response mode would affect comparability). For example, the Postal Service could have compared results of surveys completed online for the CEM Delivery surveys conducted in FY 2012 and FY 2013 and the CI Delivery surveys conducted in FY 2014 and FY 2015.76 The FY 2016 Report must provide comparable results across fiscal years 2013, 2014, 2015, and 2016. To ensure that the FY 2016 Report complies with 39 U.S.C. § 2804(c) for the Provide Excellent Customer Experiences performance goal, the Commission recommends that the Postal Service also compare survey results received online for the CEM survey conducted in FY 2013 and the CI Delivery surveys conducted from FY 2014 through FY 2016 for residential and small/medium business customers.
(5) Large Business
The Postal Service conducted the Large Business survey in Quarter 4 of FY 2015 in response to questions posed by the Commission in Docket No. ACR2014. FY 2015 ACR at 59. The Postal Service states that the Large Business survey was conducted using a national sample of large commercial businesses, which are businesses with more than 250 employees. Responses to CHIR No. 3, question 1.b. The Postal Service conducted the Large Business survey using a panel-based methodology with a certified panel provider. Id. The Postal Service explains that a panel consists of a group of individuals who meet necessary demographic criteria and have expressed interest in participating in surveys. Id. question 1.c. The Large Business survey panel consists of large business customers who have influence over shipping solutions in businesses with more than 250 employees. Id. Large business customers selected for the panel received email invitations to participate in the Large Business customer survey. Id. question 1.b. Both the Large Business and BSN surveys measure business customers’ experiences. However, there are a number of key differences. First, the Large Business survey only targets large businesses while the BSN survey targets businesses of any size. Second, the Postal Service explains that BSN survey results are based on a sale or other interaction between a customer and the Postal Service and is conducted only after a customer initiates a service request within the BSN. Responses to CHIR No. 3, question 1.d. By contrast, the Large Business survey is administered randomly to the panel of large business customers. Id. The Postal Service states that it will consider including the Large Business survey as a performance indicator similar to the BSN, POS, CCC, and Delivery surveys. Id. question 1.g. Some business customer experiences are currently reflected in the CI Composite Score
76 The number of CEM online completed survey responses would be expected to be sufficient for year-to-year comparison with the CI online completed survey responses based on earlier information. Compare Docket No. ACR2010, Responses of the United States Postal Service to Questions 1-21 of Chairman’s Information Request No. 3, February 7, 2011, question 17.c. with Docket No. ACR2013, Library Reference USPS–FY13–38, “USPS-FY13.Preface.pdf” and Library Reference “USPS–FY15–38, FY15-38 Preface.pdf” tables under Section I.C Methodology.

Analysis of FY 2015 Performance Report Analysis of Postal Service Performance and FY 2016 Performance Plan
- 46 -
through the BSN performance indicator, which is weighted 40 percent of the score. However, the BSN performance indicator alone may not accurately represent all large business customers because it only includes overall customer satisfaction with the BSN agent for the CI Composite Score, rather than overall satisfaction with the Postal Service. By contrast, the Large Business survey measures customer experiences with other postal employees such as those from the local post office, Business Mail Entry Unit, and mail processing plant. The Large Business survey also asks about overall customer satisfaction with each Market Dominant product and associated postal services such as whether the product was delivered in good condition and whether the Postal Service provided the necessary equipment for mailing. The Commission recommends that the Postal Service establish a performance indicator based on the Large Business survey and include it as part of the CI Composite Score.
C. Ensure a Safe Workplace and Engaged Workforce
1. Background The Postal Service relies on two performance indicators to evaluate progress toward its performance goal to Ensure a Safe Workplace and Engaged Workforce. The Occupational Safety and Health Administration Illness & Injury frequency rate (OSHA I&I Rate) measures progress toward ensuring a safe workplace. The Postal Pulse survey score measures the effects of the Postal Service’s efforts to improve employee engagement. OSHA Illness & Injury Rate. The OSHA I&I Rate is the annual number of recordable illnesses and injuries per 100 employees.77 The OSHA I&I Rate result is initially reported in each fiscal year’s annual report to Congress and then revised to reflect new claims filed for that fiscal year, as well as changes in the status of existing claims. Responses to CHIR No. 20, question 2. For example, the Postal Service initially reported the FY 2014 OSHA I&I Rate result as 6.32 in the FY 2014 Report but revised it to 6.68 in the FY 2015 Report.78 Similarly, the FY 2015 result was initially reported as 6.55 in the FY 2015 Annual Report and increased to 6.75 as of March 13, 2016.79 The Postal Service describes the OSHA I&I Rate performance indicator as a live statistic that tracks recordable accidents and exposure hours.80 It states that OSHA I&I Rate results
77 The Postal Service calculates the OSHA I&I Rate using an industrywide formula recommended by OSHA: total number of OSHA injuries and illnesses (multiplied by 200,000 hours divided by the number of exposure hours worked by all employees). FY 2015 Annual Report at 14 n.6.
78 Compare FY 2014 Annual Report at 39 with FY 2015 Annual Report at 14. As of March 13, 2016, the FY 2014 OSHA I&I Rate result was 6.72 (a further upward revision from the FY 2015 result reported in the FY 2015 Annual Report). Responses to CHIR No. 20, question 2.
79 Compare FY 2015 Annual Report at 14, 17 with Responses to CHIR No. 20, question 2.
80 Docket No. ACR2014, May 15, 2015, Responses to CHIR No. 17, question 1. The Postal Service defines recordable accidents as those that require employees to need medical treatment, days away from work, or restricted duty. Id.
Analysis of FY 2015 Performance Report Analysis of Postal Service Performance and FY 2016 Performance Plan
- 47 -
provided in annual performance reports represent a snapshot in time showing the current status of each recordable accident as of the end of the fiscal year. Id.; Responses to CHIR No. 20, question 2. In the FY 2015 Report, the Postal Service asserts that the OSHA I&I Rate decreased between FY 2014 and FY 2015. FY 2015 Annual Report at 17. However, in a CHIR response, the Postal Service clarifies that more recent statistics show that the OSHA I&I Rate increased rather than decreased between FY 2014 and FY 2015. Responses to CHIR No. 20, question 2. The Postal Service’s FY 2015 target for the OSHA I&I rate was 5.10, which was not met. FY 2015 Annual Report at 14. The Postal Service explains that it did not meet the FY 2015 target due to “major changes to the business and a significant increase in new employees who are more at risk for injury.” FY 2015 Annual Report at 18. It describes the most significant major business change as the expansion of Sunday delivery, as well as new delivery areas, such as groceries. March 3, 2016, Responses to CHIR No. 17, question 1. The Postal Service also notes that it hired nearly 40,000 new city carrier assistants in FY 2015. Id. The Postal Service explains that the new delivery areas and new employees resulted in a large increase in Sunday motor vehicle accidents. Id. The FY 2016 target for the OSHA I&I Rate is 6.05. FY 2015 Annual Report at 14. In the FY 2016 Plan, the Postal Service states it will improve workplace safety by focusing more on prevention strategies and taking a more proactive approach toward employee safety. Id. at 18. The Postal Service represents that it will increase its emphasis on employees considered to be at higher risk for accidents. Id. The Postal Service also added a new FY 2016 strategic initiative “Improve Safety Programs” to its Ensure a Safe Workplace and Engaged Workforce performance goal.81 Postal Pulse survey score. For employee engagement, the Postal Service measures performance by administering an employee survey. In past years, the Postal Service measured employee engagement through the Voice of the Employee (VOE) survey. It set a FY 2015 target for the VOE survey score. See FY 2015 Annual Report at 14. In FY 2015, the Postal Service replaced the VOE survey with the Gallup Q12 Employee Engagement Survey, which was introduced to employees as the Postal Pulse survey. Id. at 18. The Postal Pulse survey is a 1-page document that asks participants to rate their level of agreement with 12 statements concerning the workplace on a scale of 1 to 5, with higher numbers reflecting more positive responses.82 Figure III-1 is a copy of the FY 2015 Postal Pulse survey.
81 Responses of the United States Postal Service to Questions 1-6 of Chairman’s Information Request No. 9, February 11, 2016, question 5.b. (February 11, 2016, Responses to CHIR No. 9). Strategic initiatives are discussed in Chapter 4, infra.
82 Responses of the United States Postal Service to Questions 1-6 of Chairman’s Information Request No. 3, January 21, 2016, question 5.c (Responses to CHIR No. 3). In its responses, the Postal Service provided a copy of the Postal Pulse survey in the PDF file, “ChIR.3.Q.5.PP.Survey.pdf.”
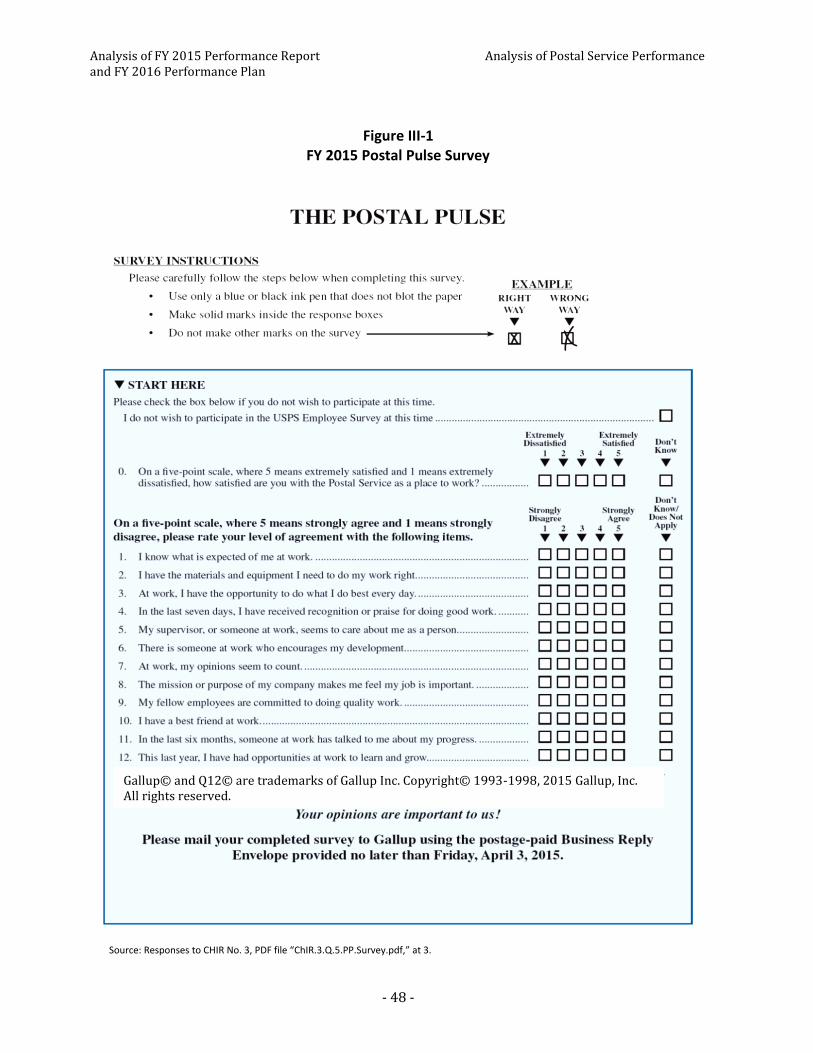
Analysis of FY 2015 Performance Report Analysis of Postal Service Performance and FY 2016 Performance Plan
- 48 -
Figure III-1 FY 2015 Postal Pulse Survey
Source: Responses to CHIR No. 3, PDF file “ChIR.3.Q.5.PP.Survey.pdf,” at 3.
Gallup© and Q12© are trademarks of Gallup Inc. Copyright© 1993-1998, 2015 Gallup, Inc. All rights reserved.

Analysis of FY 2015 Performance Report Analysis of Postal Service Performance and FY 2016 Performance Plan
- 49 -
The Postal Pulse survey score is expressed as the mean score of Items 1 through 12 in the survey. Responses to CHIR No. 3, question 5.c. In FY 2015, the Postal Pulse survey score was 3.16. Id. question 5.b; FY 2015 Annual Report at 19. The Postal Service did not set a FY 2015 target for the Postal Pulse survey score. Responses to CHIR No. 3, question 5.c. It asserts that the FY 2015 target for the VOE survey score cannot be directly compared to the FY 2015 result for the Postal Pulse survey score because the VOE survey measured both engagement and satisfaction, while the Postal Pulse survey measures employee engagement only. Id. The Postal Service plans to use the Postal Pulse survey score as a performance indicator for measuring progress toward improving employee engagement in FY 2016. March 3, 2016, Responses to CHIR No. 17, question 5. However, the Postal Service did not set a FY 2016 target for the Postal Pulse survey score. Responses to CHIR No. 3, question 5.b.
2. Comments OSHA Illness & Injury Rate. The Public Representative comments that the FY 2015 OSHA I&I Rate result fell short of the FY 2015 target by 1.45 points. PR Comments at 12. She asserts that comparing current and historic targets as well as targets and results is problematic because the Postal Service revised both targets and results for prior years. Id. at 12-13. She contends that modifying targets not only complicates the analysis of performance indicators over several years but also makes established targets unreliable. Id. at 13. She recommends that the Postal Service explain why it revises OSHA I&I Rate targets and results. Id. Regarding the FY 2016 OSHA I&I Rate target, she notes that the Postal Service set the target at a more conservative 6.05. Id. at 14. The Postal Service does not discuss the OSHA I&I Rate performance indicator in its reply comments. See USPS Reply Comments. Postal Pulse survey score. The Public Representative observes several challenges with the new Postal Pulse survey score performance indicator. Id. at 12. First, she states that results from the Postal Pulse and VOE surveys cannot be directly compared. Id. Second, she notes the Postal Service did not set a FY 2016 target for the Postal Pulse survey score, which she contends makes comparison of future years difficult, if not impossible. Id. In its reply comments, the Postal Service states that results of the Postal Pulse and VOE surveys cannot be directly compared. USPS Reply Comments at 10. It contends that providing comparable results would require administering both the VOE and Postal Pulse surveys during the same fiscal year, which it asserts is not an effective use of its resources. Id. at 9. The Postal Service explains that it did not set a FY 2016 target for the Postal Pulse survey score because it has not adequately established the baseline for this performance indicator. Id. at 11.

Analysis of FY 2015 Performance Report Analysis of Postal Service Performance and FY 2016 Performance Plan
- 50 -
3. Commission Analysis The Postal Service did not meet the FY 2015 OSHA I&I Rate target and did not provide a comparable FY 2015 target and result for the Postal Pulse survey score. As a result, the Postal Service did not meet the Ensure a Safe Workplace and Engaged Workforce performance goal in FY 2015. In this section, the Commission examines the OSHA I&I Rate and Postal Pulse survey score performance indicators in detail to evaluate FY 2015 performance and recommend actions for improving performance in future years.
a. OSHA Illness & Injury Rate
As previously discussed, OSHA I&I Rate results change after the end of the fiscal year. The Commission observes that these revisions are necessary to ensure accuracy of the OSHA I&I Rate performance indicator. However, these revisions also impede the Commission’s evaluation of whether the Postal Service met the Ensure a Safe Workplace and Engaged Workforce performance goal. The revisions also impact the Postal Service’s assessment of how successful safety communication and training programs were in improving workplace safety during the fiscal year. The Commission recommends that the Postal Service consider adding another workplace safety performance indicator for which results are not revised after the end of the fiscal year. For example, the total number of severe injuries reported to OSHA does not appear to have the same timing issue that causes the OSHA I&I Rate to change.83 Because severe injuries must be reported to OSHA within 24 hours, the total number of severe injuries reported to OSHA does not change after the end of the fiscal year.84 Using a performance indicator that does not change, such as the severe injury rate, would allow the Postal Service to better assess whether its safety and training programs are successful in improving workplace safety, as well as analyze whether changes to existing programs would result in further improvement. In FY 2015, the Postal Service’s communication and training campaigns were targeted to address the most frequent workplace hazards, such as dog bites, extreme temperatures, distracted driving, and proper lifting and reaching. FY 2015 Annual Report at 18. Table III-12 compares the number of accidents for each of the most frequent workplace hazards between FY 2014 and FY 2015. Table III-12 shows that as of March 3, 2016, the total number of accidents due to dog bites, extreme temperatures, distracted driving, and proper lifting and reaching increased between FY 2014 and FY 2015.85
83 As of January 1, 2015, employers must report to OSHA within 24 hours any work-related amputation, in-patient hospitalization, or loss of eye. See David Michaels, Year One of OSHA’s Severe Injury Reporting Program: An Impact Evaluation, March 17, 2016, at 1; https://www.osha.gov/injuryreport/2015.pdf. The requirement to report a fatality within 8 hours was unchanged. Id. The Postal Service ranked as the 5th highest industry group reporting the largest number of severe injuries. Id. at 2-3.
84 Given the 24-hour reporting requirement, the total number of severe injuries that occurred in the fiscal year would be known by September 30 or shortly thereafter and would not change months after the fiscal year closes.
85 Although the number of accidents from “Pulling From/To a Higher Level” and “Pushing at Same Level” slightly decreased year-over-year, the total number of “Lifting and Reaching” accidents increased between FY 2014 and FY 2015.
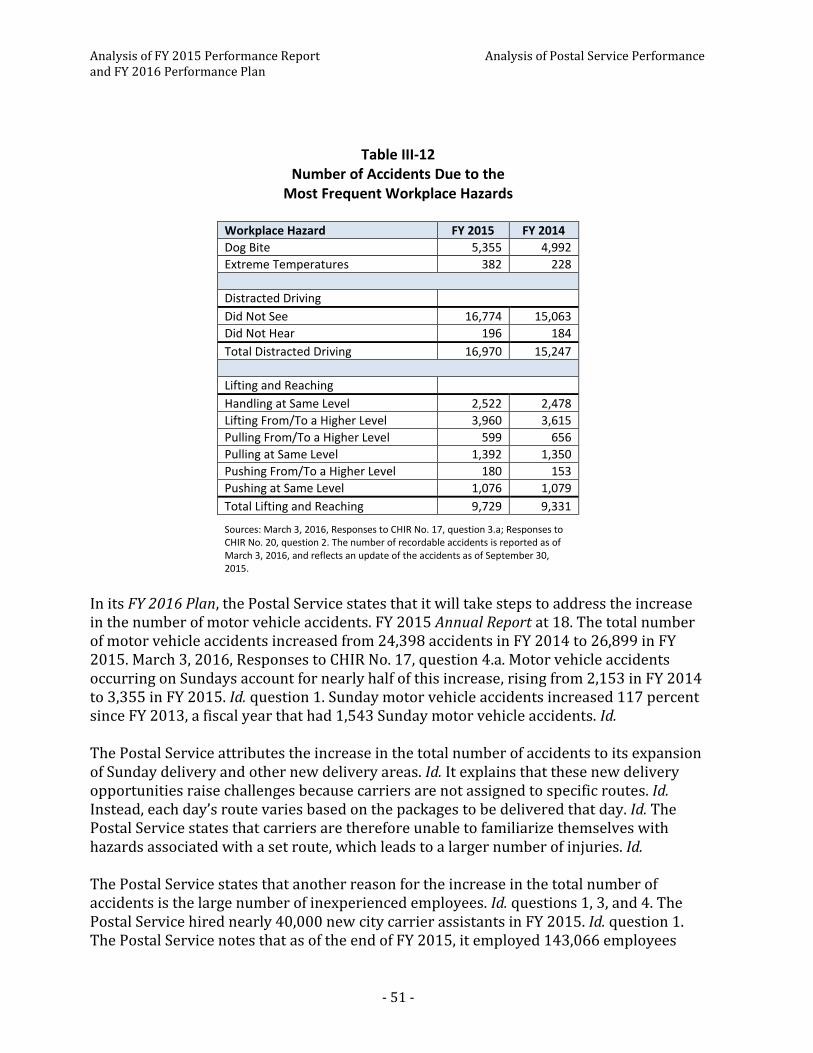
Analysis of FY 2015 Performance Report Analysis of Postal Service Performance and FY 2016 Performance Plan
- 51 -
Table III-12
Number of Accidents Due to the Most Frequent Workplace Hazards
Workplace Hazard FY 2015 FY 2014
Dog Bite 5,355 4,992
Extreme Temperatures 382 228
Distracted Driving
Did Not See 16,774 15,063
Did Not Hear 196 184
Total Distracted Driving 16,970 15,247
Lifting and Reaching
Handling at Same Level 2,522 2,478
Lifting From/To a Higher Level 3,960 3,615
Pulling From/To a Higher Level 599 656
Pulling at Same Level 1,392 1,350
Pushing From/To a Higher Level 180 153
Pushing at Same Level 1,076 1,079
Total Lifting and Reaching 9,729 9,331
Sources: March 3, 2016, Responses to CHIR No. 17, question 3.a; Responses to CHIR No. 20, question 2. The number of recordable accidents is reported as of March 3, 2016, and reflects an update of the accidents as of September 30, 2015.
In its FY 2016 Plan, the Postal Service states that it will take steps to address the increase in the number of motor vehicle accidents. FY 2015 Annual Report at 18. The total number of motor vehicle accidents increased from 24,398 accidents in FY 2014 to 26,899 in FY 2015. March 3, 2016, Responses to CHIR No. 17, question 4.a. Motor vehicle accidents occurring on Sundays account for nearly half of this increase, rising from 2,153 in FY 2014 to 3,355 in FY 2015. Id. question 1. Sunday motor vehicle accidents increased 117 percent since FY 2013, a fiscal year that had 1,543 Sunday motor vehicle accidents. Id. The Postal Service attributes the increase in the total number of accidents to its expansion of Sunday delivery and other new delivery areas. Id. It explains that these new delivery opportunities raise challenges because carriers are not assigned to specific routes. Id. Instead, each day’s route varies based on the packages to be delivered that day. Id. The Postal Service states that carriers are therefore unable to familiarize themselves with hazards associated with a set route, which leads to a larger number of injuries. Id. The Postal Service states that another reason for the increase in the total number of accidents is the large number of inexperienced employees. Id. questions 1, 3, and 4. The Postal Service hired nearly 40,000 new city carrier assistants in FY 2015. Id. question 1. The Postal Service notes that as of the end of FY 2015, it employed 143,066 employees
Analysis of FY 2015 Performance Report Analysis of Postal Service Performance and FY 2016 Performance Plan
- 52 -
with less than 2 years of on-the-job experience, which is approximately 24 percent of the Postal Service’s total number of employees. Id. It states that most of these new employees were hired into city and rural delivery positions and “were involved in nearly 40 percent of all accidents” and “nearly 44 percent of all motor vehicle accidents” that occurred in FY 2015. Id. To reduce the number of motor vehicle accidents in FY 2016, the Postal Service states that it plans to redesign its Safe Driver Training and implement “a strategic training initiative (STI) for supervisors on how to conduct quality driver observations.” Id. question 4.c. It is designating the month of December as Motor Vehicle Safety Month and developing safety programs that focus on distracted driving, winter weather driving, and seatbelt usage. Id. In addition, the Postal Service designed a program for counseling at-risk employees that includes quarterly discussions for all employees with less than 2 years of service, as well as those employees who have had accident(s) or engaged in unsafe work practices. Id. The Postal Service also expects that some of its new street delivery initiatives, such as better map directions and audio turn-by-turn directions (rather than visual turn-by-turn directions), will allow carriers to focus on road conditions and potential hazards as they travel from one delivery point to another. Responses to CHIR No. 20, question 1. The Postal Service notes it is currently testing its audio turn-by-turn directions at a limited number of test sites. Id. It states that if its tests for the audio feature of the turn-by turn directions continue to be successful, “completion of a [n]ational roll out may be possible by the end of FY 2016.” Id. Despite these initiatives, the Postal Service may not be able to substantially improve results if it does not improve employee retention. The Postal Service attributes the increase in the total number of illnesses and injuries associated with dog bites, extreme temperatures, distracted driving, proper lifting and reaching, and motor vehicle accidents to the large number of inexperienced employees,86 which in turn is caused in part by high average annual turnover rates for non-career employees.87 Reducing high turnover rates will reduce the number of inexperienced employees and, consequently, should reduce the total number of illnesses and injuries. The Postal Service states that the Postal Pulse survey items are research-based and “have proven to be statistically valid and reliable over time for measuring employee engagement and its relationship to key business indicators like…accident reduction and employee retention.” FY 2015 Annual Report at 18. The Commission recommends that the Postal Service use the Postal Pulse survey to identify the causes of employee turnover and design programs to reduce turnover rates for non-career employees. In the FY 2016 Report, the Postal Service should describe the steps it has taken to use the Postal Pulse survey data to
86 March 3, 2016, Responses to CHIR No. 17, questions 1, 3, 4.
87 For example, the FY 2015 turnover rates by percentage for city carrier assistants, rural part-time assistants, and postal support employees were 54.24, 30.1, and 36.6, respectively. February 11, 2016, Responses to CHIR No. 9, question 2.c.

Analysis of FY 2015 Performance Report Analysis of Postal Service Performance and FY 2016 Performance Plan
- 53 -
measure the relationships between employee engagement, accident reduction, and employee retention.
b. Postal Pulse Survey Score
As discussed in Chapter 2, supra, replacing the VOE survey with the Postal Pulse survey without providing comparable targets and results from prior fiscal years impacted FY 2015 compliance with 39 U.S.C. § 2804. This provision requires the FY 2015 Report to include comparable FY 2015 targets and results, as well as comparable results across fiscal years 2012, 2013, 2014, and 2015. See 39 U.S.C. § 2804(b)(1), (c). Each statutory requirement is discussed below.
(1) FY 2015 Target and Result Comparability
39 U.S.C. § 2804(b)(1) requires annual performance reports to “set forth the performance indicators established in the Postal Service performance plan, along with the actual program performance achieved compared with the performance goals expressed in the plan for that fiscal year.” 39 U.S.C. § 2804(b)(1). This provision requires the FY 2015 Report to set forth the performance indicators in the FY 2015 Plan and compare FY 2015 results with FY 2015 targets. The Postal Service set a FY 2015 target for the VOE survey score but did not set a FY 2015 target for the Postal Pulse survey score.88 The only available data for evaluating FY 2015 performance are the FY 2015 target for the VOE survey score and the FY 2015 result for the Postal Pulse survey score. The Postal Service asserts that the VOE and Postal Pulse survey scores cannot be directly compared. Responses to CHIR No. 3, question 5.c. Without a comparable FY 2015 target and result, the FY 2015 Report does not comply with 39 U.S.C. § 2804(b)(1) for the Postal Pulse survey score performance indicator. The Postal Service confirms that it will use the Postal Pulse survey as a performance indicator for measuring progress toward improving employee engagement in FY 2016. Responses to CHIR No. 17, question 5. The Postal Service explains that it did not set a FY 2016 target for the Postal Pulse survey score because it has not adequately established the baseline for this performance indicator. USPS Reply Comments at 11. The Postal Service states that the Postal Pulse survey is supposed to be administered twice a year, but the Postal Service administered the Postal Pulse survey only once in FY 2015. Id. The Postal Service asserts that it must administer the Postal Pulse survey for a full cycle (twice per year) before it can effectively establish targets. Id. Without a FY 2016 target for the Postal Pulse survey score, the Commission will again be unable to evaluate whether the Postal Service met its FY 2016 employee engagement goal. In FY 2016, the Postal Service should administer the Postal Pulse survey for a full cycle. It should then set a FY 2017 target for the Postal Pulse survey score and provide the basis for selecting this target. In FY 2016, the Postal Service should take steps to increase the FY 2015
88 FY 2015 Annual Report at 14; Responses to CHIR No. 3, questions 5.b., 5.c.

Analysis of FY 2015 Performance Report Analysis of Postal Service Performance and FY 2016 Performance Plan
- 54 -
mean score of 3.16. It should assess its progress at the end of FY 2016 by comparing the FY 2015 and FY 2016 results for the comparable test period.
(2) Comparable 3-Year Results
39 U.S.C. § 2804(c) requires annual performance reports to include “actual results for the three preceding fiscal years.” 39 U.S.C. § 2804(c). This provision requires the FY 2015 Report to include comparable results for fiscal years 2012, 2013, 2014, and 2015.89 In the FY 2015 Report, the Postal Service states that the FY 2015 Postal Pulse survey score result is 3.16 on a scale of 1 to 5. FY 2015 Annual Report at 19. It asserts that Postal Pulse survey “results equate closely to the overall response rate and favorability ratings of [the] FY[ ]2014 end-of-year VOE survey results.” Id. It notes that the FY 2014 VOE survey response rate was only 4 points above the Postal Pulse survey response rate of 47 percent. Responses to CHIR No. 15, question 3.a. It also observes that the FY 2014 VOE survey score and FY 2015 Postal Pulse survey score were each slightly more than midpoint of their respective scales. Id. However, the Postal Service emphasizes that the VOE and Postal Pulse survey scores cannot be directly compared because the surveys and what they measure are different. Id. Because the Postal Service does not compare employee engagement results across fiscal years 2012 through 2015, the FY 2015 Report does not comply with 39 U.S.C. § 2804(c) for the Postal Pulse survey score performance indicator. To allow for some cross-year comparison in FY 2016, the Commission recommends that the Postal Service use the same methodology for calculating the FY 2016 Postal Pulse survey score result to ensure that FY 2015 and FY 2016 results are comparable. The Postal Service provides two reasons for not comparing results between the VOE and Postal Pulse surveys. However, neither reason adequately explains why the Postal Service could not compare results between the surveys. First, the Postal Service contends that the VOE survey measures both employee engagement and satisfaction, while the Postal Pulse survey only measures employee engagement. Responses to CHIR No. 3, question 5.c. Gallup defines “a direct measure of affective satisfaction” as “an attitudinal outcome or direct measure of how people feel about their organization.”90 Item 0 on the Postal Pulse survey asks:
On a [5-point] scale, where 5 means extremely satisfied and 1 means extremely dissatisfied, how satisfied are you with the Postal Service as a place to work?
89 The Postal Service contends that 39 U.S.C. § 2804(c) does not require “actual results for the three preceding fiscal years” to be comparable. FY 2015 ACR at 61-62; see 39 U.S.C. § 2804(c). The Commission previously found that “actual results” must also be comparable across all three preceding fiscal years to ensure meaningful evaluation of performance across these years. FY 2014 Analysis at 12; see Chapter 2, supra.
90 Gallup, The Relationship Between Engagement at Work and Organizational Outcomes, 2012 Q12 Meta-Analysis, February 2013, at 8 (Gallup Report); http://www.gallup.com/services/177047/q12-meta-analysis.aspx.
Analysis of FY 2015 Performance Report Analysis of Postal Service Performance and FY 2016 Performance Plan
- 55 -
Responses to CHIR No. 3, PDF file “ChIR.3.Q.5.PP.Survey.pdf,” at 3. Item 0 specifically measures overall employee satisfaction and plainly meets Gallup’s definition of a measure of affective satisfaction. On its face, it appears that the Postal Pulse survey does measure both employee engagement and overall employee satisfaction. Second, the Postal Service contends that comparing employee engagement results across fiscal years would require it to administer both the VOE and Postal Pulse surveys simultaneously. USPS Reply Comments at 9. However, the Postal Service could have identified and compared results of similar items from both surveys or retained or modified a survey item from the VOE survey to include on the Postal Pulse survey. The Postal Service previously used this approach when it revised the Customer Care Center survey in FY 2015. Although the Postal Service added new questions and made other changes to the survey, the Postal Service retained similar questions to facilitate comparisons across fiscal years. As a result, changes to the survey did not affect the comparability of results for the Customer Care Center performance indicator.91 The Commission recommends the Postal Service reconsider whether any results can be compared between the VOE and Postal Pulse surveys and provide such comparable results for fiscal years 2013, 2014, 2015, and 2016 in the FY 2016 Report. For example, Item 0 (Overall Satisfaction) on the Postal Pulse survey is similar to Item 32 on the VOE survey, which asks respondents to rate their level of agreement with the statement, “I would recommend the Postal Service as a place to work to family and friends.”92 The Postal Service could compare FY 2013 and FY 2014 results of Item 32 on the VOE survey with FY 2015 and FY 2016 results of Item 0 on the Postal Pulse survey.93 If the Postal Service makes additional changes to the Postal Pulse survey that affect comparability, the Commission recommends that the revised survey retain at least one item that can be compared to the previous survey.
(3) Performance Indicator Recommendations
The Postal Service will use the Postal Pulse survey score as a performance indicator in FY 2016 for the Ensure a Safe Workplace and Engaged Workforce goal. This section discusses the Commission’s suggestions for most effectively measuring employee engagement using the Postal Pulse survey. The Postal Service expressed the FY 2015 Postal Pulse survey result as the mean score of Items 1 through 12 in the survey. The Postal Service did not set a FY 2016 target for the Postal Pulse survey score performance
91 See Chapter 3, section B for further discussion of the Customer Care Center performance indicator.
92 In Docket No. ACR2010, the Postal Service provided a copy of the VOE survey in response to an information request. See Docket No. ACR2010, Library Reference USPS–FY10–44, February 28, 2011, PDF file "ChIR.4.Q.21.VOE.Survey.pdf."
93 The Postal Service can include FY 2015 results for Item 0 based on the information already collected from the FY 2015 Postal Pulse survey.

Analysis of FY 2015 Performance Report Analysis of Postal Service Performance and FY 2016 Performance Plan
- 56 -
indicator. However, it did set goals for the Postal Pulse survey based on the response rate and number of business units participating in action planning.94 Measuring the response rate and number of participating business units is relevant to action planning and may help implement the actionable items related to employee responses to items on the Postal Pulse survey. However, the mean score is a better measure of employee engagement because it directly reflects responses from the survey. The Postal Service itself states the intent of the Postal Pulse survey is to measure employee engagement. Responses to CHIR No. 3, question 5.c. In addition to the mean score, the Postal Service should consider comparing results of specific items on the Postal Pulse Survey to measure employee engagement over time. Items 1 through 12 “explain why people are satisfied and why they become engaged and affect outcomes.” Gallup Report at 8. For FY 2015, the Postal Service provided the mean score of Items 1 through 12. The Postal Service later provided disaggregated results in response to a CHIR.95 The Commission observes that disaggregated year-over-year results from a single item may provide more specific insight than the mean score of Items 1 through 12. Although a mean score can evaluate progress, it does not identify which survey item(s) need the most improvement and whether initiatives are successfully targeting the most problematic areas. The Commission recommends that the Postal Service continue setting targets and measuring results using the mean score of Items 1 through 12 on the Postal Pulse survey. The Postal Service should also consider setting targets and measuring results for specific items in the Postal Pulse survey. In the FY 2016 Plan, the Commission recommends that the Postal Service compare FY 2015 and FY 2016 results of these specific items and explain how they relate to the FY 2015 and FY 2016 mean scores. To ensure comparability with FY 2015 results, the Postal Service should include FY 2015 results for these items based on the information already collected from the FY 2015 Postal Pulse survey.
D. Sustain Controllable Income
1. Background The Postal Service uses two performance indicators to measure progress toward its Sustain Controllable Income goal: Deliveries per Workhour (DPWH) and Net Controllable Income (Loss).
94 Responses to CHIR No. 3, question 5.b. “Response rate” identifies the percentage of employees who submit responses to questions on the survey. Responses to CHIR No. 17, question 6. A business unit is “a postal manager at or above the EAS-18 grade level e and his/her team of employees.” February 26, 2016, Responses to CHIR No. 13, question 15.b. There are approximately 18,000 business units. Id.
95 See February 26, 2016, Responses to CHIR No. 13, question 14, file “ChiR.13.Q.14.Resp.Postal_Pulse.xlsx,” tab “Employee Engagement Crosstab.”

Analysis of FY 2015 Performance Report Analysis of Postal Service Performance and FY 2016 Performance Plan
- 57 -
Deliveries per Workhour. The Postal Service explains that DPWH is a summary measure that reflects the effectiveness of its productivity improvement efforts. FY 2015 Annual Report at 19. DPWH compares the total number of deliveries of all types with the total number of workhours used in all employee categories. FY 2014 Analysis at 40. The total number of deliveries is calculated by multiplying the total number of delivery points by the annual number of delivery days. Id. This number is then divided by the total number of workhours used in all employee categories, including managers and executives. Id. The result is the DPWH, which represents the average number of possible deliveries per employee workhour. The FY 2015 target for DPWH changed between the FY 2015 Plan and the FY 2015 Report. In the FY 2015 Plan, the Postal Service initially set the FY 2015 target at 43.3. FY 2014 Annual Report at 39. However, in Docket No. ACR2014, the Postal Service noted in an Excel file that the FY 2015 target “is 42.4 not 43.3 as originally displayed in the Annual Report to Congress.”96 The revised target is reflected in the FY 2015 Report. See FY 2015 Annual Report at 14. In FY 2015, the DPWH result was 41.5, which failed to meet both the initial and revised FY 2015 targets. See FY 2015 Annual Report at 14, 19. The Postal Service explains that it did not meet its DPWH performance target “due to an overrun of the work hour plan.” Id. at 19. It states that several factors contributed to the overrun of the workhour plan:
Additional workload caused by more volumes and delivery points than expected Strong growth in Sunday package delivery Delay in plant consolidations Not capturing all workhour savings from the second phase of Network
Rationalization Additional workhours from the hiring, training, learning curve, and turnover rate of
non-career employees Arbitration award affecting Level 18 postmaster work rules
Id. The FY 2016 DPWH target is 42.0, which is lower than the FY 2015 target of 42.4. FY 2015 Annual Report at 14. The Postal Service states it will meet the FY 2016 target by capturing workhour reductions from decreased volume as offset by the projected growth in packages. Id. at 20. It asserts it will also capture workhour savings from operational initiatives. Id.
96 Docket No. ACR2014, February 18, 2015, Responses to CHIR No. 5, question 7, file “ChIR5.Q7.DPH FY15.xlsx,” tab “FY15 DPH Summary” Notes section.

Analysis of FY 2015 Performance Report Analysis of Postal Service Performance and FY 2016 Performance Plan
- 58 -
Net Controllable Income (Loss). The result of this performance indicator is calculated as the Postal Service’s total revenue minus certain expenses: the Postal Service Retiree Health Benefit Fund prefunding payments, workers’ compensation interest rate changes, and the amortization of the Postal Service’s unfunded liability for its portion of the Federal Employees Retirement System. Id. The Postal Service explains that because these expenses are not under management control, analyzing operating results without these expenses provides better insight into Postal Service operations. Id. Similar to the DPWH performance indicator, the FY 2015 target for Net Controllable Income (Loss) changed between the FY 2015 Plan and the FY 2015 Report. In the FY 2015 Plan, the Postal Service initially set the FY 2015 Net Controllable Income (Loss) target at $0.5 billion. FY 2014 Annual Report at 39. In the FY 2015 Report, the Postal Service explains that the FY 2015 target was increased to $1.1 billion to reflect additional savings from changes in the employee mix that were not reflected in the initial FY 2015 Plan. FY 2015 Annual Report at 14, 20. In FY 2015, Net Controllable Income (Loss) was $1.19 billion, which was $0.09 billion better than the FY 2015 revised target of $1.1 billion. Id. at 14. The Postal Service explains that revenue increased in FY 2015 primarily due to a rate adjustment implemented in May 2015 and the temporary exigent surcharge on market dominant products that was effective throughout FY 2015. Id. at 20. It states that revenue from Shipping and Packages and Standard Mail increased between FY 2014 and FY 2015 by 11.4 percent and 1.3 percent respectively. Id. However, it notes that overall volume declined by 1.38 billion pieces, and First-Class Mail decreased by 1.42 billion pieces. Id. The Net Controllable Income (Loss) target for FY 2016 is $0.1 billion. Id. The Postal Service states that it expects to lose $1 billion in revenue in FY 2016 due to the removal of the exigent surcharge. Id. at 22. However, it projects revenue growth of $0.4 billion in FY 2016 due to continued growth in Shipping and Packages volume (as offset by decreases in First-Class Mail and Standard Mail). Id. It predicts that economic and e-commerce growth will increase Shipping and Packages revenue to $1.8 billion by increasing volume 5.7 percent. Id.
2. Comments Deliveries per Workhour. The Public Representative states that DPWH results increased from FY 2011 through FY 2014, but decreased slightly in FY 2015 to 41.5. PR Comments at 15. She notes that the Postal Service missed the revised FY 2015 target of 42.4 even though the FY 2015 result was lower than both the FY 2014 and initial FY 2015 targets. Id. She observes that the Postal Service’s reasons for not meeting the FY 2015 DPWH target are almost the same as its reasons for not meeting the FY 2014 target. Id. at 15-16. She contends that the Postal Service should have considered these factors within its operations. Id. at 16. She suggests that the Postal Service develop and provide the Commission a list of preventive measures that may help the Postal Service meet the FY 2016 target. Id. The Public Representative notes that the Postal Service has not met its

Analysis of FY 2015 Performance Report Analysis of Postal Service Performance and FY 2016 Performance Plan
- 59 -
DPWH target in the five years since it replaced the Total Factor Productivity performance indicator with DPWH in FY 2011. Id. In its reply comments, the Postal Service responds that the Public Representative does not consider the many factors affecting the Postal Service’s ability to meet the Sustain Controllable Income performance goal. USPS Reply Comments at 11-12. The Postal Service contends that the Public Representative’s comments regarding the DPWH target are based on incorrect assumptions. Id. at 12. The Postal Service explains that it set the FY 2015 target based on expected impacts of elements known when it developed the FY 2015 Plan. Id. at 11. It asserts that it did not expect volume, delivery points, and Sunday packages to exceed planned levels. Id. at 11-12. It also contends that it could not have predicted delays in plant consolidations or the need to spend additional workhours to improve service. Id. at 12. It notes that it did not achieve planned savings from the second phase of Network Rationalization and also had to account for a labor arbitration ruling that increased workhours in Level 18 post offices. Id. The Postal Service recognizes that it has not met the DPWH target in the past five years. Id. It observes that significant growth in package volume and the slowing of declines in First-Class Mail have caused more workhours than planned, which adversely impacted the DPWH performance indicator. Id. at 13. However, it points out that additional workhours also increased revenues, which helped the Postal Service improve its financial performance. Id. at 12. It asserts that meeting the Sustain Controllable Income performance goal requires improvement to both revenue and expenses. Id. It states it has made efforts to capture workhour savings from efficiency improvement initiatives such as the Network Rationalization Initiative and equipment purchases. Id. Nevertheless, it acknowledges that efforts to increase revenue contributed to the decline in the DPWH performance indicator. Id. at 12-13. Net Controllable Income (Loss). The Public Representative observes that the FY 2015 Net Controllable Income result of $1.19 billion exceeds the FY 2015 target of $1.1 billion. PR Comments at 14. She asserts that FY 2014 and FY 2015 results indicate a significant improvement compared to the losses experienced from FY 2011 through FY 2013. Id. Considering that the Postal Service met the FY 2015 Net Controllable Income (Loss) target, the Public Representative concludes that the Postal Service partially met the Sustain Controllable Income performance goal in FY 2015. Id. at 16. By contrast, the Postal Service contends that it did meet its Sustain Controllable Income goal because it exceeded the Net Controllable Income target. USPS Reply Comments at 13. The Postal Service acknowledges that workhours impact both the DPWH and the Net Controllable Income (Loss) performance indicators and that increased revenue associated with increased workhours “drive controllable income.” Id. at 12-13. To meet the FY 2016 target for both performance indicators, the Postal Service plans to continue reducing workhours and maximizing the non-career and Tier 2 career workforce, as well as focus on controlling non-personnel related spending and transportation usage. Id. at 13.
Analysis of FY 2015 Performance Report Analysis of Postal Service Performance and FY 2016 Performance Plan
- 60 -
3. Commission Analysis In FY 2015, the Postal Service exceeded the revised Net Controllable Income (Loss) target, but missed the revised DPWH target. Consequently, the Commission finds that the Postal Service partially met the Sustain Controllable Income performance goal in FY 2015. In Chapter 3, Section B.1, supra, the Commission describes how FY 2015 targets for the Provide Excellent Customer Experience performance indicators are not consistently presented between the FY 2015 Plan and the FY 2015 Report. Similarly, FY 2015 targets for both the DPWH and Net Controllable Income (Loss) performance indicators changed between the FY 2015 Plan and the FY 2015 Report. As with the Provide Excellent Customer Experiences goal, the revised FY 2015 targets for DPWH and Net Controllable Income (Loss) impedes the Commission’s evaluation of whether the Postal Service met the Sustain Controllable Income goal. The Commission reiterates its recommendation that the Postal Service not revise FY 2016 targets. If circumstances merit revising a target, the Postal Service should describe why the revision was necessary given the circumstances, and how the revision appropriately captures the changed circumstances. Below the Commission analyzes the DPWH and Net Controllable Income (Loss) performance indicators in more detail.
a. Deliveries per Workhour
The Postal Service planned to reduce workhours by 5 million in FY 2015.97 Instead, the number of workhours increased by 21 million workhours (1.9 percent) between FY 2014 and FY 2015, which was the first workhour increase since FY 2005.98 The largest increases in workhours were for delivery, customer service, and retail. Id. The increased number of workhours caused the DPWH result to decline in FY 2015. As the Public Representative observes, the Postal Service has not met the DPWH target since this performance indicator was introduced in FY 2011. From FY 2011 to FY 2014, the DPWH result improved incrementally and moved closer to its target because the Postal Service reduced workhours in each of those years. However, this trend ended in FY 2015 when total workload grew by 0.7 percent, the first growth since FY 2006. Id. at 18. The growth in total workload was primarily due to increases in the number of delivery points and weighted mail volume. Id. Beginning in FY 2016, the Postal Service states it will make two methodology changes to the formula for calculating the DPWH performance indicator “to account for the growth
97 FY 2015 Integrated Financial Plan at 2.
98 Id. at 4; Financial Analysis of United States Postal Service Financial Results and 10-K Statement Fiscal Year 2015, March 29, 2016, at 14 (FY 2015 Financial Analysis).
Analysis of FY 2015 Performance Report Analysis of Postal Service Performance and FY 2016 Performance Plan
- 61 -
items that are unknown in advance and cannot be factored into the target.” Responses to CHIR No. 20, question 4. First, it will adjust the number of delivery days used in the DPWH formula to account for the impact of Sunday package delivery. March 9, 2016, Responses to CHIR No. 17, question 7. The current DPWH formula multiplies the total number of delivery points by the total number of annual delivery days excluding Sundays and holidays.99 The Postal Service states the revised DPWH formula will “account for the additional Sundays as a fraction of a day based on the percentage of delivery points served on Sundays.” March 9, 2016, Responses to CHIR No. 17, question 7. The Commission finds that accounting for Sunday delivery is an improvement to the current DPWH calculation methodology, which does not account for the additional workload of Sunday deliveries, yet includes Sunday workhours as part of total workhours. Because Sunday delivery began in October 2013, the Commission recommends that in addition to recalculating the FY 2015 and FY 2016 results, the Postal Service should also recalculate the FY 2014 result using the revised methodology and include the revised results in the FY 2016 Report.100 Second, the Postal Service will adjust the number of workhours that result from weighted mail volume changes. March 9, 2016, Responses to CHIR No. 17, question 20. The Postal Service explains that these workhours contribute to “profitable revenues that help the Postal Service’s net financial position.” Id. In its FY 2014 Analysis, the Commission identified several issues with the DPWH performance indicator, including the simplicity of its components and calculation. FY 2014 Analysis at 46. It recommended that the Postal Service replace the DPWH performance indicator or add other financial and productivity performance indicators to measure progress toward the Sustain Controllable income performance goal. Id. at 47. The proposed methodology changes to the formula for calculating DPWH appear to address some of the issues with this performance indicator. In Docket No. ACR2016, the Commission will reevaluate the effectiveness of the DPWH performance indicator in light of these methodology changes in its analysis of the FY 2016 Report and FY 2017 Plan. The Postal Service states that no adjustment to the FY 2016 DPWH target is needed as a result of these methodological changes because the projected FY 2016 workhours were already adjusted to account for the new packaging volume workload. Responses to CHIR No. 20, question 4. In the FY 2016 Report, the Commission recommends that the Postal Service explain its methodology for adjusting the workhours in the DPWH formula to account for year-to-year changes in weighted mail volumes.
99 See Docket No. ACR2014, Responses to CHIR No. 5, February 18, 2015, question 7, file “ChIR5.Q7.DPH FY 15.xlsx.”
100 See United States Postal Service Office of Inspector General, Sunday Parcel Delivery Service, Report Number, DR-AR-15-002, December 5, 2014, at 1; https://www.uspsoig.gov/sites/default/files/document-library-files/2015/dr-ar-15-002.pdf.

Analysis of FY 2015 Performance Report Analysis of Postal Service Performance and FY 2016 Performance Plan
- 62 -
The Postal Service states it did not meet the FY 2015 DPWH target, partly because the total number of delivery points was higher than planned. FY 2015 Annual Report at 18. In the FY 2016 Integrated Financial Plan, the Postal Service states that the economy is projected to show further improvement in FY 2016 due to a number of factors, including “a rebounding housing market.”101 A rebounding housing market could result in the creation of more delivery points. The Commission recommends that in the FY 2016 Report, the Postal Service explain whether and how the FY 2016 DPWH performance indicator accounts for any increase in the number of delivery points and associated workhours caused by the rebounding housing market. The Postal Service should also describe any modifications it makes in the development of forecasted delivery points used to calculate the FY 2017 DPWH target. The Postal Service states that its compensation expense grew in FY 2015 in part due to the additional workhours associated with the growth in the more labor-intensive Shipping and Package business.102 The Postal Service states that “[s]ignificant growth in package volume and the slowing of declines in First-Class Mail have caused work hours to overrun plan… .” USPS Reply Comments at 13. However, in recent years the Postal Service appears to have more accurately planned for the Shipping and Packages volume and consistently overestimated declines in First-Class Mail volumes. Decreases in First-Class Mail volume have been much smaller than forecasted for the last four fiscal years.103 For example, in the FY 2015 Integrated Financial Plan, the Postal Service projected that First-Class Mail volumes would decline by 3.3 billion pieces, but the actual volume decrease was approximately 1 billion pieces. FY 2016 Integrated Financial Plan at 3. Table III-13 compares the projected and actual mail volumes presented in the Integrated Financial Plan from FY 2012 through FY 2015.
101 FY 2016 Integrated Financial Plan at 2.
102 Postal Service FY 2015 Form 10-K at 19.
103 The Postal Service’s Revenue and Volume Forecast group initiates the budget process by developing mail volume forecasts for the upcoming fiscal year. These volume forecasts are included in the Integrated Financial Plan which consists of the operating, capital, and financing plans for the fiscal year. See United States Postal Service Office of Inspector General, U.S. Postal Service Budget Formulation and Execution Process, Report Number DP-MA-13-002, August 7, 2013, Highlights (USPS OIG Budget Formulation); https://uspsoig.gov/sites/default/files/document-library-files/2015/dp-ma-13-002.pdf.
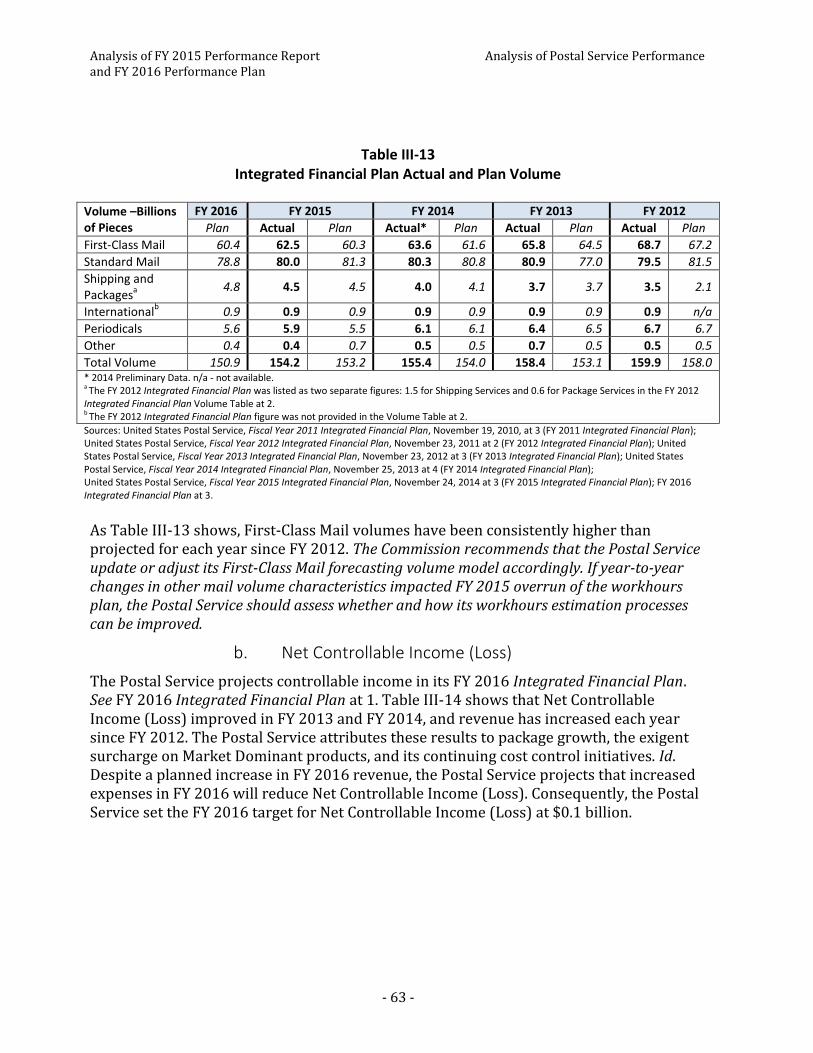
Analysis of FY 2015 Performance Report Analysis of Postal Service Performance and FY 2016 Performance Plan
- 63 -
Table III-13
Integrated Financial Plan Actual and Plan Volume
Volume –Billions of Pieces
FY 2016 FY 2015 FY 2014 FY 2013 FY 2012
Plan Actual Plan Actual* Plan Actual Plan Actual Plan
First-Class Mail 60.4 62.5 60.3 63.6 61.6 65.8 64.5 68.7 67.2
Standard Mail 78.8 80.0 81.3 80.3 80.8 80.9 77.0 79.5 81.5
Shipping and Packages
a
4.8 4.5 4.5 4.0 4.1 3.7 3.7 3.5 2.1
Internationalb 0.9 0.9 0.9 0.9 0.9 0.9 0.9 0.9 n/a
Periodicals 5.6 5.9 5.5 6.1 6.1 6.4 6.5 6.7 6.7
Other 0.4 0.4 0.7 0.5 0.5 0.7 0.5 0.5 0.5
Total Volume 150.9 154.2 153.2 155.4 154.0 158.4 153.1 159.9 158.0 * 2014 Preliminary Data. n/a - not available. a The FY 2012 Integrated Financial Plan was listed as two separate figures: 1.5 for Shipping Services and 0.6 for Package Services in the FY 2012 Integrated Financial Plan Volume Table at 2. b The FY 2012 Integrated Financial Plan figure was not provided in the Volume Table at 2.
Sources: United States Postal Service, Fiscal Year 2011 Integrated Financial Plan, November 19, 2010, at 3 (FY 2011 Integrated Financial Plan); United States Postal Service, Fiscal Year 2012 Integrated Financial Plan, November 23, 2011 at 2 (FY 2012 Integrated Financial Plan); United States Postal Service, Fiscal Year 2013 Integrated Financial Plan, November 23, 2012 at 3 (FY 2013 Integrated Financial Plan); United States Postal Service, Fiscal Year 2014 Integrated Financial Plan, November 25, 2013 at 4 (FY 2014 Integrated Financial Plan); United States Postal Service, Fiscal Year 2015 Integrated Financial Plan, November 24, 2014 at 3 (FY 2015 Integrated Financial Plan); FY 2016 Integrated Financial Plan at 3.
As Table III-13 shows, First-Class Mail volumes have been consistently higher than projected for each year since FY 2012. The Commission recommends that the Postal Service update or adjust its First-Class Mail forecasting volume model accordingly. If year-to-year changes in other mail volume characteristics impacted FY 2015 overrun of the workhours plan, the Postal Service should assess whether and how its workhours estimation processes can be improved.
b. Net Controllable Income (Loss)
The Postal Service projects controllable income in its FY 2016 Integrated Financial Plan. See FY 2016 Integrated Financial Plan at 1. Table III-14 shows that Net Controllable Income (Loss) improved in FY 2013 and FY 2014, and revenue has increased each year since FY 2012. The Postal Service attributes these results to package growth, the exigent surcharge on Market Dominant products, and its continuing cost control initiatives. Id. Despite a planned increase in FY 2016 revenue, the Postal Service projects that increased expenses in FY 2016 will reduce Net Controllable Income (Loss). Consequently, the Postal Service set the FY 2016 target for Net Controllable Income (Loss) at $0.1 billion.

Analysis of FY 2015 Performance Report Analysis of Postal Service Performance and FY 2016 Performance Plan
- 64 -
Table III-14
Statement of Operations
In Billions ($) FY 2016 Target
FY 2015 Result
FY 2014 Result
FY 2013 Result
FY 2012 Result
Revenuea 69.3 68.9 67.8 66.0 65.2
Controllable Expensesb 69.2 67.7 66.4
Operating Expensesc 67.0 67.6
Net Controllable Income (Loss)d 0.1 1.2 1.4
Operating Income (Loss)e (1.0) (2.4)
a FY 2013 revenue excludes $1.3 billion change in accounting estimate for Deferred Revenue – Prepaid Postage. b Controllable expenses include net interest expense. For FY 2015 and FY 2016, controllable expenses do not include Retiree Health Benefits (RHB) pre-funding, FERS unfunded liability amortization and non-cash adjustments to workers’ compensation liabilities. For FY 2012-FY 2014, controllable expenses do not include RHB pre-funding, and non-cash adjustments to workers’ compensation liabilities. c Operating expenses exclude net interest expense. d The Postal Service used Net Controllable Income (Loss) as the performance indicator after FY 2013 and it is calculated as revenue minus controllable expenses.
e The Postal Service used Operating Income (Loss) as the performance indicator in FY 2012 and FY 2013 and it is calculated as revenue minus operating expenses.
Sources: FY 2016 Integrated Financial Plan at 1; FY 2015 Integrated Financial Plan at 1; FY 2014 Integrated Financial Plan at 1; FY 2013 Integrated Financial Plan at 1; FY 2014 Financial Analysis at 7; FY 2013 Financial Analysis at 3.
The Postal Service asserts that “achieving the target for the Controllable Income metric involves efforts on both the revenue and expense side.” USPS Reply Comments at 12. The Postal Service represents that to meet its FY 2016 targets, it will control non-personnel-related spending and transportation usage. Id. at 13. However, non-personnel expenses are expected to grow due to expenditures for information systems, support for its package growth initiatives, repairs to its aging vehicle fleet, and additional funding for cyber security projects.104 The Postal Service also expects FY 2016 transportation costs to increase due to additional package growth and increased air-lift and highway transportation needs. Id. at 5. The Postal Service states that its efforts to increase revenue growth in package volume caused more workhours than planned and that it is “working hard to capture work hour savings from Network Rationalization, equipment purchases, and other efficiency improvement initiatives[.]” USPS Reply Comments at 12. The Postal Service also asserts that the strategic initiatives have been able to drive significant revenue and cost-savings measures that improve the Postal Service’s financial outlook in FY 2015 and beyond. FY 2015 Annual Report at 64. However, only revenue-related performance measures have been used recently to measure performance of initiatives that support the Postal Service’s Controllable Income goal.105 The Commission recommends that the Postal Service include additional performance indicators in its FY 2016
104 FY 2016 Integrated Financial Plan at 4.
105 See FY 2014 Analysis at 56-57 and Table IV-4.
Analysis of FY 2015 Performance Report Analysis of Postal Service Performance and FY 2016 Performance Plan
- 65 -
Annual Report that quantify cost savings from strategic initiatives and capital investments and show how they are producing intended cost savings over time. The Postal Service states that while increased workhours resulted in not meeting its FY 2015 DPWH target, some of the additional workhours resulted from greater volumes than planned, which helped improve the Postal Service’s financial performance. USPS Reply Comments at 12. Table III-15 shows that total operating expenses increased in FY 2015.
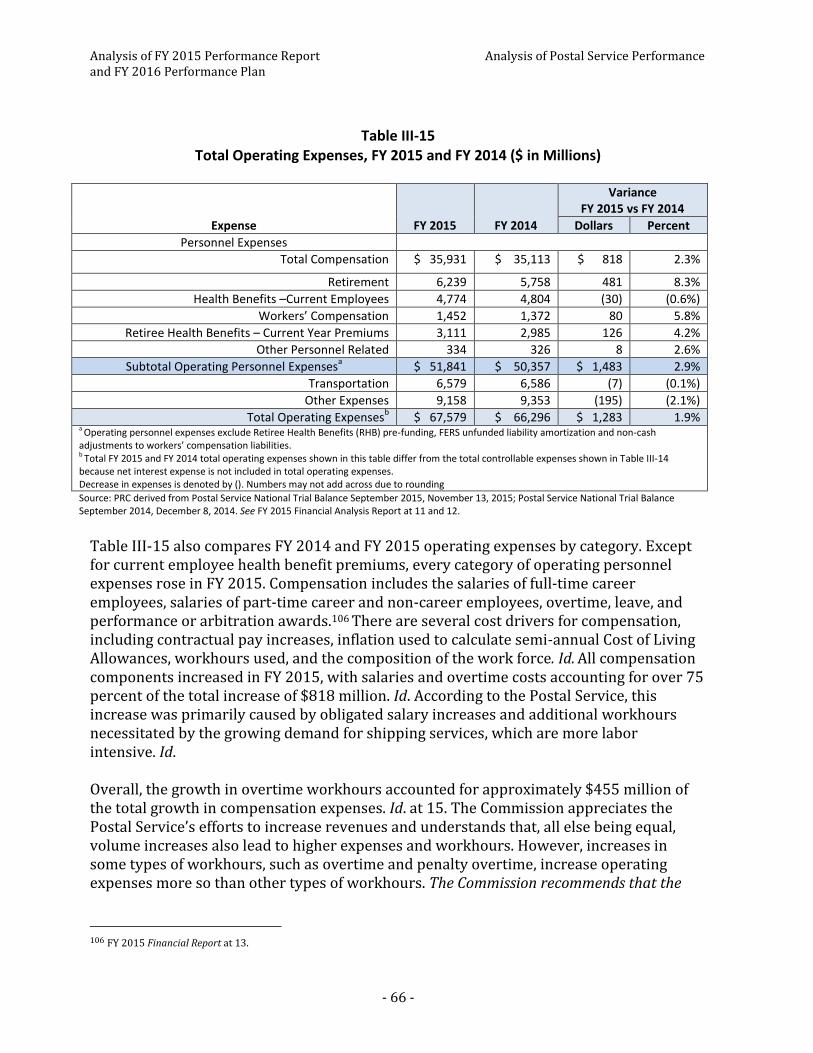
Analysis of FY 2015 Performance Report Analysis of Postal Service Performance and FY 2016 Performance Plan
- 66 -
Table III-15 Total Operating Expenses, FY 2015 and FY 2014 ($ in Millions)
Expense FY 2015 FY 2014
Variance FY 2015 vs FY 2014
Dollars Percent
Personnel Expenses
Total Compensation $ 35,931 $ 35,113 $ 818 2.3%
Retirement 6,239 5,758 481 8.3%
Health Benefits –Current Employees 4,774 4,804 (30) (0.6%)
Workers’ Compensation 1,452 1,372 80 5.8%
Retiree Health Benefits – Current Year Premiums 3,111 2,985 126 4.2%
Other Personnel Related 334 326 8 2.6%
Subtotal Operating Personnel Expensesa $ 51,841 $ 50,357 $ 1,483 2.9%
Transportation 6,579 6,586 (7) (0.1%)
Other Expenses 9,158 9,353 (195) (2.1%)
Total Operating Expensesb $ 67,579 $ 66,296 $ 1,283 1.9%
a Operating personnel expenses exclude Retiree Health Benefits (RHB) pre-funding, FERS unfunded liability amortization and non-cash adjustments to workers’ compensation liabilities. b Total FY 2015 and FY 2014 total operating expenses shown in this table differ from the total controllable expenses shown in Table III-14 because net interest expense is not included in total operating expenses. Decrease in expenses is denoted by (). Numbers may not add across due to rounding
Source: PRC derived from Postal Service National Trial Balance September 2015, November 13, 2015; Postal Service National Trial Balance September 2014, December 8, 2014. See FY 2015 Financial Analysis Report at 11 and 12.
Table III-15 also compares FY 2014 and FY 2015 operating expenses by category. Except for current employee health benefit premiums, every category of operating personnel expenses rose in FY 2015. Compensation includes the salaries of full-time career employees, salaries of part-time career and non-career employees, overtime, leave, and performance or arbitration awards.106 There are several cost drivers for compensation, including contractual pay increases, inflation used to calculate semi-annual Cost of Living Allowances, workhours used, and the composition of the work force. Id. All compensation components increased in FY 2015, with salaries and overtime costs accounting for over 75 percent of the total increase of $818 million. Id. According to the Postal Service, this increase was primarily caused by obligated salary increases and additional workhours necessitated by the growing demand for shipping services, which are more labor intensive. Id. Overall, the growth in overtime workhours accounted for approximately $455 million of the total growth in compensation expenses. Id. at 15. The Commission appreciates the Postal Service’s efforts to increase revenues and understands that, all else being equal, volume increases also lead to higher expenses and workhours. However, increases in some types of workhours, such as overtime and penalty overtime, increase operating expenses more so than other types of workhours. The Commission recommends that the
106 FY 2015 Financial Report at 13.

Analysis of FY 2015 Performance Report Analysis of Postal Service Performance and FY 2016 Performance Plan
- 67 -
Postal Service balance the use of regular and overtime workhours to optimize its operational flexibility and efficiency.

Analysis of FY 2015 Performance Report Strategic Initiatives and FY 2016 Performance Plan
- 68 -
CHAPTER 4: STRATEGIC INITIATIVES A. Background
Strategic initiatives are temporary projects designed to help the Postal Service achieve its performance goals. FY 2014 Analysis at 51; USPS Reply Comments at 15. Reviewing the results of these projects clarifies the connection between performance goals and performance indicators, as well as the actions necessary to achieve performance goals. FY 2014 Analysis at 51. The Postal Service introduced strategic initiatives in FY 2010 to respond to the Commission’s request that the Postal Service provide more information on the performance of individual programs and how the programs relate to the performance goals.107 Strategic initiatives support the performance goals.108 For example, the Building the Workforce of the Future strategic initiative supports the Ensure a Safe Workplace and Engaged Workforce performance goal by focusing on employee development and objectives related to succession planning and developmental training.109 In FY 2015, the Postal Service focused on implementing a portfolio of 17 strategic initiatives to meet its performance goals.110 It provided FY 2016 strategic initiatives in a CHIR response. Id. question 5.b. Table IV-1 compares FY 2015 and FY 2016 strategic initiatives and links each one to the performance goal it supports. The “Change From Prior Year” column identifies the changes between FY 2015 and FY 2016, which are:
New — Strategic initiative was newly created to address an emerging business need.
Continued — Strategic initiative continued with minimal changes from the prior fiscal year.
Closed — Strategic initiative was closed as a result of a completed activity or change in business need.
107 FY 2010 Comprehensive Statementat 51. The Postal Service previously referred to its performance goals as “strategic goals.”
108 FY 2015 Annual Report at 64. The Postal Service refers to performance goals as “corporate goals” and strategic initiatives as the Delivering Results, Innovation, Value, and Efficiency (DRIVE) portfolio of initiatives. Id. at 64-65. The Postal Service confirms that strategic initiatives and the DRIVE portfolio of initiatives are the same. February 11, 2016, Responses to CHIR No. 9, question 5.c.
109 See FY 2015 Annual Report at 65; United States Government Accountability Office, U.S. Postal Service, Status of Workforce Reductions and Related Planning Efforts, GAO-15-43, November 2014, at 27.
110 See FY 2015 Annual Report at 64. The Postal Service’s FY 2015 Annual Report states that it implemented a portfolio of 18 strategic initiatives. Id. The Postal Service later clarified that there were only 17 strategic initiatives in FY 2015. February 11, 2016, Responses to CHIR No. 9, question 5.a.

Analysis of FY 2015 Performance Report Strategic Initiatives and FY 2016 Performance Plan
- 69 -
Refined — Strategic initiative was refined to reflect the current business situation and achieve greater alignment with organizational goals.
Combined — Strategic initiative was combined with a similar initiative(s) to more accurately reflect the current business situation and provide greater alignment organizationally.
Id.
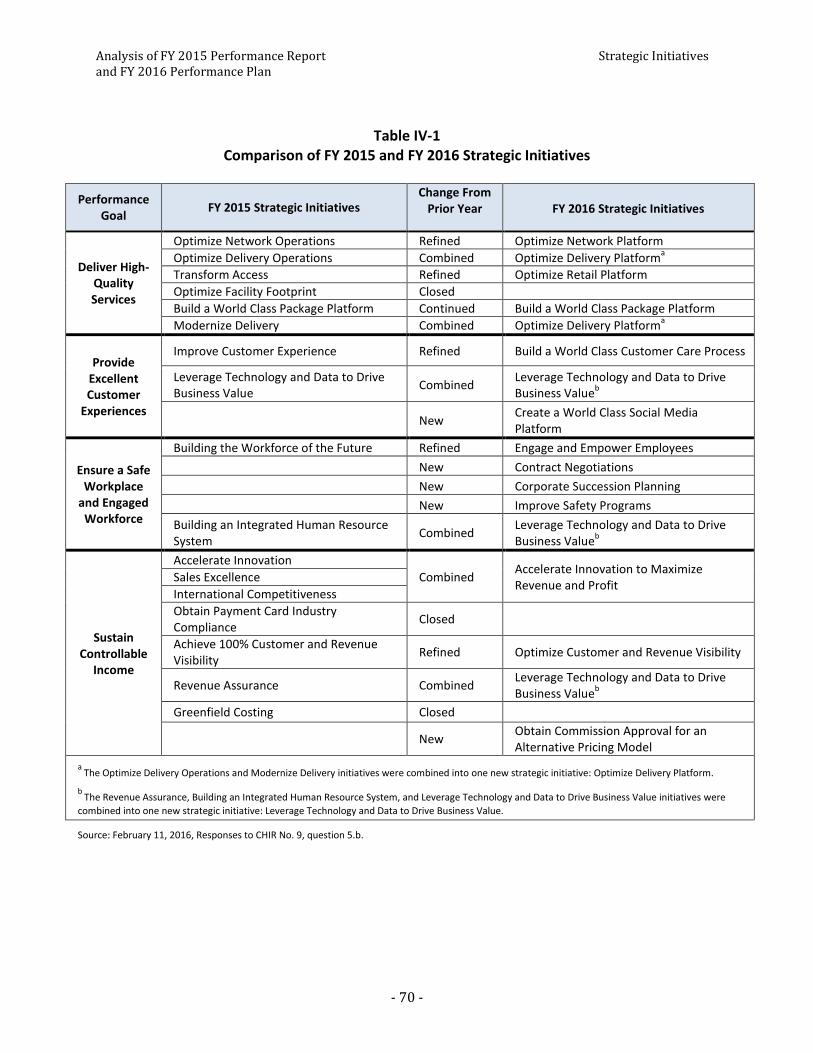
Analysis of FY 2015 Performance Report Strategic Initiatives and FY 2016 Performance Plan
- 70 -
Table IV-1 Comparison of FY 2015 and FY 2016 Strategic Initiatives
Performance Goal
FY 2015 Strategic Initiatives Change From
Prior Year
FY 2016 Strategic Initiatives
Deliver High-Quality Services
Optimize Network Operations Refined Optimize Network Platform
Optimize Delivery Operations Combined Optimize Delivery Platforma
Transform Access Refined Optimize Retail Platform
Optimize Facility Footprint Closed
Build a World Class Package Platform Continued Build a World Class Package Platform
Modernize Delivery Combined Optimize Delivery Platforma
Provide Excellent Customer
Experiences
Improve Customer Experience Refined Build a World Class Customer Care Process
Leverage Technology and Data to Drive Business Value
Combined Leverage Technology and Data to Drive Business Value
b
New Create a World Class Social Media Platform
Ensure a Safe Workplace
and Engaged Workforce
Building the Workforce of the Future Refined Engage and Empower Employees
New Contract Negotiations
New Corporate Succession Planning
New Improve Safety Programs
Building an Integrated Human Resource System
Combined Leverage Technology and Data to Drive Business Value
b
Sustain Controllable
Income
Accelerate Innovation
Combined Accelerate Innovation to Maximize Revenue and Profit
Sales Excellence
International Competitiveness
Obtain Payment Card Industry Compliance
Closed
Achieve 100% Customer and Revenue Visibility
Refined Optimize Customer and Revenue Visibility
Revenue Assurance Combined Leverage Technology and Data to Drive Business Value
b
Greenfield Costing Closed
New Obtain Commission Approval for an Alternative Pricing Model
a The Optimize Delivery Operations and Modernize Delivery initiatives were combined into one new strategic initiative: Optimize Delivery Platform.
b The Revenue Assurance, Building an Integrated Human Resource System, and Leverage Technology and Data to Drive Business Value initiatives were
combined into one new strategic initiative: Leverage Technology and Data to Drive Business Value.
Source: February 11, 2016, Responses to CHIR No. 9, question 5.b.

Analysis of FY 2015 Performance Report Strategic Initiatives and FY 2016 Performance Plan
- 71 -
As shown in Table IV-1, only one of the FY 2015 strategic initiatives continued into FY 2016 without change. The Postal Service discontinued three strategic initiatives and added five new ones. The Postal Service states that eleven strategic initiatives were either refined or combined with similar initiative(s) to reflect the Postal Service’s business situation and improve the connection between strategic initiatives and performance goals. See id. The Postal Service measures the performance of strategic initiatives using “cross-portfolio performance indicators.” Id. question 6. Table IV-2 compares results of cross-portfolio performance indicators from FY 2012 to FY 2015 and targets from FY 2012 to FY 2016.
Table IV-2 Cross-Portfolio Performance Indicators, FY 2012-FY 2016, Targets and Results
Cross-Portfolio
Performance Indicator FY TARGET
FY RESULT
FY Target Not Met
FY TARGET
2016 2015
2015 2014 2013 2012 2014 2013 2012
Total DRIVE* Cost Savings ($ Billions)
a
$0.955 $0.666 #
$0.157 $0.837 $0.872 $0.346 $1.130 # $1.033 $0.581
Total Workhours Reduced (Millions)
13.00 6.20 0.93 6.70 9.81 1.94 24.00 12.70 6.00
Gross Consideration (Facilities) ($ Millions)
Discontinued $175 $194 n/a n/a
Commercial Mail in Full Service IMb (%)
b
Discontinued 85.0% 88.0% 79.3% 64.0% 45.0% 80.0% # 60.0% 48.0%
Package Scanning/ Barcoded Rate (%)
c Discontinued 99.0% 98.6% 96.2% 95.1% 94.0% 97.0%
# 98.0% 94.0%
Estimated Value of Closed Sales and Churn Reduction ($ Billions)
Discontinued $5.45 $6.90 n/a n/a
Revenue ($ Billions) $69.4 n/a n/a n/a n/a Shaded result denotes target not met in fiscal year under review. Note: For ease of multi-year review, figures in Table IV-2 have been rounded. The CEM and CI Composite Scores are included in Table I-1. n/a – not available; no fiscal year performance result or target. *DRIVE is a structured management process for improving business strategy development and progress toward performance goals. FY 2015 Annual Report at 64. DRIVE incorporates measurement, analysis, and evaluation of a portfolio of strategic initiatives. Id. #Target plan changed from that originally provided in fiscal year annual report filings. a FY 2015 target had been originally set at $0.747 billion and was changed to $0.666 billion. Compare February 11, 2016, Responses to CHIR No. 9, question 6.a with Docket No. ACR2014, February 10, 2015, Responses to CHIR No. 5, question 9. The FY 2014 target originally had been set at $1.53 billion. Compare Docket No. ACR2014, March 11, 2015, Responses to CHIR No. 13, question 1 with Docket No. ACR2013, Responses of the United States Postal Service to Questions 1, 5-6, 8-11 of Chairman’s Information Request No. 15, March 21, 2014, question 5 (Docket No. ACR2013, Responses to CHIR No. 15). b FY 2014 target had originally been set at 97.0 percent. Compare Docket No. ACR2014, March 11, 2015, Responses to CHIR No. 13, question 1 with Docket No. ACR2013, Responses to CHIR No. 15, question 5. c FY 2014 target had originally been set at 96.5 percent. Id.
Sources: February 11, 2016, Responses to CHIR No. 9, question 6.a.; Docket No. ACR2014, February 10, 2015, Responses to CHIR No. 5, question 9; Docket No. ACR2014, March 11, 2015, Responses to CHIR No. 13, questions 1, 3; Docket No. ACR2014, United States Postal Service Response to Question 28 of Chairman’s Information Request No. 13, March 30, 2015, question 28.c. (Docket No. ACR2014, March 30, 2015, Responses to CHIR No. 13); Docket No. ACR2014, May 15, 2015, Responses to CHIR No. 17, question 3 (corrected FY 2014 Total Workhours Reduced from 7.7 to 6.7 million); Docket No. ACR2013, Responses to CHIR No. 15, question 5; Docket No. ACR2013, Responses of the United States Postal Service to Questions 1-9 of Chairman’s Information Request No. 10, March 4, 2014, question 6; FY 2012 Annual Report at 39.
Analysis of FY 2015 Performance Report Strategic Initiatives and FY 2016 Performance Plan
- 72 -
Table IV-2 illustrates that in FY 2015, the Postal Service measured strategic initiative performance using six cross-portfolio performance indicators: Total DRIVE Cost Savings, Total Workhours Reduced, Gross Consideration (Facilities), Commercial Mail in Full Service IMb, Package Scanning/Barcoded Rate, and Estimated Value of Closed Sales and Churn Reduction. In FY 2016, the Postal Service continues to measure strategic initiative performance using Total DRIVE Cost Savings and Total Workhours Reduced as cross-portfolio performance indicators. See February 11, 2016, Responses to CHIR No. 9, question 6.a. The Postal Service has used these cross-portfolio performance indicators consistently since FY 2012 to measure strategic initiative performance. In FY 2016, the Postal Service is also measuring strategic initiative performance using two new cross-portfolio performance indicators: Revenue and Composite Customer Insights Score.111 The Postal Service discontinued four cross-portfolio performance indicators that were used in FY 2015: Gross Consideration (Facilities), Commercial Mail in Full Service IMb, Package Scanning/Barcoded Rate, and Estimated Value of Closed Sales and Churn Reduction. Id. Table IV-3 lists targets and results from FY 2012 to FY 2014 for cross-portfolio performance indicators that were discontinued prior to FY 2015 to facilitate the assessment of all initiatives developed to close the gap between revenue and cost over the course of the Postal Service’s Five-Year Business Plan.112
111 Id. The Composite Customer Insights Score is also a performance indicator that measures progress toward the Provide Excellent Customer Experiences performance goal. See Chapter 3, section B, supra.
112 In its FY 2012 Annual Report, the Postal Service explained that its strategic change initiatives were developed to “close the gap between revenue and cost over the next five years.” FY 2012 Annual Report at 38.

Analysis of FY 2015 Performance Report Strategic Initiatives and FY 2016 Performance Plan
- 73 -
Table IV-3 Cross-Portfolio Performance Indicators Discontinued Prior to
FY 2015 Results and Targets, FY 2012-FY 2014
Table IV-4 aligns each FY 2016 performance goal with the strategic initiatives that support it and the cross-portfolio performance indicator(s) that will measure each strategic initiative’s performance in FY 2016.
Cross-Portfolio Performance Indicator
FY RESULT
FY Target Not Met
FY TARGET
2014 2013 2012 2014 2013 2012
Total Headcount Reduction (Full-Time Equivalents)
a
n/a 36,535 29,390 67,000 43,000 67,080
Total DRIVE Revenue ($ Billions)
b
$6.54 $5.07 $0.81 $5.40 $4.20 $0.94
IMb Adoption Rate (%)c 97.0% 95.1% 81.0% 94.0%
# 95.0% 80.0%
Total Facility Square Feet Reduced (Millions)
2.2 3.0 3.3 2.2 1.2 2.2
n/a - not available, performance indicator discontinued. # Target plan changed from that originally provided in fiscal year annual report filings. a FY 2014 target was initially set at 67,000 and was discontinued during FY 2014. Compare Docket No. ACR2014, March 11, 2015, Responses to CHIR No. 13, question 1 with Docket No. ACR2013, Responses to CHIR No. 15, question 5. b The Estimated Value of Closed Sales and Churn Reduction replaced the Total DRIVE Revenue performance indicator and is listed in Table IV-2. c The FY 2014 target had originally been set at 97.0 percent. Compare Docket No. ACR2013, Responses to CHIR No. 15, question 5 with Docket No. ACR2014, March 11, 2015, Responses to CHIR No. 13, question 1.
Source: Docket No. ACR2014, March 11, 2015, Responses to CHIR No. 13, question 1; Docket No. ACR2013, Responses to CHIR No. 15, question 5; Docket No. ACR2013, Response to CHIR No. 10, question 6; FY 2012 Annual Report at 39.

Analysis of FY 2015 Performance Report Strategic Initiatives and FY 2016 Performance Plan
- 74 -
Table IV-4 FY 2016 Performance Goals, Strategic Initiatives, and
Cross-Portfolio Performance Indicators
Performance Goal
FY 2016 Strategic Initiatives
FY 2016 Cross-Portfolio Performance Indicator(s)
Deliver High Quality Services
Optimize Network Platform Total DRIVE Cost Savings ($ Millions) Total Workhours Reduced (Millions)
Optimize Delivery Platform Total DRIVE Cost Savings ($ Millions) Composite Customer Insights Score
Optimize Retail Platform Total DRIVE Cost Savings ($ Millions) Composite Customer Insights Score
Build a World Class Package Platform Total DRIVE Cost Savings ($ Millions) Composite Customer Insights Score
Provide Excellent Customer
Experiences
Build a World Class Customer Care Process Composite Customer Insights Score
Leverage Technology and Data to Drive Business Value Revenue ($ Billions) Composite Customer Insights Score
Create a World Class Social Media Platform Composite Customer Insights Score
Ensure a Safe Workplace
and Engaged Workforce
Engage and Empower Employees Total DRIVE Cost Savings ($ Millions)
Contract Negotiations Total DRIVE Cost Savings ($ Millions)
Corporate Succession Planning None
Improve Safety Programs Total DRIVE Cost Savings ($ Millions)
Sustain Controllable
Income
Accelerate Innovation to Maximize Revenue and Profit Revenue ($ Billions)
Optimize Customer and Revenue Visibility Revenue ($ Billions)
Obtain PRC Approval for an Alternative Pricing Model Revenue ($ Billions)
Source: Response to CHIR No. 15, question 10. The Corporate Succession Planning strategic initiative is not measured by a cross-portfolio performance indicator. Id.
B. Comments The Public Representative asserts that the Postal Service’s presentation of the FY 2015 strategic initiatives is consistent with last year’s presentation, which was a significant improvement compared to previous years. PR Comments at 20. She reiterates her recommendation that the Postal Service provide more detailed information about key activities, resources required, and estimated timelines for each initiative. Id. She notes that in its FY 2014 Analysis, the Commission recommended that the Postal Service establish performance measures for each strategic initiative and provide strategic initiatives for both the prior and upcoming years. Id. at 20-21. She observes that the Postal Service did not implement these recommendations. Id. at 21. The Postal Service takes the position that strategic initiatives are not required by 39 U.S.C. §§ 2803 and 2804. USPS Reply Comments at 14-15. It acknowledges that strategic initiatives are designed to help the Postal Service achieve its performance goals. Id.

Analysis of FY 2015 Performance Report Strategic Initiatives and FY 2016 Performance Plan
- 75 -
However, it asserts that strategic initiatives are part of a broader strategic plan to achieve its performance goals. Id. The Postal Service contends that because strategic initiatives function more independently as projects rather than performance indicators, they are appropriately presented and discussed in the FY 2015 Annual Report but not as part of the FY 2015 Report and FY 2016 Plan. Id. at 15.
C. Commission Analysis In this section, the Commission addresses the comments and provides observations and recommendations for the strategic initiatives and cross-portfolio performance indicators. The Postal Service takes the position that strategic initiatives are not required to be part of annual performance plans and annual performance reports but acknowledges their important connection to achieving performance goals. Although not explicitly required by 39 U.S.C. §§ 2803 or 2804, the Commission has reviewed strategic initiatives annually since they were introduced in FY 2010. In its FY 2014 Analysis, the Commission stated it evaluates strategic initiatives in conjunction with annual performance plans and annual performance reports and explained that it reviews strategic initiatives to facilitate its evaluation of performance goals under 39 U.S.C. § 3653(d). FY 2014 Analysis at 58. As the Postal Service acknowledges, strategic initiatives are designed to help the Postal Service achieve its performance goals. Given that important connection, the Commission reiterates that strategic initiatives are properly considered in conjunction with annual performance plans and annual performance reports because they increase transparency and provide additional insight into the steps the Postal Service is taking to achieve its goals. The Commission agrees with the Public Representative’s assertion that the Postal Service’s presentation of FY 2015 strategic initiatives is consistent with last year’s presentation, which was an improvement compared to past years. As in FY 2014, the FY 2015 Annual Report includes a table that links each strategic initiative to the performance goal it supports and compares FY 2014 and FY 2015 strategic initiatives. FY 2015 Annual Report at 65. The FY 2015 Annual Report does not have a similar table comparing FY 2015 and FY 2016 strategic initiatives. However, the Postal Service provided this information in response to a CHIR.113 The Commission makes two recommendations concerning the presentation of strategic initiatives in the Postal Service’s annual reports to Congress that would facilitate the Commission’s evaluation of performance goals under 39 U.S.C. § 3653(d). First, the FY 2016 Annual Report to Congress (FY 2016 Annual Report) should include two tables listing strategic initiatives. One table, similar to Table IV-1, should compare FY 2016 and FY 2017 strategic initiatives. The other table, similar to Table IV-4, should align FY 2017 strategic initiatives directly with FY 2017 performance goals and cross-portfolio performance
113 February 11, 2016, Responses to CHIR No. 9, question 5.b.; see Table IV-1, supra.

Analysis of FY 2015 Performance Report Strategic Initiatives and FY 2016 Performance Plan
- 76 -
indicators. Because strategic initiatives help the Postal Service achieve its performance goals, the two strategic initiative tables should be in the part of the FY 2016 Annual Report that contains the FY 2016 annual performance report (FY 2016 Report) and FY 2017 annual performance plan (FY 2017 Plan). Second, the Commission recommends that as part of its FY 2017 Plan discussion, the Postal Service provide the reasons for changes made to the FY 2016 strategic initiatives in FY 2017.114 Explanations of changes would increase transparency by making information about the Postal Service’s goals and strategic initiatives more easily accessible and understandable. The Commission also makes a recommendation concerning cross-portfolio performance indicators. In its FY 2014 Analysis, the Commission observed that many strategic initiatives did not have a corresponding cross-portfolio performance indicator to measure their performance and recommended that the Postal Service establish performance measures for each strategic initiative. FY 2014 Analysis at 59. The Postal Service appears to have adopted the recommendation because all but one of the FY 2016 strategic initiatives are measured by at least one cross-portfolio performance indicator. See Table IV-4, supra. The changes made by the Postal Service better ensure that the Postal Service evaluates whether its strategic initiatives are having the intended effect on an on-going basis. In its FY 2014 Analysis, the Commission observed that some FY 2015 cross-portfolio performance indicators measured performance for more than one strategic initiative. FY 2014 Analysis at 59. For example, “Total DRIVE Cost Savings” measured performance for four strategic initiatives in FY 2015.115 The Commission explained that this was problematic because “it is unclear how cost savings are to be distributed among the four strategic initiatives.” Id. Applying one performance measure to several strategic initiatives prevents the Postal Service from evaluating individual performance for each strategic initiative. The Commission recommended that the Postal Service replace cross-portfolio performance indicators with performance measures that link to only one strategic initiative. FY 2014 Analysis at 59. In the FY 2015 Report, the Postal Service did not follow this recommendation but instead increased the number of strategic initiatives measured by some cross-portfolio performance indicators. For example, Total DRIVE Cost Savings will measure performance for seven different strategic initiatives in FY 2016, an increase from the four it measured in FY 2015. See Table IV-4, supra. The Commission reiterates its recommendation that each strategic initiative have a unique performance measure that only measures performance for that strategic initiative.
114 For the past several years, the Commission has obtained this information through CHIRs, but this information would be more informative to Congress and the public if included in the Postal Service’s FY 2016 Annual Report.
115 Id. The strategic initiatives were Optimize Network Operations, Optimize Delivery Operations, Modernize Delivery, and Building the Workforce of the Future.
Analysis of FY 2015 Performance Report Appendix and FY 2016 Performance Plan Page 1 of 6
Appendix: Commission Findings and Recommendations Chapter 2 - Compliance with 39 U.S.C. §§ 2803 and 2804:
The Commission finds the increased visibility of the FY 2015 Report and FY 2016 Plan
an improvement compared to previous annual performance reports and annual
performance plans. Chapter 2 at 11-12.
The Commission finds that the FY 2016 Plan meets almost all requirements of 39 U.S.C.
§ 2803. Id. at 12.
o Although the Postal Service did not set a measurable FY 2016 target for the Postal
Pulse survey score in the FY 2016 Plan, the Commission finds that the information
provided in response to a CHIR is sufficient to meet the requirements of 39 U.S.C.
§ 2803(a)(2). In future years, the Postal Service should include this information in
annual performance plans. Id.
o The Commission finds that the FY 2016 Plan does not “cover[] each program
activity set forth in the Postal Service budget” as required by 39 U.S.C. § 2803(a)
and is not compliant in that respect. To ensure full compliance next year, the
FY 2017 Plan must identify all program activities in the FY 2017 Integrated
Financial Plan and explain how the FY 2017 Plan covers each one. Id. at 14.
The Commission finds that the FY 2015 Report meets most, but not all, of the
requirements of 39 U.S.C. § 2804. Id.
o In future years, to fully comply with 39 U.S.C. § 2804(d)(3), the Postal Service
should provide timelines for its plans to achieve performance goals if timelines fall
outside of the fiscal year covered by the annual performance plan. Id. at 15.
o The Commission finds that the Postal Service provided the information necessary
to meet the requirements of 39 U.S.C. § 2804(d)(2). In future years, the Postal
Service should provide all of this information in its annual performance report. Id.
at 16.
o Without comparable FY 2015 targets and results for the Postal Pulse survey score
performance indicator, the FY 2015 Report does not comply with 39 U.S.C.
§ 2804(b)(1) for the Ensure a Safe Workplace and Engaged Workforce

Analysis of FY 2015 Performance Report Appendix and FY 2016 Performance Plan Page 2 of 6
performance goal. To comply with 39 U.S.C. § 2804(b)(1) in FY 2016, the FY 2016
Report must express FY 2016 results that are comparable with the targets
expressed in the Responses to CHIR No. 3, question 5.b. Id.
o Without comparable results for the performance indicators under the Provide
Excellent Customer Experiences and Ensure a Safe Workplace and Engaged
Workforce performance goals, the Commission finds that the FY 2015 Report does
not “include actual results for the three preceding fiscal years” and thus does not
comply with the requirements of 39 U.S.C. § 2804(c). Id. at 18.
Chapter 3 - Evaluation of Performance Goals:
The Commission finds that the Postal Service partially met the Sustain Controllable
Income performance goal. The Postal Service did not meet the Deliver High-Quality
Services, Provide Excellent Customer Experiences, and Ensure a Safe Workplace and
Engaged Workforce performance goals. Chapter 3 at 19.
The Commission recommends that the Postal Service not revise the FY 2016 targets
that were set in the FY 2016 Plan. If circumstances merit revising a target for any
fiscal year, the Postal Service should describe why the revision was necessary given the
circumstances, and how the revision appropriately captures the changed
circumstances. Id. at 21, 39, 60.
Deliver High-Quality Services:
The Commission finds that the Postal Service did not meet the Deliver High-Quality
Services performance goal in FY 2015. Id. at 25.
The Commission recommends that the Postal Service closely examine and monitor the
reasons why the FY 2014 and FY 2015 year-to-year changes in mail characteristics or
mail volumes were underestimated or unplanned in its transportation network
planning. Id. at 27.
The Commission recommends that when districts do not meet their service
performance targets due, in whole or in part, to severe weather, the Postal Service
show when and to what extent severe weather affected service performance results. By
doing so, the Postal Service should distinguish between severe weather causes of poor
service performance, and other ongoing causes throughout the fiscal year in its
performance reports. Id.
Analysis of FY 2015 Performance Report Appendix and FY 2016 Performance Plan Page 3 of 6
For those service performance indicators that do not meet FY 2016 targets, the
Commission recommends that the Postal Service include the number of districts where
the annual service performance indicator target was met in its FY 2016 Report. Id.
at 31.
The Commission recommends that the Postal Service explore and develop other plans
for meeting all FY 2016 service performance targets and include them in the FY 2016
Report and FY 2017 Plan. Id. at 32.
Provide Excellent Customer Experiences:
The Commission finds that the Postal Service did not meet the Provide Excellent
Customer Experiences performance goal in FY 2015. Id. at 39.
To ensure that each aspect of customer experience progresses, the Commission
recommends that the BSN, POS, Delivery, and CCC performance indicators each have
individual targets in future performance plans. Id.
In future years, the Commission recommends that the Postal Service include all BSN
customers in the survey. Alternatively, the Postal Service should provide the number of
BSN accounts that are not eligible to complete the BSN survey. Id. at 40, 41.
To help meet the “Five Minutes or Less” standard, the Commission recommends that
the Postal Service closely monitor and reduce wait times in line during peak months
by, for example, including more staff at retail locations or adding additional window
retail hours. Id. at 42.
The Commission finds that the revisions to the FY 2015 CCC survey may improve its
utility as a measurement of customer experience. In future years, if the Postal Service
revises a customer experience survey, the Commission recommends that the Postal
Service describe these changes in the methodology section of the Preface document of
that fiscal year’s ACR, Library Reference USPS-FY16-38 (customer experience surveys),
and in the report(s) where the survey is discussed. Id. at 43.
If the Postal Service makes changes to surveys that affect comparability across fiscal
years, the Postal Service should adopt an approach similar to the changes it made to
the FY 2015 CCC survey. Id.
To ensure that the FY 2016 Report complies with 39 U.S.C. § 2804(c) for the Provide
Excellent Customer Experiences performance goal, the Commission recommends that
the Postal Service also compare survey results received online for the CEM survey
Analysis of FY 2015 Performance Report Appendix and FY 2016 Performance Plan Page 4 of 6
conducted in FY 2013 and the CI Delivery surveys conducted from FY 2014 through
FY 2016 for residential and small/medium business customers. Id. at 45.
The Commission recommends that the Postal Service establish a performance
indicator based on the Large Business survey and include it as part of the CI Composite
Score. Id. at 46.
Ensure a Safe Workplace and Engaged Workforce:
The Commission finds that the Postal Service did not meet the Ensure a Safe
Workplace and Engaged Workforce performance goal in FY 2015. Id. at 50.
The Commission recommends that the Postal Service consider adding another
workplace safety performance indicator for which results are not revised after the end
of the fiscal year. Id.
The Commission recommends that the Postal Service use the Postal Pulse survey to
identify the causes of employee turnover and design programs to reduce turnover
rates for non-career employees. In the FY 2016 Report, the Postal Service should
describe the steps it has taken to use the Postal Pulse survey data to measure the
relationships between employee engagement, accident reduction, and employee
retention. Id. at 52, 53.
Without a comparable FY 2015 target and result, the FY 2015 Report does not comply
with 39 U.S.C. § 2804(b)(1) for the Postal Pulse survey score performance indicator. Id.
at 53.
In FY 2016, the Postal Service should administer the Postal Pulse survey for a full cycle.
It should then set a FY 2017 target for the Postal Pulse survey score and provide the
basis for selecting this target. In FY 2016, the Postal Service should take steps to
increase the FY 2015 mean score of 3.16. It should assess its progress at the end of
FY 2016 by comparing the FY 2015 and FY 2016 results for the comparable test period.
Id. at 53-54.
To allow for some cross-year comparison in FY 2016, the Commission recommends
that the Postal Service use the same methodology for calculating the FY 2016 Postal
Pulse survey score result to ensure that FY 2015 and FY 2016 results are comparable.
Id. at 54.

Analysis of FY 2015 Performance Report Appendix and FY 2016 Performance Plan Page 5 of 6
The Commission recommends the Postal Service reconsider whether any results can be
compared between the VOE and Postal Pulse surveys and provide such comparable
results for fiscal years 2013, 2014, 2015, and 2016 in the FY 2016 Report. Id. at 55.
If the Postal Service makes additional changes to the Postal Pulse survey that affect
comparability, the Commission recommends that the revised survey retain at least one
item that can be compared to the previous survey. Id.
The Commission recommends that the Postal Service continue setting targets and
measuring results using the mean score of Items 1 through 12 on the Postal Pulse
survey. The Postal Service should also consider setting targets and measuring results
for specific items in the Postal Pulse survey. In the FY 2016 Plan, the Commission
recommends that the Postal Service compare FY 2015 and FY 2016 results of these
specific items and explain how they relate to the FY 2015 and FY 2016 mean scores. Id.
at 56.
Sustain Controllable Income:
The Commission finds that the Postal Service partially met the Sustain Controllable
Income performance goal in FY 2015. Id. at 60.
The Commission finds that accounting for Sunday delivery is an improvement to the
current DPWH calculation methodology, which does not account for the additional
workload of Sunday deliveries, yet includes Sunday workhours as part of total
workhours. Because Sunday delivery began in October 2013, the Commission
recommends that in addition to recalculating the FY 2015 and FY 2016 results, the
Postal Service should also recalculate the FY 2014 result using the revised
methodology and include the revised results in the FY 2016 Report. Id. at 61.
In the FY 2016 Report, the Commission recommends that the Postal Service explain its
methodology for adjusting the workhours in the DPWH formula to account for year-to-
year changes in weighted mail volumes. Id.
The Commission recommends that in the FY 2016 Report, the Postal Service explain
whether and how the FY 2016 DPWH performance indicator accounts for any increase
in the number of delivery points and associated workhours caused by the rebounding
housing market. The Postal Service should also describe any modifications it makes in
the development of forecasted delivery points used to calculate the FY 2017 DPWH
target. Id. at 62.

Analysis of FY 2015 Performance Report Appendix and FY 2016 Performance Plan Page 6 of 6
The Commission recommends that the Postal Service update or adjust its First-Class
Mail forecasting volume model accordingly. If year-to-year changes in other mail
volume characteristics impacted FY 2015 overrun of the workhours plan, the Postal
Service should assess whether and how its workhours estimation processes can be
improved. Id. at 63.
The Commission recommends that the Postal Service include additional performance
indicators in its FY 2016 Annual Report that quantify cost savings from strategic
initiatives and capital investments and show how they are producing intended cost
savings over time. Id. at 64-65.
The Commission recommends that the Postal Service balance the use of regular and
overtime workhours to optimize its operational flexibility and efficiency. Id. at 66-67.
Chapter 4 - Strategic Initiatives:
Given their important connection to the performance goals, the Commission reiterates
that strategic initiatives are properly considered in conjunction with annual
performance plans and annual performance reports because they increase
transparency and provide additional insight into the steps the Postal Service is taking
to achieve its goals. Chapter 4 at 75.
The FY 2016 Annual Report to Congress should include two tables listing strategic
initiatives. Id.
The Commission recommends that as part of its FY 2017 Plan discussion, the Postal
Service provide the reasons for changes made to the FY 2016 strategic initiatives in
FY 2017. Id. at 76.
The Commission reiterates its recommendation that each strategic initiative have a
unique performance measure that only measures performance for that strategic
initiative. Id.