poster presenter: nwikeiloeje, argonne national laboratory ... · 2.0 million metric tons of yogurt...
TRANSCRIPT
Poster Presenter:Nwike Iloeje, Argonne National Laboratory
U.S. DOE Advanced Manufacturing Office Program Review Meeting Washington, D.C. June 11-12, 2019
This presentation does not contain any proprietary, confidential, or otherwise restricted information.

Overview The multi-laboratory (Argonne National Laboratory, Lawrence Berkeley
National Laboratory, National Renewable Energy Laboratory, and Oak Ridge National Laboratory) AMO Strategic Analysis (StA) Team provides independent, objective, and credible information to inform decision-making.
The StA team submitted 6 posters for this year’s Program Review; the research topics are ongoing and do not follow the typical poster format
This poster, “Sustainable Manufacturing: Application and Analysis of Circular Economy Strategies” includes information on five projects:
1. U.S. Food Loss, Waste, and Byproducts Analysis2. Estimating the Potential Application of the NSF457 Sustainability Leadership
Standard for PV Modules in Federal Government PV Procurement 3. Battery Rare Earth Element (REE) Recycling4. Supply chain impact analysis of upcycling of recycling PET5. Design for recycling principles for some clean energy technologies

Project Objective(s) – Sustainable Manufacturing
Sustainable manufacturing: encompasses a widening range systems issues (e.g., energy intensity, carbon intensity, and use intensity) and solution can enable a more efficient and competitive advanced U.S. manufacturing future.
Challenge with many traditional manufacturing systems: Develop an inefficient linear model, starting with raw materials extract (mining) and end disposal in a landfill at the end of the product’s useful life.
Circular economy (represented by the figure to the right) redirects the current approach by providing opportunities to re-manufacture and reuse end-of-life consumer products, leading to more efficient use of materials.
Analyzing the supply chain and material flows: throughout the product’s entire lifecycle: Can help to identify energy, material, and water savings opportunities for greater U.S. economy (including the production and delivery of energy and energy use within the industrial, transportation, and buildings sectors)
The team’s past and current sustainable manufacturing activities include: developing baseline knowledge, analyzing long-term trends, and assessing current opportunities. Methods, data, and results are vetted through conference presentations, workshop collaborations, and reports.
A key in doing so is addressing the challenge of how to evaluate different strategies’ potential by developing general evaluation approaches and establishing a baseline to use a reference point.

Estimated U.S. Food Use, Loss, Waste, and By-products in 2016
All of the food products are based on farm weight Raw materials used for non-human-foods and alcohol products are excluded Waste quantities for each disposal method will be determined
Sources: USDA, U.S. Grain Council, and Others
U.S. Food Loss, Waste, and Byproducts Analysis

U.S. Food Loss, Waste, and Byproducts Analysis
Billion tons of waste is generated in U.S. every year and food industry is one of the major waste sources (173.6 million metric tons of wastes/byproducts in the whole food supply chain)
More than 7 methods can be found to dispose wastes/by-products fromU.S. food sector
Each method will be analyzed to identify the technical and economical barriers for implementation
Some optimal combinations of disposal methods will be proposed to improve the energy and greenhouse gas emission savings
A R&D road map will be developed to guide the research on food waste reduce, reuse and recycle
Similar studies will be conducted for other industries (iron and steel, aluminum, pulp and paper, etc.)

U.S. Yogurt Industry Material Flow (2017)
Sources: USDA, DMI, McElhatton, White, and Others

U.S. Food Loss, Waste, and Byproducts Analysis
2.0 million metric tons of yogurt was consumed in the United States in 2017
Market shares for 4 major yogurt product in U.S.: traditional (60%), Greek (38%), Australian (1.3%) and Icelandic (0.9%) yogurt
3.83 million metric tons of raw milk was consumed for producing yogurt with 0.28 million metric tons of cream and 2.0 Million metric tons of acid whey generated as byproducts
Producing Greek yogurt accounts for 97% of total acid whey, and Icelandic yogurt accounts for 3%
Acid whey can usually be disposed through landfill, land application, animal feeding and bio-digestion
Sustainability of PV Modules
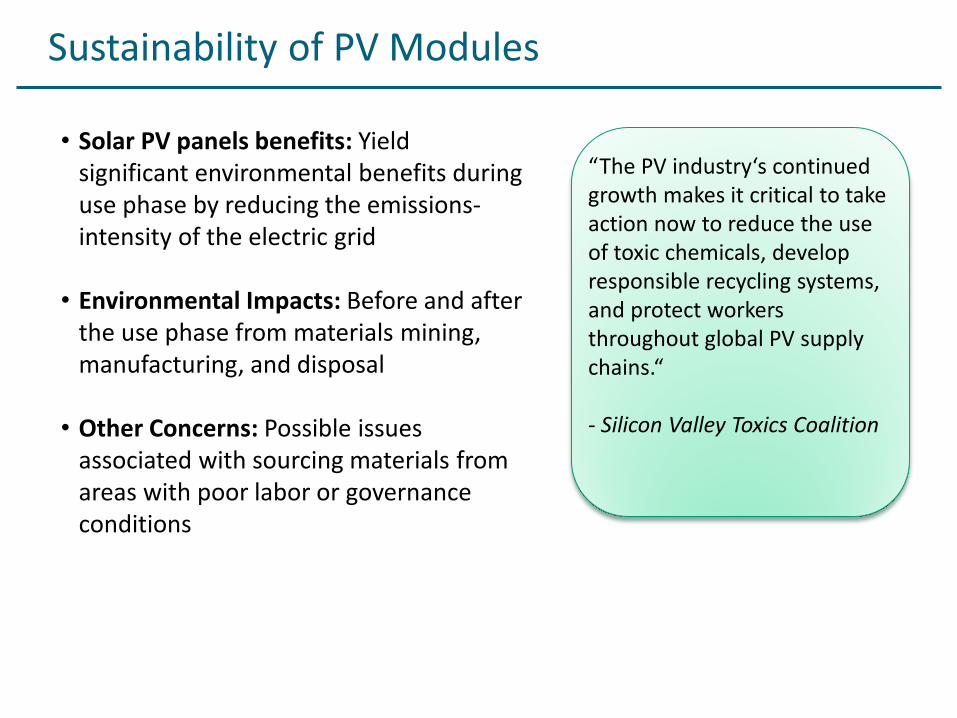
“The PV industry‘s continued growth makes it critical to take action now to reduce the use of toxic chemicals, develop responsible recycling systems, and protect workers throughout global PV supply chains.“
- Silicon Valley Toxics Coalition
• Solar PV panels benefits: Yield significant environmental benefits during use phase by reducing the emissions-intensity of the electric grid
• Environmental Impacts: Before and after the use phase from materials mining, manufacturing, and disposal
• Other Concerns: Possible issues associated with sourcing materials from areas with poor labor or governance conditions

Solar PV Sustainability Standards
NSF457 (Sustainability Leadership Standard for Photovoltaic Modules): addresses a growing need for PV sustainability standards.
• Problem: PV panels yield significant environmental benefits during use phase, but there are environmental impacts before and after the use phase from materials mining, manufacturing, and disposal.– Before 2018, there was no clear, objective, verifiable, consensus-based
criteria for sustainability attributes of PV modules.• Challenge: Remains difficult for purchasers to learn about PV modules’
sustainability attributes & identify sustainability-leading modules in the marketplace.
• Progress: Green Electronics Council developed the Sustainability Leadership Standard for PV Modules (NSF457) standard to fill the need for verifiable, objective sustainability standards for PV modules and identify leaders in sustainability performance.
Opportunity: Federal government can lead by example by becoming an early adopter of sustainability-certified solar PV panels.
Current collaboration:• To address growing need for PV sustainability standards, the Green Electronics
Council1 initiated a process following American National Standards Institute rules to develop an objective, verifiable standard to define high sustainability performance for PV module manufacture and disposal—the NSF457 standard.
• NSF457 enables large PV modules purchasers to easily identify highly sustainable modules in the marketplace and easily specify high sustainable performance PV modules in their procurement documents.
• Reduces arduous and complex task for individual purchasers of defining sustainability performance and collecting information from individual manufacturers to assess, verify, compare, prioritize, and monitor.
Solar PV Sustainability Standards
1 managers of the well-known EPEAT registry for sustainability-leading IT products

Sustainability Leadership Standard for PV Modules (NSF457) Scope
Sustainability Performance Categories(product-specific and corporate-specific criteria, see figure right) Management of substances
Preferable materials use
Life cycle assessment
Energy efficiency and water use
End-of-life management and design for recycling
Product packaging
Corporate responsibility.
Source: GEC, 2018

Design as an Eco-Label (EPEAT certification)
NSF457 will become part of the trusted EPEAT program with a registry where certified modules can be easily found and where certification is maintained over time
NSF457 is designed to identify leaders: Only the top 1/3 of the market should
qualify for an EPEAT label (all levels)
Under EPEAT, modules can be certified according to three levels—bronze, silver, and gold—according to the percentage of criteria which are satisfied.
Meets <50% Optional Criteria
Meets 50 – 75% Optional Criteria
Meets > 75% Optional Criteria
EPEAT Certification Levels
Who Uses EPEAT?
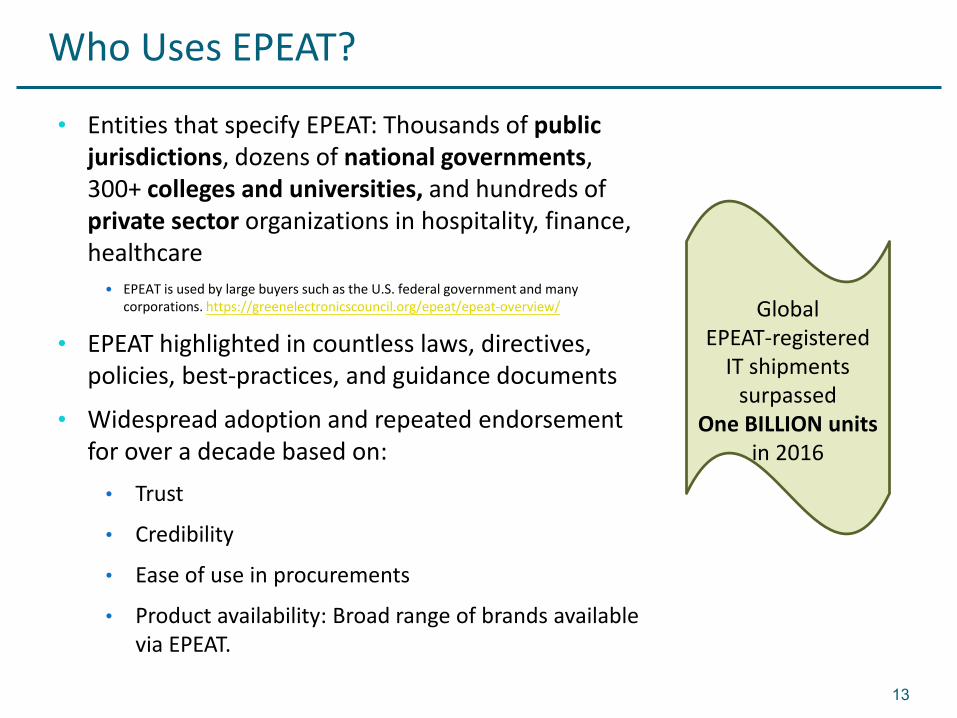
• Entities that specify EPEAT: Thousands of public jurisdictions, dozens of national governments, 300+ colleges and universities, and hundreds of private sector organizations in hospitality, finance, healthcare
EPEAT is used by large buyers such as the U.S. federal government and many corporations. https://greenelectronicscouncil.org/epeat/epeat-overview/
• EPEAT highlighted in countless laws, directives, policies, best-practices, and guidance documents
• Widespread adoption and repeated endorsement for over a decade based on:
• Trust
• Credibility
• Ease of use in procurements
• Product availability: Broad range of brands available via EPEAT.
13
Global EPEAT-registered
IT shipmentssurpassed
One BILLION units in 2016

NSF457 Points System
PV manufacturers must earn all required points and can earn extra optional points to achieve higher levels of certification
NSF457 Points System
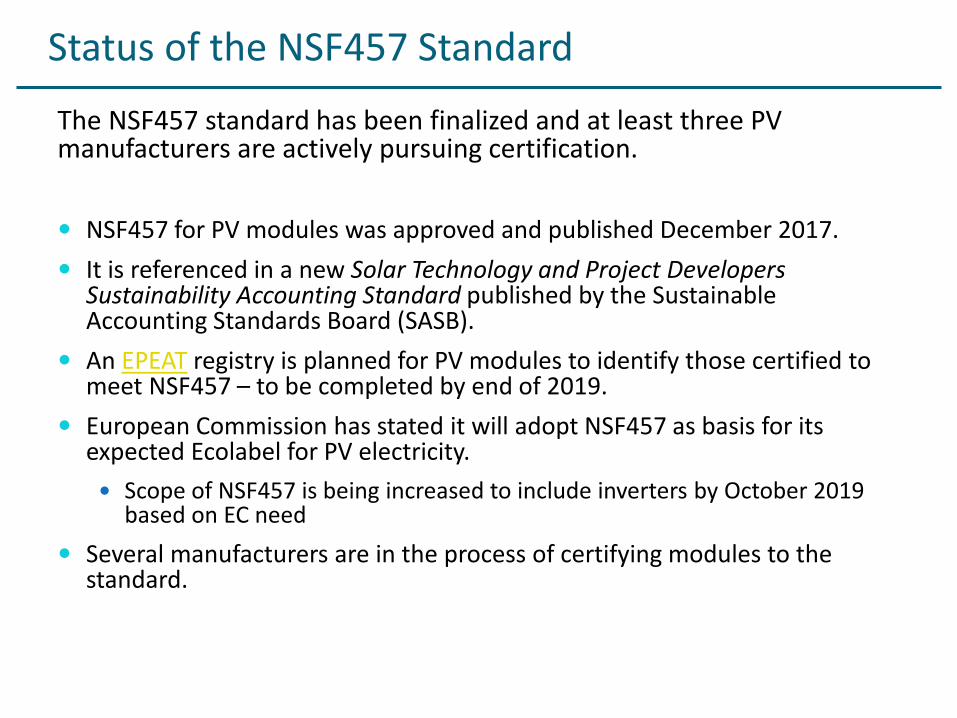
Status of the NSF457 Standard
The NSF457 standard has been finalized and at least three PV manufacturers are actively pursuing certification.
NSF457 for PV modules was approved and published December 2017. It is referenced in a new Solar Technology and Project Developers
Sustainability Accounting Standard published by the Sustainable Accounting Standards Board (SASB).
An EPEAT registry is planned for PV modules to identify those certified to meet NSF457 – to be completed by end of 2019.
European Commission has stated it will adopt NSF457 as basis for its expected Ecolabel for PV electricity. Scope of NSF457 is being increased to include inverters by October 2019
based on EC need Several manufacturers are in the process of certifying modules to the
standard.
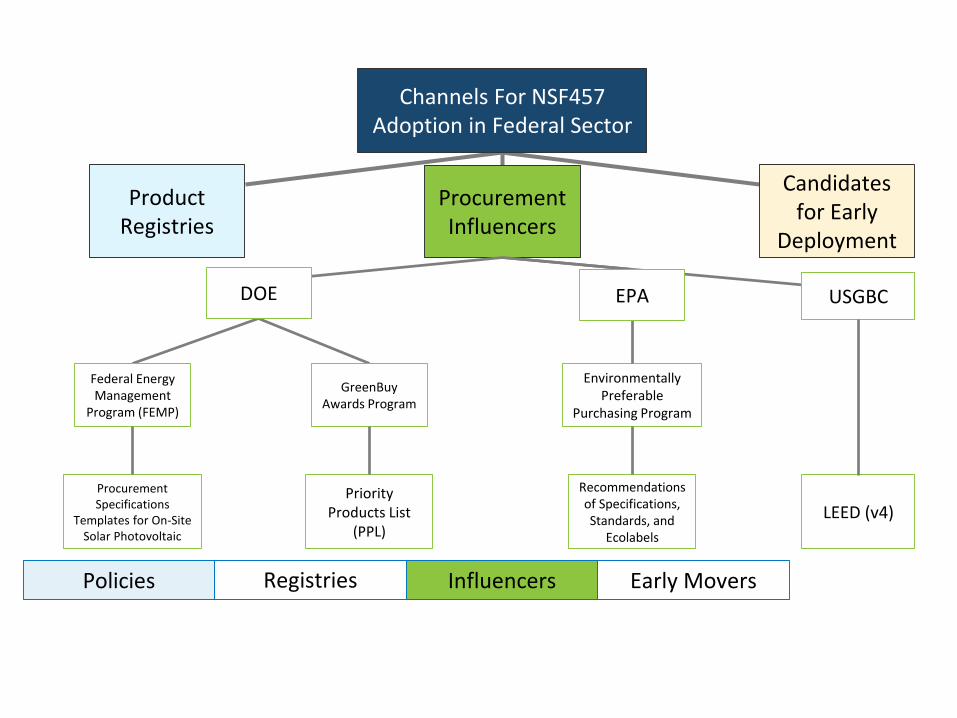
Product Registries
Channels For NSF457 Adoption in Federal Sector
ProcurementInfluencers
Candidates for Early
Deployment
Federal Energy Management
Program (FEMP)
Procurement Specifications
Templates for On-Site Solar Photovoltaic
Environmentally Preferable
Purchasing Program
Recommendations of Specifications, Standards, and
Ecolabels
USGBC
LEED (v4)
GreenBuyAwards Program
Priority Products List
(PPL)
EPADOE
Registries Influencers Early MoversPolicies

NSF457 Standard: Wedge Analysis
The following slides identify four pathways for NSF457 uptake and the potential deployment through each pathway
The pathways are independent, such that multiple pathways could be pursued to increase overall NSF457 uptake
Each pathway therefore represents a “wedge” of a broader suite of strategies to increase NSF457 uptake:
Wedge 1
Wedge 2
Wedge 3
Wedge 4
NSF457 in new federal buildings
NSF457 on GSA-owned buildings
Voluntary agency-level initiatives
NSF457 in off-site third-party owned PV

NSF457 Standard: Wedge Analysis
• Wedges (figure on right) collectively amount to 7 MW to 37 MW per year of NSF457 demand as low- and high-end estimates
• For context, annual federal PV procurement has been on the order of 80 MW/year for the past five years; U.S. annual installation volume was 10,600 MW in 2017; total installed U.S. PV capacity is about 57,000 MW (Perea et al. 2018).

Battery Rare Earth Element (REE) Recycling
Context: As emerging electronics and clean energy technologies drive updemand for rare earths, value recovery from recycling end-of-life productsprovides an option for closing the material loop, conserving natural capitaland enhancing resource security.
Challenge: The techno-economic feasibility of recycling depends onproduct recovery and purity targets, as well as a host of otheruncertainties, including variable feed compositions and volumes.
Opportunity: Assessment tools that integrate the physics and techno-economics of the recycling technology can provide a more realisticassessment, and give a clearer understanding of the impacts of uncertainparameters.
Action: The Strategic Analysis team is developing robust, first-principlesmodels and frameworks that capture, propagate and quantify theseimpacts to determine their effect on the economic viability of recycling.

Battery Rare Earth Element (REE) Recycling
Illustrate modeling framework and present initial analysis focused on a case study for separating rare earth mixtures from coming from nickel metal hydride batteries via solvent extraction.
Results: show how these integrated models can capture and provide insight on the relationship between uncertain or variable inputs and target outputs. Result highlights include:
Impact of design recovery targets: Additional separation requirements translate to a significant increase in equipment size, hence capital equipment cost. The marginal benefit must justify the additional capital outlay for meeting target design specifications.
Impact of feed compositional uncertainty: Variations in feedstock composition translates to a spread in the number of theoretical separation stages required for the same target recovery and purity specifications. This also provides an estimate of the redundant capacity that needs to be built into the plant design.

Battery Rare Earth Element (REE) Recycling

Combining Reclaimed PET with Bio-based Monomers Enables Plastics Upcycling
Journal: Joule (Cell Press), Publication Date: February 27, 2019 NREL authors: Nic Rorrer, Scott Nicholson, Birdie Carpenter, Mary Biddy, Nick Grundl, Gregg Beckham (Bolddenotes AMO StA team member)
Significance & Impact:
• Potential supply chain energy savings of 57% and GHG savings of 40% over the conventional method of composite production
• Applications include wind turbine blades and automotive parts
• Collaborative effort with National Bioenergy Center at NREL
Abstract:
• Upcycling: ability to produce higher-value products from reclaimed material.
• Upcycling with bioderived monomers results in composites with superior properties.
• These upcycled materials can result in reduced energy requirements and lower GHG emissions.
(See figure above) Supply chain energy requirements, as
calculated with NREL’s Materials Flows through Industry (MFI)
tool, are significantly reduced in all bio-based composite
manufacturing scenarios.

Combining Reclaimed PET with Bio-based Monomers Enables Plastics Upcycling: Background and Motivation
1. The Materials Flows through Industry (MFI) tool is a supply chain modeling tool created at NREL to identify and analyze opportunities to reduce the energy and carbon intensities of the U.S. industrial sector.
2. We model the lab-scale rPET upcycling process developed by other NREL researchers to determine the requisite energy and material inputs
3. We develop full supply chain models by connecting this lab-scale unit process to existing MFI unit processes, including PET recycling
4. Energy requirements and combustion-related greenhouse gas (GHG) emissions were calculated for the full bio-based supply chain models and compared to results from conventional GFRP manufacturing
Most commercial polyethylene terephthalate (PET) recycling is mechanical
Mechanical recycling leads to lower-grade plastic with fewer applications (carpet fiber, etc.)
Chemical recycling of PET bottles back to its monomers is expensive
What if we could make higher value glass fiber reinforced plastic with recycled PET?
Key research question: Are there energy savings associated with rPET–based GFRP production?
Motivation Methodology

Combining Reclaimed PET with Bio-based Monomers Enables Plastics Upcycling: Supply Chain Comparisons

Depending on the allocation method, supply chain fossil energy reductions range from 37% to 58%.
Combining Reclaimed PET with Bio-based Monomers Enables Plastics Upcycling: Supply Chain Energy
Scenario Name PET Bottle (First Life) Allocation
1 Conventional GFRP
N/A(No rPET Used)
2Waste Valuation; ReclaimedClear rPET
≈54%(Economic)
3Waste Valuation; ReclaimedGreen rPET
≈32%(Economic)
4 Reclaimed rPET -Cutoff 0%

Overall, supply chain fossil feedstock energy reductions range from 58% to 79%
Combining Reclaimed PET with Bio-based Monomers Enables Plastics Upcycling: Supply Chain Feedstock Energy
Scenario Name PET Bottle (First Life) Allocation
1 Conventional GFRP
N/A(No rPET Used)
2Waste Valuation; ReclaimedClear rPET
≈54%(Economic)
3Waste Valuation; ReclaimedGreen rPET
≈32%(Economic)
4 Reclaimed rPET -Cutoff 0%

• Overall, supply chain GHG emissions reductions range from 30% to 40%
• 0.7 – 1.0 MMT-CO2e offsets; Equivalent to taking 150,000 - 200,000 cars off the road
Scenario Name PET Bottle (First Life) Allocation
1 Conventional GFRP
N/A(No rPET Used)
2Waste Valuation; ReclaimedClear rPET
≈54%(Economic)
3Waste Valuation; ReclaimedGreen rPET
≈32%(Economic)
4 Reclaimed rPET -Cutoff 0%
Combining Reclaimed PET with Bio-based Monomers Enables Plastics Upcycling: Supply Chain GHG Emissions

Design for recycling (DfR) principles for some clean energy technologies
In pursuit of a circular economy, the proverbial last line of defense when a product reaches it’s End-of-Life (EOL) is recycling.
Two ways to improve recyclability1. design a better recycling process, and/or 2. Implement Design for Recycling (DfR) strategies prior to
the product manufacturing stage. DfR strategies: function of both the product in question &
the nature of available recycling processes. Additional factors, such as legislation and business realities, must also be considered.

Design for recycling (DfR) principles for some clean energy technologies
Literature review: performed to compile a preliminary list of DfR best practices. The results of which were socialized with experts within NREL, DOE, and industry in order to obtain feedback for further inclusion. List currently consists of 10 overarching DfR guidelines, and
4 to 8 renewable energy (RE) tech specific DfR guidelines & observations each for PV, wind, and batteries.
Example of one such DfR strategy after industry feedback: “Ensure circularity, minimize the use of or substitute
hazardous materials. This will impact not only the safety of recycling efforts, but potentially also avoids contamination of recycling outputs and characterization as hazardous waste.”

Recycling itself often consists of multiple stages. For example, a metallic output from a shredding recycler will likely undergo various degrees of smelting and refining before a product manufacturer can make use of the material.The relationship between a circular economy, recycling stages, the implementation of, and considerations necessary for effective DfR are illustrated in the figure below.(See Figure on next slide)
Design for recycling principles for some clean energy technologies

Circular Economy Butterfly Diagram(Modified from the Ellen McArthur Foundation)
Design for recycling principles for some clean energy technologies
In some cases, as shown by the dotted line DfRmay enable the direct recovery of intact components for immediate reuse, thus bypassing significant intermediate energy expenditures and potential materials losses.