poster - waters corporation · poster reprint introduction • full characterization of the...
TRANSCRIPT
Post
erRE
PRIN
T
INTRODUCTION
• Full characterization of the physicochemicalproperties of new chemical entities (NCE’s)typically takes place in pharmaceuticaldevelopment laboratories. However, in an effortto minimize drug development costs,pharmaceutical companies are now pushingphysicochemical screening back into the drugdiscovery laboratories so that unsuitablecompounds fail earlier in the process.
• By generating retention time and quantitativedata, LC/UV/MS provides a mechanism bywhich indicators of compounds’physicochemical properties—such as solubility,hydrophobicity, membrane permeability,stability, and protein binding—can be modeledand screened.
• The large number of compounds that requirescreening can be analyzed by high throughputparallel LC/UV/MS methods. This technologyallows the analysis of more samples in the sametime, or the analysis of multiplephysicochemical properties at the same time.While many compounds can be tested, largevolumes of data from these parallel analysesmust still be processed and reviewed.
• The new software application presented here,ProfileLynx™ Application Manager, handlessample set management, data processing andresults browsing, as well as provides exportingcapabilities and interactivity with other softwarepackages to simplify physicochemical propertyscreening.
• The multiple streams of acquisition data fromparallel LC/UV/MS systems are integrated intoan easily managed and interpreted format byProfileLynx.
PHYSICOCHEMICAL PROPERTY PROFILING
Compounds were screened for their physicochemicalproperties using three different indicators:
• Chromatographic hydrophobicity index using C18
column retention (CHI) at various pH’s
- The CHI relates directly to the log D of a compound, which indicates the compound’s solubility and permeability
• Chromatographic hydrophobicity index usingimmobilized artificial membrane (IAM) columns(CHIIAM)
- The CHIIAM is measured on IAM columns under gradient conditions and relates to the membrane permeability of a compound
• Solubility
Michael Jackson, Michael P. Balogh, Warren Potts, Waters Corporation, Milford, MA 01757, USA
Presented at ASMS, Montréal, Canada, June 8-12, 2003
AN INTERACTIVE PHYSICOCHEMICALPROPERTY PROFILING SOFTWARE FOR EARLYCANDIDATE ANALYSIS IN DRUG DISCOVERY

EXPERIMENTS
Single Chromatographic System
Experiment 1: CHI Screening
• Standards with known CHI values were run todetermine the correlation between retention timeand CHI
• Pharmaceutical compounds were then analyzedand their CHI values were calculated from thecompounds’ chromatographic retention time atpH 7.4
Experiment 2: Simulated Solubility Screening
• A wide set of pharmaceutical compounds wereused to simulate a solubility study
• The analysis used a plate of standards of knownconcentration and then a plate of samples withvarying concentrations
• Calibration curves were developed using thestandards, and compounds were quantified todetermine their "solubility"
Post
erRE
PRIN
T
WatersMicromass ZQ™
MassSpectrometer
Waters 1525µBinary HPLC Pump
Waters 2777Sample Manager
LC Column(0.50 mL/min)
Waters 2996Photodiode
Array Detector
Splitter(0.05 mL/min)
Electrospray Probe
pH 7.4
MassLynx™ 4.0 &ProfileLynx™Application
ManagerWaters ECP™ System for Early Candidate Profiling
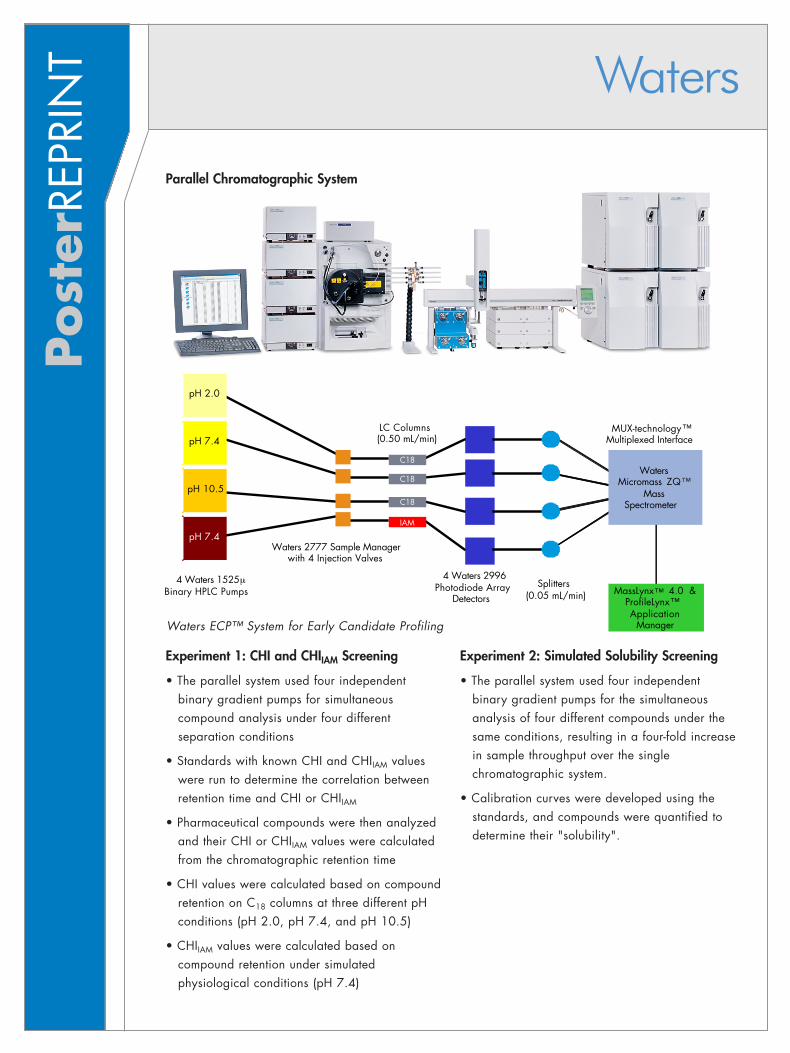
Parallel Chromatographic System
Experiment 1: CHI and CHIIAM Screening
• The parallel system used four independentbinary gradient pumps for simultaneouscompound analysis under four differentseparation conditions
• Standards with known CHI and CHIIAM valueswere run to determine the correlation betweenretention time and CHI or CHIIAM
• Pharmaceutical compounds were then analyzedand their CHI or CHIIAM values were calculatedfrom the chromatographic retention time
• CHI values were calculated based on compoundretention on C18 columns at three different pHconditions (pH 2.0, pH 7.4, and pH 10.5)
• CHIIAM values were calculated based oncompound retention under simulatedphysiological conditions (pH 7.4)
Experiment 2: Simulated Solubility Screening
• The parallel system used four independentbinary gradient pumps for the simultaneousanalysis of four different compounds under thesame conditions, resulting in a four-fold increasein sample throughput over the singlechromatographic system.
• Calibration curves were developed using thestandards, and compounds were quantified todetermine their "solubility".
Post
erRE
PRIN
T
WatersMicromass ZQ™
MassSpectrometer
MassLynx™ 4.0 &ProfileLynx™Application
Manager
4 Waters 1525µBinary HPLC Pumps
Waters 2777 Sample Managerwith 4 Injection Valves
LC Columns(0.50 mL/min)
4 Waters 2996Photodiode Array
DetectorsSplitters
(0.05 mL/min)
MUX-technology™Multiplexed Interface
pH 7.4
pH 2.0
pH 7.4
pH 10.5
IAM
C18
C18
C18
Waters ECP™ System for Early Candidate Profiling

Post
erRE
PRIN
T
METHODS
Columns
• CHI
- Waters XTerra® MS C18 3.5mm 3.9x50mm
• CHIIAM
- Regis Technologies IAM Fast-Screen Mini Column 3x10mm with Ester IAM.PC.C10/C3 packing
• Simulated Solubility
- Waters XTerra® MS C18 3.5mm 3.9x50mm
Mobile Phases
• CHI & CHIIAM
- A: CHI pH 2.0, 0.01% v/v phosphoric acid
- A: CHI pH 7.4, 10 mM ammonium acetate
- A: CHI pH 10.5, 10 mM ammonium acetate
- A: CHIIAM, pH 7.4, 10 mM ammonium acetate
- B: 100% ACN
• Simulated Solubility
- A: H2O
- B: 100% ACN
HPLC Gradients
Injection Volume
- 2.0 µL
MS Conditions
• ESI+ and ESI-
• 100 to 600 amu
• Scan time 0.3 sec
• Interscan delay 0.1 sec
• Cone voltage 30V
• Capillary voltage 3.0 kV
• Source temp 120 ˚C
• Desolvation temp 300 ˚C
6100%0%0.5mL/min
12
0.5mL/min
0.5mL/min
0.5mL/min
Flow
10%100%14
6100%0%10
-0%100%0
Curve%B%ATime
60%100%0.5mL /min
6
0.5mL /min
0.5mL /min
Flow
6100%0%4
-0%100%0
Curve%B%ATime
Simulated StabilityCHI and CHIIAM

Post
erRE
PRIN
T
PHYSICOCHEMICAL PROPERTY PROFILINGSOFTWARE
Step 1: Define the physicochemical propertyexperiment
Using the MassLynx sample list, thephysicochemical experiment parameters can beassociated with appropriate samples. From theSample List, all of the ProfileLynx ApplicationManager tools can be accessed.
Step 2: Define and set experimental criteria for physicochemical property calibration
Developing the relationship between retentiontimes and physicochemical property indicators iseasily enabled through the Calibration Editor inProfileLynx. In the Calibration Editor the usersimply selects the type of retention time calibrationto be used (CHI, CHIIAM, IAM, or Protein Binding)and then provides a customizable name for thespecific experiment. The user then sets criteria suchas the equation to use for calculating thephysicochemical property indicator, integrationparameters, and retention time ranges for theretention time calibration.
Calibration Editor
Sample List

Post
erRE
PRIN
T
Step 3: Review physicochemical property calibration
Retention time calibration review is facilitatedthrough the Calibration Review Tool.Chromatograms can be manually integrated,peaks can be reassigned, and points can beignored. The calibration is then stored and can beused during compound analysis.
Step 4: Select the type of experiment to be runand set pass/fail criteria
The type of physicochemical property screeningexperiment to be run is selected in the ExperimentEditor. Options include CHI, IAM, solubility,permeability, stability, protein binding,partitioning, and metabolic inhibition.
Step 5: Review physicochemical property analysis results by compound or experiment
Processed analysis results can be viewed byexperiment or by compound using the data reviewtool. The sample table shows the calculatedphysicochemical property indicator values for thesamples, as well as markings to indicate whetherthe sample passed or failed the test based onthreshold criteria. The first column in the displayshows a summary of all the pass/fail criteria. Ifthe mouse indicator is passed over a failed field, apop-up box indicates the reason for the failure.Manual adjustments to peak integration and peakassignments may also be made in this view.Physicochemical property analysis results may alsobe sorted and viewed by experiment.
Data Review Tool
Experiment Editor
Data Review By Compound
Data Review By Experiment

Post
erRE
PRIN
T
Step 6: Export data
Data export is facilitated through the Data ExportManager. The format of the exported data file isdefined in the data review window. The exportfile itself can be either xml, comma delimited, tabdelimited or html format.
CONCLUSIONS
• The ProfileLynx Application Manager is wellsuited to do multiple physicochemical propertyindicator measurements simultaneously.
• The ProfileLynx Application Manager easilyinterfaces with existing data systems and canreport physicochemical data using a graphicalinterface.
• The ProfileLynx Application Manager allowseasy data management and review and allowsfull automation of physicochemical indicatormeasurements with little or no operatorintervention.
FUTURE WORK• Open Access walk-up type analysis for fully
automated analysis with automated reportingand e-mailing of results to chemists.
• Inclusion of time-based metabolic and stabilitycalculations.
• Integration of a fully customizable sampleimport tool to allow connection with any type ofsample list format.
• Development of database interactivity tools toallow warehousing and retrieval of thephysicochemical data.
ACKNOWLEDGEMENTS• Andy Organ, Klara Valko; GlaxoSmithKline, UK• Mark Hemling, H. Y. Cheng; GlaxoSmithKline, US• Larry Mallis, Chris Petucci; Wyeth Ayerst, US• Graeme Wells, Paul Chilvers, Maqsood Adia, David Deans; Waters, UK
Waters, Micromass, ProfileLynx, ZQ, MassLynx, ECP, MUX-technology and XTerra aretrademarks of Waters Corporation.All other trademarks are the property of their respective owners.©2003 Waters Corporation Produced in the U.S.A. June 2003 720000669EN LW-PDF
WATERS CORPORATION34 Maple St.Milford, MA 01757 U.S.A.T: 508 478 2000F: 508 872 1990www.waters.com
Data Export Manager
REFERENCES• Valko, K.; Du, C. M.; Bevan, C. D.; Reynolds, D. P.; Abraham, M. H. J.
Pharm. Sci. 2000, 89 (8), 1085-1096.• Valko, K.; Du, C. M.; Bevan, C. D.; Reynolds, D. P.; Abraham, M. H.
Current Medicinal Chemistry. 2001, 8(7).• Kangas, H.; Kotiaho, T.; Salminen, T.; Kostianinen, R. Rapid
Communications in Mass Spectrometry. 2001, 15: 1501-1505.• Liu, H.; Carter, G. T.; Tischler, M. Rapic Communications in Mass
Spectrometry. 2001, 15: 1533-1538.• Camurri, Giulio; Zaramella, Alessio. Anal. Chem. 2001, 73 (15), 3716-3722.