postmortem program analysis with hardware-enhanced … · pomp: postmortem program analysis with...
TRANSCRIPT

This paper is included in the Proceedings of the 26th USENIX Security SymposiumAugust 16–18, 2017 • Vancouver, BC, Canada
ISBN 978-1-931971-40-9
Open access to the Proceedings of the 26th USENIX Security Symposium
is sponsored by USENIX
Postmortem Program Analysis with Hardware-Enhanced Post-Crash Artifacts
Jun Xu, The Pennsylvania State University; Dongliang Mu, Nanjing University; Xinyu Xing, Peng Liu, and Ping Chen, The Pennsylvania State University; Bing Mao, Nanjing University
https://www.usenix.org/conference/usenixsecurity17/technical-sessions/presentation/xu-jun
POMP: Postmortem Program Analysis withHardware-Enhanced Post-Crash Artifacts
Jun Xu†, Dongliang Mu
‡†, Xinyu Xing
†, Peng Liu
†, Ping Chen
†, and Bing Mao
‡
†College of Information Sciences and Technology, The Pennsylvania State University
‡State Key Laboratory for Novel Software Technology, Department of Computer Science and
Technology, Nanjing University{jxx13,dzm77,xxing, pliu, pzc10}@ist.psu.edu, {maobing}@nju.edu.cn
AbstractWhile a core dump carries a large amount of infor-
mation, it barely serves as informative debugging aidsin locating software faults because it carries informationthat indicates only a partial chronology of how programreached a crash site. Recently, this situation has beensignificantly improved. With the emergence of hardware-assisted processor tracing, software developers and secu-rity analysts can trace program execution and integratethem into a core dump. In comparison with an ordinarycore dump, the new post-crash artifact provides softwaredevelopers and security analysts with more clues as to aprogram crash. To use it for failure diagnosis, however, itstill requires strenuous manual efforts.
In this work, we propose POMP, an automated tool tofacilitate the analysis of post-crash artifacts. More specif-ically, POMP introduces a new reverse execution mecha-nism to construct the data flow that a program followedprior to its crash. By using the data flow, POMP thenperforms backward taint analysis and highlights thoseprogram statements that actually contribute to the crash.
To demonstrate its effectiveness in pinpointing programstatements truly pertaining to a program crash, we haveimplemented POMP for Linux system on x86-32 platform,and tested it against various program crashes resultingfrom 31 distinct real-world security vulnerabilities. Weshow that, POMP can accurately and efficiently pinpointprogram statements that truly pertain to the crashes, mak-ing failure diagnosis significantly convenient.
1 Introduction
Despite the best efforts of software developers, softwareinevitably contains defects. When they are triggered, aprogram typically crashes or otherwise terminates ab-normally. To track down the root cause of a softwarecrash, software developers and security analysts need toidentify those program statements pertaining to the crash,
analyze these statements and eventually figure out whya bad value (such as an invalid pointer) was passed tothe crash site. In general, this procedure can be signif-icantly facilitated (and even automated) if both controland data flows are given. As such, the research on post-mortem program analysis primarily focuses on findingout control and data flows of crashing programs. Ofall techniques on postmortem program analysis, record-and-replay (e.g., [10, 12, 14]) and core dump analysis(e.g., [16, 26, 36]) are most common.
Record-and-replay is a technique that typically instru-ments a program so that one can automatically log non-deterministic events (i. e., the input to a program as wellas the memory access interleavings of the threads) andlater utilize the log to replay the program deterministically.In theory, this technique would significantly benefit rootcause diagnosis of crashing programs because develop-ers and security analysts can fully reconstruct the controland data flows prior to a crash. In practice, it however isnot widely adopted due to the requirement of program in-strumentation and the high overhead it introduces duringnormal operations.
In comparison with record-and-reply, core dump analy-sis is a lightweight technique for the diagnosis of programcrashes. It does not require program instrumentation, norrely upon the log of program execution. Rather, it facil-itates program failure diagnosis by using more genericinformation, i. e., the core dump that an operating systemautomatically captures every time a process has crashed.However, a core dump provides only a snapshot of thefailure, from which core dump analysis techniques caninfer only partial control and data flows pertaining to pro-gram crashes. Presumably as such, they have not beentreated as the first choice for software debugging.
Recently, the advance in hardware-assisted processortracing significantly ameliorates this situation. With theemergence of Intel PT [6] – a brand new hardware featurein Intel CPUs – software developers and security ana-lysts can trace instructions executed and save them in a
USENIX Association 26th USENIX Security Symposium 17

circular buffer. At the time of a program crash, an oper-ating system includes the trace into a core dump. Sincethis post-crash artifact contains both the state of crashingmemory and the execution history, software developersnot only can inspect the program state at the time of thecrash, but also fully reconstruct the control flow that led tothe crash, making software debugging more informativeand efficient.
While Intel PT augments software developers with theability of obtaining more informative clues as to a soft-ware crash, to use it for the root cause diagnosis of soft-ware failures, it is still time consuming and requires alot of manual efforts. As we will discuss in Section 2,a post-crash artifact1 typically contains a large amountof instructions. Even though it carries execution historythat allows one to fully reconstruct the control flow that acrashing program followed – without an automated toolto eliminate those instructions not pertaining to the fail-ure – software developers and security analysts still needto manually examine each instruction in an artifact andidentify those that actually contribute to the crash.
To address this problem, recent research [22] has pro-posed a technical approach to identify program statementsthat pertain to a software failure. Technically speaking,it combines static program analysis with a cooperativeand adaptive form of dynamic program analysis that usesIntel PT. While shown to be effective in facilitating failurediagnosis, particularly those caused by concurrency bugs,this technique is less likely to be effective in analyzingcrashes resulting from memory corruption vulnerabilities(e.g. buffer overflow or use after free). This is due tothe fact that a memory corruption vulnerability allows anattacker to manipulate the control (or data) flow, whereasthe static program analysis heavily relies upon the as-sumption that program execution does not violate controlnor data flow integrity. Given that the technique proposedin [22] needs to track data flow using hardware watch-points in a collaborative manner, this technique is also lesssuitable to the situation where program crashes cannot beeasily collected in a crowd-sourcing manner.
In this work, we design and develop POMP, a new auto-mated tool that analyzes a post-crash artifact and pinpointsstatements pertaining to the crash. Considering that thecontrol flow of a program might be hijacked and staticanalysis is unreliable, the design of POMP is exclusivelyon the basis of the information residing in post-crash arti-facts. In particular, POMP introduces a reverse executionmechanism which takes as input a post-crash artifact, an-alyzes the crashing memory and reversely executes theinstructions residing in the artifact. With the support ofthis reverse execution, POMP reconstructs the data flow
1By a post-crash artifact, without further specification, we mean acore dump including both the snapshot of crashing memory and theinstructions executed prior to the crash.
that a program followed prior to its crash, and then utilizesbackward taint analysis to pinpoint the critical instructionsleading up to the crash.
The reverse execution proposed in this work is novel.In previous research, the design of reverse execution isunder the assumption of the data integrity in crashingmemory [16, 37] or heavily relies upon the capability ofrecording critical objects in memory [7–9, 13]. In thiswork, considering a software vulnerability might incurmemory corruption and object recording imposes over-head on normal operations, we relax this assumption andthe ability of data object recording, and introduce a recur-sive algorithm. To be specific, the algorithm performs therestoration of memory footprints by constructing the dataflow prior to the crash. In turn, it also employs recoveredmemory footprints to improve data flow construction. Ifneeded, the algorithm also verifies memory aliases andensures data flow construction does not introduce errorsor uncertainty. We detail this algorithm in Section 4.
To the best of our knowledge, POMP is the first workthat can recover the data flow prior to a program crash.Since POMP relies only upon a post-crash artifact, it isnon-intrusive to normal operations and, more importantly,generally applicable to any settings even though crashreport collection cannot be performed in a cooperativemanner. Last but not least, it should be noted that theimpact of this work is not just restricted to analyzingthe abnormal program termination caused by memorycorruption vulnerabilities. The technique we proposed isgenerally applicable to program crashes caused by othersoftware bugs, such as dereferencing null pointers. Wewill demonstrate this capability in Section 6.
In summary, this paper makes the following contribu-tions.
• We designed POMP, a new technique that analyzespost-crash artifacts by reversely executing instruc-tions residing in the artifact.• We implemented POMP on 32-bit Linux for facili-
tating software developers (or security analysts) topinpoint software defects, particularly memory cor-ruption vulnerabilities.• We demonstrated the effectiveness of POMP in fa-
cilitating software debugging by using various post-crash artifacts attributable to 31 distinct real worldsecurity vulnerabilities.
The rest of this paper is organized as follows. Section 2defines the problem scope of our research. Section 3presents the overview of POMP. Section 4 and 5 describethe design and implementation of POMP in detail. Sec-tion 6 demonstrates the utility of POMP. Section 7 sum-marizes the work most relevant to ours followed by somediscussion on POMP in Section 8. Finally, we concludethis work in Section 9.
18 26th USENIX Security Symposium USENIX Association

1 void test(void){2 ...3 }45 int child(int *a){6 a[0] = 1; // assigning value to var7 a[1] = 2; // overflow func8 return 0;9 }
1011 int main(){12 void (*func)(void);13 int var;14 func = &test;15 child(&var);16 func(); // crash site17 }
Table 1: A toy example with a stack overflow defect.
2 Problem Scope
In this section, we define the problem scope of our re-search. We first describe our threat model. Then, wediscuss why failure diagnosis can be tedious and tougheven though a post-crash artifact carries information thatallows software developers to fully reconstruct the controlflow that a program followed prior to its crash.
2.1 Threat Model
In this work, we focus on diagnosing the crash of a pro-cess. As a result, we exclude the program crashes that donot incur the unexpected termination of a running process(e.g., Java program crashes). Since this work diagnoses aprocess crash by analyzing a post-crash artifact, we fur-ther exclude those process crashes that typically do notproduce an artifact. Up to and including Linux 2.2, the de-fault action for CPU time limit exceeded, for example, isto terminate the process without a post-crash artifact [3].
As is mentioned above, a post-crash artifact containsnot only the memory snapshot of a crashing program butalso the instructions that the program followed prior toits crash2. Recall that the goal of this work is to identifythose program statements (i. e., instructions) that actuallypertain to the crash. Therefore, we assume the instructiontrace logged in an artifact is sufficiently long and theroot cause of a program failure is always enclosed. Inother words, we assume a post-crash artifact carries allthe instructions that actually contribute to the crash. Webelieve this is a realistic assumption because a softwaredefect is typically close to a crash site [19, 27, 39] and
2While Intel PT does not log unconditional jumps and linear code,a full execution trace can be easily reconstructed from the executiontrace enclosed in a post-crash artifact. By an execution trace in a post-crash artifact, without further specification, we mean a trace includingconditional branch, unconditional jump and linear code.
an operating system can easily allocate a memory regionto store the execution trace from a defect triggered to anactual crash. Since security analysts may not have theaccess to source code of crashing programs and they canonly pinpoint software defects using execution traces leftbehind crashes, it should be noted that we do not assumethe source code of the crashing program is available.
2.2 Challenge
As is mentioned earlier, Intel PT records program execu-tion in a circular buffer. At the time a software defect istriggered and incurs a crash, the circular buffer has gener-ally accumulated a large amount of conditional branches.After the control flow reconstruction from these branches,a full execution trace may carry more than a billion in-structions. Even if zooming in the trace from where a faultis triggered to where a crash occurs, a software developer(or security analyst) may confront tens of thousands ofinstructions. As such, it is tedious and arduous for asoftware developer to plow through an execution trace todiagnose the root cause of a software failure.
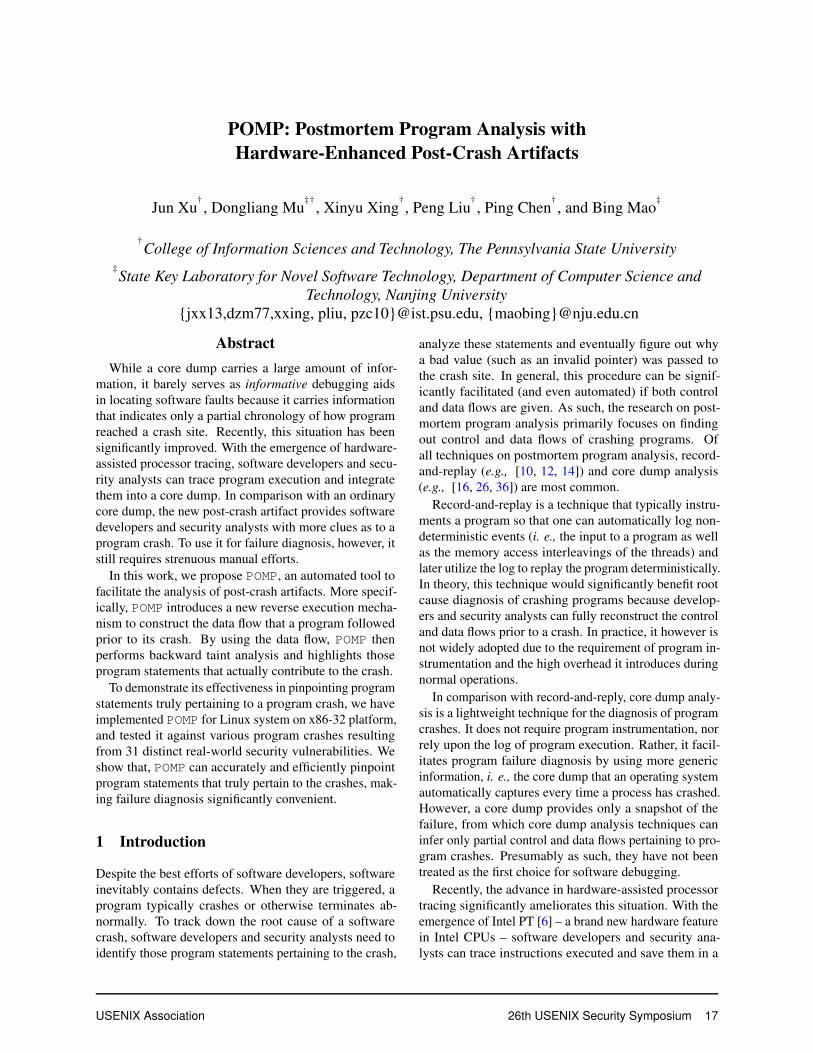
In fact, even though an execution trace is short and con-cise, it is still challenging for commonly-adopted manualdiagnosis strategies (like backward analysis). Here, wedetail this challenge using a toy example shown in Table 1.As is shown in the table, the program crashes at line16 due to an overflow that occurs at line 7. After thecrash, an execution trace is left behind in a post-crashartifact shown in Figure 1. In addition to the trace, theartifact captures the state of the crashing memory whichis illustrated as the values shown in column T20.
To diagnose the root cause with backward analysis forthe program crash shown in Figure 1, a software developeror security analyst typically follows through the executiontrace reversely and examines how the bad value in registereax was passed to the crash site (i. e., instruction A20shown in Figure 1). In this procedure, his effort can beprematurely blocked when his analysis reaches instructionA19. In that instruction mov overwrote register eaxand an inverse operation against this instruction lacksinformation to restore its previous value.
To address this problem, one straightforward solutionis to perform forward analysis when backward analysisreaches a non-invertible instruction. Take instruction A19for the example. By following a use-define chain, we canconstruct a data flow. Then, we can easily observe thatinstruction A15 specifies the definition of register eax,and that definition can reach instruction A19 without anyother intervening definitions. As a result, we can restorethe value in register eax and thus complete the inverseoperation for instruction A19.
While the backward and forward analysis provides se-curity analysts with an effective method to construct data
USENIX Association 26th USENIX Security Symposium 19

A1: push ebpA2: mov ebp, espA3: sub esp, 0x14A4: mov [ebp-0xc], testA5: lea eax, [ebp-0x10]A6: push eax ;argument of &varA7: call childA8: push ebpA9: mov ebp, espA10: mov eax, [ebp+0x8]A11: mov [eax], 0x1 ;a[0]=1A12: mov eax, [ebp+0x8]A13: add eax, 0x4A14: mov [eax], 0x2 ;a[1]=2A15: mov eax, 0x0A16: pop ebpA17: retA18: add esp, 0x4A19: mov eax, [ebp-0xc]A20: call eax ;crash site
Time
T20 T19 T18 T17 T16 T15 T14 T13 T12
Register
eax 0x0002 0x0002 0x0000 0x0000 0x0000 0x0000 0xff1c 0xff1c 0xff18
ebp 0xff28 0xff28 0xff28 0xff28 0xff28 0xff08 0xff08 0xff08 0xff08
esp 0xff14 0xff14 0xff14 0xff10 0xff0c 0xff08 0xff08 0xff08 0xff08
Memory A
ddress
0xff1c 0x0002 0x0002 0x0002 0x0002 0x0002 0x0002 0x0002 test test
0xff18 0x0001 0x0001 0x0001 0x0001 0x0001 0x0001 0x0001 0x0001 0x0001
0xff14 0x0000 0x0000 0x0000 0x0000 0x0000 0x0000 0x0000 0x0000 0x0000
0xff10 0xff18 0xff18 0xff18 0xff18 0xff18 0xff18 0xff18 0xff18 0xff18
0xff0c A18 A18 A18 A18 A18 A18 A18 A18 A18
0xff08 0xff28 0xff28 0xff28 0xff28 0xff28 0xff28 0xff28 0xff28 0xff28
Execution trace
T1T2T3T4T5T6T7T8T9T10T11T12T13T14T15T16T17T18T19T20
Time
Crashing memory Memory footprints reconstructed across time
Figure 1: A post-crash artifact along with the memory footprints recovered by reversely executing the trace enclosed in the artifact.Note that, for simplicity, all the memory addresses and the value in registers are trimmed and represented with two hex digits. Notethat A18 and test indicate the addresses at which the instruction and function are stored.
flows, this is not sufficient for completing program fail-ure diagnosis. Again, take for example the executiontrace shown in Figure 1. When backward analysis passesthrough instruction A15 and reaches instruction A14,through forward analysis, a security analyst can quicklydiscover that the value in register eax after the executionof A14 is dependent upon both instruction A12 and A13.As a result, an instinctive reaction is to retrieve the valuestored in the memory region specified by [ebp+0x8]shown in instruction A12. However, memory indicatedby [ebp+0x8] and [eax] shown in instruction A14might be alias of each other. Without an approach to re-solve memory alias, one cannot determine if the definitionin instruction A14 interrupts the data flow from instruc-tions A12 and A13. Thus, program failure diagnosis hasto discontinue without an outcome.
3 Overview
In this section, we first describe the objective of this re-search. Then, we discuss our design principle followedby the basic idea on how POMP performs postmortemprogram analysis.
3.1 ObjectiveThe goal of software failure diagnosis is to identify theroot cause of a failure from the instructions enclosed inan execution trace. Given a post-crash artifact containingan execution trace carrying a large amount of instructionsthat a program has executed prior to its crash, however,any instructions in the trace can be potentially attributable
to the crash. As we have shown in the section above, it istedious and tough for software developers (or security an-alysts) to dig through the trace and pinpoint the root causeof a program crash. Therefore, the objective of this workis to identify only those instructions that truly contributeto the crash. In other words, given a post-crash artifact,our goal is to highlight and present to software developers(or security analysts) the minimum set of instructions thatcontribute to a program crash. Here, our hypothesis is thatthe achievement of this goal can significantly reduce themanual efforts of finding out the root cause of a softwarefailure.
3.2 Design Principle
To accomplish the aforementioned objective, we de-sign POMP to perform postmortem analysis on binaries– though in principle this can be done on a source codelevel – in that this design principle can provide softwaredevelopers and security analysts with the following bene-fits. Without having POMP tie to a set of programs writtenin a particular programming language, our design prin-ciple first allows software developers to employ a singletool to analyze the crashes of programs written in vari-ous language (e.g., assembly code, C/C++ or JavaScript).Second, our design choice eliminates the complicationintroduced by the translation between source code andbinaries in that a post-crash artifact carries an executiontrace in binaries which can be directly consumed by anal-ysis at the binary level. Third, with the choice of ourdesign, POMP can be generally applied to software failuretriage or categorization in which a post-crash artifact is
20 26th USENIX Security Symposium USENIX Association

the only resource for analysis and the source code of acrashing program is typically not available [16, 18].
3.3 Technical Approach
As is mentioned earlier in Section 1, it is significantly con-venient to identify the instructions pertaining to a programcrash if software developers and security analysts can ob-tain the control and data flows that a program followedprior to its crash.
We rely on Intel PT to trace the control flow of a pro-gram and integrate it into the post-crash artifact. PTis a low-overhead hardware feature in recent Intel pro-cessors (e.g., Skylake series). It works by capturing in-formation about software execution on each hardwarethread [6]. The captured information is orgranized indifferent types of data packets. Packets about programflow encodes the transfers of control flow (e.g., targets ofindirect branches and taken/not-taken indications of con-ditional direct branches). With the control flow transfersand the program binaries, one is able to fully reconstructthe trace of executed instructions. Details of our configu-ration and use with PT are presented in Section 5.
Since a post-crash artifact has already carried the con-trol flow that a crashing program followed, the main focusis to reconstruct the data flow from the post-crash artifactthat a crashing program left behind.
To reconstruct the data flow pertaining to a programfailure, POMP introduces a reverse execution mechanismto restore the memory footprints of a crashing program.This is due to the fact that the data flow can be easilyderived if machine states prior to a program crash are allavailable. In the following, we briefly describe how torecover memory footprints and build a data flow throughreverse execution, and how to utilize that data flow torefine instructions that truly pertain to a program crash.
Our reverse execution mechanism is an extension ofthe aforementioned forward-and-backward analysis. Notonly does it automate the forward-and-backward analysis,making the inverse operations for instructions effortless,but also automatically verifies memory aliases and en-sures an inverse operation does not introduce errors oruncertainty.
With this reverse execution mechanism, POMP can eas-ily restore the machine states prior to the execution ofeach instruction. Here, we illustrate this with the exampleshown in Figure 1. After reverse execution completesthe inverse operation for instruction A19 through theaforementioned forward and backward analysis, it caneasily restore the value in register eax and thus the mem-ory footprint prior to the execution of A19 (see memoryfootprint at time T18). With this memory footprint, thememory footprint prior to instruction A18 can be easilyrecovered because arithmetical instructions do not intro-
duce non-invertible effects upon memory (see the memoryfootprint at time T17).
Since instruction A17 can be treated as mov eip,[esp] and then add esp, 0x4, and instruction A16is equivalent to mov ebp, [esp] and then addesp, 0x4, reverse execution can further restore mem-ory footprints prior to their execution by following thescheme of how it handles mov and arithmetical instruc-tions above. In Figure 1, we illustrate the memory foot-prints prior to the execution of both instructions.
Recall that performing an inverse operation for instruc-tion A15, forward and backward analysis cannot deter-mine whether the use of [ebp+0x8] specified in instruc-tion A12 can reach the site prior to the execution of in-struction A15 because [eax] in A14 and [ebp+0x8]in A12 might just be different symbolic names that accessdata in the same memory location.
To address this issue, one instinctive reaction is to usethe value-set analysis algorithm proposed in [11]. How-ever, value-set analysis assumes the execution complieswith standard compilation rules. When memory corrup-tion happens and leads to a crash, these rules are typicallyviolated and, therefore, value-set analysis is very likely tobe error-prone. In addition, value-set analysis producesless precise information, not suitable for reverse execu-tion to verify memory aliases. In this work, we employa hypothesis test to verify possible memory aliases. Tobe specific, our reverse execution creates two hypotheses,one assuming two symbolic names are aliases of eachother while the other assuming the opposite. Then, it testseach of these hypotheses by emulating inverse operationsfor instructions.
Let’s continue the example shown in Figure 1. Now,reverse execution can create two hypotheses, one assum-ing [eax] and [ebp+0x8] are aliases of each otherwhile the other assuming the opposite. For the firsthypothesis, after performing the inverse operation forinstruction A15, the information carried by the mem-ory footprint at T14 would have three constraints, in-cluding eax = ebp+ 0x8, eax = [ebp+ 0x8] + 0x4 and[eax] = 0x2. For the second hypothesis, the constraint setwould include eax 6= ebp+0x8, eax = [ebp+0x8]+0x4and [eax] = 0x2. By looking at the memory footprint atT14 and examining these two constraint sets, reverse exe-cution can easily reject the first hypothesis and accept thesecond because constraint eax = ebp+ 0x8 for the firsthypothesis does not hold. In this way, reverse executioncan efficiently and accurately recover the memory foot-print at time T14. After the memory footprint recoveryat T14, reverse execution can further restore earlier mem-ory footprints using the scheme we discussed above, andFigure 1 illustrates part of these memory footprints.
With memory footprints recovered, software develop-ers and security analysts can easily derive the correspond-
USENIX Association 26th USENIX Security Symposium 21
Before After
A19 use: ebp 0xff28
A19 use: [ebp-0xc] 0x0002
A19 use: eax ??
A19 def: eax = [ebp-0xc] 0x0002
A20 use: eax 0x0002
A18 use: esp 0xff10
A18 def: esp = esp+4 0xff14
A19 use: ebp 0xff28
A19 use: [ebp-0xc] 0x0002
A19 use: eax ??
A19 def: eax = [ebp-0xc] 0x0002
A20 use: eax 0x0002
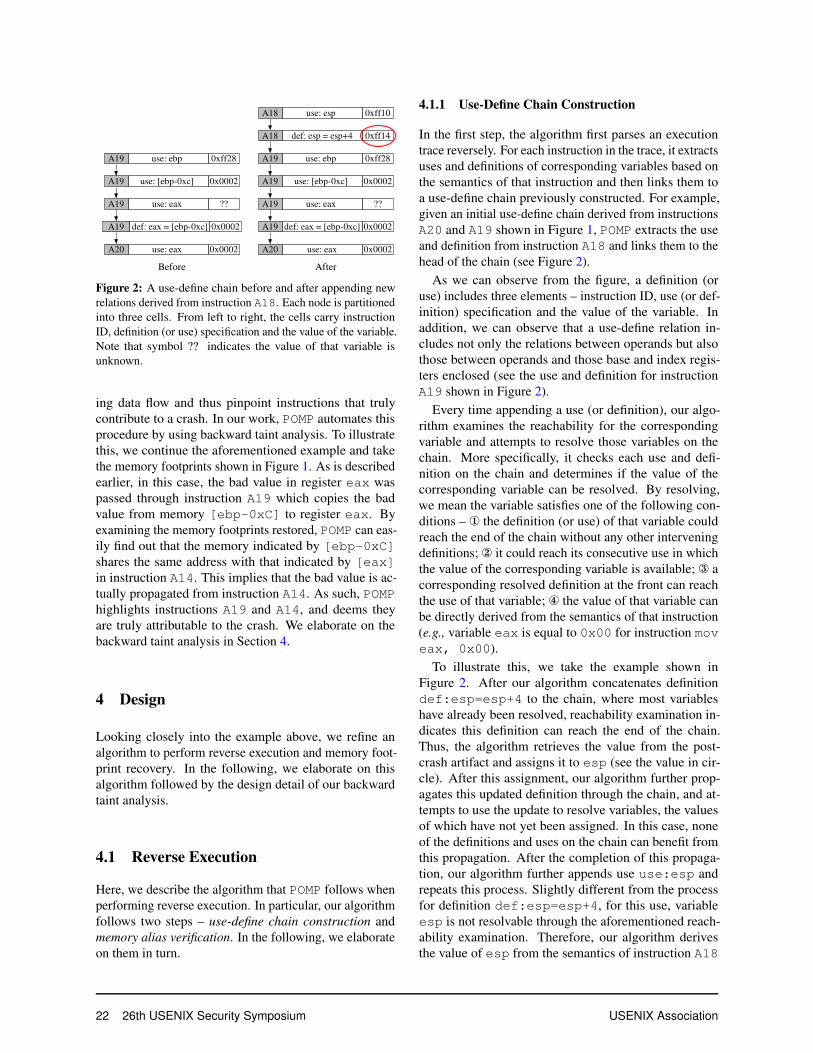
Figure 2: A use-define chain before and after appending newrelations derived from instruction A18. Each node is partitionedinto three cells. From left to right, the cells carry instructionID, definition (or use) specification and the value of the variable.Note that symbol ?? indicates the value of that variable isunknown.
ing data flow and thus pinpoint instructions that trulycontribute to a crash. In our work, POMP automates thisprocedure by using backward taint analysis. To illustratethis, we continue the aforementioned example and takethe memory footprints shown in Figure 1. As is describedearlier, in this case, the bad value in register eax waspassed through instruction A19 which copies the badvalue from memory [ebp-0xC] to register eax. Byexamining the memory footprints restored, POMP can eas-ily find out that the memory indicated by [ebp-0xC]shares the same address with that indicated by [eax]in instruction A14. This implies that the bad value is ac-tually propagated from instruction A14. As such, POMPhighlights instructions A19 and A14, and deems theyare truly attributable to the crash. We elaborate on thebackward taint analysis in Section 4.
4 Design
Looking closely into the example above, we refine analgorithm to perform reverse execution and memory foot-print recovery. In the following, we elaborate on thisalgorithm followed by the design detail of our backwardtaint analysis.
4.1 Reverse Execution
Here, we describe the algorithm that POMP follows whenperforming reverse execution. In particular, our algorithmfollows two steps – use-define chain construction andmemory alias verification. In the following, we elaborateon them in turn.
4.1.1 Use-Define Chain Construction
In the first step, the algorithm first parses an executiontrace reversely. For each instruction in the trace, it extractsuses and definitions of corresponding variables based onthe semantics of that instruction and then links them toa use-define chain previously constructed. For example,given an initial use-define chain derived from instructionsA20 and A19 shown in Figure 1, POMP extracts the useand definition from instruction A18 and links them to thehead of the chain (see Figure 2).
As we can observe from the figure, a definition (oruse) includes three elements – instruction ID, use (or def-inition) specification and the value of the variable. Inaddition, we can observe that a use-define relation in-cludes not only the relations between operands but alsothose between operands and those base and index regis-ters enclosed (see the use and definition for instructionA19 shown in Figure 2).
Every time appending a use (or definition), our algo-rithm examines the reachability for the correspondingvariable and attempts to resolve those variables on thechain. More specifically, it checks each use and defi-nition on the chain and determines if the value of thecorresponding variable can be resolved. By resolving,we mean the variable satisfies one of the following con-ditions – ¬ the definition (or use) of that variable couldreach the end of the chain without any other interveningdefinitions; it could reach its consecutive use in whichthe value of the corresponding variable is available; ® acorresponding resolved definition at the front can reachthe use of that variable; ¯ the value of that variable canbe directly derived from the semantics of that instruction(e.g., variable eax is equal to 0x00 for instruction moveax, 0x00).
To illustrate this, we take the example shown inFigure 2. After our algorithm concatenates definitiondef:esp=esp+4 to the chain, where most variableshave already been resolved, reachability examination in-dicates this definition can reach the end of the chain.Thus, the algorithm retrieves the value from the post-crash artifact and assigns it to esp (see the value in cir-cle). After this assignment, our algorithm further prop-agates this updated definition through the chain, and at-tempts to use the update to resolve variables, the valuesof which have not yet been assigned. In this case, noneof the definitions and uses on the chain can benefit fromthis propagation. After the completion of this propaga-tion, our algorithm further appends use use:esp andrepeats this process. Slightly different from the processfor definition def:esp=esp+4, for this use, variableesp is not resolvable through the aforementioned reach-ability examination. Therefore, our algorithm derivesthe value of esp from the semantics of instruction A18
22 26th USENIX Security Symposium USENIX Association
A11 def: [eax] 0x0001 A12 use: ebp 0xff08
A11 use: [eax] ??
A11 use: eax ??
A10 def: eax ??
A10 use: eax ??
A10 use: [ebp+0x8] ??
A10 use: ebp 0xff08
A9 def: ebp 0xff08
A9 use: ebp ??
A9 use: esp 0xff08
A12 use: [ebp+0x8] ??
A12 use: eax ??
A12 def: eax ??
A13 use: eax ??
A13 def: eax ??
A14 use: eax ??
A14 use: [eax] ??
A14 def: [eax] 0x2
... ... ...
X
Dat
a flo
w
Data flow
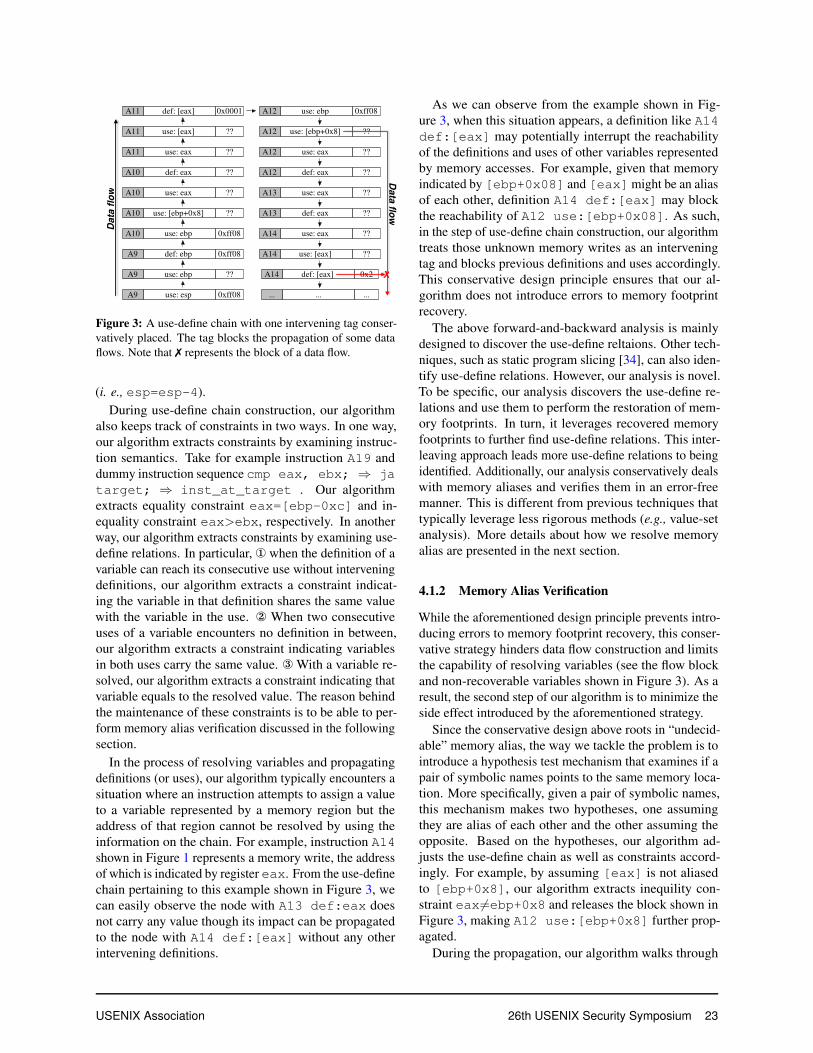
Figure 3: A use-define chain with one intervening tag conser-vatively placed. The tag blocks the propagation of some dataflows. Note that 7 represents the block of a data flow.
(i. e., esp=esp-4).During use-define chain construction, our algorithm
also keeps track of constraints in two ways. In one way,our algorithm extracts constraints by examining instruc-tion semantics. Take for example instruction A19 anddummy instruction sequence cmp eax, ebx; ⇒ jatarget; ⇒ inst_at_target . Our algorithmextracts equality constraint eax=[ebp-0xc] and in-equality constraint eax>ebx, respectively. In anotherway, our algorithm extracts constraints by examining use-define relations. In particular, ¬ when the definition of avariable can reach its consecutive use without interveningdefinitions, our algorithm extracts a constraint indicat-ing the variable in that definition shares the same valuewith the variable in the use. When two consecutiveuses of a variable encounters no definition in between,our algorithm extracts a constraint indicating variablesin both uses carry the same value. ® With a variable re-solved, our algorithm extracts a constraint indicating thatvariable equals to the resolved value. The reason behindthe maintenance of these constraints is to be able to per-form memory alias verification discussed in the followingsection.
In the process of resolving variables and propagatingdefinitions (or uses), our algorithm typically encounters asituation where an instruction attempts to assign a valueto a variable represented by a memory region but theaddress of that region cannot be resolved by using theinformation on the chain. For example, instruction A14shown in Figure 1 represents a memory write, the addressof which is indicated by register eax. From the use-definechain pertaining to this example shown in Figure 3, wecan easily observe the node with A13 def:eax doesnot carry any value though its impact can be propagatedto the node with A14 def:[eax] without any otherintervening definitions.
As we can observe from the example shown in Fig-ure 3, when this situation appears, a definition like A14def:[eax] may potentially interrupt the reachabilityof the definitions and uses of other variables representedby memory accesses. For example, given that memoryindicated by [ebp+0x08] and [eax]might be an aliasof each other, definition A14 def:[eax] may blockthe reachability of A12 use:[ebp+0x08]. As such,in the step of use-define chain construction, our algorithmtreats those unknown memory writes as an interveningtag and blocks previous definitions and uses accordingly.This conservative design principle ensures that our al-gorithm does not introduce errors to memory footprintrecovery.
The above forward-and-backward analysis is mainlydesigned to discover the use-define reltaions. Other tech-niques, such as static program slicing [34], can also iden-tify use-define relations. However, our analysis is novel.To be specific, our analysis discovers the use-define re-lations and use them to perform the restoration of mem-ory footprints. In turn, it leverages recovered memoryfootprints to further find use-define relations. This inter-leaving approach leads more use-define relations to beingidentified. Additionally, our analysis conservatively dealswith memory aliases and verifies them in an error-freemanner. This is different from previous techniques thattypically leverage less rigorous methods (e.g., value-setanalysis). More details about how we resolve memoryalias are presented in the next section.
4.1.2 Memory Alias Verification
While the aforementioned design principle prevents intro-ducing errors to memory footprint recovery, this conser-vative strategy hinders data flow construction and limitsthe capability of resolving variables (see the flow blockand non-recoverable variables shown in Figure 3). As aresult, the second step of our algorithm is to minimize theside effect introduced by the aforementioned strategy.
Since the conservative design above roots in “undecid-able” memory alias, the way we tackle the problem is tointroduce a hypothesis test mechanism that examines if apair of symbolic names points to the same memory loca-tion. More specifically, given a pair of symbolic names,this mechanism makes two hypotheses, one assumingthey are alias of each other and the other assuming theopposite. Based on the hypotheses, our algorithm ad-justs the use-define chain as well as constraints accord-ingly. For example, by assuming [eax] is not aliasedto [ebp+0x8], our algorithm extracts inequility con-straint eax 6=ebp+0x8 and releases the block shown inFigure 3, making A12 use:[ebp+0x8] further prop-agated.
During the propagation, our algorithm walks through
USENIX Association 26th USENIX Security Symposium 23

each of the nodes on the chain and examines if the newlypropagated data flow results in conflicts. Typically, thereare two types of conflicts. The most common is incon-sistence data dependency in which constraints mismatchthe data propagated from above (e.g., the example dis-cussed in Section 3). In addition to the conflict commonlyobserved, another type of conflict is invalid data depen-dency in which a variable carries an invalid value that issupposed to make the crashing program terminate earlieror follow a different execution path. For example, givena use-define chain established under a certain hypothe-sis, the walk-through discovers that a register carries aninvalid address and that invalid value should have thecrashing program terminate at a site ahead of its actualcrash site.
It is indisputable that once a constraint conflict is ob-served, our algorithm can easily reject the correspondinghypothesis and deem the pair of symbolic names is alias(or non-alias) of each other. However, if none of thesehypotheses produce constraint conflicts, this implies thatthere is a lack of evidence against our hypothesis test.Once this situation appears, our algorithm holds the cur-rent hypothesis and performs an additional hypothesis test.The reason is that a new hypothesis test may help removean additional intervening tag conservatively placed at thefirst step, and thus provides the holding test with moreinformative evidence to reject hypotheses accordingly.
To illustrate this, we take a simple example shown inFigure 4. After the completion of the first step, we assumethat our algorithm conservatively treats A2 def:[R2]and A4 def:[R5] as intervening tags which hinder dataflow propagation. Following the procedure discussedabove, we reversely analyze the trace and make a hy-pothesis, i. e., [R4] and [R5] are not alias. With thishypothesis, the data flow between the intervening tagscan propagate through, and our algorithm can examineconflicts accordingly. Assume that the newly propagateddata flow is insufficient for rejecting our hypothesis. Ouralgorithm holds the current hypothesis and makes an ad-ditional hypothesis, i. e., [R1] and [R2] are not alias ofeach other. With this new hypothesis, more data flowspass through and our algorithm obtains more informationthat potentially helps reject hypotheses. It should be notedthat if any of the hypotheses fail to reject, our algorithmpreserves the intervening tags conservatively placed at thefirst step.
It is not difficult to spot that our hypothesis test canbe easily extended as a recursive procedure which makesmore hypotheses until they can be rejected. However,a recursive hypothesis test introduces computation com-plexity exponentially. In the worse case, when performingexecution reversely, the inverse operation of each instruc-tion may require alias verification and each verificationmay require further alias examination. When this situa-
...
A1: mov R0, [R1] ; R1 = addr1
A2: mov [R2], 0x00 ; R2 = ??
...
...
A3: mov R3, [R4] ; R4 =addr2
A4: mov [R5], 0x08 ; R5 = ??
...
(a) The execution trace.
... ... ... ... ... ...
A2 def: [R2]=0x0 0x00
A2 use: [R2] ??
A2 use: R2 ??
A1 def: R0=[R1] ??
A1 use: R0 ??
A1 use: [R1] ??
A1 use: R1 addr1
... ... ...
A3 use: R4 addr2
A3 use: [R4] ??
A3 use: R3 ??
A3 def: R3=[R4] ??
A4 use R5 ??
A4 use: [R5] ??
A4 def: [R5]=0x8 0x08
... ... ...
Dat
a flo
w
X
X
Data flow
(b) The use-define chain.
Figure 4: A dummy use-define chain and execution trace withtwo pairs of memory aliases. Note that R0,R1, · · ·R5 representregisters in which the values of R2 and R5 are unknown. Notethat 7 represents the block of a data flow.
tion appears, the algorithm above becomes an impracticalsolution. As such, this work empirically forces a hypoth-esis test to follow at most a recurssion depth of two. Aswe will show in Section 6, this setting allows us to per-form reverse execution not only in an efficient but alsorelatively effective manner.
4.1.3 Discussion
During the execution of a program, it might invoke asystem call, which traps execution into kernel space. Aswe will discuss in Section 6, we do not set Intel PT to traceexecution in kernel space. As a result, intuition suggeststhat the loss of execution tracing may introduce problemsto our reverse execution. However, in practice, a majorityof system calls do not incur modification to registers andmemory in user space. Thus, our reverse execution cansimply ignore the inverse operations for those system calls.For system calls that potentially influence the memoryfootprints of a crashing program, our reverse executionhandles them as follows.
In general, a system call can only influence memoryfootprints if it manipulates register values stored by thecrashing program or touches the memory region in userspace. As a result, we treat system calls in differentmanners. For system calls that may influence a registerholding a value for a crashing program, our algorithm
24 26th USENIX Security Symposium USENIX Association

simply introduces a definition on the use-define chain.For example, system call read overwrites register eaxto hold its return value, and our algorithm appends defi-nition def:eax=? to the use-define chain accordingly.Regarding the system calls that manipulate the memorycontent in user space (e.g., write and recv), our al-gorithm checks the memory regions influenced by thatcall. To be specific, it attempts to identify the startingaddress as well as the size of that memory region by usingthe instructions executed prior to that call. This is dueto the fact that the starting address and size are typicallyindicated by arguments which are handled by those in-structions prior to the call. Following this procedure, ifour algorithm identifies the size of that memory region, itappends definitions to the chain accordingly. Otherwise,our algorithm treats that system call as an intervening tagwhich blocks the propagation through that call3. The rea-son behind this is that a non-deterministic memory regioncan potentially overlap with any memory regions in userspace.
4.2 Backward Taint Analysis
Recall that the goal of this work is to pinpoint instruc-tions truly pertaining to a program crash. In Section 3,we briefly introduce how backward taint analysis playsthe role in achieving this goal. Here, we describe moredetails.
To perform backward taint analysis, POMP first identi-fies a sink. In general, a program crash results from twosituations – executing an invalid instruction or derefer-encing an invalid address. For the first situation, POMPdeems the program counter (eip) as a sink because exe-cuting an invalid instruction indicates eip carries a badvalue. For the second situation, POMP treats a generalregister as a sink because it holds a value which points toan invalid address. Take the example shown in Figure 1.POMP treats register eax as a sink in that the programcrash results from retrieving an invalid instruction fromthe address held by register eax.
With a sink identified, POMP taints the sink and per-forms taint propagation backward. In the procedure ofthis backward propagation, POMP looks up the aforemen-tioned use-define chain and identifies the definition of thetaint variable. The criteria of this identification is to en-sure the definition could reach the taint variable withoutany other intervening definitions. Continue the exam-ple above. With sink eax serving as the initial taintvariable, POMP selects A19 def:eax=[ebp-0xc]on the chain because this definition can reach taint vari-able eax without intervention.
3Note that an intervening tag placed by a system call blocks onlydefinitions and uses in which a variable represents a memory access(e.g., def:[eax] or use:[ebp]).
From the definition identified, POMP parses that def-inition and passes the taint to new variables. Since anyvariables enclosed in a definition could potentially causethe corruption of the taint variable, the variables whichPOMP selects and passes the taint to include all operands,base and index registers (if available). For example, byparsing definition A19 def:eax=[ebp-0xc], POMPidentifies variables ebp and [ebp-0xc], and passes thetaint to both of them. It is not difficult to note that such ataint propagation strategy can guarantee POMP does notmiss the root cause of a program crash though it over-taints some variables that do not actually contribute to thecrash. In Section 6, we evaluate and discuss the effect ofthe over-tainting.
When passing a taint to a variable indicated by a mem-ory access (e.g., [R0]), it should be noted that POMP maynot be able to identify the address corresponding to thememory (e.g., unknown R0 for variable [R0]). Once thissituation appears, therefore, POMP halts the taint propaga-tion for that variable because the taint can be potentiallypropagated to any variables with a definition in the formof def:[Ri] (where Ri is a register).
Similar to the situation seen in reverse execution, whenperforming taint propagation backward, POMP may en-counter a definition on the chain which intervenes thepropagation. For example, given a taint variable [R0]and a definition def:[R1] with R1 unknown, POMP can-not determine whether R0 and R1 share the same valueand POMP should pass the taint to variable [R1]. Whenthis situation appears, POMP follows the idea of the afore-mentioned hypothesis test and examines if both variablesshare the same address. Ideally, we would like to re-solve the unknown address through a hypothesis test sothat POMP can pass that taint accordingly. However, inpractice, the hypothesis test may fail to reject. When “fail-to-reject” occurs, therefore, POMP over-taints the variablein that intervening definition. Again, this can ensure thatPOMP does not miss the enclosure of root cause.
5 Implementation
We have implemented a prototype of POMP for Linux 32-bit system with Linux kernel 4.4 running on an Intel i7-6700HQ quad-core processor (a 6th-generation Skylakeprocessor) with 16 GB RAM. Our prototype consists oftwo major components – ¬ a sub-system that implementsthe aforementioned reverse execution and backward taintanalysis and a sub-system that traces program execu-tion with Intel PT. In total, our implementation carriesabout 22,000 lines of C code which we will make publiclyavailable at https://github.com/junxzm1990/pomp.git. Inthe following, we present some important implementationdetails.
USENIX Association 26th USENIX Security Symposium 25
Following the design description above, we imple-mented 65 distinct instruction handlers to perform re-verse execution and backward taint analysis. Along withthese handlers, we also built core dump and instructionparsers on the basis of libelf [2] and libdisasm [1],respectively. Note that for instructions with the same se-mantics (e.g., je, jne, and jg) we dealt with their inverseoperations in one unique handler. To keep track of con-straints and perform verification, we reuse the Z3 theoremprover [5, 17].
To allow Intel PT to log execution in a correct andreliable manner, we implemented the second sub-systemas follows. We enabled Intel PT to run in the Table ofPhysical Addresses (ToPA) mode, which allows us tostore PT packets in multiple discontinuous physical mem-ory areas. We added to the ToPA an entry that points toa 16 MB physical memory buffer. In our implementa-tion, we use this buffer to store packets. To be able totrack if the buffer is fully occupied, we clear the END bitand set the INT bit. With this setup, Intel PT can signala performance-monitoring interrupt at the moment thebuffer is fully occupied. Considering the interrupt mayhave a skid, resulting in a potential loss in PT packets,we further allocated a 2 MB physical memory buffer tohold those packets that might be potentially discarded. Inthe ToPA, we introduced an additional entry to refer thisbuffer.
At the hardware level, Intel PT lacks the capability ofdistinguishing threads within each process. As a result,we also intercepted the context switch. With this, oursystem is able to examine the threads switched in andout, and stores PT packets for threads individually. Tobe specific, for each thread that software developers andsecurity analysts are interested in, we allocated a 32MBcircular buffer in its user space. Every time a thread isswitched out, we migrated PT packets stored in the afore-mentioned physical memory buffers to the correspondingcircular buffer in user space. After migration, we alsoreset the corresponding registers and make sure the physi-cal memory buffers can be used for holding packets forother threads of interest. Note that our empirical experi-ment indicates the aforementioned 16 MB buffer cannotbe fully occupied between consecutive context switch,and POMP does not have the difficulty in holding all thepackets between the switch.
Considering the Intel CPU utilizes Supervisor ModeAccess Prevention (SMAP) to restrict the access fromkernel to user space, our implementation toggles SMAPbetween packet migration. In addition, we configured In-tel PT to exclude packets irrelevant to control flow switch-ing (e.g., timing information) and paused its tracing whenexecution traps into kernel space. In this way, POMP isable to log an execution trace sufficiently long. Last butnot least, we introduced new resource limit PT_LIMIT
into the Linux kernel. With this, not only can softwaredevelopers and security analysts select which processesto trace but also configure the size of the circular bufferin a convenient manner.
6 Evaluation
In this section, we demonstrate the utility of POMP usingthe crashes resulting from real-world vulnerabilities. Tobe more specific, we present the efficiency and effective-ness of POMP, and discuss those crashes that POMP failsto handle properly.
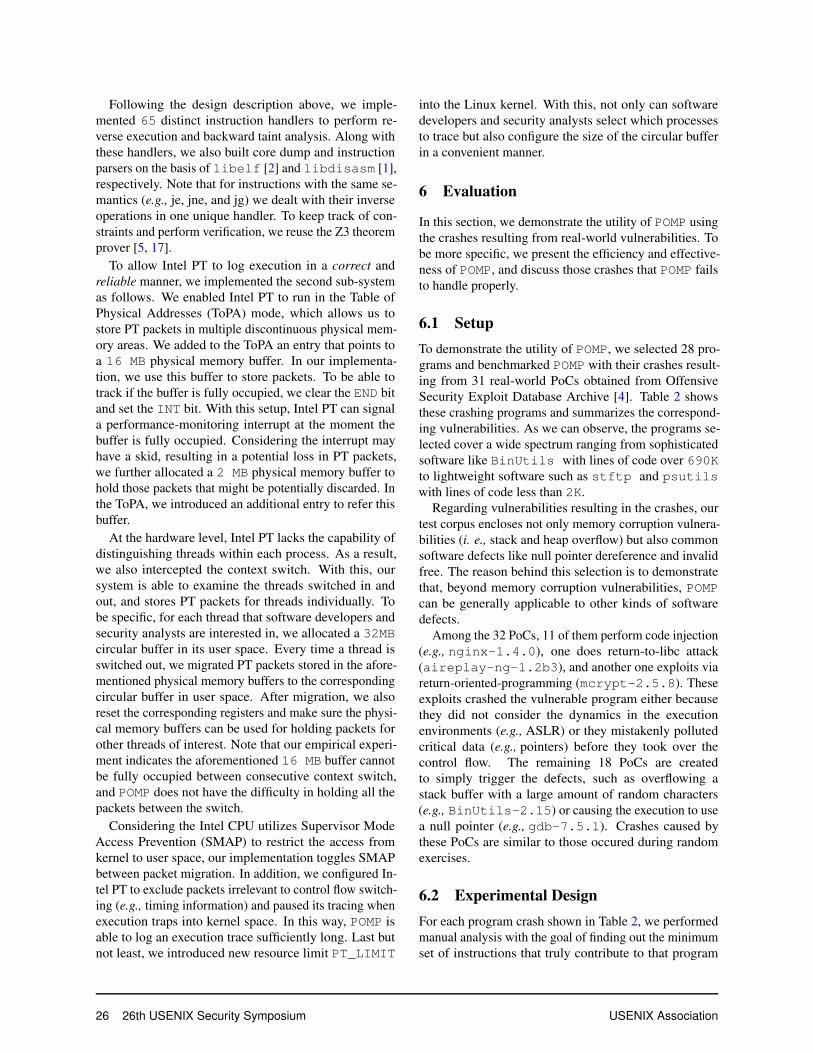
6.1 SetupTo demonstrate the utility of POMP, we selected 28 pro-grams and benchmarked POMP with their crashes result-ing from 31 real-world PoCs obtained from OffensiveSecurity Exploit Database Archive [4]. Table 2 showsthese crashing programs and summarizes the correspond-ing vulnerabilities. As we can observe, the programs se-lected cover a wide spectrum ranging from sophisticatedsoftware like BinUtils with lines of code over 690Kto lightweight software such as stftp and psutilswith lines of code less than 2K.
Regarding vulnerabilities resulting in the crashes, ourtest corpus encloses not only memory corruption vulnera-bilities (i. e., stack and heap overflow) but also commonsoftware defects like null pointer dereference and invalidfree. The reason behind this selection is to demonstratethat, beyond memory corruption vulnerabilities, POMPcan be generally applicable to other kinds of softwaredefects.
Among the 32 PoCs, 11 of them perform code injection(e.g., nginx-1.4.0), one does return-to-libc attack(aireplay-ng-1.2b3), and another one exploits viareturn-oriented-programming (mcrypt-2.5.8). Theseexploits crashed the vulnerable program either becausethey did not consider the dynamics in the executionenvironments (e.g., ASLR) or they mistakenly pollutedcritical data (e.g., pointers) before they took over thecontrol flow. The remaining 18 PoCs are createdto simply trigger the defects, such as overflowing astack buffer with a large amount of random characters(e.g., BinUtils-2.15) or causing the execution to usea null pointer (e.g., gdb-7.5.1). Crashes caused bythese PoCs are similar to those occured during randomexercises.
6.2 Experimental DesignFor each program crash shown in Table 2, we performedmanual analysis with the goal of finding out the minimumset of instructions that truly contribute to that program
26 26th USENIX Security Symposium USENIX Association
Program Vulnerability Diagnose ResultsName Size(LoC) CVE-ID Type Trace
lengthSize ofmem (MB)
# oftaint
Groundtruth
Mem addrunknown
Rootcause
Time
coreutils-8.4 138135 2013-0222 Stack overflow 50 56.61 3 2 1 3 1 seccoreutils-8.4 138135 2013-0223 Stack overflow 90 59.66 2 2 0 3 1 seccoreutils-8.4 138135 2013-0221 Stack overflow 92 120.95 3 2 0 3 1 secmcrypt-2.5.8 37439 2012-4409 Stack overflow 315 0.59 3 2 3 3 3 secBinUtils-2.15 697354 2006-2362 Stack overflow 867 0.37 16 7 0 3 1 secunrtf-0.19.3 5039 NA Stack overflow 895 0.34 7 4 10 3 1 minpsutils-p17 1736 NA Stack overflow 3123 0.34 7 3 28 3 4 minstftp-1.1.0 1559 NA Stack overflow 3651 0.39 29 6 15 3 4 minnasm-0.98.38 33553 2004-1287 Stack overflow 4064 0.58 3 2 4 3 44 seclibpng-1.2.5 33681 2004-0597 Stack overflow 6026 0.35 6 2 86 3 5 minputty-0.66 90165 2016-2563 Stack overflow 7338 0.45 4 2 21 3 30 minUnalz-0.52 8546 2005-3862 Stack overflow 10905 0.40 14 10 7 3 30 secLaTeX2rtf-1.9 14473 2004-2167 Stack overflow 17056 0.37 11 5 122 3 8 minaireplay-ng-1.2b3 62656 2014-8322 Stack overflow 18569 0.59 2 2 223 7 7 mincorehttp-0.5.3a 914 2007-4060 Stack overflow 25385 0.32 19 6 0 3 52 mingas-2.12 595504 2005-4807 Stack overflow 25713 4.17 3 2 346 3 40 minabc2mtex-1.6.1 4052 NA Stack overflow 29521 0.33 12 2 12 3 1 minLibSMI-0.4.8 80461 2010-2891 Stack overflow 50787 0.33 46 5 730 3 4 secgif2png-2.5.2 1331 2009-5018 Stack overflow 70854 0.51 49 4 396 3 46 minO3read-0.03 932 2004-1288 Stack overflow 78244 0.32 7 2 20 3 15 minunrar-3.9.3 17575 NA Stack overflow 102200 2.43 33 5 1033 3 6 hournullhttp-0.5.0 1849 2002-1496 Heap overflow 141 0.54 3 2 0 3 1 secinetutils-1.8 98941 NA Heap overflow 28720 0.40 237 7 111 3 14 minnginx-1.4.0 100255 2013-2028 Integer overflow 158 0.62 11 4 0 3 1 secPython-2.2 416060 2007-4965 Integer overflow 3426 0.89 31 7 117 3 3 min0verkill-0.16 16361 2006-2971 Integer overflow 10494 4.27 1 NA 0 7 2 secopenjpeg-2.1.1 169538 2016-7445 Null pointer 67 0.37 10 5 5 3 1 secgdb-7.5.1 1651764 NA Null pointer 2009 2.94 23 2 79 3 1secpodofo-0.9.4 60147 2017-5854 Null pointer 42165 0.65 7 4 80 3 2 minPython-2.7 906829 NA Use-after-free 551 2.14 6 1 0 3 0.17 secpoppler-0.8.4 183535 2008-2950 Invalid free 672 1.39 16 4 0 3 13 sec
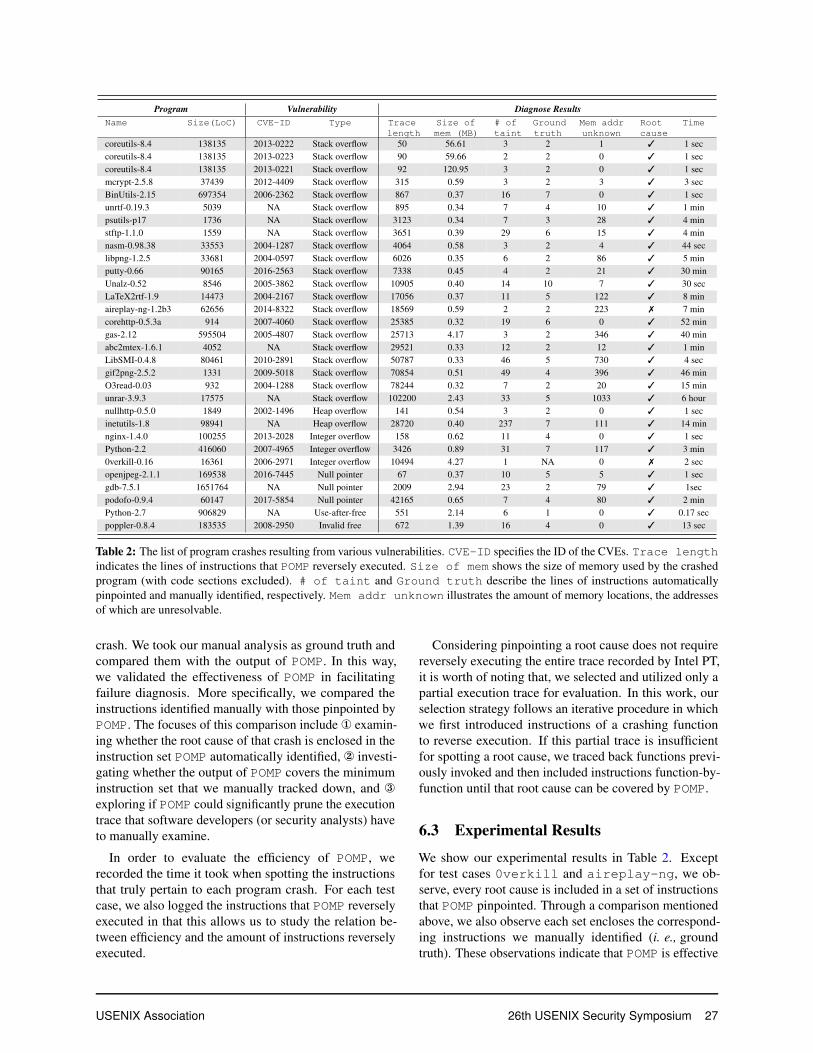
Table 2: The list of program crashes resulting from various vulnerabilities. CVE-ID specifies the ID of the CVEs. Trace lengthindicates the lines of instructions that POMP reversely executed. Size of mem shows the size of memory used by the crashedprogram (with code sections excluded). # of taint and Ground truth describe the lines of instructions automaticallypinpointed and manually identified, respectively. Mem addr unknown illustrates the amount of memory locations, the addressesof which are unresolvable.
crash. We took our manual analysis as ground truth andcompared them with the output of POMP. In this way,we validated the effectiveness of POMP in facilitatingfailure diagnosis. More specifically, we compared theinstructions identified manually with those pinpointed byPOMP. The focuses of this comparison include ¬ examin-ing whether the root cause of that crash is enclosed in theinstruction set POMP automatically identified, investi-gating whether the output of POMP covers the minimuminstruction set that we manually tracked down, and ®exploring if POMP could significantly prune the executiontrace that software developers (or security analysts) haveto manually examine.
In order to evaluate the efficiency of POMP, werecorded the time it took when spotting the instructionsthat truly pertain to each program crash. For each testcase, we also logged the instructions that POMP reverselyexecuted in that this allows us to study the relation be-tween efficiency and the amount of instructions reverselyexecuted.
Considering pinpointing a root cause does not requirereversely executing the entire trace recorded by Intel PT,it is worth of noting that, we selected and utilized only apartial execution trace for evaluation. In this work, ourselection strategy follows an iterative procedure in whichwe first introduced instructions of a crashing functionto reverse execution. If this partial trace is insufficientfor spotting a root cause, we traced back functions previ-ously invoked and then included instructions function-by-function until that root cause can be covered by POMP.
6.3 Experimental Results
We show our experimental results in Table 2. Exceptfor test cases 0verkill and aireplay-ng, we ob-serve, every root cause is included in a set of instructionsthat POMP pinpointed. Through a comparison mentionedabove, we also observe each set encloses the correspond-ing instructions we manually identified (i. e., groundtruth). These observations indicate that POMP is effective
USENIX Association 26th USENIX Security Symposium 27

in locating instructions that truly contribute to programcrashes.
In comparison with instructions that POMP needs toreversely execute, we observe, the instructions eventu-ally tainted are significantly less. For example, backwardanalysis needs to examine 10,905 instructions in orderto pinpoint the root cause for crashing program Unalz,whereas POMP highlights only 14 instructions amongwhich half of them truly pertain to the crash. Given thatbackward taint analysis mimics how a software developer(or security analyst) typically diagnoses the root cause ofa program failure, this observation indicates that POMPhas a great potential to reduce manual efforts in failurediagnosis.
Except for test case coreutils, an instruction setproduced by POMP generally carries a certain amountof instructions that do not actually contribute to crashes.Again, take Unalz for example. POMP over-tainted 7instructions and included them in the instruction set itidentified. In the usage of POMP, while this implies asoftware developer needs to devote additional energies tothose instructions not pertaining to a crash, this does notmean that POMP is less capable of finding out instructionstruly pertaining to a crash. In fact, compared with hun-dreds and even thousands of instructions that one had tomanually walk through in failure diagnosis, the additionaleffort imposed by over-tainting is minimal and negligible.
Recall that in order to capture a root cause, the designof POMP taints all variables that possibly contribute to thepropagation of a bad value. As our backward taint analy-sis increasingly traverses instructions, it is not difficult toimagine that, an increasing number of variables might betainted which causes instructions corresponding to thesevariables are treated as those truly pertaining to programcrashes. As such, we generally observe more instructionsover-tainted for those test cases, where POMP needs toreversely execute more instructions in order to cover theroot causes of their failures.
As we discuss in Section 4, ideally, POMP can employa recursive hypothesis test to perform inverse operationsfor instructions that carry unknown memory access. Dueto the concern of computation complexity, however, welimit the recursion in at most two depths. As such, reverseexecution leaves behind a certain amount of unresolvablememory. In Table 2, we illustrate the amount of memorythe addresses of which remain unresolvable even after a2-depth hypothesis test has been performed. Surprisingly,we discover POMP can still effectively spot instructionspertaining to program crashes even though it fails to re-cover a certain amount of memory. This implies that ourdesign reasonably balances the utility of POMP as well asits computation complexity.
Intuition suggests that the amount of memory unresolv-able should correlate with the number of instructions that
POMP reversely executes. This is because the effect ofan unresolvable memory might be propagated as more in-structions are involved in reverse execution. While this isgenerally true, an observation from test case corehttpindicates a substantially long execution trace does not al-ways necessarily amplify the influence of unknown mem-ory access. With more instructions reversely executed,POMP may obtain more evidence to reject the hypothesesthat it fail to determine, making unknown memory accessresolvable. With this in mind, we speculate POMP is notonly effective in facilitating failure diagnosis perhaps alsohelpful for executing substantially long traces reversely.As a future work, we will therefore explore this capabilityin different contexts.
In Table 2, we also illustrate the amount of time thatPOMP took in the process of reverse execution and back-ward taint analysis. We can easily observe POMP typicallycompletes its computation in minutes and the time it tookis generally proportional to the number of instructionsthat POMP needs to reversely execute. The reason be-hind this observation is straightforward. When reverseexecution processes more instructions, it typically encoun-ters more memory aliases. In verifying memory aliases,POMP needs to perform hypothesis tests which are slightlycomputation-intensive and time-consuming.
With regard to test case aireplay-ng in whichPOMP fails to facilitate failure diagnosis, we look closelyto instructions tainted as well as those reversely executed.Prior to the crash of aireplay-ng, we discover theprogram invoked system call sys_read which writes adata chunk to a certain memory region. Since both thesize of the data chunk and the address of the memoryare specified in registers, which reverse execution failsto restore, POMP treats sys_read as a “super” interven-ing tag that blocks the propagation of many definitions,making the output of POMP less informative to failurediagnosis.
Different from aireplay-ng, the failure for0verkill results from an insufficient PT log. As isspecified in Table 2, the vulnerability corresponding tothis case is an integer overflow. To trigger this securityloophole, the PoC used in our experiment aggressivelyaccumulates an integer variable which makes a PT logfull of arithmetic computation instructions but not theinstruction corresponding to the root cause. As such, weobserve POMP can taint only one instruction pertaining tothe crash. We believe this situation can be easily resolvedif a software developer (or security analyst) can enlargethe capacity of the PT buffer.
7 Related Work
This research work mainly focuses on locating softwarevulnerability from its crash dump. Regarding the tech-
28 26th USENIX Security Symposium USENIX Association

niques we employed and the problems we addressed, thelines of works most closely related to our own includereverse execution and postmortem program analysis. Inthis section, we summarize previous studies and discusstheir limitation in turn.
Reverse execution. Reverse execution is a conventionaldebugging technique that allows developers to restore theexecution state of a program to a previous point. Pioneer-ing research [7–9, 13] in this area relies upon restoringa previous program state from a record, and thus theirfocus is to minimize the amount of records that one hasto save and maintain in order to return a program to aprevious state in its execution history. For example, thework described in [7–9] is mainly based on regeneratinga previous program state. When state regeneration is notpossible, however, it recovers a program state by statesaving.
In addition to state saving, program instrumentation isbroadly used to facilitate the reverse execution of a pro-gram. For example, Hou et al. designed compiler frame-work Backstroke [21] to instrument C++ program ina way that it can store program states for reverse exe-cution. Similarly, Sauciuc and Necula [30] proposed touse an SMT solver to navigate an execution trace andrestore data values. Depending on how the solver per-forms on constraint sets corresponding to multiple testruns, the technique proposed automatically determineswhere to instrument the code to save intermediate valuesand facilitate reverse execution.
Given that state saving requires extra memory spaceand program instrumentation results in a slower forwardexecution, recent research proposes to employ a coredump to facilitate reverse execution. In [16] and [37],new reverse execution mechanisms are designed in whichthe techniques proposed reversely analyzes code and thenutilizes the information in a core dump to reconstruct thestates of a program prior to its crash. Since the effective-ness of these techniques highly relies upon the integrityof a core dump, and exploiting vulnerabilities like bufferoverflow and dangling pointers corrupts memory informa-tion, they may fail to perform reverse execution correctlywhen memory corruption occurs.
Different from the prior research works discussedabove, the reverse execution technique introduced in thispaper follows a completely different design principle, andthus it provides many advantages. First, it can reinstate aprevious program state without restoring that state from arecord. Second, it does not require any instrumentationto a program, making it more generally applicable. Third,it is effective in performing execution backward eventhough the crashing memory snapshot carries corrupteddata.
Postmortem program analysis. Over the past decades,
there is a rich collection of literature on using programanalysis techniques along with crash reports to identifyfaults in software (e.g., [15, 20, 24, 25, 28, 29, 32, 38]).These existing techniques are designed to identify somespecific software defects. In adversarial settings, an at-tacker exploits a variety of software defects and thus theycannot be used to analyze a program crash caused by asecurity defect such as buffer overflow or unsafe danglingpointer. For example, Manevich et al. [24] proposedto use static backward analysis to reconstruct executiontraces from a crash point and thus spot software defects,particularly typestate errors [33]. Similarly, Strom andYellin [32] defined a partially path-sensitive backwarddataflow analysis for checking typestate properties, specif-ically uninitialized variables. While demonstrated to beeffective, these two studies only focus on specific types-tate problems.
Liblit et al. proposed a backward analysis technique forcrash analysis [23]. To be more specific, they introducean efficient algorithm that takes as input a crash pointas well as a static control flow graph, and computes allthe possible execution paths that lead to the crash point.In addition, they discussed how to narrow down the setof possible execution paths using a wide variety of post-crash artifacts, such as stack traces. As is mentionedearlier, memory information might be corrupted whenattackers exploit a program. The technique describedin [23] highly relies upon the integrity of the informa-tion resided in memory, and thus fails to analyze programcrash resulting from malicious memory corruption. In thiswork, we do not infer program execution paths throughthe stack traces recovered from memory potentially cor-rupted. Rather, our approach identifies the root causeof software failures by reversely executing program andreconstructing memory footprints prior to the crash.
Considering the low cost of capturing core dumps, priorstudies also proposed to use core dumps to analyze theroot cause of software failures. Of all the works along thisline, the most typical ones include CrashLocator [35],!analyze [18] and RETracer [16] which locate soft-ware defects by analyzing memory information residedin a core dump. As such, these techniques are notsuitable to analyze crashes resulting from maliciousmemory corruption. Different from these techniques,Kasikci et al. introduced Gist [22], an automated de-bugging technique that utilizes off-the-shelf hardware toenhance core dump and then employs a cooperative debug-ging technique to perform root cause diagnosis. WhileGist demonstrates its effectiveness on locating bugsfrom a software crash, it requires the collection of crashesfrom multiple parties running the same software and suf-fering the same bugs. This could significantly limit itsadoption. In our work, we introduce a different technicalapproach which can perform analysis at the binary level
USENIX Association 26th USENIX Security Symposium 29

without the participation of other parties.In recent research, Xu et al. [36] introduced CREDAL,
an automatic tool that employs the source code of a crash-ing program to enhance core dump analysis and turns acore dump to an informative aid in tracking down mem-ory corruption vulnerabilities. While sharing a commongoal as POMP– pinpointing the code statements where asoftware defect is likely to reside – CREDAL follows acompletely different technical approach. More specifi-cally, CREDAL discovers the mismatch in variable valuesand deems the code fragments corresponding to the mis-match as the possible vulnerabilities that lead to the crash.While it has been shown that CREDAL is able to assist soft-ware developers (or security analysts) in tracking downa memory corruption vulnerability, in most cases, it stillrequires significant manual efforts for locating a memorycorruption vulnerability in a crash for the reasons thatthe mismatch in variable values may be overwritten orthe code fragments corresponding to mismatch may notinclude the root cause of the software crash. In this work,POMP precisely pinpoints the vulnerability by utilizingthe memory footprints recovered from reverse execution.
8 Discussion
In this section, we discuss the limitations of our currentdesign, insights we learned and possible future directions.
Multiple threads. POMP focuses only on analyzing thepost-crash artifact produced by a crashing thread. There-fore, we assume the root cause of the crash is enclosedwithin the instructions executed by that thread and otherthreads do not intervene the execution of that thread priorto its crash. In practice, this assumption however maynot hold, and the information held in a post-crash artifactmay not be sufficient and even misleading for root causediagnosis.
While this multi-thread issue indeed limits the capabil-ity of a security analyst using POMP to pinpoint the rootcause of a program crash, this does not mean the failure ofPOMP nor significantly downgrades the utility of POMPbecause of the following. First, a prior study [31] hasalready indicated that a large fraction of software crashesinvolves only the crashing thread. Thus, we believe POMPis still beneficial for software failure diagnosis. Second,the failure of POMP roots in incomplete execution trac-ing. Therefore, we believe, by simply augmenting ourprocess tracing with the capability of recording the timingof execution, POMP can synthesize a complete executiontrace, making POMP working properly. As part of thefuture work, we will integrate this extension into the nextversion of POMP.
Just-in-Time native code. Intel PT records the addressesof branching instructions executed. Using these addresses
as index, POMP retrieves instructions from executable andlibrary files. However, a program may utilize Just-in-Time (JIT) compilation in which binary code is generatedon the fly. For programs assembled with this JIT func-tionality (e.g., JavaScript engine), POMP is less likely tobe effective, especially when a post-crash artifact fails tocapture the JIT native code mapped into memory.
To make POMP handle programs in this type, in the fu-ture, we will augment POMP with the capability of tracingand logging native code generated at the run time. For ex-ample, we may monitor the executable memory and dumpJIT native code accordingly. Note that this extension doesnot require any re-engineering of reverse execution andbackward taint analysis because the limitation to JIT na-tive code also results from incomplete execution tracing(i. e., failing to reconstruct all the instructions executedprior to a program crash).
9 Conclusion
In this paper, we develop POMP on Linux system to an-alyze post-crash artifacts. We show that POMP can sig-nificantly reduce the manual efforts on the diagnosis ofprogram failures, making software debugging more infor-mative and efficient. Since the design of POMP is entirelyon the basis of the information resided in a post-crashartifact, the technique proposed can be generally appliedto diagnose the crashes of programs written in variousprogramming languages caused by various software de-fects.
We demonstrated the effectiveness of POMP using thereal-world program crashes pertaining to 31 software vul-nerabilities. We showed that POMP can reversely recon-struct the memory footprints of a crashing program andaccurately identify the program statements (i. e., , instruc-tions) that truly contribute to the crash. Following thisfinding, we safely conclude POMP can significantly down-size the program statements that a software developer (orsecurity analyst) needs to manually examine.
10 Acknowledgments
We thank the anonymous reviewers for their helpful feed-back and our shepherd, Andrea Lanzi, for his valuablecomments on revision of this paper. This work was sup-ported by ARO W911NF-13-1-0421 (MURI), NSF CNS-1422594, NSF CNS-1505664, ONR N00014-16-1-2265,ARO W911NF-15-1-0576, and Chinese National NaturalScience Foundation 61272078.
30 26th USENIX Security Symposium USENIX Association

References
[1] libdisasm: x86 disassembler library. http://bastard.sourceforge.net/libdisasm.html.
[2] Libelf - free software directory. https://directory.fsf.org/wiki/Libelf.
[3] Linux programmer’s manual. http://man7.org/linux/man-pages/man7/signal.7.html.
[4] Offensive security exploit database archive. https://www.exploit-db.com/.
[5] The z3 theorem prover. https://github.com/Z3Prover/z3.
[6] Processor tracing. https://software.intel.com/en-us/blogs/2013/09/18/processor-tracing, 2013.
[7] T. Akgul and V. J. Mooney, III. Instruction-level reverseexecution for debugging. In Proceedings of the 2002 ACMSIGPLAN-SIGSOFT Workshop on Program Analysis forSoftware Tools and Engineering, 2002.
[8] T. Akgul and V. J. Mooney III. Assembly instruction levelreverse execution for debugging. ACM Trans. Softw. Eng.Methodol., 2004.
[9] T. Akgul, V. J. Mooney III, and S. Pande. A fast assem-bly level reverse execution method via dynamic slicing.In Proceedings of the 26th International Conference onSoftware Engineering, 2004.
[10] S. Artzi, S. Kim, and M. D. Ernst. Recrash: Making soft-ware failures reproducible by preserving object states. InProceedings of the 22Nd European Conference on Object-Oriented Programming, 2008.
[11] G. Balakrishnan and T. Reps. Analyzing memory accessesin x86 executables. In cc, pages 5–23, 2004.
[12] J. Bell, N. Sarda, and G. Kaiser. Chronicler: Lightweightrecording to reproduce field failures. In Proceedings of the2013 International Conference on Software Engineering,2013.
[13] B. Biswas and R. Mall. Reverse execution of programs.SIGPLAN Not., 1999.
[14] Y. Cao, H. Zhang, and S. Ding. Symcrash: Selectiverecording for reproducing crashes. In Proceedings of the29th ACM/IEEE International Conference on AutomatedSoftware Engineering, 2014.
[15] H. Cleve and A. Zeller. Locating causes of program fail-ures. In Proceedings of the 27th International Conferenceon Software Engineering, 2005.
[16] W. Cui, M. Peinado, S. K. Cha, Y. Fratantonio, and V. P.Kemerlis. Retracer: Triaging crashes by reverse executionfrom partial memory dumps. In Proceedings of the 38thInternational Conference on Software Engineering, 2016.
[17] L. De Moura and N. Bjørner. Z3: An efficient smt solver.In International conference on Tools and Algorithms forthe Construction and Analysis of Systems, pages 337–340.Springer, 2008.
[18] K. Glerum, K. Kinshumann, S. Greenberg, G. Aul, V. Or-govan, G. Nichols, D. Grant, G. Loihle, and G. Hunt.Debugging in the (very) large: Ten years of implementa-tion and experience. In Proceedings of the ACM SIGOPS22Nd Symposium on Operating Systems Principles, 2009.
[19] W. Gu, Z. Kalbarczyk, R. K. Iyer, Z.-Y. Yang, et al. Char-acterization of linux kernel behavior under errors. In DSN,volume 3, pages 22–25, 2003.
[20] S. Hangal and M. S. Lam. Tracking down software bugsusing automatic anomaly detection. In Proceedings of the24th International Conference on Software Engineering,2002.
[21] C. Hou, G. Vulov, D. Quinlan, D. Jefferson, R. Fujimoto,and R. Vuduc. A new method for program inversion.In Proceedings of the 21st International Conference onCompiler Construction, 2012.
[22] B. Kasikci, B. Schubert, C. Pereira, G. Pokam, and G. Can-dea. Failure sketching: A technique for automated rootcause diagnosis of in-production failures. In Proceedingsof the 25th Symposium on Operating Systems Principles,2015.
[23] B. Liblit and A. Aiken. Building a better backtrace: Tech-niques for postmortem program analysis. Technical report,2002.
[24] R. Manevich, M. Sridharan, S. Adams, M. Das, andZ. Yang. Pse: Explaining program failures via postmortemstatic analysis. In Proceedings of the 12th ACM SIGSOFTTwelfth International Symposium on Foundations of Soft-ware Engineering, 2004.
[25] D. Molnar, X. C. Li, and D. A. Wagner. Dynamic testgeneration to find integer bugs in x86 binary linux pro-grams. In Proceedings of the 18th Conference on USENIXSecurity Symposium, 2009.
[26] P. Ohmann. Making your crashes work for you (doctoralsymposium). In Proceedings of the 2015 InternationalSymposium on Software Testing and Analysis, 2015.
[27] F. Qin, J. Tucek, J. Sundaresan, and Y. Zhou. Rx: treat-ing bugs as allergies—a safe method to survive softwarefailures. In ACM SIGOPS Operating Systems Review,volume 39, pages 235–248. ACM, 2005.
[28] M. Renieris and S. P. Reiss. Fault localization with nearestneighbor queries. In Proceedings of IEEE/ACM Interna-tional Conference on Automated Software Engineering,2003.
[29] S. K. Sahoo, J. Criswell, C. Geigle, and V. Adve. Usinglikely invariants for automated software fault localization.
USENIX Association 26th USENIX Security Symposium 31

In Proceedings of the Eighteenth International Conferenceon Architectural Support for Programming Languages andOperating Systems, 2013.
[30] R. Sauciuc and G. Necula. Reverse execution with con-straint solving. Technical report, EECS Department, Uni-versity of California, Berkeley, 2011.
[31] A. SchrÃuter, N. Bettenburg, and R. Premraj. Do stacktraces help developers fix bugs? In Proceedings of the 7thIEEE Working Conference on Mining Software Reposito-ries, 2010.
[32] R. E. Strom and D. M. Yellin. Extending typestate check-ing using conditional liveness analysis. IEEE TransactionSoftware Engineering, 1993.
[33] R. E. Strom and S. Yemini. Typestate: A programminglanguage concept for enhancing software reliability. IEEETransaction Software Engineering, 1986.
[34] M. Weiser. Program slicing. In Proceedings of the 5thinternational conference on Software engineering, pages439–449. IEEE Press, 1981.
[35] R. Wu, H. Zhang, S.-C. Cheung, and S. Kim. Crashlocator:Locating crashing faults based on crash stacks. In Pro-ceedings of the 2014 International Symposium on SoftwareTesting and Analysis, 2014.
[36] J. Xu, D. Mu, P. Chen, X. Xing, P. Wang, and P. Liu.Credal: Towards locating a memory corruption vulnerabil-ity with your core dump. In Proceedings of the 2016 ACMSIGSAC Conference on Computer and CommunicationsSecurity, 2016.
[37] C. Zamfir, B. Kasikci, J. Kinder, E. Bugnion, and G. Can-dea. Automated debugging for arbitrarily long executions.In Proceedings of the 14th USENIX Conference on HotTopics in Operating Systems, 2013.
[38] A. Zeller. Isolating cause-effect chains from computerprograms. In Proceedings of the 10th ACM SIGSOFT Sym-posium on Foundations of Software Engineering, 2002.
[39] W. Zhang, J. Lim, R. Olichandran, J. Scherpelz, G. Jin,S. Lu, and T. Reps. Conseq: detecting concurrency bugsthrough sequential errors. In ACM SIGPLAN Notices,volume 46, pages 251–264. ACM, 2011.
32 26th USENIX Security Symposium USENIX Association