postmortem redistribution of the heroin metabolites...
TRANSCRIPT

1
Postmortem Redistribution of the Heroin Metabolites Morphine and Morphine-3-
Glucuronide in Rabbits over 24 hours
Peter D Maskell1,2*,Mohammed Albeishy3, Giorgia De Paoli1, Nathan E Wilson1, L Nitin
Seetohul1,4
1Centre for Forensic and Legal Medicine, University of Dundee, Dundee.DD1 4HN. Scotland UK.
2Department of Chemical and Forensic Sciences, University of Huddersfield, Huddersfield U.K.
3Poison Control and Medical Forensic Chemistry Center. P O Box 583. 45931 Gizan, Kingdom of Saudi Arabia.
4School of Science and Technology, Nottingham Trent University, Nottingham. U.K.
*Author to whom correspondence should be addressed.
Dr. Peter Maskell
Department of Chemical and Forensic Sciences
University of Huddersfield
Queensgate
Huddersfield
UK
Tel: +44 1484 471612
Email: [email protected]
Keywords: Postmortem Redistribution, Morphine, Morphine-3-glucoronide, Animal Model,
Heroin, Rabbit.

2
Abstract
The interpretation of postmortem drug levels is complicated by changes in drug blood levels in the
postmortem period, a phenomena known as postmortem drug redistribution. We investigated the
postmortem redistribution of the heroin metabolites morphine and morphine-3-glucuronide in a
rabbit model. Heroin (1mg/kg) was injected into anesthetised rabbit, after 1 hour an auricular vein
blood sample was taken and the rabbit was euthanised. Following death rabbits were placed in a
supine position at room temperature and divided into 3 groups namely 1) immediate autopsy, 2)
autopsy after 30 minutes and 3) autopsy 24 h after death. Various samples which included femoral
blood, cardiac blood, lung, liver, kidney, vitreous humour, subcutaneous & abdominal fat, liver,
bone marrow and skeletal muscle were taken. The samples were analysed with a validated LC-
MS/MS method. It was observed that within minutes there was a significant increase in free
morphine postmortem femoral blood concentration compared to the antemortem sample (0.01 ±
0.01 mg/L to 0.05 ± 0.02 mg/L).Various other changes in free morphine and metabolite
concentrations were observed during the course of the experiment in various tissues. Principal
component analysis was used to investigate possible correlations between free morphine in the
various samples. Some correlations were observed but gave poor predictions (>20% error) when
back calculating. The results suggest that rabbits are a good model for further studies of postmortem
redistribution but that further study and understanding of the phenomena is required before accurate
predictions of the blood concentration at the time of death are possible.

3
1. Introduction
Drug overdoses are one of the biggest killers in the UK and US with opiates being the largest group
of drugs involved in overdoses [1]. Heroin (3,6-diacetylmorphine) and its metabolite morphine are
the opiate drugs that are of greatest concern with an estimated 13-18 million people abusing them
worldwide [2]. Following administration heroin is rapidly deacetylated to 6-monoacetylmorphine
(6-MAM) with a t½ of ~5 minutes [3]. 6-MAM is then rapidly metabolised to morphine (t½ 5- 40
minutes) [3], with morphine being further metabolised to either the inactive metabolite morphine-3-
glucuronide (M3G) or to the active metabolite morphine-6-glucuronide (M6G) [3]. Following
unexplained deaths forensic toxicologists and forensic pathologists are required to interpret the level
of drugs detected in postmortem samples in order to determine the possible influence, if any, of the
drug causing death however the interpretation of postmortem drug levels has been described as a
‘toxicological nightmare’ due to postmortem redistribution [4]. Postmortem drug redistribution is a
term used to describe drug concentration changes in the body following death, mainly thought to be
due to passive diffusion [5]. In this phenomenon the concentration of drugs in the blood and other
tissues can change up to 15 fold after death [6]. It is thought that all drugs will be affected to some
extent by postmortem redistribution and the main contributing factors are 1) the time between death
and sampling, 2) the site(s) of sampling (with femoral blood being the sample that is least affected
by postmortem redistribution), 3) potential postmortem metabolism/production by either body
enzymes or bacteria and finally 4) physicochemical properties of the drug (such as pKa, LogP and
most importantly volume of distribution (Vd)) [5]. According to Hilberg et al [7] all molecules with
a Vd equal to or greater than 3 L/kg are liable to undergo postmortem redistribution. However there
are some molecules which appear to be an exception to this rule such as mirtazapine a drug with a
Vd of ~5L/kg has not been shown to exhibit any postmortem redistribution [8]. If the mechanisms
governing postmortem redistribution could be defined this would help the interpretation of
postmortem drug levels.
Although previous studies have been carried out investigating the postmortem redistribution of
morphine and metabolites in animal models [9-11] no studies have investigated the postmortem
redistribution of the heroin metabolites morphine, M3G and M6G from heroin. The rabbit model
was chosen as unlike rats, rabbits have a gall bladder [12] allowing morphine to undergo
enterohepatic recirculation as would be found in humans. Rabbits also have vitreous humour that
has similar chemical characteristics to those found in man [13], vitreous being an important matrix
for the determination of the use of heroin [14]. Recent advances in analytical technology also allow
reduced matrix volumes to be analysed [15] negating some of the concerns that have been raised
about using smaller animal models in the past [11].

4
The aim of this work was to study the influence of both time and site on the postmortem
redistribution of 6-MAM, morphine and M3G in rabbits, following intravenous injection in order to
determine if the rabbit is a suitable model for investigating postmortem redistribution and also a
good model for the study of the mechanisms of postmortem redistribution.
2. Materials and Methods
2.1 Chemical reagents
All reagents and solvents were of analytical grade. Diamorphine hydrochloride (Wockhardt) was
purchased from L E West Ltd (Barking, UK). Sodium carbonate, ethyl acetate, butyl acetate,
ammonium carbonate and acetonitrile (all of analytical grade) were supplied by Fisher Scientific
(Loughborough, UK). Horse plasma was supplied by TCS Biosciences (Buckingham, UK) and
SAGM blood obtained from Ninewells Hospital, Dundee. (Ethical approval for use was obtained
from local ethics committee). Blank samples of the following were purchased from local butchers:
porcine vitreous humour, porcine liver, bovine muscle, bovine bone marrow, porcine heart, porcine
lung, porcine kidney, bovine fat. Sterile potassium chloride concentrate 15 % w/v BP was supplied
by B Braun (Melsungen, Germany).
2.2 Standards, Calibrators, and Control Preparation
Stock solutions of 6- mononacetylmorphine (6-MAM), morphine, morphine-3β-D-glucuronide
(M3G), morphine-6-β-D-glucuronide (M6G), morphine-d3 (Md3) (all 1mg/ml) and morphine-3-
glucuronide-d3 (M3G-d3) (100mg/L) were supplied by LGC Standards (Teddington, UK).
Morphine, M3G and M6G stock solutions were used to prepare standard solutions at a
concentration of 25mg/L in methanol. Md3 and M3G-d3 solutions were used to prepare the internal
standard solutions at a concentration of 1mg/L in water. All stock solutions were stored in amber
vials at 4°C. The standard solutions were used to prepare a calibration curve range of 0.01, 0.025,
0.05, 0.1, 0.25, 0.5, and 1.0mg/L in plasma along with low quality control (LQC) (0.025 mg/L) and
high quality control (HQC) (0.5 mg/L) standards.

5
2.3 Study Design
New Zealand ex breeder white rabbits (Harlan, UK) with a mean weight (± SEM) of 4.26 ± 0.13kg
were anaesthetised by inhalation of 3-5% isoflurane with oxygen, (anaesthesia was maintained
throughout the procedure). Following anaesthetisation, rabbits were administered i.v.1mg/kg of
diamorphine (prepared as 2mg/ml stock in saline) and via the left auricular vein. 1 hour after the
administration of the diamorphine an antemortem blood sample was taken from the right auricular
vein. Immediately following the sampling, the rabbit was euthanised with 1ml i.v. potassium
chloride (15% w/v) and death was confirmed by the lack of a heartbeat. The potassium chloride was
estimated to only alter the circulating blood volume by ~0.4% based on rabbit total blood volume
data [16]. Following death the rabbit was placed in a supine position and kept at room temperature.
The rabbits were then divided into one of three groups: 1) Immediate autopsy. 2) Autopsy 30
minutes after death. 3) Autopsy 24 h after death. Each group comprised of 3 rabbits with the sample
size based on previous animal studies of postmortem redistribution [17-20]. Time points were
selected in order to look at rapid postmortem changes and the effects of postmortem changes over
24 h. The experiments were performed in accordance with the UK Animals (Scientific Procedures)
Act 1986. As far as the authors are aware there is no pharmacokinetic data on the heroin metabolite
morphine following heroin administration in rabbits, for this reason we based the length of time
between heroin administration and animal euthanasia on the morphine pharmacokinetics in a rabbit
[21]. In order to allow maximum possible distribution whilst still having a measurable amount of
morphine in the blood we selected a time of 1 hour between injection of the morphine and
euthanasia.
2.4 Sample Collection
All tissue samples were stored in Sterilin 20ml tubes and all fluid samples (vitreous and blood)
were stored in 5 ml ISS 2.5% sodium fluoride/potassium oxalate tubes.
Femoral Blood - The abdomen was opened along the midline sagittal plane and the inferior vena
cava, descending aorta and left and right femoral veins were exposed. Mixed femoral venous blood
(left and right) was drawn via syringe using a 19G × 1½" (1.1 × 40mm) needle after clamping the
vena cava immediately below the renal artery. Lung - upper right lobe was wiped clean with tissue
paper and then excised. Mixed cardiac - retrieved by removing the heart from the animal and
sampling the blood that pooled in the chest cavity. Heart - after removal of the heart, the heart was
wiped clean with tissue paper the left free wall and septum were excised and dried with tissue
paper. Right kidney- exposed, excised and the renal fascia and fat layer removed. The kidney was

6
then cleaned with tissue paper. Vitreous humour- extracted from both eyes using 19G × 1½" (1.1
× 40mm) needle. Subcutaneous fat - the skin was separated from the underlying muscle above the
right flank to reveal the subcutaneous fat pad and the sample was excised. Abdominal fat - a
sample of fat was excised from the abdominal cavity. Liver - wiped clean and the right lobe of the
liver was excised and then cleaned again with tissue paper. Bone marrow- mix extract from the left
femur, tibia and fibula bones. Skeletal muscle - the left thigh muscle was exposed and
approximately 5g excised. After collection all samples were stored at -20°C until analysed.
2.5 Sample Preparation
Tissue sample homogenates were prepared according to a previous published procedure by
Flanagan et al. [22]. Tissue samples were homogenised with an Ultra-Turrax T25 homogeniser
(IKA, Janke& Kunkel, Germany). In brief 1- 3g of tissue was weighed accurately and homogenised
in 4 volumes of deionised water. For fat/bone marrow homogenisation was with 2 parts of methanol
and 4 parts of hexane. The methanol/hexane homogenates were then centrifuged and the top hexane
layer discarded.
2.6 Sample Extraction
The sample extraction was based on a previously published method by Taylor and Elliott [15].
For biological samples, quality controls and calibrators, 150µL was diluted with 150µl equine
plasma. 50µl of M-d3 and 50µl of M3G-d3 internal standard (IS) solutions were then added to each
sample. 1ml of 0.5M ammonium carbonate solution was added to each sample and vortexed.
Solid phase extraction (SPE) was performed using a Varian Bond Elut LRC-C18, 200mg cartridges
(Agilent, Wokingham, UK). The cartridges were conditioned using 2ml of methanol followed by
2ml of water and finally 1ml of 0.5M ammonium carbonate solution. Then 1ml of either biological
sample, quality control or calibrator was loaded onto the SPE cartridges and allowed to drain to
waste. The cartridges were then washed using 5ml of 0.005M ammonium carbonate solution and
allowed to dry for 5 minutes. 1ml of 70:30 ACN:H2O solution was then loaded onto the cartridges
and allowed to elute into a 7ml clean glass vial. The eluent was collected and evaporated to dryness
under air at 45°C and reconstituted with 100µl of freshly made LC-MS mobile phase (96% Phase A
: 4% Phase B). Finally, the entire sample was transferred to an LC-MS vial for analysis.

7
3. Instrumental and Chromatographic Conditions
3.1 Qualitative LC-MS-MS Analysis of 6-Monoacetylmorphine, Morphine, Morphine-3-
glucuronide and Morphine-6-glucuronide
Qualitative analysis for 6-MAM, morphine, M3G and M6G was performed using an ABSciex 3200
QTRAP coupled to an Agilent 1200 series HPLC system consisting of a quarternary pump,
degasser and an autosampler (Warrington, UK). The injection volume was 20µl. Quantitative
analysis was based on gradient elution. With the following mobile phases: Mobile phase A:1ml of
1mM ammonium formate, 1ml of formic acid and 998ml distilled water. Mobile phase B 1ml of
1mM ammonium formate, 1ml of formic acid, 499ml of distilled water and 499ml of acetonitrile.
The method had a flow rate of 0.6ml/min the gradient elution started at 97% Phase A and 3% Phase
B held for 3 minutes and was then ramped to 5% Phase A, 95% Phase B over 5 minutes, held for
3.5 minutes and then reduced to 97% Phase A, 3% Phase B over 0.5 min. The overall run time was
15 minutes. The column used for analysis was Phenomenex Synergi 4µm Polar-RP 80A column
(150 mm × 2 mm × 4µm) protected by a Phenomenex Security Guard column (Macclesfield, UK).
A column temperature of 40°C was used throughout. Pure standards of each analyte were first
infused into the mass spectrometer to determine the most intense ion transitions that were
consequently used for compounds identification (and quantitation) applying an MRM scan. The
MRM transitions selected for identification were 6-MAM – 328/328 & 328/193, morphine -
286/286 & 286/165, M3G – 462/462 & 462/286, M3G – 462/462 & 462/286.
3.2 Quantitative LC-MS-MS Analysis of Morphine, Morphine-3-glucuronide and Morphine-6-
glucuronide
Quantitation was based on the Liquid Chromatography with Mass Spectrometry (LC-MS-MS)
method of Taylor & Elliott [14], analysis was isocratic, (97% Phase A, 3% Phase B) with a run-time
of 5 minutes using an ABSciex 3200 QTRAP MS/MS. The scan was performed in positive mode
using ion spray ionization (voltage 5500 V). Ion source temperature was set at 700 °C, DP 20 V, EP
10 V. The MRM transitions selected for quantitation were the following, for Morphine 286/165
(against Md3 289/152), for M3G and M6G 462/286 (both against M3G-d3 465/289) the MRM scan
was run in unscheduled mode.
8
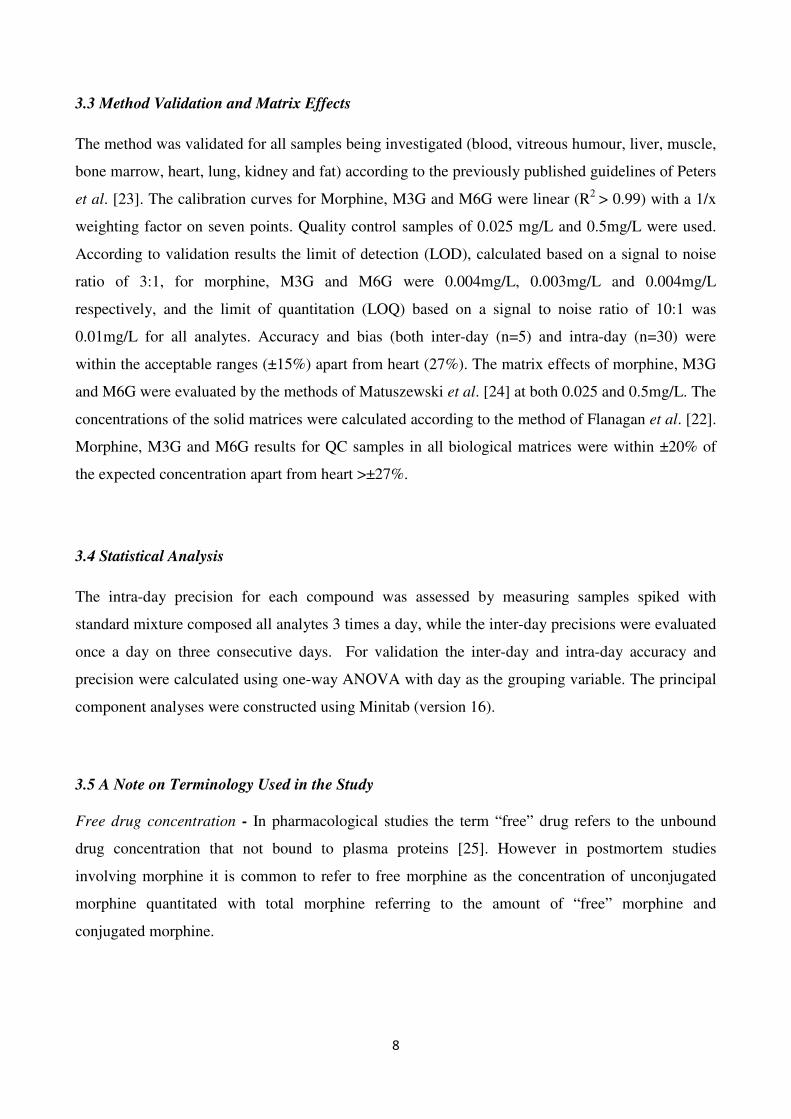
3.3 Method Validation and Matrix Effects
The method was validated for all samples being investigated (blood, vitreous humour, liver, muscle,
bone marrow, heart, lung, kidney and fat) according to the previously published guidelines of Peters
et al. [23]. The calibration curves for Morphine, M3G and M6G were linear (R2 > 0.99) with a 1/x
weighting factor on seven points. Quality control samples of 0.025 mg/L and 0.5mg/L were used.
According to validation results the limit of detection (LOD), calculated based on a signal to noise
ratio of 3:1, for morphine, M3G and M6G were 0.004mg/L, 0.003mg/L and 0.004mg/L
respectively, and the limit of quantitation (LOQ) based on a signal to noise ratio of 10:1 was
0.01mg/L for all analytes. Accuracy and bias (both inter-day (n=5) and intra-day (n=30) were
within the acceptable ranges (±15%) apart from heart (27%). The matrix effects of morphine, M3G
and M6G were evaluated by the methods of Matuszewski et al. [24] at both 0.025 and 0.5mg/L. The
concentrations of the solid matrices were calculated according to the method of Flanagan et al. [22].
Morphine, M3G and M6G results for QC samples in all biological matrices were within ±20% of
the expected concentration apart from heart >±27%.
3.4 Statistical Analysis
The intra-day precision for each compound was assessed by measuring samples spiked with
standard mixture composed all analytes 3 times a day, while the inter-day precisions were evaluated
once a day on three consecutive days. For validation the inter-day and intra-day accuracy and
precision were calculated using one-way ANOVA with day as the grouping variable. The principal
component analyses were constructed using Minitab (version 16).
3.5 A Note on Terminology Used in the Study
Free drug concentration - In pharmacological studies the term “free” drug refers to the unbound
drug concentration that not bound to plasma proteins [25]. However in postmortem studies
involving morphine it is common to refer to free morphine as the concentration of unconjugated
morphine quantitated with total morphine referring to the amount of “free” morphine and
conjugated morphine.
9
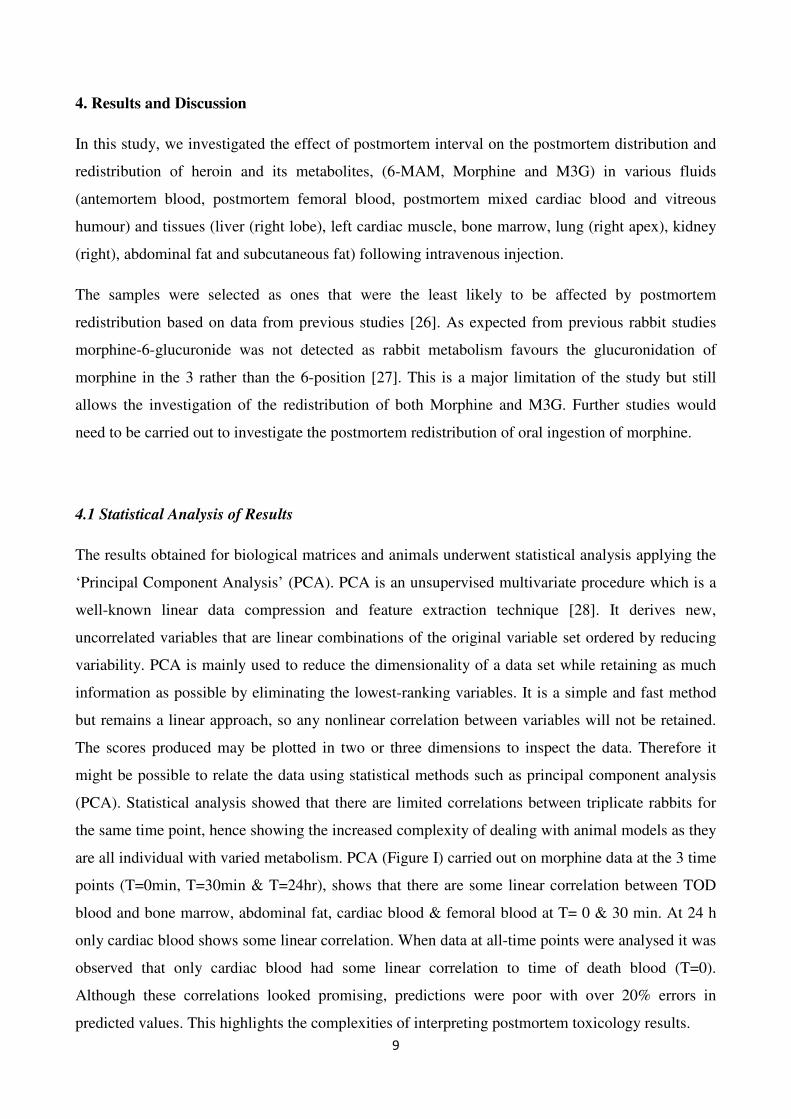
4. Results and Discussion
In this study, we investigated the effect of postmortem interval on the postmortem distribution and
redistribution of heroin and its metabolites, (6-MAM, Morphine and M3G) in various fluids
(antemortem blood, postmortem femoral blood, postmortem mixed cardiac blood and vitreous
humour) and tissues (liver (right lobe), left cardiac muscle, bone marrow, lung (right apex), kidney
(right), abdominal fat and subcutaneous fat) following intravenous injection.
The samples were selected as ones that were the least likely to be affected by postmortem
redistribution based on data from previous studies [26]. As expected from previous rabbit studies
morphine-6-glucuronide was not detected as rabbit metabolism favours the glucuronidation of
morphine in the 3 rather than the 6-position [27]. This is a major limitation of the study but still
allows the investigation of the redistribution of both Morphine and M3G. Further studies would
need to be carried out to investigate the postmortem redistribution of oral ingestion of morphine.
4.1 Statistical Analysis of Results
The results obtained for biological matrices and animals underwent statistical analysis applying the
‘Principal Component Analysis’ (PCA). PCA is an unsupervised multivariate procedure which is a
well-known linear data compression and feature extraction technique [28]. It derives new,
uncorrelated variables that are linear combinations of the original variable set ordered by reducing
variability. PCA is mainly used to reduce the dimensionality of a data set while retaining as much
information as possible by eliminating the lowest-ranking variables. It is a simple and fast method
but remains a linear approach, so any nonlinear correlation between variables will not be retained.
The scores produced may be plotted in two or three dimensions to inspect the data. Therefore it
might be possible to relate the data using statistical methods such as principal component analysis
(PCA). Statistical analysis showed that there are limited correlations between triplicate rabbits for
the same time point, hence showing the increased complexity of dealing with animal models as they
are all individual with varied metabolism. PCA (Figure I) carried out on morphine data at the 3 time
points (T=0min, T=30min & T=24hr), shows that there are some linear correlation between TOD
blood and bone marrow, abdominal fat, cardiac blood & femoral blood at T= 0 & 30 min. At 24 h
only cardiac blood shows some linear correlation. When data at all-time points were analysed it was
observed that only cardiac blood had some linear correlation to time of death blood (T=0).
Although these correlations looked promising, predictions were poor with over 20% errors in
predicted values. This highlights the complexities of interpreting postmortem toxicology results.

10
4.2 Detection of 6-MAM in Rabbit Tissues
6-MAM is considered as the most reliable biomarker for confirmation of use of heroin rather than
codeine or morphine. Our results (as shown in table I) show that 6-MAM was detectable in all
antemortem samples. This was to be expected as studies on the pharmacokinetics of heroin in
humans have shown that 6-MAM has a t½ of ~40 minutes before metabolism to morphine [29]. 6-
MAM was only detected in two matrices throughout the 24h duration of the experiment, vitreous
humour and muscle. These are matrices which have previously been found to be particularly good
for the investigation of 6-MAM in postmortem toxicological investigations as they lack esterase
enzymes which continue to metabolise 6-MAM even after death [30,31]. Heart, liver, lung and
kidney were the tissues that proved to be the least useful for the confirmation of heroin after death
as at best only 1/3 of samples were positive for 6-MAM after death. These matrices have previously
been shown to have high levels of carboxylesterase one of the enzymes responsible for the
metabolism of 6-MAM [32]. 6-MAM in bone marrow appeared to be stable for between 30 minutes
to 24 h with only 1/3 of samples positive at 24 h. These results suggest that 6-MAM is not as stable
in rabbit bone marrow as other species (rats and human), where 6-MAM has been shown to be
detectable up to 2 months after death. The reason for these differences are currently unclear [33,34].
6-MAM levels appeared to be stable in femoral blood (100%) and mixed cardiac rabbit blood (2/3)
over 24 h. Human studies indicate that 6-MAM is unstable in femoral blood as observed in 8 cases
in which femoral blood was taken on admission of the body to the mortuary and then at autopsy (an
average of 64 h later) there was a decrease in mean 6-MAM levels from 0.031 mg/L to 0.015 mg/L.
As we did not quantitate 6-MAM levels and also due to the differing time scales of sampling
between the human study and this study it is not possible to compare this study with the human
data. However, a study in horse blood which has a similar esterase make up to rabbits (containing
both Acetylcholine esterase (AChE) and carboxylesterase (CES) rather than humans which only
contain AChE has been compared with human blood. In horse blood it was found that 6-MAM was
more stable than in human blood with identical conditions [35]. It is unclear to why there are
differences but it could be due to differing enzyme kinetics and enzyme expression patterns. These
data re-enforce the previous recommendations that vitreous is the matrix of choice for the
postmortem detection of 6-MAM and in cases without vitreous, muscle should be the sample of
choice for the determination of heroin use.

11
4.3 Antemortem Morphine and Morphine-3-Glucuronide Levels
The ability to accurately calculate the antemortem value of a drug at death from postmortem data
would be the ideal scenario in forensic toxicology as standard pharmacokinetic equations could then
be used to calculate the dose of drug taken or administered and clinical data could be used to asses
potential toxicity. For this reason immediately prior to death an antemortem blood sample was
taken with which to compare matrices sampled postmortem. Our results as expected from previous
studies [11] showed a noticeable but non-significant variation between the individual antemortem
samples between rabbits, (0.01 mg/L to 0.139 mg/L for free morphine and 0.08 mg/L to 0.672 mg/L
for M3G). This variation was also seen when looking at total morphine values (morphine + M3G)
with values of 0.106 mg/L to 0.690 mg/L. These results also make it likely that the high variation in
postmortem morphine values may not just be a postmortem artefact but due to individual variances
found in life [11].
The postmortem femoral blood sample is considered to be the sample that is least affected by
postmortem redistribution [5]. However, both human [36] and animal studies [9] have shown that a
rise in free morphine is observed when comparing antemortem to immediate postmortem sample.
This was mirrored in our study where the free morphine concentration of the femoral blood sample
taken immediately after death was found to be at a higher concentration compared to the
antemortem sample (mean 0.05 mg/L and 0.01 mg/L respectively). It is thought that the rapid
change in free morphine is due to rapid changes in blood pH [37] (cardiac blood 7.34 +/- 0.02 to
6.74 +/- 0.05 within 5 minutes [9]) in the body. It is a limitation of this study that due to small
sample volumes it was not possible to measure the pH of the postmortem blood samples. pH
changes will alter the ionisation state of the morphine molecules allowing greater diffusion and thus
increased changes along any potential concentration gradient [38,9]. pH changes in the postmortem
environment apart from changes in ionisation states may also alter the plasma protein binding of
drugs (such as morphine) due to changes in protein structure and protein denaturation. Increasing
the amount of morphine available to freely diffuse in the postmortem environment [39] .
4.4 Postmortem Morphine Levels
We wanted to investigate the possible concentration changes of morphine over time in the
postmortem period. In order to minimise the variability between the differing animals the
postmortem concentrations of free morphine were normalised to the antemortem blood
concentration for each animal (the free morphine levels are shown in table II). The changes in

12
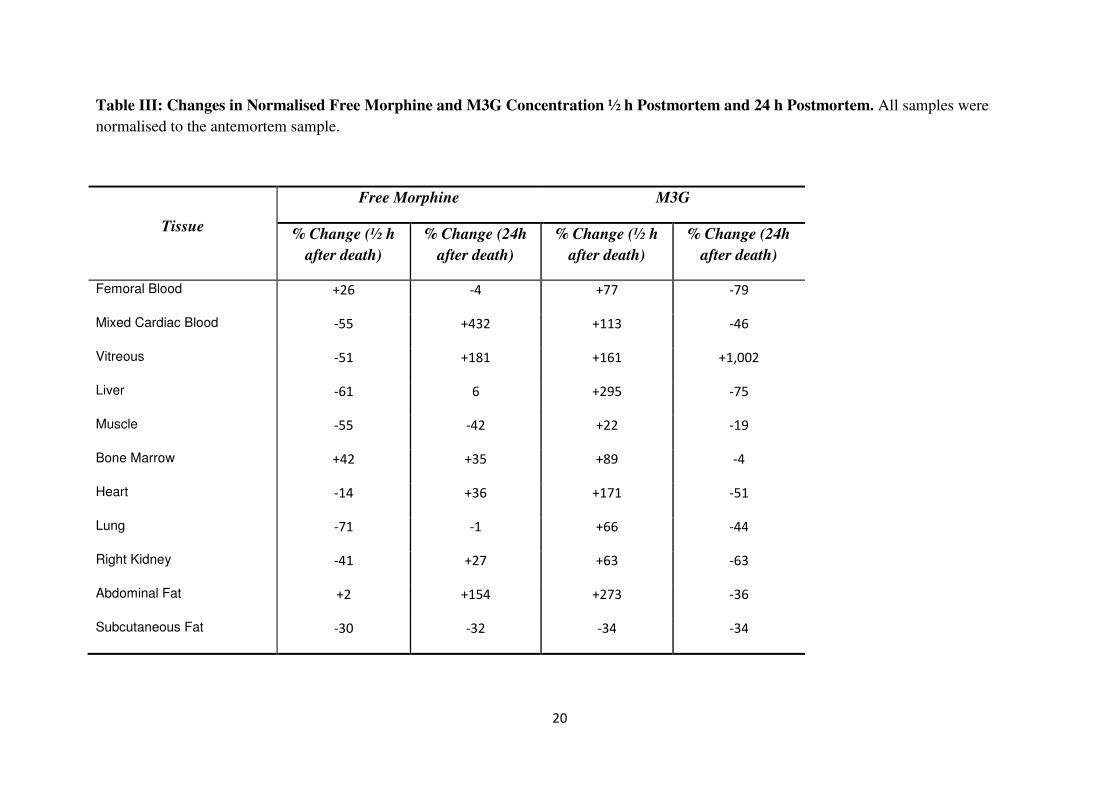
normalised free morphine concentration are shown in table III and figure II. In the postmortem
period mixed cardiac blood, vitreous and abdominal fat were the three matrices in which the largest
concentration changes of free morphine were observed over 24 h with increases of +432%, +181%
and +154% respectively. Intermediate changes (~30-42% change) were observed over 24h with
bone marrow, heart and right kidney free morphine concentrations all increasing and muscle and
subcutaneous fat free morphine concentrations both decreasing finally there were minor free
morphine concentration changes for femoral blood, liver, and lung (less than 10% change in
concentration). Investigations of the phenomena of postmortem redistribution in animal models
have demonstrated that changes in drug concentration can occur in as short a time period as 5
minutes [11]. Reasonably rapid changes in free morphine concentrations were observed in our
studies, as 30 minutes after death changes in free morphine concentration were observed, mainly
decreases of between -30 and -71%. In our study the only two matrices in which increases in free
morphine concentration were observed were femoral blood (+26%) and abdominal fat (minimal
change of +2%). The postmortem redistribution of morphine has been studied in humans and
animals but has not previously investigated the postmortem temporal changes of metabolites from
heroin. However these studies do show similar results in free morphine changes to those that we
have obtained in this study following the injection of heroin. Studies using animal models to
investigate free morphine changes have given mixed results, we observed an increase in free
morphine cardiac blood concentrations over 24hr (+432%). This is similar to rat studies [9] and [10]
in which +68% and +270% increases in free morphine concentrations changes were observed but
this was in contrast to studies in pigs [11] in which a decrease of 8.2% in free morphine was seen in
left ventricular blood. Limited data is available from humans on the time course of free morphine
changes postmortem, in one study of 11 cases postmortem femoral blood was taken on mortuary
admission and then again at autopsy (average 64 h) this result showed a slight decrease in the free
morphine concentration (admission 0.262 mg/L, autopsy 0.253 mg/L) [40]. In a slightly larger study
in 32 deaths left ventricular blood and femoral blood were sampled as soon after death as possible
(between 3 – 144 h) and then at autopsy (3–43 h later). In most cases no significant changes in
either femoral or left ventricular blood free morphine concentrations were observed over time.
However increases were observed in individual cases, mainly in cases in which higher initial free
morphine concentrations were observed. On average the concentration of free morphine in left
ventricular blood samples were significantly higher than femoral blood samples. When looking at
multiple studies human cardiac concentrations of free morphine have been found to be higher than
those observed in femoral samples [41]. Our study differed in the early postmortem period. We
observed an initial drop of free morphine concentration after 30 minutes (-55%). This was similar to
13
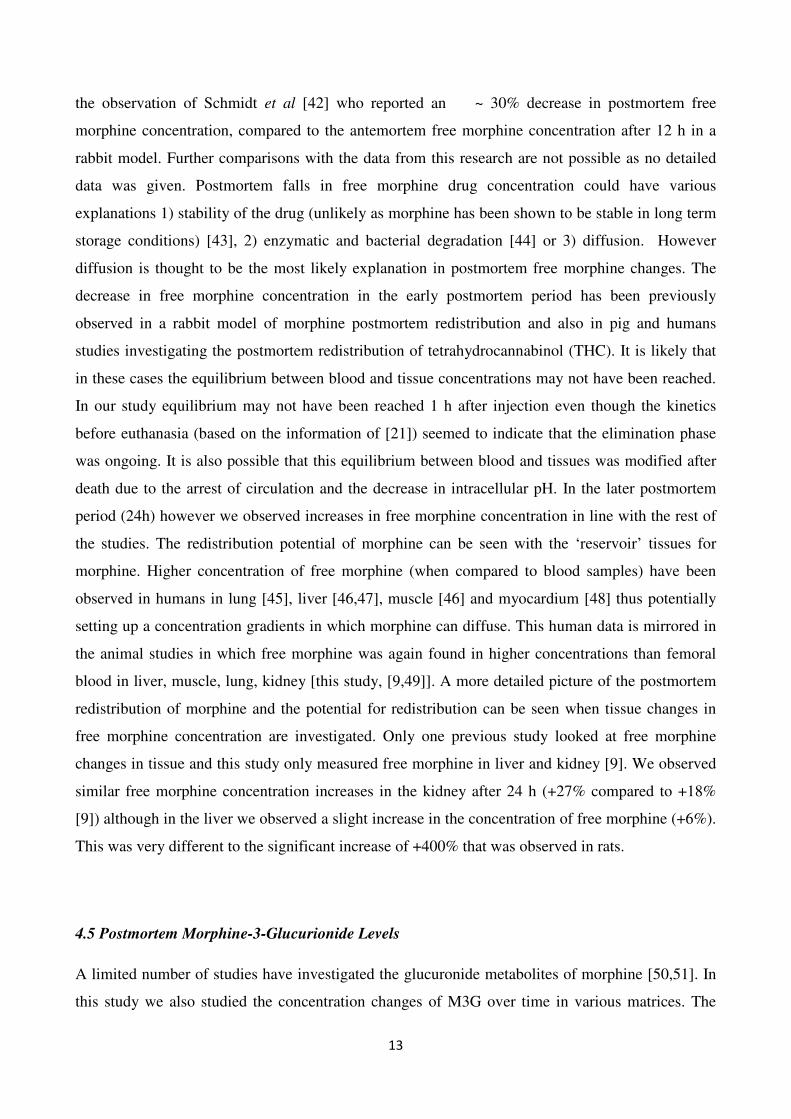
the observation of Schmidt et al [42] who reported an ~ 30% decrease in postmortem free
morphine concentration, compared to the antemortem free morphine concentration after 12 h in a
rabbit model. Further comparisons with the data from this research are not possible as no detailed
data was given. Postmortem falls in free morphine drug concentration could have various
explanations 1) stability of the drug (unlikely as morphine has been shown to be stable in long term
storage conditions) [43], 2) enzymatic and bacterial degradation [44] or 3) diffusion. However
diffusion is thought to be the most likely explanation in postmortem free morphine changes. The
decrease in free morphine concentration in the early postmortem period has been previously
observed in a rabbit model of morphine postmortem redistribution and also in pig and humans
studies investigating the postmortem redistribution of tetrahydrocannabinol (THC). It is likely that
in these cases the equilibrium between blood and tissue concentrations may not have been reached.
In our study equilibrium may not have been reached 1 h after injection even though the kinetics
before euthanasia (based on the information of [21]) seemed to indicate that the elimination phase
was ongoing. It is also possible that this equilibrium between blood and tissues was modified after
death due to the arrest of circulation and the decrease in intracellular pH. In the later postmortem
period (24h) however we observed increases in free morphine concentration in line with the rest of
the studies. The redistribution potential of morphine can be seen with the ‘reservoir’ tissues for
morphine. Higher concentration of free morphine (when compared to blood samples) have been
observed in humans in lung [45], liver [46,47], muscle [46] and myocardium [48] thus potentially
setting up a concentration gradients in which morphine can diffuse. This human data is mirrored in
the animal studies in which free morphine was again found in higher concentrations than femoral
blood in liver, muscle, lung, kidney [this study, [9,49]]. A more detailed picture of the postmortem
redistribution of morphine and the potential for redistribution can be seen when tissue changes in
free morphine concentration are investigated. Only one previous study looked at free morphine
changes in tissue and this study only measured free morphine in liver and kidney [9]. We observed
similar free morphine concentration increases in the kidney after 24 h (+27% compared to +18%
[9]) although in the liver we observed a slight increase in the concentration of free morphine (+6%).
This was very different to the significant increase of +400% that was observed in rats.
4.5 Postmortem Morphine-3-Glucurionide Levels
A limited number of studies have investigated the glucuronide metabolites of morphine [50,51]. In
this study we also studied the concentration changes of M3G over time in various matrices. The

14
results obtained are shown in table II. As with morphine in order to minimise the variability
between differing animals the concentrations of M3G were normalised to the antemortem blood
concentration of M3G. The concentration changes in normalised M3G are shown in table III and
figure III. In all the samples an increase in normalised M3G concentration was observed ½ hour
after death. The maximum changes in M3G concentration observed were in the liver (+295%) and
abdominal fat (+273%). In only subcutaneous fat, was a decrease in M3G concentration observed (-
34 %). 24 h after death in all samples, except vitreous in which a 1002% increase in M3G
concentration was observed, a decrease in M3G concentration was observed compared to the time
of death samples. The largest decreases in M3G concentration were observed in the liver (-75%)
and femoral blood (-79%) a minimal change in M3G concentration was observed in the bone
marrow (-4%). It would be thought that as a glucuronide, M3G would be highly polar and also with
a Vd of ~0.28 L/kg [41]. M3G should not undergo significant postmortem redistribution however
like morphine, higher M3G concentrations were observed in tissues (liver, kidney, lung and heart)
and they may act as depots of higher concentrations of M3G in which diffusion may occur into
adjacent areas which have lower concentrations of M3G. However an explanation for the
postmortem redistribution of M3G may be that, M3G has also been shown to exist in two
conformational forms in which M3G is actually found to be far more lipophilic than expected and is
only slightly less lipophilic than morphine [52]. It is conceivable that although M3G is more
lipophilic than expected the changes in concentration of M3G in the various matrices are likely to
be a combination of diffusion and hydrolysis dependent on the concentration gradient and the
metabolic enzymes present in the individual tissue. In vitreous and muscle it is likely that the M3G
concentration increase is due to diffusion as decreases in the free/total morphine ratio are observed
over 24 h (vitreous 69 to 35, muscle 67 to 54; Table VI). However changes in concentration could
also be due to a greater rate of diffusion of free morphine into surrounding tissue compared to M3G.
4.6 Postmortem Total Morphine Levels
In order to allow a better comparison of the results obtained in this study compared to previous
studies and also to investigate if the changes in free morphine concentration postmortem could be
due to the hydrolysis of morphine glucuronides rather than postmortem redistribution we calculated
the total morphine levels (morphine + M3G). The results (normalised to antemortem total morphine
levels) are shown in table IV. The percentage changes to total morphine concentration are shown in
table V and figure IV. After half an hour postmortem an increase was observed in the total
morphine concentration compared to the samples taken immediately after death. The largest

15
changes in total morphine concentration observed were in the fatty tissues, bone marrow and
abdominal fat with increases of 113 % and 182 % respectively. This was not true of all fatty tissue
as in subcutaneous fat concentrations of total morphine showed little change (+18 %) in the half
hour following death. The only other tissue where a decrease in total morphine concentration could
be observed was muscle with a decrease of 34%. However 24 h after death the total morphine
concentration had decreased in most of the tissues compared to the values of total morphine
concentration obtained close to the time of death. The only tissues that saw an increase in total
morphine concentration were vitreous humour (+425 %) and abdominal fat (+22 %). It has
previously been suggested from both in vivo and in vitro studies that observed increases in free
morphine concentration postmortem could be due to hydrolysis of morphine glucuronides rather
than postmortem redistribution [9,11,14] where an increase in the free/total morphine concentration
ratio would be seen with increasing hydrolysis. In order to investigate this we calculated free/total
morphine ratios. As shown in table VI there were increases in the free/total morphine ratio 24 h post
mortem for femoral blood (10 to 37), cardiac (7 to 39), liver (37 to 72), right kidney (14 to 28) and
abdominal fat (35 to 65). Vitreous humour was the only matrix in which the free/total morphine
ratios decreased in the 24 h following death (69 to 35). The role of hydrolysis in postmortem
redistribution of morphine is unclear, however our results agree with those found in a rat model of
postmortem redistribution where in both blood and liver the free/total morphine ratio increased over
time [9]. In our study for the 24 hour postmortem interval the liver free/total morphine ratio
increased from 15 to 41 and in the 96 hour postmortem interval liver free/total morphine ratio
increased from 20 to 86. This increase in ratio was mirrored with cardiac blood with the free/total
morphine ratio increasing from 26 to 69. However we felt that the changes in free/total morphine
ratio and thus hydrolysis of morphine glucuronides were only partially responsible for the increases
of free morphine over time due to the 1000% concentration increase in free morphine concentration
in the liver. In a pig model of postmortem redistribution of morphine [11] increases in free/total
morphine ratios were observed after 24 h (cardiac blood left ventricle – 11 to 76, femoral blood 22
to 37 and femoral artery 18 to 33) however after 96h the samples only exhibited a slight increase in
free/total morphine ratios from 5 minutes post mortem (Cardiac blood left ventricle – 11 to 20,
Femoral blood 22 to 26 and femoral artery 18 to 23) in the other samples collected, right ventricle
showed a decrease in the free/total morphine ratio at both 24 h 22 to 17, and 96 h 22 to 18).
Together these results show that although hydrolysis of M3G does occur and may have a role in the
differing concentrations of free morphine found in the various tissue post-mortem. It cannot be
easily predicted what will happen in any specific case in a specific tissue and that further
investigation into the phenomena is required.

16
4.7 Possible Movement of Drugs in the Postmortem Environment.
There are three current theories as to how morphine specifically and drugs in general redistribute in
the post mortem environment. They are 1) post mortem pH changes which modify the equilibrium
of the drug in tissue compartments [9] 2) passive diffusion of the drug down a concentration
gradient (either from neighbouring tissue, from the gastrointestinal tract or through blood vessels)
[4] and 3) conversion of morphine glucuronide(s) to morphine [53]. If there is movement of
morphine post mortem it would be expected to move from areas of high free morphine
concentration to areas of low free morphine concentration. As described above morphine was found
to have numerous tissue depots from which it could diffuse from (liver, muscle, lung, and kidney)
to adjacent organs and tissues. From the data in table II, morphine appears to be moving from the
heart tissue to the cardiac blood as there is an increase in the concentration in the cardiac blood over
time (from 0.02mg/L (time 0) to 0.07mg/L (24h) with the free morphine in the heart muscle
increasing from 0.03mg/L (0 h) peak at 0.10mg/L (½h) then decreasing to 0.04mg/L (24h). The
increase in the cardiac muscle free morphine concentration could be from the lung as a decrease is
seen over 24h (from 0.5mg/L to 0.36mg/L). However an increase in lung free morphine
concentration is observed from time of death to ½h (0.5mg/L to 0.74mg/L). It is possible this could
be redistribution from the lower lobes of the lung, but as there was no sampling from the other areas
in the lung this was not possible to confirm. In the muscle a decrease in the concentration of free
morphine was observed over 24h (0.27mg/L to 0.11mg/L) it is possible that free morphine diffused
from the thigh muscle into the adjacent blood vessels. This could account for the increase in
femoral blood free morphine that was seen in the first half hour following death (from 0.05mg/L to
0.13mg/L) however the femoral blood concentration of free morphine then decreased in the
following 23½h. It is possible the free morphine in the femoral blood then diffused into tissues with
a lower morphine concentration.
4.8 Conclusions
Although previously there have been doubts about the use of smaller animals to investigate the
mechanisms of postmortem redistribution [11] rats and rabbits still offer the most convenient
method of carrying out controlled studies for understanding of postmortem redistribution. This
study confirms the use of vitreous as the matrix of choice for evaluating use of heroin and further
recommends the use of muscles tissue in cases where vitreous is unavailable.

17
Conflict of Interest
All authors have nothing to disclose

18
Table I: Frequency of Positive Results for 6-Monoacetylmorphine (6-MAM) expressed as a percentage
Tissue At Death ½ h Postmortem 24 h Postmortem Rabbits
Antemortem Blood 100 100 100
Femoral Blood 100 66.6 100
Mixed Cardiac Blood 66.6 66.6 66.6
Vitreous 100 100 100
Liver 33.3 0 0
Muscle 100 100 100
Bone Marrow 100 100 33.3
Heart 33.3 0 0
Lung 33.3 0 33.3
Right Kidney 0 0 33.3

19
Table II: Concentration Values of Free Morphine and Morphine-3-Glucuronide (M3G) by Sampling Site and Time of Post Mortem
Interval. Values are mean ± SEM (n=3).
Free Morphine Morphine-3-Glucuronide
Post mortem interval (h)
Post mortem interval (h)
0 ½ 24 mean 0 ½ 24 mean
Control Antemortem Blood (mg/L)
0.01 ± 0.00
0.05 ± 0.04
0.01 ± 0.00
0.02 ± 0.01
0.34 ± 0.03
0.28 ± 0.20
0.30 ± 0.05
0.31 ± 0.04
Post mortem Femoral Blood (mg/L) 0.05 ± 0.02 0.13 ± 0.06 0.04 ± 0.02 0.45 ± 0.14 0.49 ± 0.27 0.07 ± 0.03
Post mortem Mixed Cardiac Blood (mg/L) 0.02 ± 0.00 0.05 ± 0.04 0.07 ± 0.04 0.20 ± 0.01 0.21 ± 0.07 0.10 ± 0.03
Vitreous (mg/L) 0.03 ± 0.00 0.04 ± 0.02 0.06 ± 0.01 0.01 ± 0.00 0.02 ± 0.01 0.12 ± 0.03
Liver (mg/kg) 0.28 ± 0.08 0.38 ± 0.25 0.26 ± 0.05 0.48 ± 0.02 0.41 ± 0.28 0.10 ± 0.01
Muscle (mg/kg) 0.27 ± 0.17 0.16 ± 0.10 0.11 ± 0.02 0.13 ± 0.02 0.04 ± 0.02 0.09 ± 0.02
Bone Marrow (mg/kg) 0.04 ± 0.01 0.10 ± 0.04 0.04 ± 0.01 0.05 ± 0.01 0.05 ± 0.02 0.04 ± 0.01
Heart (mg/kg) 0.03 ± 0.00 0.10 ± 0.06 0.04 ± 0.01 0.44 ± 0.12 0.35 ± 0.11 0.20 ± 0.04
Lung (mg/kg) 0.50 ± 0.02 0.74 ± 0.60 0.36 ± 0.26 0.81 ± 0.08 0.52 ± 0.11 0.42 ± 0.10
Right Kidney (mg/kg) 0.63 ± 0.37 1.01 ± 0.63 0.51 ± 0.30 3.86 ± 1.30 3.06 ± 1.09 1.30 ± 0.40
Abdominal Fat (mg/kg) 0.02 ± 0.00 0.03 ± 0.01 0.03 ± 0.01 0.03 ± 0.01 0.06 ± 0.02 0.02 ± 0.00
Subcutaneous Fat (mg/kg) 0.06 ± 0.01 0.07 ± 0.05 0.04 ± 0.02 0.06 ± 0.01 0.06 ± 0.05 0.04 ± 0.02
20
Table III: Changes in Normalised Free Morphine and M3G Concentration ½ h Postmortem and 24 h Postmortem. All samples were
normalised to the antemortem sample.
Tissue
Free Morphine M3G
% Change (½ h
after death)
% Change (24h
after death)
% Change (½ h
after death)
% Change (24h
after death)
Femoral Blood +26 -4 +77 -79
Mixed Cardiac Blood -55 +432 +113 -46
Vitreous -51 +181 +161 +1,002
Liver -61 6 +295 -75
Muscle -55 -42 +22 -19
Bone Marrow +42 +35 +89 -4
Heart -14 +36 +171 -51
Lung -71 -1 +66 -44
Right Kidney -41 +27 +63 -63
Abdominal Fat +2 +154 +273 -36
Subcutaneous Fat -30 -32 -34 -34

21
Table IV: Concentration Values of Total Morphine by Sampling Site and Time of Postmortem Interval. Values are mean ± SEM.
Total Morphine
Post mortem interval (h)
0 ½ 24 mean
Control Antemortem Blood (mg/L) 0.35 ± 0.03 0.33 ± 0.11 0.31 ± 0.03
0.33 ± 0.04
Post mortem Femoral Blood (mg/L) 0.50 ± 0.09 0.62 ± 0.19 0.11 ± 0.03
Post mortem Mixed Cardiac Blood (mg/L) 0.22 ± 0.01 0.26 ± 0.06 0.17 ± 0.05
Vitreous (mg/L) 0.04 ± 0.00 0.06 ± 0.01 0.18 ± 0.02
Liver (mg/kg) 0.76 ± 0.07 0.79 ± 0.34 0.36 ± 0.02
Muscle (mg/kg) 0.41 ± 0.12 0.20 ± 0.06 0.20 ± 0.01
Bone Marrow (mg/kg) 0.09 ± 0.01 0.14 ± 0.11 0.08 ± 0.02
Heart (mg/kg) 0.47 ± 0.08 0.46 ± 0.11 0.24 ± 0.02
Lung (mg/kg) 1.31 ± 0.09 1.27 ± 0.37 0.78 ± 0.22
Right Kidney (mg/kg) 4.49 ± 1.09 4.07 ± 1.14 1.81 ± 0.42
Abdominal Fat (mg/kg) 0.05 ± 0.01 0.09 ± 0.02 0.05 ± 0.01
Subcutaneous Fat (mg/kg) 0.12 ± 0.01 0.13 ± 0.06 0.08 ± 0.03

22
Table V: Changes in Normalised Total Morphine Concentration ½ h Post Mortem and 24h Postmortem
Tissue % Change (½ h Postmortem) % Change (24 h Postmortem)
Femoral Blood +63 -71
Mixed Cardiac Blood +25 -20
Vitreous +93 +425
Liver +84 -47
Muscle -34 -43
Bone Marrow +113 +9
Heart +50 -43
Lung +58 -39
Right Kidney +44 -57
Abdominal Fat +182 22
Subcutaneous Fat -18 -24

23
Table VI: Free/Total Morphine Ratios
Tissue 0h Postmortem ½ h Postmortem 24h Postmortem
Antemortem Blood 3 17 3
Femoral Blood 10 21 37
Mixed Cardiac Blood 7 21 39
Vitreous 69 66 35
Liver 37 49 72
Muscle 68 78 54
Bone Marrow 43 69 50
Heart 7 23 18
Lung 38 59 47
Right Kidney 14 25 28
Abdominal Fat 35 34 65
Subcutaneous Fat 48 56 54

24
Figure I: 3D Scatter Plot for Free Morphine Concentration for all Biological Matrices
Analysed. A) Immediate Postmortem. B) Postmortem after 30 minutes C) Postmortem
after 24 h D) All Postmortems combined
A)
B)

25
C)
D)

26
Figure II: Comparison of Free Morphine Concentration in Freshly Sacrificed, ½ h
Postmortem and 24 h Postmortem Rabbits.

27
Figure III: Comparison of Morphine-3-Glucuronide (M3G) Concentration in Freshly
Sacrificed, ½ h Postmortem and 24 h Postmortem rabbits.

28
Figure IV: Comparison of Total Morphine Concentration in freshly sacrificed, ½ h
Postmortem and 24 h Postmortem rabbits.

29
References
1. The lethal burden of drug overdose (2013). Lancet 382:833. 2. UN World drug report 2012. United Nations Publications, 3. Rook EJ, Huitema AD, van Den Brink W, van Ree JM, Beijnen JH (2006) Population
pharmacokinetics of heroin and its major metabolites. Clin Pharmacokine 45:401-417 4. Pounder DJ, Jones GR (1990) Post-mortem drug redistribution—a toxicological
nightmare. Forensic Sci Int 45:253-263 5. Pounder DJ (1993) The nightmare of postmortem drug changes. Legal Medicine
1993:163-191 6. Koren G, MacLeod S (1985) Postmortem redistribution of digoxin in rats. J Forensic
Sci 30:92-96 7. Hilberg T, Ripel A, Slørdal L, Bjørneboe A, Mørland J (1999) The extent of
postmortem drug redistribution in a rat model. J Forensic Sci 44:956-962 8. Anderson DT, Fritz KL, Muto JJ (1999) Distribution of mirtazapine (Remeron®) in
thirteen postmortem cases. J Anal Tox 23:544-548 9. Sawyer WR, Forney RB (1988) Postmortem disposition of morphine in rats. Forensic
Sci Int 38:259-273 10. Koren G, Klein J (1992) Postmortem redistribution of morphine in rats. Ther Drug
Monit 14:461-463 11. Crandall CS, Kerrigan S, Aguero RL, LaValley J, McKinney PE (2006) The influence
of collection site and methods on postmortem morphine concentrations in a porcine model. J Anal Tox 30:651-658
12. Tomcikova O, Bezek S, Durisova M, Faberova V, Zemanek M, Trnovec T (1984) Biliary excretion and enterohepatic circulation of two beta-adrenergic blocking drugs, exaprolol and propranolol, in rats. Biopharm Drug Dispos 5:153-162
13. De Letter E, De Paepe P, Clauwaert K, Belpaire F, Lambert W, Van Bocxlaer J, Piette M (2000) Is vitreous humour useful for the interpretation of 3, 4-methylenedioxymethamphetamine (MDMA) blood levels? Int J Legal Med 114:29-35
14. Rees KA, Pounder DJ, Osselton MD (2013) Distribution of opiates in femoral blood and vitreous humour in heroin/morphine-related deaths. Forensic Sci Int 226:152-159.
15. Taylor K, Elliott S (2009) A validated hybrid quadrupole linear ion-trap LC–MS method for the analysis of morphine and morphine glucuronides applied to opiate deaths. Forensic Sci Int 187:34-41
16. Little RA (1970) Changes in the blood volume of the rabbit with age. J Physiol 208:485-497
17. Brunet B, Doucet C, Venisse N, Hauet T, Hébrard W, Papet Y, Mauco G, Mura P (2006) Validation of large white pig as an animal model for the study of cannabinoids metabolism: application to the study of THC distribution in tissues. Forensic Sci Int 161:169-174
18. Brunet B, Hauet T, Hébrard W, Papet Y, Mauco G, Mura P (2010) Postmortem redistribution of THC in the pig. Int J Legal Med 124:543-549
19. De Letter EA, Clauwaert KM, Belpaire FM, Lambert WE, Van Bocxlaer JF, Piette MH (2002) Post-mortem redistribution of 3, 4-methylenedioxymethamphetamine (MDMA," ecstasy") in the rabbit. Int J Legal Med 116:216-224
20. Pélissier-Alicot A-L, Gaulier J-M, Dupuis C, Feuerstein M, Léonetti G, Lachâtre G, Marquet P (2006) Post-mortem redistribution of three beta-blockers in the rabbit. Int J Legal Med 120:226-232

30
21. Hédouin V, Bourel B, Martin-Bouyer L, Bécart A, Tournel G, Deveaux M, Gosset D (1999) Morphine perfused rabbits: a tool for experiments in forensic entomotoxicology. J Forensic Sci 44:347-350
22. Flanagan R, Amin A, Seinen W (2003) Effect of post-mortem changes on peripheral and central whole blood and tissue clozapine and norclozapine concentrations in the domestic pig (Sus scrofa). Forensic Sci Int 132:9-17
23. Peters FT, Drummer OH, Musshoff F (2007) Validation of new methods. Forensic Sci Int 165:216-224
24. Matuszewski B, Constanzer M, Chavez-Eng C (2003) Strategies for the assessment of matrix effect in quantitative bioanalytical methods based on HPLC-MS/MS. Anal Chem 75:3019-3030
25. Smith DA, Di L, Kerns EH (2010) The effect of plasma protein binding on in vivo efficacy: misconceptions in drug discovery. Nat Rev Drug Discov 9:929-939.
26. Pélissier-Alicot A-L, Gaulier J-M, Champsaur P, Marquet P (2003) Mechanisms underlying postmortem redistribution of drugs: a review. J Anal Tox 27:533-544
27. Kuo CK, Hanioka N, Hoshikawa Y, Oguri K, Yoshimura H (1991) Species difference of site-selective glucuronidation of morphine. J Pharmacobiodyn 14:187-193
28. Seetohul LN, Scott SM, O'Hare WT, Ali Z, Islam M (2013) Discrimination of Sri Lankan black teas using fluorescence spectroscopy and linear discriminant analysis. J Sci Food Agric 93:2308-2314
29. Pragst F, Spiegel K, Leuschner U, Hager A (1999) Detection of 6-acetylmorphine in vitreous humor and cerebrospinal fluid—comparison with urinary analysis for proving heroin administration in opiate fatalities. J Anal Tox 23:168-172
30. Goldberger BA, Cone EJ, Grant TM, Caplan YH, Levine BS, Smialek JE (1994) Disposition of heroin and its metabolites in heroin-related deaths. J Anal Tox 18 (1):22-28
31. Jenkins AJ, Keenan RM, Henningfield JE, Cone EJ (1994) Pharmacokinetics and pharmacodynamics of smoked heroin. J Anal Tox 18:317-330
32. Satoh T, Taylor P, Bosron WF, Sanghani SP, Hosokawa M, La Du BN (2002) Current progress on esterases: from molecular structure to function. Drug Metab Dispos 30:488-493
33. Cengiz S, Ulukan Ö, Ates I, Tugcu H (2006) Determination of morphine in postmortem rabbit bone marrow and comparison with blood morphine concentrations. Forensic Sci Int 156:91-94
34. Raikos N, Tsoukali H, Njau S (2001) Determination of opiates in postmortem bone and bone marrow. Forensic Sci Int 123:140-141
35. Rees KA, Jones NS, McLaughlin PA, Osselton MD (2012) The effect of sodium fluoride preservative and storage temperature on the stability of 6-acetylmorphine in horse blood, sheep vitreous and deer muscle. Forensic Sci Int 217:189-195
36. Tolliver SS, Hearn WL, Furton KG (2010) Evaluating the relationship between postmortem and antemortem morphine and codeine concentrations in whole blood. J Anal Tox 34:491-497
37. Sawyer WR, Steup DR, Martin BS, Forney RB (1988) Cardiac blood pH as a possible indicator of postmortem interval. J Forensic Sci 33:1439-1444
38. Yoshitome K, Ishizu H, Miyaishi S (2010) Postmortem acidification of blood/organs induces an increase in flecainide concentration in cardiac blood and the contribution of the lungs to this increase. J Anal Tox 34:26-31
39. Hinderling PH, Hartmann D (2005) The pH dependency of the binding of drugs to plasma proteins in man. Ther Drug Monit 27:71-85

31
40. Gerostamoulos D, Beyer J, Staikos V, Tayler P, Woodford N, Drummer OH (2012) The effect of the postmortem interval on the redistribution of drugs: a comparison of mortuary admission and autopsy blood specimens. Forensic Sci Med Pathol 8:373-379
41. Baselt RC (2011) Disposition of toxic drugs and chemicals in man (8th Edition). Biomedical Publications Seal Beach, California,
42. Schmidt C, Gossage B, Grinowski A, Martinez T (1996) Investigation of the postmortem redistribution of opiates. Proc West Pharmacol Soc 39:27-28
43. Hadidi K, Oliver J (1998) Stability of morphine and buprenorphine in whole blood. Int J Legal Med 111:165-167
44. Pounder DJ (2003) The case of Dr. Shipman. Am J Forensic Med Pathol 24:219-226 45. Spiehler V, Cravey R, Richards R, Elliott H (1978) The distribution of morphine in
the brain in fatal cases due to the intravenous administration of heroin. J Anal Tox 2:62-67
46. Felby S, Christensen H, Lund A (1974) Morphine concentrations in blood and organs in cases of fatal poisoning. Forensic Sci 3:77-81
47. Chan S-C, Chan EM, Kaliciak H (1986) Distribution of morphine in body fluids and tissues in fatal overdose. J Forensic Sci 31:1487-1491
48. Bailey DN, Shaw RF (1982) Concentrations of basic drugs in postmortem human myocardium. Clinical Tox 19:197-202
49. Crandall CS, Kerrigan S, Agüero Blau RL, LaValley J, Zumwalt R, McKinney PE (2006) The influence of site of collection on postmortem morphine concentrations in heroin overdose victims. J Forensic Sci 51:413-420
50. Skopp G, Ganßmann B, Mattern R, Aderjan R (1996) Postmortem distribution pattern of morphine and morphine glucuronides in heroin overdose. Int J Legal Med 109:118-124
51. Gerostamoulos J, Drummer OH (2000) Postmortem redistribution of morphine and its metabolites. J Forensic Sci 45:843-845
52. Carrupt PA, Testa B, Bechalany A, El Tayar N, Descas P, Perrissoud D (1991) Morphine 6-glucuronide and morphine 3-glucuronide as molecular chameleons with unexpected lipophilicity. J Med Chem 34:1272-1275
53. Skopp G, Pötsch L, Klingmann A, Mattern R (2001) Stability of morphine, morphine-3-glucuronide, and morphine-6-glucuronide in fresh blood and plasma and postmortem blood samples. J Anal Tox 25:2-7