postponement of certain compliance dates for the … · july 6, 2017 page 2 address concerns raised...
TRANSCRIPT
July 6, 2017
Engineering and Analysis Division Office of Water Environmental Protection Agency 1300 Pennsylvania Avenue NW Washington, DC 20460 Re: Comments on EPA’s Postponement of Certain Compliance Dates
for the Effluent Limitations Guidelines and Standards for the Steam Electric Power Generating Point Source Category. Docket ID: EPA-HQ-OW-2009-0819-6485 (82 Fed. Reg. 26,017).
Dear Sir or Madam: The American Water Works Association (AWWA) and the National Association of Water Companies (NAWC) appreciate the opportunity to comment on the Environmental Protection Agency’s proposed action published in the Federal Register on June 6, 2017: Postponement of Certain Compliance Dates for the Effluent Limitations Guidelines and Standards for the Steam Electric Power Generating Point Source Category (Docket ID: EPA-HQ-OW-2009-0819-6485, 82 Fed. Reg. 26,017). Opposition to open-ended extension
AWWA and NAWC oppose an open-ended extension of the compliance period for this rule while EPA considers alternatives because updating these effluent guidelines is vital to the protection of sources of drinking water and the protection of public health. An open-ended extension at this point is a threat to public health when EPA has recognized that “numerous documented instances of environmental impacts” have occurred because of discharges from steam electric power plants resulting in documented increased cancer risks to humans from the pollutants. See, EPA Office of Water document, EPA 821-F-15-004, September, 2015. We recognize that some adjustments may need to be made to the rule (see the section on bromide discharges below), but believe EPA can and should make these changes promptly to

July 6, 2017 Page 2
address concerns raised in the briefing before the United States Court of Appeals for the Fifth Circuit1 and protect sources of drinking water. EPA should set a specific deadline that is as soon as possible to make these revisions, and should not delay either the litigation or compliance dates further than is necessary to accomplish these tasks.
The importance of addressing bromide discharges impacting downstream water utilities immediately
AWWA and NAWC are petitioners to the ongoing litigation on this rule and opposed the abeyance of the litigation (Appendix A) because of the urgency of addressing discharges of bromide into sources of drinking water. These concerns continue, as bromide discharges into source waters increase brominated disinfection byproducts, posing a substantial treatment challenge to utilities and health concerns to the public. Additional delays in addressing this issue will only increase the harms described in more detail in the attached documents.
We recommend that as a part of any ongoing review of the rule, that EPA consider and subsequently implement a requirement for NPDES permit writers to include controls for bromide discharges instead of merely recommending controls as in the current rule. The information submitted by AWWA in 2013 for the original rulemaking (Appendix B) as well as the opening brief in the ongoing litigation (Appendix C) describe the importance of this issue and the need for EPA to address it. A key research study further describing these issues was published in Journal-AWWA after the 2013 comment deadline (McTigue et al 2014) and is also attached (Appendix D). In addition to these materials, an additional research study is currently undergoing peer review. A partial summary of this ongoing modeling work to estimate bromide loading from coal-fired power plants is attached in a technical memorandum (Appendix E). This additional information further supports AWWA’s contention that EPA needs to address this important public health issue by establishing mandatory controls rather than voluntary controls.
We stress the need for EPA to complete any review expeditiously, minimizing delay to the rule, and to complete the following activities:
1. Fully assess the costs to downstream water utilities of bromide discharges from power plants and include those costs as a consideration of any revisions of the rule. The current analysis does not accurately address these costs of inaction on bromide controls.
2. Utilize a transparent and open process to identify options to control bromide discharges and incorporate that information into any revised rule.
1 Southwestern Electric Power Co., et al. v. EPA, No. 15-60821. AWWA and NAWC are petitioners in this case. All references in these comments to litigation and legal proceedings refer to this case unless otherwise noted.
July 6, 2017 Page 3
3. Act to reduce or eliminate these costs and the associated public health concerns to downstream water utilities by limiting bromide discharges at the source.
Length of delay of compliance period
AWWA recommends that EPA should avoid or at least limit the delay of the compliance period to the shortest possible time necessary to add provisions for the control of bromide endangering drinking water sources. Absent a stated intention to address this concern, we recommend that EPA not delay the rule or the associated litigation further, so that this vital issue can instead be resolved through the courts. Given the fact that EPA has already been working on this rule for many years, we believe this process can be completed quickly.
In addition to this primary concern of bromide discharges, other aspects of this rule also help to protect sources of drinking water, and therefore delays towards implementing the rule unrelated to addressing bromide discharges should also be minimized to the greatest extent possible.
EPA’s attention to these important issues is essential and greatly appreciated. We appreciate the opportunity to comment on this important proposed rule. Please feel free to contact Adam Carpenter at AWWA (202-628-8303, [email protected]) if you have any questions regarding this comment.
Respectfully,
G. Tracy Mehan, III Executive Director of Government Affairs American Water Works Association
Michael Deane Executive Director National Association of Water Companies
July 6, 2017 Page 4
cc: Peter Grevatt – USEPA OGWDW Andrew Sawyers – USEPA OWM Ronald Jordan – USEPA OST About AWWA: AWWA is an international, nonprofit, scientific and educational society dedicated to providing total water solutions assuring the effective management of water. Founding 1881, the Association is the largest organization of water supply professionals in the world. Our membership includes nearly 4,000 utilities that supply roughly 80 percent of the nation’s drinking water and treat almost half of the nation’s wastewater. Our over 50,000 total memberships represent the full spectrum of the water community: public water and wastewater systems, environmental advocates, scientists, academicians, and others who hold a genuine interest in water, our most important resource. AWWA unites the diverse water community to advance public health, safety, the economy, and the environment. About NAWC: The National Association of Water Companies (NAWC) is the voice of the private water industry—the organization exclusively representing this group of quality service providers, innovation drivers and responsible partners. We are an association defined by our members, and by working together we can leverage our strengths to more effectively address the opportunities and challenges facing our nation. We serve as a credible resource and qualified professional partner for anyone who cares about safe and high-quality water. We engage with municipal leaders and the concerned citizens they represent, as well as educators, reporters, legislators, regulators and other water industry experts. We help shed light on all water-related issues, including the issues that often go unseen. We do our best for our members and the people, communities and businesses they serve. Our nation is facing serious challenges, and the NAWC and our members are providing powerful solutions. Appendices:
A- AWWA / NAWC opposition of the motion to hold all proceedings in abeyance in Southwestern Electric Power Co., et al. v. EPA, No. 15-60821.
B- September 20, 2013 AWWA comments on the Effluent Limitations Guidelines and Standards for the Steam Electric Power Generating Point Source Category (Docket ID No. EPA-HQ-OW-2009-0819.
C- AWWA / NAWC opening brief filed December 5, 2016 in Southwestern Electric Power Co., et al. v. EPA, No. 15-60821.

July 6, 2017 Page 5
D- McTigue, N.E., D.A. Cornwell, K. Graf, and R. Brown. November 2015.
Occurrence and consequences of increased bromide in drinking water sources. Journal of the American Water Works Association 106:11 E492-E508. http://dx.doi.org/10.5942/jawwa.2015.106.0141.
E- June 10, 2016 technical memo titled “Data Collection and Estimation of Bromide Loading from Coal-fired Power Plants”.

Appendix A AWWA / NAWC opposition of the motion to hold all proceeding in abeyance
(Southwestern Electric Power Co., et al. v. EPA, No. 15-60821).

1
IN THE UNITED STATES COURT OF APPEALS FOR THE FIFTH CIRCUIT
______________________
No. 15-60821
_______________________
SOUTHWESTERN ELECTRIC POWER COMPANY, et al., Petitioners, v. UNITED STATES ENVIRONMENTAL PROTECTION AGENCY, et al., Respondents.
OPPOSITION OF PETITIONERS AMERICAN WATER WORKS ASSOCIATION AND NATIONAL ASSOCIATION OF WATER
COMPANIES TO RESPONDENT’S MOTION TO HOLD ALL PROCEEDINGS IN ABEYANCE
Petitioners American Water Works Association (“AWWA”) and the
National Association of Water Companies (“NAWC”) oppose the motion by
Respondents to hold all proceedings in abeyance for 120 days. In response to
EPA’s motion, AWWA and NAWC state as follows:
1. As explained in AWWA and NAWC’s opening brief, statutory and
regulatory requirements established since the passage of the Clean Air Act in 1990,
have resulted in electric utilities installing air pollution control technologies such
as flue gas desulphurization (FGD) that increase discharges of bromide into

2
drinking water source water. Opening Brief at 4-9. In the course of this
rulemaking, EPA recognized that bromide in source water led to the formation of
carcinogenic disinfection by-products in drinking water supplies, creating adverse
effects on public health. (80 Fed. Reg. 67,886).
2. In the final rule challenged in this case, EPA is acting under its authority
in the Clean Water Act, 42 U.S.C. § 1311, et. seq., to address the increased
discharges to surface water in the last two decades from new pollution control
technologies required by the Clean Air Act and the implementing regulations.
3. EPA’s request to reconsider this rule will not change the fact that
pollution control technologies have already been installed at facilities and have
been operating for some time and that the result is an increase the amount of
bromide in drinking water sources. These pollution control technologies continue
to be installed at steam electric power plants.
4. Neither the petition by the Utility Water Action Group nor the letter
from EPA Administrator E. Scott Pruitt address this issue.
5. EPA argues in its motion that in response to a change in administrations
governing our country, it is entitled to reconsider its “interpretations of statutes”
and conduct “a reevaluation …of policy” and suggests that it would promote
judicial economy to hold the entire rule in abeyance since EPA’s reconsideration

3
of the rule might “obviate the need for judicial resolution of some or all of the
issues raised in the parties’ briefs.” EPA motion, p. 4-5.
6. Providing safe drinking water to the public is not a policy issue and
when a serious threat to the public’s drinking water supply is identified, it is EPA’s
duty to protect the public health regardless of its interpretation of statutes,
regardless of what administration is in power. Protection of public health also
outweighs any arguments about what might be the most effective way to judicially
resolve a challenge to a rulemaking.
7. EPA has had since December 5, 2016 when AWWA and NAWC filed
their opening brief to prepare its explanation to why it did not take more forceful
action to protect the nation’s drinking water supply after it recognized a serious
threat. EPA’s decision-making was arbitrary and capricious and no policy change
by a new administration can change that.
8. Halting judicial review of final regulations at this advanced stage of the
case based on the argument that the agency would like time to reconsider its
validly promulgated rulemaking would only disrupt and impede the orderly
administration of law.
9. AWWA and NAWC seek an expeditious resolution of the issues they
raised in this case and, therefore, oppose the request for another 120 days, after
which EPA is only committing to file a motion to govern further proceedings.
4
EPA should be ordered to file its brief in accordance with the schedule agreed to
by the parties and approved by the Court on September 28, 2016.1
Respectfully submitted, __/s/ John A. Sheehan___ John A. Sheehan Michael Best & Friedrich 601 Pennsylvania Ave, N.W. Suite 700 South Washington, D.C. 20004 Ph: 202-844-3808 [email protected] Dated: April 19, 2017
1 EPA’s brief was first set to be due on April 5, 2017. That date was extended until May 4, 2017 at the request of EPA due to a change in counsel responsible for the case.

5
CERTIFICATE OF SERVICE
I hereby certify that on the 19th day of April, 2017, I electronically file the
foregoing Opposition of Petitioners American Water Works Association and
National Association of Water Companies to Respondent’s Motion to Hold All
Proceedings in Abeyance using the CM/ECF system which will send notifications
of this filing to the attorneys of record.
April 19, 2017 Respectfully submitted, __/s/ John A. Sheehan___ John A. Sheehan

Appendix B September 20, 2013 AWWA comments on Effluent Limitations Guidelines and
Standards for the Steam Electric Power Generating Point Source Category (Docket ID No. EPA-HQ-OW-2009-0819).

September 20, 2013 Water Docket U.S. Environmental Protection Agency Mail Code: 4203M 1200 Pennsylvania Ave., N.W. Washington, DC 20460 RE: Effluent Limitations Guidelines and Standards for the Steam Electric
Power Generating Point Source Category (Docket ID No. EPA–HQ–OW–2009–0819)
Dear Sir or Madam, The American Water Works Association (AWWA) appreciates the opportunity to comment on the U.S. Environmental Protection Agency’s (USEPA’s) proposed Effluent Limitations Guidelines and Standards for the Steam Electric Power Generating Point Source Category. The effluent guideline for steam electric power plants was last revised in 1982, more than 20 years ago. In the intervening years, available pollution control technologies have improved substantially. Equally importantly, steam electric power plants, particularly coal power plants, are responding to Clean Air Act mercury controls. There is clear evidence from community drinking water systems in North Carolina, South Carolina, and Pennsylvania that steam electric power plant wastewater discharges are elevating bromide levels in surface waters. The level of bromide resulting from some power plants is sufficient to result in dramatic increases in regulated brominated disinfection byproducts in downstream water supplies. USEPA has a responsibility in crafting pollution control regulations to ensure that it does not create unacceptable risks. In finalizing the proposed effluent guideline, the Agency has a responsibility to craft standards that:

Water Docket Docket ID No. EPA–HQ–OW–2009–0819 September 20, 2013 Page 2
1. Guide steam electric power plants to use air pollution control technologies that do not produce wastewater high in bromide.
2. Ensure that power plants located upstream of drinking water supplies, employ wastewater treatment sufficient to protect downstream water systems from regulated contaminants, bromide, and other factors that exacerbate drinking water treatment challenges and create potential non-compliance with drinking water regulations.
3. Instruct NPDES permit writers to adequately consider downstream drinking water supplies in establishing permit requirements for power plant discharges.
4. Require monitoring of power plant effluent contaminant levels including bromide levels at sufficient frequency relative to plant operations to inform measures to limit adverse consequences for downstream drinking water treatment plants.
Please find attached a technical memorandum prepared by Environmental Engineering and Technology for AWWA. The memorandum provides supporting information on the issue of bromide release in power plant effluent impacting downstream drinking water systems. If you have any questions regarding the attached comments, please contact Steve Via at (202) 326-6130. Best regards, Thomas W. Curtis Deputy Executive Director cc: Betsy Sutherland Peter Grevatt Wynne Miller Jan Matuszko Jezebele Alicea-Virella James Covington Attachments: 1(14 pages)

About the American Water Works Association
The American Water Works Association (AWWA) is an international, nonprofit, scientific and educational society dedicated to the improvement of drinking water quality and supply. Founded in 1881, the Association is the largest organization of water supply professionals in the world. Our 50,000-plus members represent the full spectrum of the drinking water community: treatment plant operators and managers, environmental advocates, scientists, academicians, and others who hold a genuine interest in water supply and public health. Our membership includes more than 4,000 utilities that supply roughly 80 percent of the nation's drinking water. Protecting public health is an essential goal of the drinking water profession and the mission of each public water system.

Attachment 1. Impact of Bromide Discharges into Drinking Water Sources from Coal-Fired
Power Plants, Environmental Engineering and Technology, Inc., September 20, 2013.

September 18, 2013 EE&T Project No. 5327-02 Subject: Impact of Bromide Discharges into Drinking Water Sources from Coal-Fired
Power Plants
BACKGROUND
In December 2011, the US Environmental Protection Agency (USEPA) approved new
strict discharge limits targeting oil- and coal-fired electrical power generating facilities. These
requirements are scheduled to take effect in 2015, though MATS has been revised and
“reconsidered”, and the comment period has been extended, a number of times since first
published (USEPA 2012 – USEPA approved in December 2011 but not published in Federal
Register until February 2012). MATS will target reductions in emissions of metals (mercury,
arsenic, chromium, nickel), acid gases (hydrochloric and hydrofluoric), particulate matter, sulfur
dioxide (SO2), and nitrous oxides (NOx). Figure 1 shows a USEPA prepared map of the US
facilities with coal, oil, or both coal and oil units at the power plant (USEPA 2011). It is
estimated that 1,100 coal-fired units and 300 oil-fired units at 600 power plants will be impacted
by the MATS requirements (USEPA 2011). In the remainder of this memorandum, the term
“coal-fired” power plants will be used, but this will be interpreted to mean coal or oil-fired units
at electrical power generating facilities with these units.
This memorandum deals with how these new requirements to control emissions from
coal-fired power plants may lead to discharges of more bromide into drinking water sources, and
how these bromide discharges will impact the production of compounds harmful to public health
and the ability of public water systems to meet federal and state drinking water treatment
requirements. The discussion below will first discuss how some of the new MATS requirements
may lead to more bromide discharges into drinking water sources, how this will impact drinking
water treatment operations and resulting quality of drinking water delivered to customers, and
some case studies illustrating impact of bromide discharges from coal-fired power plants on
downstream drinking water systems.

EE&T, IN
Figure 1
IMPACT
M
MATS S
Economi
favored w
M
three bas
mercury
electrosta
a tendenc
it can be
volatile a
C.
. Location o
T OF BROM
Most coal-fir
SO2 requirem
ic analysis w
when coal w
Mercury is pr
sic forms (K
in gas for
atic precipita
cy to stick to
e captured b
and insolubl
of US Oil- a
MIDE ON D
red power pl
ments proba
will dictate
with higher su
resent in flue
Kellie et al, 2
rm (Hg2+).
ators (ESP) o
o particulate
by the ESP
le in water a
and Coal-fir
DRINKING
lants do not
ably will re
which is s
ulfur content
e gas in vary
2005): partic
The partic
or fabric filt
e matter and
, fabric filte
and is thus n
red Power P
G WATER T
currently u
esult in insta
selected, but
t is used, like
ying percent
culate-bound
culate-bound
ters (Bustard
is water sol
ers, or wet/
not readily r
Plants (USEP
TREATME
use either we
allation of m
t wet scrub
e in much of
tages, depen
d mercury, el
d mercury c
d et al, 2003)
luble (Blyth
/dry scrubbe
removed by
PA 2011)
ENT
et or dry scr
more wet o
bber technol
f Eastern US
nding on the
lemental (H
can be eas
). The oxid
he et al, 2002
ers. Howeve
y typical air
rubbers. The
or dry scrub
logy is gene
S.
origin of co
g0), and oxi
sily remove
dized mercur
2). Conseque
er, Hg0 is h
pollution co
2
e new
bbers.
erally
oal, in
dized
d by
ry has
ently,
highly
ontrol

EE&T, INC.
3
devices. Addition of bromide-containing salts (usually calcium bromide) to the coal combustion
unit can convert the mercury into the more water soluble Hg2+ form. This soluble mercury is
better removed by the wet scrubbers used to clean flue gasses. However, while the mercury in
the wastewater can be removed prior to discharge into a receiving stream, the added bromide is
not well removed and typically ends up being discharged. Some data regarding the fate of
bromide in Dutch power plants equipped with selective catalytic reduction (SCR), ESP, and wet
scrubbers suggests that 82% of the total bromide added is discharged (Meij, 1999).
In 14 full scale coal-fired power plant tests using calcium bromide (CaBr2) to oxidize
elemental mercury, greater than 90% of the mercury was oxidized with the addition of 25 to 300
ppm bromide by weight of coal (Chang et al., 2008). This range is wide due to the coal’s natural
abundance of chlorine and bromine giving the coal varied natural performance for oxidizing
mercury. A 1 MW power plant operated 24 hours a day, 365 days a year would produce
8,760,000 KWh/year. According to the US Energy Information Administration it takes 1.07 lbs
of coal to produce 1 kWh. This means that for each MW of electrical power plant capacity, a
coal-fired power plant would require 9,373,200 lbs coal/year or 25,680 lbs coal/day. With the
range of 25 to 300 ppm for bromide noted in Chang et al. (2008), the amount of bromide added
to the system each day per MW of power is estimated as follows:
25,680∙
25 10
2 1
1 199.9
79.91
0.51∙
25,680∙
300 10
2 1
1 199.9
79.91
6.2∙
If 0.51 to 6.2 lb/day of bromide are added for a 1 MW power plant, and 82% of the
bromide is discharged as scrubber wastewater, theoretically 0.42 to 5.1 lbs/day of bromide can
be discharged into receiving streams from a 1 MW plant.
In 2006 about 100 gigawatts (GW) of coal-fired power plant capacity in the United States
was equipped with flue gas desulfurization (FGD) technology, 90 GW of which are wet
scrubbers (Miller et al, 2006). Figure 2 is from a National Energy Technology Laboratory report,
projecting the flue gas desulfurization capacity to increase to 231 GW by year 2020. If 90
percent of the FGD processes installed continue to be wet scrubbers, then 208 GW of the

EE&T, IN
electrical
between
found in
bromide
fired boil
Figure 2
C
requirem
First, as
scrubbers
used has
conseque
where br
these we
increased
unless th
bromide
Figure 3
releases i
large por
C.
l power gen
a wet of dry
eastern stat
injection fo
lers use their
2. Projected
Currently, th
ments may inc
noted abov
s in respons
s a low bro
ence of the M
romide is no
et scrubber d
d need to re
he coal alrea
released to
was prepare
in different U
rtion of the
nerating capa
y scrubber is
tes will prefe
r mercury co
r technology
increase in
here are no
crease brom
ve, a large n
se to remove
omide conte
MATS requi
ot added to im
discharges w
emove merc
ady naturally
receiving w
ed by USEP
US States as
se improve
acity in 202
site specific
fer a wet scr
ontrol claim
y (Mcilvaine
U.S. Coal-F
o bromide
mide discharg
number of c
e SO2 remov
ent, the incr
irements wil
mprove mer
will include
cury in coal
y has a high
waters will b
PA (2011) an
s a conseque
mercury re
20 will empl
c, in general
rubber over
ms a combine
Company 2
Fired Wet F
discharge
ges from coa
coal-fired po
val requirem
reased use
ll result in m
rcury remov
even greater
l-fired powe
h bromide co
be greater th
nd illustrate
nce of the M
eleases are e
loy wet scru
the plants u
a dry .One v
ed total of 8
2012).
FGD Capac
standards.
al-fired powe
ower plants
ments of MA
of wet scru
more bromid
al. If the co
r amounts o
er plants ma
ontent, and
han before t
s the projec
MATS mercu
expected to
ubbers. Alth
using high su
vendor prom
,000 MW o
ity
However, t
er plants in a
are going t
ATS. Even i
ubbers to re
de releases, e
al source is
of bromide.
ay cause br
in either cas
the wet scru
ted improve
ury requirem
be due to
hough the ch
ulfur coal as
moting the u
f US utility
the new M
a couple of w
to be adding
f the coal so
emove SO2
even in situa
high in brom
Furthermore
romide to ad
se the amou
ubber was ad
ement in me
ments. Howev
increased u
4
hoice
often
use of
coal-
MATS
ways.
g wet
ource
as a
ations
mide,
e, the
dded,
unt of
dded.
ercury
ver, a
use of

EE&T, IN
bromide.
into publ
meet reg
greater h
discussio
Figure 3
IMPACT
D
the reduc
a wide v
destabiliz
mangane
H
drinking
other adv
C.
Consequen
lic drinking w
gulatory requ
health risks
on in next sec
3. ProjectedPlants w(USEPA
T OF BROM
Disinfection
ction in wate
variety of ot
zation and
ese, or arseni
However, in
water can i
verse health
ntly, the incr
water source
uirements an
s than anal
ction).
d State-by-with and wi
2011)
MIDE ON D
of drinking
erborne disea
ther benefits
agglomerat
ic), destructi
spite of the
induce canc
h effects afte
reased risk o
es may, in tu
nd may incre
ogous chlor
State mercithout imp
DRINKING
water with
ase. In additi
s to drinking
tion, oxidat
ion of undesi
ese positive
er, affect re
er prolonged
of bromide d
urn, increase
ease the pro
rinated DBP
ury (Hg) erovements
G WATER T
free chlorin
ion to disinf
g water trea
tion of inso
irable taste a
benefits, it
eproductive
d (i.e., lifeti
discharges f
e difficulty o
oduction of m
Ps to drink
emissions frin respons
TREATME
ne has made
fection, chlor
atment (for
oluble redu
and odor cau
t has also be
and develop
ime) exposu
from coal–fi
of drinking w
more bromin
king water
rom US Cose to MAT
ENT
a significan
rine has been
example, im
uced substa
using compo
een shown
pmental pro
ures (AWWA
ired power p
water supplie
nated DBPs
consumers
oal-Fired PTS requirem
nt contributi
n used to pro
mproved pa
ances (like
ounds, etc.).
that chlorin
cesses, and
A 2004, US
5
plants
ers to
with
(see
Power ments
ion to
ovide
article
iron,
nated
have
SEPA

EE&T, INC.
6
2006). These adverse health effects have mostly been attributed to disinfection by-products
(“DBPs”), the term used to collectively describe the suite of products resulting from reactions of
free chlorine and other oxidants with natural organic matter (NOM) and other substances in the
water. In particular, the DBPs most commonly associated with these observed adverse health
effects have been halogen substituted organics, typically DBPs containing chlorine or bromine.
At present, while there are a large variety of complicated halogen substituted DBP compounds
believed to result from chlorination of drinking water, the only currently regulated DBPs are
TTHM (the sum of chloroform, bromodichloromethane, dibromochloromethane, and
bromoform) and HAA5 (mono-, di-, and tri-chloro acetic acid and mono- and di-bromo acetic
acid).
Chlorine added to drinking water reacts quickly with reduced substances (e.g., reduced
iron), as noted above, plus it also reacts quickly with ammonia, organic compounds containing
nitrogen, and the bromide ion (Br -). Any chlorine not consumed by these reactions can produce
disinfection, but can also produce DBPs if enough DBP precursor material is present and if
unreacted free chlorine residual remains in water for a long enough time for the DBP formation
reactions to occur.
Most chlorine in drinking water is consumed in oxidation reactions, including oxidation
of organics (Jolley 1975). However, some added chlorine substitutes into organic compounds to
produce a chlorine substituted DBP, and some of the added chlorine can transfer its
oxidative/disinfecting power to another compound. In the latter case, chlorine can: a) react with
ammonia to produce chloramines (typically monochloramine or NH2Cl), b) react with nitrogen
containing organics to produce organic chloramines, and c) oxidize bromide to bromine. When
free chlorine reacts with bromide to produce free bromine in water, the bromine reacts
analogously to free chlorine in: i) oxidation of any reduced metals still present, ii) disinfection,
iii) reaction with ammonia to produce bromamines1 (typically dibromamine), and iv) formation
of bromine substituted DBPs if DBP precursor material is present.
1 Chloramines can also react with bromide to produce bromamines
EE&T, INC.
7
Therefore, in water chlorine can react directly with organic DBP precursors, but can also
react first with bromide, then the resulting bromine can react with organic DBP precursors to
produce brominated organic DBPs2. This is important for a number of reasons:
1. Greater health risks attributed to brominated DBPs than chlorinated DBPs = Risks
from cancer and other adverse human health effects are generally thought to be
greater for bromine substituted DBPs than with analogous DBPs containing chlorine
instead of bromine (Cantor et al. 2010). For example, the concentration of species that
gives one in a million (1/1,000,000) lifetime cancer risk for dibromochloromethane
(ChBr2Cl) is 0.6 µg/L on a mass basis. For chloroform (CHCl3) it is 6 µg/L.
Therefore, on a mass basis it appears that CHBr2Cl has 10 times greater lifetime
cancer risk than CHCl3. However, when you take into account the different in
molecular weight (119.4 µg/µmol for CHCl3 and 208.3 µg/µmol for CHBr2Cl), the
difference on a molar basis is even higher (~17.4 times greater).
2. Regulatory limits for drinking water compliance are mass based not molar based =
Drinking water facilities are currently faced with two regulatory limits for halogen
substituted DBPs: TTHM (sum of four compounds listed above) ≤ 0.080 mg/L and
HAA5 (sum of five compounds listed above) ≤0.060 mg/L. Consequently, the
regulatory limit is simply based on taking the mass concentration of each compound,
without correcting for molar weight, and adding each numerical value for the four or
five compounds involved. Therefore, a water system with no bromide in background
source water will be in compliance with TTHM limit if they have 60 µg/L of
chloroform and no detectable brominated THMs. In this case, about 0.5 µmol/L of
TTHMs were produced. However, if nothing else changes but enough bromide is
added to produce bromodichloromethane instead of chloroform, then 0.5 µmol/L of
TTHM will produce ~82 µg/L which could create compliance difficulties3. Therefore,
a water system currently in compliance with federal and state requirements may no
2 Furthermore, although free chlorine cannot react with bromine in drinking water to produce bromate, a stronger oxidant like ozone can reach with bromide in drinking water to produce bromate, which is a regulated inorganic DBP in drinking water. 3 Compliance is based on annual average at each compliance location in a water system, as required in Stage 2 DBPR. Therefore, a single TTHM value above 0.080 mg/L (80 µg/L) will not mean the water system is out of compliance, as long as the average TTHM for four samples at this location during a one year period is ≤0.080 mg/L.

EE&T, INC.
8
longer be in compliance if bromide is added to the drinking water source in amounts
sufficient to increase the amount of brominated DBPs produced.
3. Increased formation of brominated DBPs due to greater reactivity of bromide = The
above note suggests that the presence of bromide during chlorination can increase the
numerical value of the regulatory compliance value even if the same amount of
organic precursor material is present and even if the same molar concentration of
DBP is produced. However, since free bromine in drinking water reacts more quickly
than free chlorine, more DBPs (on a molar basis) will be produced (the increased
reactivity of bromine will mean more oxidation of organics by bromine, as well as
bromine substitution reactions).
Therefore, releases of bromide into drinking water sources can potentially impact public
health for consumers of treated drinking water, and can substantially complicate treatment at
drinking water facilities in order to meet regulatory requirements. Water systems have typically
already completed their studies to evaluate source water quality in order to develop DBP control
strategies. New bromide releases from coal-fired power plants have not been evaluated by water
plants beforehand. If these bromide releases occur, the drinking water systems may not detect the
changing conditions until they start noting elevated DBP levels, particularly brominated species,
in compliance monitoring locations. Then all water systems in the watershed will have to do an
immediate re-evaluation of treatment to meet the regulatory limits under the new conditions.
Unfortunately, there is little the water systems can do once the bromide gets into the source
water. They could try drastically increasing removal of organic DBP precursors, but that will not
be easy or affordable. Removing the bromide once it is in the water will be even more
problematic. The best solution would be to find a way to keep the bromide from getting into the
drinking water sources, either by: a) not using bromide to remove mercury at coal-fired power
plants, b) using coal with lower mercury content, or c) trying to remove bromide from
wastewater streams prior to discharge (this will not be easy either, but will at least be easier to do
in a concentrated stream than in a more dilute stream at the water plant).

EE&T, INC.
9
CASE STUDIES
While many US water systems do not have source water bromide levels as high as some
overseas locations, there has become a new concern associated with bromide discharges into
potable water sources. There is some information available in the literature where drinking water
facilities have detected an increase in brominated DBPs and they have traced bromide discharges
from coal-fired power plants as potential sources (States et al. 2013 and Hopkins 2013). These
references also cite other potential bromide sources, including hydrofracking, treated wastewater
effluents, and industrial discharges.
Figure 1 indicated the USEPA identified coal- and oil-fired electrical generating facilities
in the US. Except for a large number of generating facilities in TX, most of the power plants
indentified are east of the Mississippi River, especially in TN, GA, AL, SC, NC, VA, eastern
OH, western PA, and several locations along the Ohio River (IL, IN, OH, KY, and WV).
Locations with fossil fuel powered electrical generating facilities in US generally use coal,,
though oil-fired facilities can be found at some locations along either Atlantic or Pacific coasts
(CA, NY, NJ, MA, CT, FL) and in some important oil producing areas (TX, OK, LA).
Figure 4 includes locations of three power plants, rivers, streams, and a drinking water
treatment facility using surface water located upstream of Charleston SC. This situation is an
example of a water system directly impacted by bromide discharges from a power plant. As
shown in Figure 4, the City of Charleston surface water treatment plant, called Hanahan Water
Treatment Plant, uses the Cooper River as their water source and their intake is downstream from
three coal fired power plants. The power plant that is furthest upstream has a capacity of 2,390
MW and is located at the north shore of Lake Moultrie. The next power plant south of this power
plant has a capacity of 346 MW and is located on the south shore of Lake Moultrie. The power
plant closest to Charleston’s intake has a capacity of 633 MW and installed a wet scrubber in
2009. The power plant’s website indicates that the new wet scrubber eliminates 60-90% of the
former mercury emissions.

EE&T, IN
Figure 4
A
which ha
located i
during Ja
occasion
were as h
C.
4. Three coatreatmen
As shown in
ave been ro
in this water
anuary 2002
ally were ra
high as 1.9 m
al-fired pownt plant for d
Figure 4, t
outinely mon
rshed, owne
2 thru July
arely above 0
mg/L on two
er plants indrinking wa
there are som
nitored for
ed and samp
2006 revea
0.6 mg/L, bu
occasions.
n South Carater
me upstream
bromide. Tw
pled by a S
led that bro
ut there wer
rolina and a
m monitoring
welve differ
outh Carolin
omide levels
re a few inst
a downstrea
g locations
rent monito
na state age
s were typic
tances in 20
m surface w
in the water
oring station
ency. Monit
cally <0.2 m
002 where re
10
water
rshed
ns are
toring
mg/L,
esults

EE&T, INC.
11
Figure 5 shows bromide levels at the finished water tap (blue line) and in the source
water reservoir (red line) from 8/1/2008 to 9/13/2013. For the most part the bromide level from
August 2008 to August 2010 stays around 0.1 mg/L and only exceeded 0.15 mg/L on a couple of
days during this period. After August 2010 the bromide concentrations rise and peak around 0.35
mg/L in December 2010. Another rise occurred in October 2011, this time with peaks at 0.45 and
0.55 mg/L in March and June 2012, respectively. The increased bromide in the plant’s source
water appears to occur shortly after the wet scrubber installation at the power plant in 2009.
Figure 6 shows concentrations (µg/L) of three specific DBPs, bromoform (blue),
bromodichloromethane (red), and bromochloroacetic acid (green) analyzed from the WTPs
finished water tap from 8/1/2008 to 9/13/2013 (note DBP formation would be even greater at in
distribution system due to longer reaction time for DBP formation). The constituent impacted
most during this period was bromoform. From August 2008 to June 2010 bromoform had a
concentration around 1 µg/L but clearly increases by a factor of 10 to 20, reaching levels of 17 to
25 µg/L Bromodichloromethane had peaks at 13 and 15 µg/L in June 2009 and August 2009.
After that, the concentrations stayed below 5 µg/L until early 2013 when concentrations began to
increase again to 10 µg/L. Bromochloroacetic acid concentrations remained consistently below
10 µg/L except for one spike at 40 µg/L on March 2013. Many other water treatment plants in
South Carolina made similar observations, however they declined to provide these data.
The water system evaluated whether drought/climate change could have caused the
increased bromide levels but drought was ruled out as a direct or indirect contributor to the
observed bromide and DBP results.

EE&T, IN
Figure 4
Figure
C.
4. Bromide 8/1/2008
5. Bromof(green) cTreatmen
levels fromto 9/13/2013
form (blue)concentrationt Plant
m the WTP3 at Hanaha
), Bromodions (µg/L)
P’s lab tap an Water T
ichloromethfrom 8/1/2
(blue) and reatment P
hane (red),2008 to 9/13
their reserPlant
, Bromoch3/2013 at H
rvoir (red)
hloroacetic Hanahan W
12
from
Acid Water

EE&T, INC.
13
SUMMARY
New requirements for increased SO2 removal at coal-fired power plants should increase
releases of bromide discharges drinking water sources. Because of the mercury content of some
coal sources used at US coal-fired power plants, and new requirements to improve mercury
removal, coal-fired power plants may increase the use of bromide to oxidize and remove
mercury in wet scrubber processes. However, adding the bromide to increase mercury removal
will further increase bromide releases in wastewater discharges from these facilities. This can
have substantial impacts on the amount and type of DBPs produced during drinking water
treatment at downstream facilities, particularly the increased production of brominated DBPs.
These brominated DBPs have potential for greater health effects for drinking water consumers
and may cause drinking water facilities currently in compliance with DBP requirements to be out
of compliance if a greater proportion of the DBPs present are brominated.
Removing the bromide at the drinking water plant is not economically sound. Water
systems are left without options to reduce DBPs and comply with USEPA drinking water
regulations, absent installing combinations of drinking water treatment unit operations (e.g.,
reverse osmosis (RO), granular activated carbon in combination with split-stream RO, etc.).
Installing such advanced treatment will dramatically increase treatment costs and water rates in
the communities served, as well as potentially creating other unintended consequences (e.g.,
disposal of membrane residuals, disposal or regeneration of spent carbon, disposal of anionic
exchange regeneration brine wastes, etc.). Removing bromide at the discharge source is less
expensive and more proactive than to remove diluted bromide at multiple downstream water
treatment facilities. It is also more equitable for the discharger to remove the bromide rather than
forcing downstream water users to have to address this precursor to cancer causing contaminants.
REFERENCES
AWWA 2004. Formal Comments of the American Water Works Association on the Stage 2 Disinfectants and Disinfection By-Products Proposed Rule, Water Docket OW-2002-0043. Washington, DC: AWWA.
Blythe, G.; Richardson, C.; Rhudy, R. 2002. Pilot Evaluation of the Catalytic Oxidation of Mercury for enhanced Removal in Wet FGD Systems. In Proceedings of Air Quality III: Mercury, Trace Elements and Particulate Matter Conference, Arlington, VA, September 9-12, 2002. Energy and Environmental Research Center, University of Dakota, Grand Fork, North Dakota, September 2002.

EE&T, INC.
14
Bustard, J.; Renninger, S.; Chang, R.; Miller, R.; Monroe, L.; Sjostrom, S. 2003. Results of Activated Carbon Injection for Mercury Control Upstream of COHPAC Fabric Filter. Presented at the A&WMA/EPA/DOE/EPRI Combined Power Plant Air Pollutant Control Mega Symposium, Washington, DC, May 19-22, 2003.
Chang, R. et al. 2008. Near and Long Term Options for Controlling Mercury Emissions from Power Plants. Proceedings of the Power Plant Air Pollutant Control “Mega” Symposium, Baltimore, MD, August 25-28, 2008.
Hopkins, D. 2013. Bromide – an unsuspected culprit assessing impacts on Stage 2 DBPR compliance. Presented at VA-AWWA/VWEA Joint Annual Meeting, September 8-12, 2013. Richmond, VA.
Jolley, R. 1975. Chlorine-containing organic constituents in chlorinated effluents. Jour WPCF. 47:3:601.
Kellie, S.; Cao, Y.; Duan, Y.; Li, L.; Chu, P.; Mehta, A.; Carty, R.; Riley, J.T.; Pan, W.P., 2005. Factors Affecting Mercury Speciation in a 100-MW Coal-Fired Boiler with Low-NOx Burners. Energy Fuels, 19:3:800-806.
Mcilvaine Company, 2012. Big Market for Chemicals to Capture Mercury. www.pollutionsolutions-online.com
Meij, R., 1999. Mass Balance Study…. presented at IEA Trace Element Workshop, University of Warwick.
Miller, C., T. Feeley, W. Aljoe, B. Lani, K. Schroeder, C. Kairies, A. McNemar, A. Jones, J. Murphy. 2006. Mercury Capture and Fate Using Wet FGD at Coal-Fired Power Plants. DOE/NETL Mercury and Wet FGD R&D. August 2006.
States, S., et al. 2013. Marcellus Shale drilling and brominated THMs in Pittsburgh, PA, drinking water. Jour AWWA. 105:8:E432-E448.
US Energy Information Administration. 2013. How Much Coal, Natural Gas, or Petroleum Is Used to Generate a Kilowatt-hour of Electricity? Web. <http://www.eia.gov/tools/faqs/faq.cfm?id=667&t=2>.
USEPA. 2006. Stage 2 Disinfectants and Disinfection Byproducts Rule: National Primary and Secondary Drinking Water Regulations: Final Rule. Federal Register 71:2:388-493, January 4, 2006.
USEPA. 2011. Regulatory Impact Analysis for the Final Mercury and Air Toxics Standards (EPA-452/R-11-011). Washington, DC: USEPA.
USEPA. 2012. National Emissions Standards for Hazardous Air Pollutants from Coal- and Oil-fired Electrical Generating Units (40 CFR 60 and 63). Federal Register. 77:32:9304-9513.
White, G. 1986. Handbook of Chlorination, 2nd ed., New York: Van Nostrand Reinhold.

Appendix C AWWA / NAWC opening brief filed December 5, 2016
(Southwestern Electric Power Co., et al. v. EPA, No. 15-60821).

15-60821
IN THE
UNITED STATES COURT OF APPEALSFOR THE FIFTH CIRCUIT
SOUTHWESTERN ELECTRIC POWER COMPANY; UTILITY WATER ACT GROUP; UNION
ELECTRIC COMPANY, doing business as Ameren Missouri; WATERKEEPER
ALLIANCE, INCORPORATED; ENVIRONMENTAL INTEGRITY PROJECT; SIERRA CLUB;AMERICAN WATER WORKS ASSOCIATION; NATIONAL ASSOCIATION OF WATER
COMPANIES; CITY OF SPRINGFIELD, MISSOURI, by and through the Board of PublicUtilities; DUKE ENERGY INDIANA, INCORPORATED,
Petitioners,
V.
UNITED STATES ENVIRONMENTAL PROTECTION AGENCY; GINA MCCARTHY, inher official capacity as Administrator of the United States EnvironmentalProtection Agency,
Respondents.
On Petition for Review from Final Rule of theUnited States Environmental Protection Agency
OPENING BRIEF OF PETITIONERS AMERICAN WATER WORKSASSOCIATION AND NATIONAL ASSOCIATION OF WATER COMPANIES
JOHN A. SHEEHAN
CLARK HILL PLC601 Pennsylvania Avenue, Suite 1000Washington, D.C. 20004(202) 572-8665Counsel for Petitioners American Water Works Associationand National Association of Water Companies
Case: 15-60821 Document: 00513784433 Page: 1 Date Filed: 12/05/2016

ii
CERTIFICATE OF INTERESTED PERSONS
Case No.15-60821 – Southwestern Electric Power Co., et al. v. United StatesEnvironmental Protection Agency
The undersigned counsel of record certifies that the following listed persons
and entities as described in the fourth sentence of Rule 28.2.1 have an interest in
the outcome of this case. These representations are made in order that the judges of
this Court may evaluate possible disqualification or recusal.
Utility Water Act Group, (“UWAG”), an energy utility industry associationPetitioner/Intervenor
Southwestern Electric Power Company (“SWEPCO”),Petitioner
Union Electric Company (d/b/a Ameren Missouri) (“Ameren”),Petitioner
Kristy A.N. Bulleit and Harry M. Johnson, III,Counsel for UWAG, SWEPCO, and Ameren
City of Springfield, Missouri, by and through its Board of Public Utilities (“CityUtilities”),Petitioner
Thomas J. Grever,Counsel for City Utilities
Duke Energy Indiana, Inc.,Petitioner
Sean M. Sullivan,Counsel for Duke Energy Indiana, Inc.
Clean Water Action,Intervenor
Case: 15-60821 Document: 00513784433 Page: 2 Date Filed: 12/05/2016
iii
Environmental Integrity Project,Petitioner/Intervenor
Sierra Club,Petitioner/Intervenor
Waterkeeper Alliance, Inc.,Petitioner/Intervenor
Thomas J. Cmar, Matthew Gerhart, and Joshua SmithCounsel for Clean Water Action, Environmental Integrity Project,Waterkeeper Alliance, Inc., and Sierra Club
Casey A. Roberts,Counsel for Sierra Club
American Water Works Association,Petitioner
National Association of Water Companies,Petitioner
John A. Sheehan,Counsel for American Water Works Association and National Association ofWater Companies
/s/ John A. SheehanJohn A. SheehanAttorney of record for AmericanWater Works Association andNational Association of WaterCompanies
Case: 15-60821 Document: 00513784433 Page: 3 Date Filed: 12/05/2016

iv
STATEMENT REGARDING ORAL ARGUMENT
Pursuant to Federal Rule of Appellate Procedure 34(a)(1) and Circuit Rule 28.2.3,
Petitioners American Water Works Association and National Association of Water
Companies, respectfully request oral argument and suggest that oral argument would be
beneficial to the Court to better understand the technical issues involved and allow
counsel to further explain the record in the case and how it supports Petitioners
contentions.
Case: 15-60821 Document: 00513784433 Page: 4 Date Filed: 12/05/2016
v
TABLE OF CONTENTS
CERTIFICATE OF INTERESTED PERSONS............................................................ ii
STATEMENT REGARDING ORAL ARGUMENT ................................................. iv
TABLE OF CONTENTS................................................................................................. v
TABLE OF AUTHORITIES......................................................................................... vii
JURISDICTIONAL STATEMENT............................................................................... 1
INTRODUCTION............................................................................................................ 1
STATEMENT OF THE ISSUES.................................................................................... 3
STATEMENT OF THE CASE....................................................................................... 4
The Threat to Public Health and Water Quality from Bromide Discharges ........ 4A.
Recent Changes Required by Clean Air Act Programs Have Led to1.Increased Bromide Discharges to Surface Waters ........................................ 4
The Formation of Carcinogenic Disinfection By-Products (DBPs).….52.
The Impact of Bromide on Drinking Water Treatment ......................................... 8B.
Substantial Additional Costs Are Imposed on Drinking Water UtilitiesC.Because of the Lack of Required Controls on Bromide Discharges……….… 10
An Appropriate Technology Basis Exists for the Limitation and ControlD.of Bromide Discharges........................................................................................... 11
SUMMARY OF THE ARGUMENT........................................................................... 12
STATUTORY BACKGROUND ................................................................................. 13
STANDARD OF REVIEW........................................................................................... 16
Case: 15-60821 Document: 00513784433 Page: 5 Date Filed: 12/05/2016
vi
ARGUMENT.................................................................................................................. 17
I. EPA Acted Arbitrarily by Failing to Require Technology Based Limits forthe Control of Bromide when a Sufficient Technology Basis Existed…..….17
II. EPA Arbitrarily Refused to Require Permitting Authorities to Impose WaterQuality Based Bromide Limitations for Steam Electric Power Plant NPDESpermits…………………………………………………………………… 21
III. The Rulemaking Should Be Remanded to EPA Without Vacatur forFurther Study and Analysis of the Impact of Bromide Discharges…………22
CONCLUSION AND PRAYER FOR RELIEF.......................................................... 24
CERTIFICATE OF SERVICE...................................................................................... 26
CERTIFICATE OF COMPLIANCE............................................................................ 27
Case: 15-60821 Document: 00513784433 Page: 6 Date Filed: 12/05/2016

vii
TABLE OF AUTHORITIES
Cases
Am. Petroleum Inst. v. EPA, 787 F.2d 965 (5th Cir. 1986) .....................................16
American Petroleum Inst. v. EPA, 661 F.2d 340 (5th Cir. 1981) ............................ 14, 17
Chem. Mfrs. Ass'n v. EPA, 870 F.2d 177 (5th Cir. 1989)........................................15
Citizens to Preserve Overton Park v. Volpe, 401 U.S. 402 (1971)................................17
Defenders of Wildlife v. Jewell, 68 F. Supp. 3d 193 (D.C. Cir. 2014)...........................19
E.I. du Pont de Nemours & Co. v. Train, 430 U.S. 112, 97 S. Ct. 965, 976-77, 51L. Ed. 2d 204 (1977).............................................................................................14
Gulf Restoration Network v. McCarthy, 783 F.3d 227 (5th Cir. 2015).................... 17, 18
Massachusetts, et al. v. EPA, 549 U.S. 497 (2007) ......................................................22
Motor Vehicle Mfrs. Ass’n v. State Farm Mut. Auto. Ins. Co., 463 U.S. 29, 103 S. Ct.2856, 77 L. Ed. 2d 443 (1983) ................................................................................17
Nat’l Lime Ass’n v. EPA, 233 f.3D 625 (D.C. Cir. 2000), as amended on denial of reh’g(Feb. 14, 2001).......................................................................................................24
Natural Resources Defense Council v. EPA, 863 F.2d 1420 (9th Cir. 1988) .........15
Oregon Natural Resources Council v. Daley, 6 F. Supp. 2d 1139 (D. Or. 1998) ..........19
Tex. Oil & Gas Ass’n v. E.P.A., 161 F.3d 923 (5th Cir. 1998)......................................17
Statutes
5 U.S.C. § 706(2), Administrative Procedure Act,.......................................................16
33 U.S.C. § 1251(a) .................................................................................................13
33 U.S.C. § 1251(a)(1).............................................................................................13
Case: 15-60821 Document: 00513784433 Page: 7 Date Filed: 12/05/2016

viii
33 U.S.C. § 1311........................................................................................................1
33 U.S.C. § 1311(a) .................................................................................................16
33 U.S.C. § 1311(b) .................................................................................................21
33 U.S.C. § 1311 (b)(1)............................................................................................14
33 U.S.C. § 1311(b)(2).............................................................................................15
33 U.S.C. § 1312........................................................................................................1
33 U.S.C. § 1314(b) .......................................................................................... 14, 18
33 U.S.C. § 1314(b)(2).............................................................................................15
33 U.S.C. § 1314(b)(2)(B) .......................................................................................15
33 U.S.C. § 1314(m) ................................................................................................14
33 U.S.C. § 1316........................................................................................................1
33 U.S.C. § 1316(b)(1)(A).......................................................................................14
33 U.S.C. § 1342(a)(1).............................................................................................16
33 U.S.C. § 1345........................................................................................................1
33 U.S.C. § 1362(11) ...............................................................................................14
33 U.S.C. § 1369(b)(1)(E)............................................................................................1
Clean Water Act § 509(b)(1) ........................................................................................1
Rules
Circuit Rule 28.2.3..................................................................................................... iv
Federal Rule of Appellate Procedure 34(a)(1) ............................................................. iv
Case: 15-60821 Document: 00513784433 Page: 8 Date Filed: 12/05/2016

ix
Regulations
40 C.F.R. § 141.64............................................................................................ 6, 8, 23
40 C.F.R. 122.44(d)(1)...............................................................................................22
78 Fed. Reg. 34,460 ............................................................................................ 11, 12
80 Fed. Reg. 67,838 .................................................................................................1, 2
80 Fed. Reg. 67,840 .......................................................................................... 4, 5, 18
80 Fed. Reg. 67,848-849 ............................................................................................11
80 Fed. Reg. 67,852 ...................................................................................... 12, 18, 19
80 Fed. Reg. 67,858-59..............................................................................................12
80 Fed. Reg. 67,886 ................................................................................ 10, 11, 21, 23
80 Fed. Reg. 67,887 ............................................................................................ 21, 22
Case: 15-60821 Document: 00513784433 Page: 9 Date Filed: 12/05/2016

1
JURISDICTIONAL STATEMENT
Petitioners the American Water Works Association (“AWWA”) and the National
Association of Water Companies (“NAWC”) seek review of certain provisions of the
United States Environmental Protection Agency’s (“EPA’s” or the “Agency’s”) final
rule promulgating Effluent Limitation Guidelines and Standards for the Steam Electric
Power Generating Point Source Category (the “Final Rule”) on November 3, 2015, at 80
Fed. Reg. 67,838. This Court has jurisdiction under section 509(b)(1)(E) of the Clean
Water Act, which provides that review of EPA’s actions in approving or promulgating
any effluent limitation or other limitation under 33 U.S.C. §§ 1311, 1312, 1316, 1345
may be had by any interested person in the Circuit Court of Appeals of the United States
for the Federal Judicial District in which the person resides or transacts business that is
directly affected by such action. 33 U.S.C. § 1369(b)(1)(E). A Consolidation Order was
issued by the United States Judicial Panel on Multidistrict Litigation on December 8,
2015, and randomly selected the United States Court of Appeal for the Fifth Circuit in
which to consolidate several petitions for review of this Final Rule.
INTRODUCTION
Congress passed the Clean Air Act and the Amendments of 1990 to significantly
reduce air pollutant emissions from a number of the largest sources of pollutants. One of
the largest sources of air pollutant emissions are steam electric power plants. The Act
and its amendments have been successful in greatly reducing the aggregate amount of
Case: 15-60821 Document: 00513784433 Page: 10 Date Filed: 12/05/2016

2
air emissions of many pollutants as those plants have been required by the Act to install
new air pollution control technologies to reduce harmful air emissions. A consequence
of this reduction in air emissions, however, has been the transfer of these pollutants to
wastewater which poses a significant public health concern when the wastewater is
discharged to surface waters.
Realizing the impact of the Clean Air Act amendments on surface waters, EPA
recognized the need to update the effluent limitations guidelines (“ELGs”) for the steam
electric power generating industry, enacted under the Clean Water Act and last revised
in 1982, to address the changes to wastewater discharges caused by the new air pollution
control technology. The final rule at issue in the case, “the Effluent Limitations
Guidelines and Standards for the Steam Electric Power Generating Point Source
Category,” 80 Fed. Reg. 67,838 (November 3, 2015), is EPA’s effort to address and
reduce the increased discharges of pollutants to surface waters.
While the final rule imposes new limits on a number of toxic metals and other
harmful pollutants discharged from plants, EPA also recognized that one effect of the
increased surface water discharges was increased levels of bromide in rivers used as
drinking water after new air pollution control technology was installed at upstream
steam electric power plants. EPA also recognized and acknowledged that with bromide
present in drinking water source waters, carcinogenic substances began forming that
Case: 15-60821 Document: 00513784433 Page: 11 Date Filed: 12/05/2016
3
created both a public health risk and also led to drinking water utilities experiencing
violations of Safe Drinking Water Act Maximum Contaminant Levels.
While the increased levels of bromide in surface waters may not have been
EPA’s primary focus in this rulemaking and while some of the science on this issue may
have been only recently developed, it was arbitrary and capricious for EPA not to
address the problem either by requiring the steam electric industry to meet discharge
limits consistent with technologies that exist and are effective at removing bromide from
the wastewater discharges at steam electric power plants or by considering other binding
alternatives. Instead, EPA suggested a “voluntary incentives program” that steam
electric power plants could chose to participate in and “recommended” that permitting
authorities “collaborate” with drinking water utilities in effort to address the problem.
EPA’s failure to require binding, enforceable controls to address this known
public health danger was arbitrary and the rulemaking should be remanded without
vacatur to the agency to fully consider more protective controls of bromide discharges.
STATEMENT OF THE ISSUES
Whether EPA acted arbitrarily by not requiring more stringent controls on steam
electric power plant discharges of bromide to surface waters when, as EPA fully
recognized, the discharges create a known cancer risk and a serious public health
concern, create exceedances of existing the Safe Drinking Water Act maximum
contaminant levels at downstream drinking water systems, and when a demonstrated
Case: 15-60821 Document: 00513784433 Page: 12 Date Filed: 12/05/2016

4
technology basis exists for controlling bromide in the waste stream from steam electric
power plants but was not selected by the agency.
STATEMENT OF THE CASE
A. The Threat to Public Health and Water Quality from Bromide Discharges
1. Recent Changes Required by Clean Air Act Programs have Led toIncreased Bromide Discharges to Surface Waters
While the electric power industry has made great strides in recent years in
reducing air pollutant emissions under Clean Air Act programs, many of the pollutants
reduced from coal and oil fired power plants are transferred to the wastewater as the
power plants employ technologies to reduce air pollution. 80 Fed. Reg. 67,840. Recent
studies have shown that steam electric power plants that have installed a particular
technology – flue gas desulphurization (FGD) technology – to control air emissions have
created increased levels of bromide discharges to surface waters. 80 Fed. Reg. 67,840;
Index.12566.E494.1 Many of the rivers and streams receiving the increased bromide
discharges are source waters for drinking water utilities. Index.12566.5,6;
Index.12566.E493,E494,E500.
1 The parties conferred about adopting a uniform method to refer to documents listed on theAdministrative Record Index, which was filed by EPA on July 8, 2016. The parties agreed thatthe most accurate and consistent way to refer to information in the Index was to refer to the “rownumber” on the left-hand side of the electronic version of the Record Index. Thus, the citation“Index.9667.1” refers to the Index, row 9667, page 1. Some of documents cited to by AWWAand NAWC are journal articles and the page numbers also contain letters. For example, afrequently cited article begins on page number E492, so the citation is: “Index.12566.E492.”
Case: 15-60821 Document: 00513784433 Page: 13 Date Filed: 12/05/2016

5
EPA acknowledged at the outset of the preamble to this rule that the increased
bromide concentrations in receiving streams formed as a result of increases bromide
discharges from steam electric power plants has created a threat to drinking water
supplies and to public health due to the creation of carcinogenic substances that are
formed as a result of the increased bromide discharges. 80 Fed. Reg. 67,840.
Specifically, the increased concentration of bromide results in an increase in
carcinogenic disinfection by-products (DBPs), particularly brominated DBPs, being
formed at downstream drinking water utilities.2 Index.12566.E494.
Index.6781.Exhibit.31. These DBPs cannot be removed by conventional water treatment
processes used at drinking water plants and advanced treatment technologies must be
installed for their removal.
2. The Formation of Carcinogenic Disinfection By-Products (DBPs)
DBPs are formed when natural organic matter and bromide combine with the
disinfectants used to meet the regulatory requirements at drinking water utilities. When
bromide concentrations in the source water increase, the DBP concentrations resulting
from the same concentration of disinfectant also increase. Index.12566.E493. The
relative concentrations of the resultant DBPs depend on many characteristics such as the
disinfectant used, temperature, pH and other water quality parameters, as well as the
2 Bromide is discharged in many of the waste streams from steam electric power plants and iscalculated to be in the range of 0.51-6.2 lb./day of bromide per megawatt (MW) of powerproduced that will be discharged into the receiving streams. Index.12566.E495.
Case: 15-60821 Document: 00513784433 Page: 14 Date Filed: 12/05/2016

6
relative concentration of natural organic matter and bromide, both DBP precursors.
Bromide combined with ozone creates bromate, a carcinogenic DBP that is regulated
under EPA’s National Primary Drinking Water Regulations (NPDWRs). 40 C.F.R. §
141.64. When bromide combines with chlorine, other regulated DBPs are also created,
such as trihalomethanes (THMs) and haloacetic acids (HAAs).3 Several other DBPs
that are not currently regulated are also created. Studies indicate that exposure to THMs
and other DBPs from chlorinated water is associated with human bladder cancer and can
affect reproductive and developmental processes and has other adverse health effects
after prolonged exposure. Index.9667.5; Index.12378.I-14 to I-17. Brominated THMs
are mutagenic and carcinogenic and are among the most prevalent DBPs in chlorinated
drinking water. Index.2752.1548-1549.
These THMs are regulated under EPA’s NPDWRs as a sum, with Total
Trihalomethanes (TTHMs) having a Maximum Contaminant Level (MCL) of 0.080
mg/L based on an annual average due to increased cancer risk and liver, kidney or
central nervous system problems from long-term exposure. Index.2801.3. EPA also
regulates five of the nine haloacetic acids (HAA5) with a MCL of 0.060 mg/L based on
an annual average due to increased cancer risk. 40 C.F.R. § 141.64. If bromide is
present in the source water, chlorine will react first with the bromide to produce free
bromine. This bromine then reacts with the organic DBP precursors to form brominated
3 Trihalomethanes (THMs) are a chemical group consisting of four compounds: chloroform,bromodichloromethane (BDCM), dibromochloromethane (DBCM); and bromoform.
Case: 15-60821 Document: 00513784433 Page: 15 Date Filed: 12/05/2016
7
DBPs. Free bromine in drinking water reacts more quickly with organic DBP
precursors than free chlorine. This preferential reaction with bromide is significant for
three reasons:
(1) Greater health risks are attributed to brominated DBPs than to chlorinated
DBPs. For example, on a molar basis, DBCM is about five times more potent a
carcinogen than chloroform. Index.12566.E492,493.
(2) The TTHM MCLs are mass-based (weight-based), not molar-based, i.e.,
comparable brominated DBPs weigh more than their chlorinated analogues
which may create DBP violations if more brominated DBPs are formed. For
example, the molecular weight for bromoform (CHBr3) is 112 grams/mole versus
58 grams/mole for chloroform (CHCl3). Thus, if bromine exchanges for chlorine
due to an increase in the bromide concentration in the source water, more of the
brominated DBPs that are heavier will be produced and create compliance
problems with the mass-based (weight-based) MCLs. This is important as a
water system in compliance with the TTHM MCLs that are mass-based, may no
longer be in compliance if bromide is added to the source water in amounts
sufficient to increase the amount of brominated DBPs produced.
Index.12566.E493.
(3) The formation of brominated DBPs increases as a result of the greater
reactivity of bromide, so more DBPs (on a molar basis) will be produced because
Case: 15-60821 Document: 00513784433 Page: 16 Date Filed: 12/05/2016

8
the increased reactivity of bromine will mean more oxidation of organics by
bromine, as well as bromine substitution reactions. Index.12566.E493.
B. The Impact of Bromide on Drinking Water Treatment
Bromide discharges from steam electric power plants create significant issues for
downstream water systems, including compliance problems with EPA’s NPDWRs for
DBPs. 40 C.F.R. § 141.64. There is clear evidence from community drinking water
systems in North Carolina, South Carolina and Pennsylvania that steam electric power
plant wastewater discharges are elevating bromide levels in surface waters.
Index.9667.1. For example, in a study of drinking water utilities identified as having
documented increases in brominated DBPs, one utility experienced increased bromide
levels in its source water and increased TTHM levels in 2008 after a wet scrubber was
installed to reduce air emissions at an upstream coal-fired power plant.
Index.12566.E500-501; Index.12567.1. This water treatment plant had a quarterly
TTHM sample well above the MCL (over 0.100 mg/L versus the MCL of 0.080 mg/L).
For this plant, TTHM levels generally doubled and placed the water utility close to being
out of compliance with the TTHM MCL.
After the wet scrubber was installed at the upstream power plant, the TTHMs not
only increased but the speciation changed (which trihalomethanes make up the total)
with the installation of the wet scrubber. Index.12566.E501. Before the wet scrubber
was installed in 2008, around 25% of the plant’s TTHMs consisted of brominated
Case: 15-60821 Document: 00513784433 Page: 17 Date Filed: 12/05/2016
9
compounds. After the installation of the scrubber at the power plant, greater than 80%
of the TTHMs consisted of the brominated compounds, creating a significant health
risks. Index.12566-E501-502.
At another water treatment plant in southwestern Pennsylvania, a study found the
following: “with a source water bromide concentration of 50 µg/L, approximately 62%
of the finished water THMs consisted of bromoform, dibromochloromethane (DBCM),
and bromodichloromethane (BDCM). Index.12831.E434. However, with a source
water bromide concentration of 150 µg/L, approximately eighty-three percent (83%) of
the finished water THMs consisted of the brominated species.” The study found a
statistically significant relationship between source water bromide concentrations and
the percentage of brominated THMs. Index.12831.E434-435.
This shift to brominated species of DBPs as shown in these examples will occur
at other water treatment plants located downstream of bromide discharges from steam
power plants, as an increase in the bromide concentration in source water for a water
treatment plant leads to a greater proportion of brominated THMs being formed.
Index.12831.E432. The downstream water treatment plants would then be responsible
the design, construction, and operation and maintenance of the additional treatment
necessary to comply with EPA’s NPDRWs for DBPs.
Case: 15-60821 Document: 00513784433 Page: 18 Date Filed: 12/05/2016

10
C. Substantial Additional Costs Are Imposed on Drinking Water UtilitiesBecause of the Lack of Required Controls on Bromide Discharges
In addition to the compliance problems being faced by public water utilities
because of the increased bromide discharges from upstream power plants, significant
additional costs are imposed on drinking water utilities that would not be incurred if
EPA had imposed limits based on available controls on power plants to control their
wastewater discharges. Index.9667.1 and 13.; Index.12579.2 The national cost of DBP
mitigation associated with bromide discharges from power plants is significant and
should have been taken into account in EPA’s assessment of the impacts and costs for
the final rule. Despite AWWA raising the issue of the significant cost to drinking water
systems in its comments on the proposed rule, EPA did not take the costs for DBP
mitigation for water treatment plants into account when developing the final rule.4
The total number of steam electric power plants that will eventually install FDG
technology has been estimated to increase substantially as more power plants,
particularly in the eastern United States, move toward the wet scrubber technology. A
National Energy Technology Lab Report contains a projected increase in U.S. coal-fired
wet FGD capacity. Index.9667.4. In the preamble to the rule, EPA notes that “the
record indicates that steam electric power plant FDG wastewater discharges occur near
4 AWWA raised the issue of the costs to drinking water utilities in the following instances: (1)“installing such advance treatment will dramatically increase treatment costs and water rates incommunities served,” Index.9667.13; (2) “there will be a significant cost associated with thischange in water quality at the treatment plants,” Index.12579.1; (3) “removing the bromide at thedrinking water plant is not economically sound,” Index.9667.13. Clean Water Action alsoaddressed the issue of EPA’s failure to quantify the costs of the rule. Index.6781.Exhibit.31.
Case: 15-60821 Document: 00513784433 Page: 19 Date Filed: 12/05/2016

11
more than 100 public drinking water intakes on rivers and other water bodies…” 80 Fed.
Reg 67,886. Thus, the number of water treatment plants experiencing DBP related
compliance problems will increase significantly due to addressing DBPs in the water
supply.
D. An Appropriate Technology Basis Exists for the Limitation and Controlof Bromide Discharges
EPA evaluated six regulatory options in the final rule to control the increased
discharges of pollutants from FGD wastewater from new air control technology. 80
Fed. Reg. 67,848. Index.12840.8.3. The regulatory options are contained in Table VIII-
1. 80 Fed. Reg 67,848-49. When viewing the table, the treatment requirements become
increasingly stringent for steam power plant discharges as the regulatory option moves
from A through F. The most stringent treatment option in the proposal, option F, is for
evaporation for the flue gas desulfurization (FGD) which would eliminate discharges of
bromide to surface waters and would consequently eliminate the potential impacts to
downstream water treatment plants.
Throughout the evaluation of the available technology options in the proposed
rule stage, EPA recognized the lack of bromide removal by the treatment technologies
used in the other regulatory options. Addressing FDG wastewater, EPA recognized that
“physical/chemical treatment is not effective for removing certain metals that contribute
to the high concentration of TDS in FGD wastewater (e.g., bromides, boron).” 78 Fed.
Reg. 34,460. When physical/chemical treatment was combined with biological
Case: 15-60821 Document: 00513784433 Page: 20 Date Filed: 12/05/2016
12
treatment, EPA recognized that “these technologies have not been effective at removing
substantial amounts of boron and pollutants such as sodium and bromides that contribute
to high concentrations of TDS.” 78 Fed Reg. 34,460.
In the final rule evaluation of options, EPA found that vapor-compression
evaporation was effective in removing recalcitrant pollutants (e.g., boron, sodium,
bromides, etc.). This option would have alleviated the impacts on downstream water
plants and addressed the bromide problem at its source while putting the costs for
addressing the problem on the power utilities instead of the water utilities. EPA rejected
this option, however, citing high costs as the reason:
[W]hile evaporation systems are effective at removing boron andpollutants that contribute to high concentrations of TDS, EPAdecided it would not be appropriate to identify evaporation as theBAT technology basis for FDG wastewater at all steam electricpower plants because of the high costs of possible regulatoryrequirements based on evaporation for discharges of FGDwastewater at existing facilities. 80 Fed. Reg. 67,852.
Instead, EPA, called for a “voluntary incentives program” thus prioritizing costs
over public health.5 80 Fed. Reg. 67,852, 858-59.
SUMMARY OF THE ARGUMENT
EPA acted arbitrarily by not requiring more stringent controls on steam electric
power plant discharges to reduce the known cancer risk and address the compliance
problems created for downstream drinking water systems caused by the discharge of
5 EPA estimated that the annual costs for the electric power industry would be $570 million. Bynot selecting the available evaporation technology as part of the chosen regulatory option, EPAis essentially passing the cost on to the public water utilities.
Case: 15-60821 Document: 00513784433 Page: 21 Date Filed: 12/05/2016

13
bromide when an appropriate and effective technology basis existed for controlling
bromide in the waste stream. It was arbitrary for EPA not to exercise its responsibility
for establishing effluent guidelines by requiring effluent limits based on available
technology to protect the public from unacceptable risks to the drinking water supply
and instead merely suggest voluntary measures may be adopted. As a result, EPA’s
decision imposes compliance difficulties and additional costs on downstream water
treatment plants instead of on the upstream power plants responsible for the pollution.
Accordingly, the Court should remand the issue of requiring control of harmful bromide
discharges to the agency without vacating the current rule to fully consider more
protective requirements.
STATUTORY BACKGROUND
Congress enacted the Clean Water Act (CWA) in 1972 "to restore and
maintain the chemical, physical, and biological integrity of the Nation's waters." 33
U.S.C. § 1251(a). As part of this mission, the Act declared a national goal that the
discharge of pollutants into the navigable waters be eliminated by 1985. 33 U.S.C.
§ 1251(a)(1). It was designed to achieve this goal through a system of effluent
limitations guidelines ("ELGs") and National Pollutant Discharge Elimination
System ("NPDES") permits that set technology-based discharge limits for all
categories and subcategories of water pollution point sources. The CWA requires
Case: 15-60821 Document: 00513784433 Page: 22 Date Filed: 12/05/2016
14
the EPA to identify and categorize all point sources warranting effluent guidelines.
33 U.S.C. §§ 1314(m), 1316(b)(1)(A).
ELGs are the rulemaking device prescribed by the CWA to set national
effluent limitations for categories and subcategories of point sources. 33 U.S.C. §
1314(b). An "effluent limitation" is "any restriction established by a State or the
Administrator on quantities, rates, and concentrations of chemical, physical,
biological, and other constituents which are discharged from point sources into
navigable waters, the waters of the contiguous zone, or the ocean, including
schedules of compliance." 33 U.S.C. § 1362(11). These limitations are
technology-based rather than harm-based; that is, they reflect the capabilities of
available pollution control technologies to prevent or limit different discharges
rather than the impact that those discharges have on the waters. See generally E.I.
du Pont de Nemours & Co. v. Train, 430 U.S. 112, 130-31, 97 S. Ct. 965, 976-77,
51 L. Ed. 2d 204 (1977); Am. Petroleum Inst., 661 F.2d 340, 343-44 (5th Cir.
1981). The CWA prescribes progressively more stringent technological standards
that the EPA must use as a guidepost in setting discharge limits for regulated
pollutants. 33 U.S.C. § 1311 (b)(1).
Under this scheme, since March 31, 1989, a majority of ELGs have been
required to represent the "best available technology economically achievable"
("BAT"). 33 U.S.C. §§ 1311(b)(2), 1314(b)(2). In other words, in promulgating
Case: 15-60821 Document: 00513784433 Page: 23 Date Filed: 12/05/2016

15
ELGs the EPA must set discharge limits that reflect the amount of pollutant that
would be discharged by a point source employing the best available technology
that the EPA determines to be economically feasible across the category or
subcategory as a whole. BAT is the CWA's most stringent standard. "Congress
intended these limitations to be based on the performance of the single best-
performing plant in an industrial field." Chem. Mfrs. Ass'n v. EPA, 870 F.2d 177,
226 (5th Cir. 1989).
The CWA specifies several factors that must be considered by the EPA in
determining BAT limits: factors relating to the assessment of best available
technology shall take into account the age of equipment and facilities involved, the
process employed, the engineering aspects of the application of various types of
control techniques, process changes, the cost of achieving such effluent reduction,
non-water quality environmental impact (including energy requirements), and such
other factors as the Administrator deems appropriate . . . . 33 U.S.C. §
1314(b)(2)(B). The EPA nonetheless has discretion in evaluating the relevant
factors and determining the weight to be accorded to each in reaching its ultimate
BAT determination. See Natural Resources Defense Council v. EPA, 863 F.2d
1420, 1426 (9th Cir. 1988).
While an important component of the CWA framework, ELGs are not self-
executing. They cannot be enforced against individual dischargers, and individual
Case: 15-60821 Document: 00513784433 Page: 24 Date Filed: 12/05/2016

16
dischargers are under no legal obligation to obey the limits set by ELGs. NPDES
permits, issued by EPA or an authorized state, are the CWA's implementation
mechanism; they are the instrument by which ELGs are made binding on
individual dischargers. The CWA makes it unlawful to discharge any pollutant
from any point source without an NPDES permit. 33 U.S.C. § 1311(a); Am.
Petroleum Inst. v. EPA, 787 F.2d 965, 969 (5th Cir. 1986). These permits must
generally incorporate, as a technology-based floor, all applicable ELGs
promulgated by the EPA for the pertinent point source category or subcategory. 33
U.S.C. § 1342(a)(1).
STANDARD OF REVIEW
The Court’s review is governed the Administrative Procedure Act, 5 U.S.C. §
706(2), in which a Court will hold unlawful and set aside agency actions, findings and
conclusions found to be arbitrary, capricious, an abuse of discretion or otherwise not in
accordance with law. 5 U.S.C. § 706(2). The Fifth Circuit has held that an agency’s
rulemaking is arbitrary and capricious “if the agency has relied on factors which
Congress has not intended it to consider, entirely failed to consider an important aspect
of the problem, offered an explanation for its decision that runs counter to the evidence
before the agency, or is so implausible that it could not be ascribed to a difference in
view or the product of agency expertise.” Tex. Oil & Gas Ass’n v. E.P.A., 161 F.3d 923,
933 (5th Cir. 1998) (quoting Motor Vehicle Mfrs. Ass’n v. State Farm Mut. Auto. Ins.
Case: 15-60821 Document: 00513784433 Page: 25 Date Filed: 12/05/2016
17
Co., 463 U.S. 29, 43, 103 S. Ct. 2856, 77 L. Ed. 2d 443 (1983)). If the agency’s reasons
and policy choices conform to minimal standards of rationality, then its actions are
reasonable and must be upheld.” Tex. Oil & Gas Ass’n, 161 F.3d at 934. Nonetheless,
the reviewing court “may not supply a reasoned basis for the agency’s action that the
agency itself has not given.” Motor Vehicle Mfrs. Ass’n, 463 U.S. at 43. Although the
EPA’s decision is entitled to a presumption of regularity, that presumption should not
shield the agency’s action from a “thorough, probing, in-depth review.” American
Petroleum Inst. v. EPA, 661 F.2d 340, 348 (5th Cir. 1981) (quoting Citizens to Preserve
Overton Park v. Volpe, 401 U.S. 402, 415 (1971). In assessing an agency’s decision, a
court must consider “whether the decision was based on a consideration of the relevant
factors and whether there has been a clear error of judgment.” Id.
ARGUMENT
I. EPA Acted Arbitrarily by Failing to Require Technology Based Limits forthe Control of Bromide when a Sufficient Technology Basis Existed
The Clean Water Act establishes a statutory scheme to protect and improve the
quality of the country’s waters. Gulf Restoration Network v. McCarthy, 783 F.3d 227,
229 (5th Cir. 2015). The effluent limitations guidelines (“ELG’s”) approach was
designed to protect the public health by setting national effluent limitations which
restrict the discharge of harmful pollutants. 33 U.S.C. § 1314(b).
Case: 15-60821 Document: 00513784433 Page: 26 Date Filed: 12/05/2016
18
At the very outset of the preamble to this rulemaking, EPA clearly recognized a
problem existed. Recent studies had documented the formation of carcinogenic
disinfection by-products at drinking water utilities downstream of power plants where
FGD wastewater was discharged. 80 Fed. Reg. 67,840; Index.12566.E500-E502. One
recent study had analyzed four drinking water systems downstream from power plants
using FDG systems and found that bromide was present in the drinking water source
waters and carcinogenic by-products had begun forming. 80 Fed. Reg. 67,840;
Index.12566.E500-E502.
Even though this problem had only recently been documented, EPA had before it
a sufficient technology option to control or eliminate bromide discharges from steam
electric power plants. EPA reviewed and considered an available technology – option F,
evaporation – that would substantially control or eliminate bromide discharges.
However, the Agency did not select this technology option in the final rule, citing the
costs to the electric industry:
[W]hile evaporation systems are effective at removing boron andpollutants that contribute to high concentrations of TDS, EPA decidedit would not be appropriate to identify evaporation as the BATtechnology basis for FDG wastewater at all steam electric powerplants because of the high costs of possible regulatory requirementsbased on evaporation for discharges of FGD wastewater at existingfacilities. 80 Fed. Reg. 67,852.
While generally EPA has the discretion to consider costs when deciding which
control technology to select to address a pollution control problem, it was arbitrary and
Case: 15-60821 Document: 00513784433 Page: 27 Date Filed: 12/05/2016
19
capricious for EPA to use costs as a reason for wholly failing to address a serious public
health threat that the agency has recognized, as it did here. It was arbitrary and
capricious for the agency to ignore a significant public health risk posed by carcinogenic
disinfection by-products and subject water users to unacceptable health risks, and instead
call for a “voluntary incentives program.” 80 Fed. Reg. 67,852; Index.12840, section 8-
12. That effectively is an abdication of the agency’s authority to act in the public interest
to protect the public health. There is no certainty that a voluntary program will be
implemented and, consequently, EPA failed to address this problem and failed to protect
the public water supply.6
Federal courts have held that if an agency has a non-discretionary duty to
implement a law and relies on future or voluntary efforts to implement that law, that
reliance is speculative and uncertain, and thus arbitrary and capricious. Defenders of
Wildlife v. Jewell, 68 F. Supp. 3d 193, 209-10 (D.C. Cir. 2014); see also Oregon Natural
Resources Council v. Daley, 6 F. Supp. 2d 1139, 1154-59 (D. Or. 1998) (National
Maritime Fisheries Service delisting a species as threatened under the Endangered
Species Act was arbitrary and capricious because the future voluntary measures
considered in making the decision were speculative). While in the present case EPA is
not carrying out a non-discretionary duty, the same reasoning should apply because the
6 Petitioners recognize that there are certainly situations when voluntary controls with incentivesby federal or state agencies are a reasonable and appropriate means of reducing pollution andbringing regulated entities into compliance. Here, however, where a public health risk is at stakeand the cost implications to the water utilities are substantial, voluntary measures are notappropriate.
Case: 15-60821 Document: 00513784433 Page: 28 Date Filed: 12/05/2016

20
agency is acting to protect public health from an identified threat. The standard should
be no less rigorous and the reliance on unenforceable voluntary measures to protect the
public was arbitrary and capricious.
Moreover, by failing to address and control bromide discharges from steam
electric power plants, EPA impermissibly shifted the costs and the responsibility for
addressing the pollution problems to downstream water treatment plants.7 Downstream
water treatment plants will now be forced to make their customers pay for the additional
capital costs and the operations and maintenance costs for additional treatment to
address the threat to the drinking water supply. Appropriate pollution controls should be
used at the source of the problem and paid for by the companies that produce and
discharge bromide, and not sent downstream to be addressed and paid for by
downstream communities.
In short, EPA’s decision not to require effluent limits for steam electric power
plants based on evaporation technology to control bromide discharges, either in
combination with other control options or by itself, was arbitrary and capricious and
should be set aside.
7 Further demonstrating the arbitrariness of its decision regarding the proper control technology,EPA not only failed to require the cost be borne by the source of the problem – the steam electricpower utilities – it failed to review and assess the cost imposed on the drinking water utilities forthe design, construction, operation and maintenance of the additional treatment necessary toaddress the bromide discharge problem.
Case: 15-60821 Document: 00513784433 Page: 29 Date Filed: 12/05/2016
21
II. EPA Arbitrarily Refused to Require Permitting Authorities to Impose WaterQuality Based Bromide Limitations for Steam Electric Power Plant NPDESpermits.
Similar to EPA’s arbitrary decision to reject the selection of an effective control
technology for bromide discharges and instead suggest a voluntary incentives program
in its place, EPA also cast aside an approach to impose a requirement on permitting
authorities to establish water quality based effluent limitations on bromide and, this time,
stated that “it may be appropriate for permitting authorities to establish water quality
based effluent limitations on bromide.” 80 Fed. Reg. 67,886. Here, again, even while
recognizing the significant threat to the drinking water supply posed by increased
bromide discharges, EPA, instead of using its authority to address the problem straight
on, “recommends” that permitting authorities “collaborate” with drinking water utilities
to address the problem. 80 Fed. Reg. 67,887. This decision is similarly arbitrary
because in the face of a significant threat to the drinking water supply, EPA chose not to
impose requirements to address the threat and instead recommended collaboration.
Water-quality based effluent limitations are necessary when the technology basis
is insufficient to meet the applicable water quality standards. 33 U.S.C. § 1311(b).
Water-quality-based effluent limitations are based upon the impact that a discharge has
on its receiving waters. The water quality standards established for a particular
waterbody serve as the basis for imposing water quality based treatment controls in
NPDES permits beyond the technology based levels of treatment required by CWA
Case: 15-60821 Document: 00513784433 Page: 30 Date Filed: 12/05/2016

22
301(b). The CWA requires that all NPDES permits include limitations as necessary to
comply with water quality standards developed by the states.
EPA recognized in its analysis of whether water quality based effluent limitations
were necessary that its regulations require that limitations must control all pollutants or
pollutant parameters (either conventional, nonconventional or toxic) which “the Director
determines are or may be discharged at a level which will cause, have the reasonable
potential to cause, or contribute to an excursion above any state water quality standard,
including state narrative criteria for water quality.” 80 Fed. Reg. 67,887; 40 C.F.R.
122.44(d)(1). Recognizing that the presence of bromide in drinking water can result in
excursions and exceedances of drinking water MCLs, EPA should have taken the
appropriate next step to make it a requirement for NPDES permitting authorities to
impose water quality based effluent limitations on point sources discharges of bromides.
It was arbitrary and capricious for the agency to fail to do so.
III. The Rulemaking Should Be Remanded to EPA Without Vacatur forFurther Study and Analysis of the Impact of Bromide Discharges
“Scientific uncertainly does not allow EPA to avoid responsibility for regulating
discharges,” Massachusetts, et al. v. EPA, 549 U.S. 497, 534 (2007).
EPA clearly recognized in this lengthy rulemaking process that bromide
discharges leading to the formation of DBPs pose a threat to public health.8 80 Fed.
8 EPA’s NPDWRs for DBPs have been developed through a rigorous scientific process thattakes into account the inherent uncertainties in the underlying health effects studies. 40 C.F.R. §141.64.
Case: 15-60821 Document: 00513784433 Page: 31 Date Filed: 12/05/2016

23
Reg. 67,886 (“Studies indicate that exposure to THMs and other DBPs from chlorinated
water is associated with human bladder cancer”). While the rulemaking took place over
a number of years, some of the more significant studies and research regarding bromide
came in the later stages of the rulemaking. The larger focus of the rulemaking was
concentrated on controlling other pollutants and evaluating technology options to control
those pollutants. Nevertheless, EPA had enough information to select a regulatory
option to control bromide at its source – the steam electric power plant discharge point.
Additionally, this rulemaking only addresses mercury removal as a bromide
source that could adversely impact water treatment plants. Other sources of bromide,
such as natural bromide in the coal, bromides used in solutions sprayed on coal and
bromide in algaecides used to control biogrowth in cooling towers, should have been
considered by the agency. The cumulative impacts from bromide discharges should be
taken into account in developing regulatory requirements for permitting authorities to
establish water quality based effluent limitations for steam power plants.
The Court should set aside EPA’s decision as it relates to the control of bromide
discharges and order the agency to reconsider the issue. The proper remedy here where
EPA has failed to adequately address one aspect of a rulemaking is to remand without
vacatur. When a Court invalidates an environmental regulation because it is under
protective, but vacating the regulation would result in less protection, then the Court
should leave the regulation in place on remand. See Nat’l Lime Ass’n v. EPA, 233 f.3D
Case: 15-60821 Document: 00513784433 Page: 32 Date Filed: 12/05/2016

24
625, 635 (D.C. Cir. 2000), as amended on denial of reh’g (Feb. 14, 2001) (leaving
invalidated regulations in place at petitioner’s request, because vacating them would
defeat petitioner’s purpose of protecting the environment). Here, the majority of the rule
puts important protections in place for waters that would otherwise be vulnerable.
Because vacating the rule could place these waters in jeopardy, the Court should allow
the rule to remain in effect during the remand.
CONCLUSION AND PRAYER FOR RELIEF
In light of EPA’s arbitrary decisions related to the control of bromide discharges
from steam electric power plants, the Court should remand the rulemaking to the agency
without vacating the current rule to fully consider more protective controls of bromide
discharges.
Dated: December 5, 2016 Respectfully submitted,
/s/ John A. SheehanJohn A. SheehanClark Hill, PLC601 Pennsylvania AvenueSuite 1000Washington, D.C. 20004Ph: [email protected]
Counsel for Petitioners American WaterWorks Association and NationalAssociation of Water Companies
Case: 15-60821 Document: 00513784433 Page: 33 Date Filed: 12/05/2016

25
CERTIFICATE OF SERVICE
I hereby certify that on December 5, 2016, I electronically filed the foregoing
Opening Brief of Petitioners American Water Works Association and National
Association of Water Companies with the Clerk of the Court using the CM/ECF system
which will send notification of this filing to the attorneys of record.
December 5, 2016 /s/ John A. SheehanJohn A. Sheehan
Case: 15-60821 Document: 00513784433 Page: 34 Date Filed: 12/05/2016

26
CERTIFICATE OF COMPLIANCE WITH WORD ANDFORMATTING REQUIREMENTS
I certify that the forgoing Opening Brief of Petitioners American Water Works
Association and the National Association of Water Companies, filed through the Court’s
ECF system, is an exact copy of the paper document, 5th Cir. R. 25.2.1, does not contain
any personal identifiers requiring redaction, 5th Cir. R. 25.2.13, and has been scanned for
viruses with the most recent version of a commercial virus scanning software and is free
of viruses.
I further certify that (1) this brief complies with the type-volume limitations of
Fed. R. App. P. 32(a)(7(B) and complies with the Court’s Order dated September 28,
2016 because it contains 5,730 words excluding the parts of the brief exempted by Fed.
R. App. P. 32(a)(7)(B)(iii); and (2) this brief complies with the typeface requirements of
Fed. R. App. P. 32(a)(5) and the type style requirements of Fed. R. App. P. 32(a)(6)
because it has been prepared in a proportionally spaced typeface using Microsoft Word
in Times New Roman 14-pt font.
December 5, 2016 /s/ John A. SheehanJohn A. Sheehan
Case: 15-60821 Document: 00513784433 Page: 35 Date Filed: 12/05/2016

27
Case: 15-60821 Document: 00513784433 Page: 36 Date Filed: 12/05/2016

Appendix D McTigue, N.E., D.A. Cornwell, K Graf, and R. Brown. November 2014. Occurrence and consequences of increased bromide in drinking water sources. Journal of the
American Water Works Association 106:11 E492-E508. http://dx.doi.org/10.5942/jawwa.2015.106.0141.
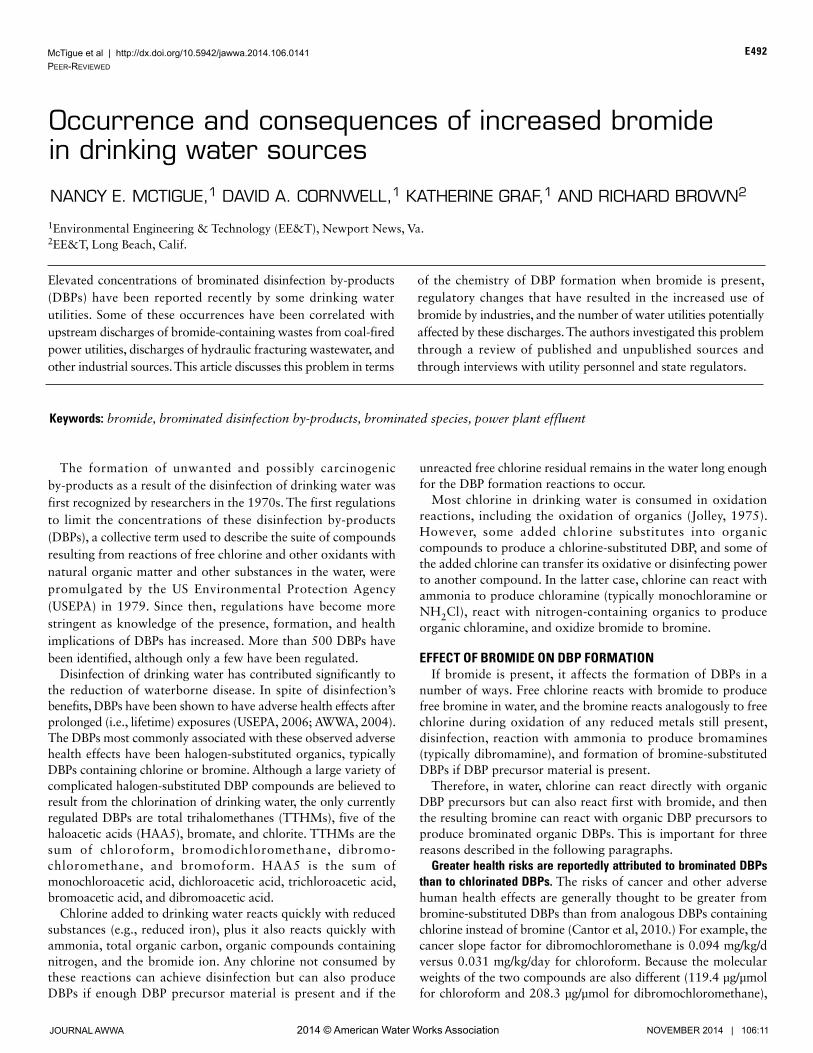
McTigue et al | http://dx.doi.org/10.5942/jawwa.2014.106.0141Peer-Reviewed
E492
2014 © American Water Works AssociationJOURNAL AWWA NOVEMBER 2014 | 106:11
The formation of unwanted and possibly carcinogenic by-products as a result of the disinfection of drinking water was first recognized by researchers in the 1970s. The first regulations to limit the concentrations of these disinfection by-products (DBPs), a collective term used to describe the suite of compounds resulting from reactions of free chlorine and other oxidants with natural organic matter and other substances in the water, were promulgated by the US Environmental Protection Agency (USEPA) in 1979. Since then, regulations have become more stringent as knowledge of the presence, formation, and health implications of DBPs has increased. More than 500 DBPs have been identified, although only a few have been regulated.
Disinfection of drinking water has contributed significantly to the reduction of waterborne disease. In spite of disinfection’s benefits, DBPs have been shown to have adverse health effects after prolonged (i.e., lifetime) exposures (USEPA, 2006; AWWA, 2004). The DBPs most commonly associated with these observed adverse health effects have been halogen-substituted organics, typically DBPs containing chlorine or bromine. Although a large variety of complicated halogen-substituted DBP compounds are believed to result from the chlorination of drinking water, the only currently regulated DBPs are total trihalomethanes (TTHMs), five of the haloacetic acids (HAA5), bromate, and chlorite. TTHMs are the sum of chloroform, bromodichloro methane, dibromo-chloromethane, and bromoform. HAA5 is the sum of monochloroacetic acid, dichloroacetic acid, trichloroacetic acid, bromoacetic acid, and dibromoacetic acid.
Chlorine added to drinking water reacts quickly with reduced substances (e.g., reduced iron), plus it also reacts quickly with ammonia, total organic carbon, organic compounds containing nitrogen, and the bromide ion. Any chlorine not consumed by these reactions can achieve disinfection but can also produce DBPs if enough DBP precursor material is present and if the
unreacted free chlorine residual remains in the water long enough for the DBP formation reactions to occur.
Most chlorine in drinking water is consumed in oxidation reactions, including the oxidation of organics (Jolley, 1975). However, some added chlorine substitutes into organic compounds to produce a chlorine-substituted DBP, and some of the added chlorine can transfer its oxidative or disinfecting power to another compound. In the latter case, chlorine can react with ammonia to produce chloramine (typically monochloramine or NH2Cl), react with nitrogen-containing organics to produce organic chloramine, and oxidize bromide to bromine.
EFFECT OF BROMIDE ON DBP FORMATIONIf bromide is present, it affects the formation of DBPs in a
number of ways. Free chlorine reacts with bromide to produce free bromine in water, and the bromine reacts analogously to free chlorine during oxidation of any reduced metals still present, disinfection, reaction with ammonia to produce bromamines (typically dibromamine), and formation of bromine-substituted DBPs if DBP precursor material is present.
Therefore, in water, chlorine can react directly with organic DBP precursors but can also react first with bromide, and then the resulting bromine can react with organic DBP precursors to produce brominated organic DBPs. This is important for three reasons described in the following paragraphs.
Greater health risks are reportedly attributed to brominated DBPs than to chlorinated DBPs. The risks of cancer and other adverse human health effects are generally thought to be greater from bromine-substituted DBPs than from analogous DBPs containing chlorine instead of bromine (Cantor et al, 2010.) For example, the cancer slope factor for dibromochloromethane is 0.094 mg/kg/d versus 0.031 mg/kg/day for chloroform. Because the molecular weights of the two compounds are also different (119.4 μg/μmol for chloroform and 208.3 μg/μmol for dibromochloromethane),
Elevated concentrations of brominated disinfection by-products (DBPs) have been reported recently by some drinking water utilities. Some of these occurrences have been correlated with upstream discharges of bromide-containing wastes from coal-fired power utilities, discharges of hydraulic fracturing wastewater, and other industrial sources. This article discusses this problem in terms
of the chemistry of DBP formation when bromide is present, regulatory changes that have resulted in the increased use of bromide by industries, and the number of water utilities potentially affected by these discharges. The authors investigated this problem through a review of published and unpublished sources and through interviews with utility personnel and state regulators.
Occurrence and consequences of increased bromide in drinking water sources
NANCY E. MCTIGUE,1 DAVID A. CORNWELL,1 KATHERINE GRAF,1 AND RICHARD BROWN2
1Environmental Engineering & Technology (EE&T), Newport News, Va.2EE&T, Long Beach, Calif.
Keywords: bromide, brominated disinfection by-products, brominated species, power plant effluent

McTigue et al | http://dx.doi.org/10.5942/jawwa.2014.106.0141Peer-Reviewed
E493
2014 © American Water Works AssociationJOURNAL AWWA NOVEMBER 2014 | 106:11
on a molar basis dibromochloromethane is about five times more potent a carcinogen than chloroform (OEHHA, 2009).
The regulatory limits for drinking water compliance are mass-based, not molar-based. Drinking water facilities are currently faced with two regulatory limits for halogen-substituted DBPs: TTHMs ≤ 80 µg/L and HAA5 ≤ 60 µg/L. The regulatory limit is simply based on taking the mass concentration of each compound, without correcting for molar weight, and adding each numerical value for the four or five compounds involved. Therefore, a water system with no bromide in the background source water will be in compliance with the TTHM limit if it has 60 µg/L of chloroform and no detectable brominated THMs. In this case, about 0.5 µmol/L TTHMs would be produced. However, if nothing else changes but enough bromide is added to produce bromo-dichloromethane instead of chloroform, then 0.5 µmol/L TTHM will produce ~ 82 µg/L TTHMs, which could create compliance difficulties. Therefore, a water system currently in compliance with DBP requirements may no longer be in compliance if bromide is added to the drinking water source in amounts sufficient to increase the amount of brominated DBPs produced.
The formation of brominated DBPs increases as a result of the greater reactivity of bromide. The preceding information suggests that the presence of bromide during chlorination can increase the numerical value of the regulatory compliance value, even if the same amount of organic precursor material is present and even if the same molar concentration of DBP is produced. However, because free bromine in drinking water reacts more quickly than free chlorine, more DBPs (on a molar basis) will be produced because the increased reactivity of bromine will mean more oxidation of organics by bromine, as well as bromine substitution reactions.
A number of factors determine the formation and ultimate composition of TTHMs—water quality parameters, residence time, amount of disinfectant, temperature, and type and amount of precursor material. At any given utility, the relative amount of each of the four THMs can vary during the year because of changes in these factors. Until recently, however, except in coastal locations where bromide can be introduced by saltwater influences, US utilities have generally seen more chlorinated than brominated species in the TTHMs in their distribution systems. TTHM data collected from 500 water plants under the Information Collection Rule (1997–1998) showed that, in general, chloroform dominated the other three species and was present at the highest mean concentration (McGuire et al, 2002). The mean concentrations of DBP species in all distribution system samples were 23.5 µg/L chloroform, 8.4 µg/L bromodichloro methane, 4.3 µg/L dibromochloromethane, and 1.4 µg/L bromoform.
BROMIDE OCCURRENCE IN SOURCE WATERBromide is a common element in seawater but rarely occurs
naturally at high concentrations in fresh surface water sources in the United States (Bowen, 1979). Bromide from seawater can influence drinking water sources either through intrusion or through connate seawater (seawater trapped in geological formations.) Typical seawater concentrations are about 65,000 µg/L, and some coastal drinking water supplies have elevated bromide concentrations as a result of seawater intrusion.
Although bromide in source water can come from seawater, it can also come from a number of anthropogenic sources. In the past, before leaded gasoline was banned in the United States, gasoline emissions were a contributing factor because leaded gasoline contained additives of brominated compounds. Road salt and some fertilizers can also contribute bromide to water sources. Recently, however, there have been reports of increased bromide in source water as a result of natural gas production with hydraulic fracturing, air pollution control methods in coal-fired power plants, and textile production.
Effluent from coal-fired power plants may contribute to bromide in source water because some plants must use wet scrubbers to produce clean air effluent. The scrubbers can introduce bromide into the waste stream, which is then discharged to a surface body of water. Another possible contributor is natural gas production. The development of this fuel requires a significant amount of water, and the wastewater produced typically contains high bromide concentrations. Although most unconventionally produced oil and natural gas wastewater is disposed of through deep underground injection, wastewater that is returned to surface water and processed through surface water treatment plants (WTPs) may contain substantially increased bromide concentrations caused by the increased brominated fraction. Another possible bromide source is textile mill processes that use brominated compounds to flameproof fabrics.
Although these sources have been studied to some extent, their full impact on the populations served by water utilities is not yet well understood because utilities are just beginning to see the effect of bromide on their DBPs. Some water utility personnel have recently noticed an increase in the brominated fraction of their DBPs. A number of utilities with no previous violations have experienced violations of DBP maximum contaminant levels (MCLs) as a result of this brominated fraction. Because bromide is unregulated and has no known health effects at concentrations normally found in source water, bromide has not historically been monitored in source water, except in research studies.
SOURCE WATER BROMIDE CONCENTRATIONS AND THEIR EFFECT ON DBP SPECIATION
As reported by Amy and colleagues in 1995, a source water bromide survey conducted with 100 utilities during an 18-month period showed that bromide concentrations at large and small randomly selected utilities ranged from < 5 to 429 µg/L. At targeted utilities where the researchers suspected that high concentrations of bromide existed, the average bromide concentration was 210 µg/L. When all data from the 100 utilities were considered, the overall average was about 100 µg/L. The median (50%) value for river and groundwater sources was approximately 60 µg/L, whereas the median for lakes was approximately 30 µg/L. The 90% values for river and groundwater sources were approximately 300 µg/L (Amy et al, 1995).
Under the Information Collection Rule, all large utilities serving more than 100,000 customers were required to measure a number of water quality parameters, including source water bromide and distribution system THMs and HAAs. Samples from 500 WTPs were analyzed during an 18-month period in

McTigue et al | http://dx.doi.org/10.5942/jawwa.2014.106.0141Peer-Reviewed
E494
2014 © American Water Works AssociationJOURNAL AWWA NOVEMBER 2014 | 106:11
1997–1998. The water systems were grouped into five categories for analysis on the basis of bromide concentrations in their source water. The categories were < 20 µg/L, 20–30 µg/L, 30–50 µg/L, 50–100 µg/L, and > 100 µg/L of bromide. About 80% of the samples analyzed for bromide in source water contained < 100 µg/L of bromide. In the highest category (> 100 µg/L of bromide), more than half of the TTHMs were bromine-substituted. When all of the data from the 500 plants were analyzed, systems that used source water with elevated bromide concentrations tended to have elevated concentrations of brominated DBPs in their distribution systems. However, the range of speciation within each category of bromide concentration was quite large (McGuire et al, 2002).
USEPA reported on the results of an extensive nationwide survey of DBP occurrence in drinking water. In this survey, source water bromide concentrations > 400 µg/L were associated with increased concentrations of DBPs in the finished water (Weinberg et al, 2002).
Preliminary data from an extensive monitoring effort taking place in North Carolina indicate that bromide concentrations in some watersheds are elevated, especially during periods of low stream flow. In one river, bromide concentrations as high as 1 mg/L were measured (Greune, 2013). The percentage of chloroform in the TTHMs in the distribution system of a drinking water utility on that river decreased significantly with increased bromide concentrations. At the highest bromide concentration in source water, nearly all of the TTHMs were composed of brominated species. Other recent studies have reported the same trend.
POTENTIAL EFFECT OF COAL-FIRED POWER PLANT DISCHARGES ON WATER QUALITY
Recently finalized regulations for power plant emissions into the air may result in the use of more air pollution–control technology, including brominated compounds, and ultimately more bromide wastes being discharged to receiving streams. In December 2011, USEPA approved strict, new air-emission limits, referred to as the Mercury and Air Toxics Standards (MATS), targeting oil- and coal-fired electrical power–generating facilities. These requirements are scheduled to take effect in 2015 (USEPA, 2012). MATS will target reductions in emissions of metals (mercury, arsenic, chromium, nickel), acid gases (hydrochloric and hydrofluoric), particulate matter, sulfur dioxide (SO2), and nitrous oxides. Figure 1 shows a USEPA-prepared map of US power plants with coal, oil, or both coal and oil units and their relative capacities in megawatts (MW) (USEPA, 2011).
It is estimated that 1,100 coal-fired units and 300 oil-fired units at 600 power plants will be affected by the MATS requirements (USEPA, 2011). Power plants that use coal as a fuel are most likely to install wet scrubbers and are the focus of this article.
The Flue Gas Desulfurization (FGD) process, also known as air scrubbers, is the preferred air pollution–control technology for controlling SO2 and sometimes mercury. The new MATS requirements for SO2 and mercury could result in the installation of more wet or dry scrubbers. Economic analysis will dictate which technology is selected, but wet scrubbers are generally favored when coal with higher sulfur content is used, as is the case in much of the eastern United States.
Mercury is present in flue gas in varying percentages, depending on the origin of the coal, in three basic forms (Kellie et al, 2005): particulate-bound mercury, elemental mercury (Hg0), and oxidized mercury in gas form (Hg2+). Particulate-bound mercury can be removed easily by electrostatic precipitators (ESP) or fabric filters (Bustard et al, 2003). The oxidized mercury tends to stick to particulate matter and is water soluble (Blythe et al, 2002). Consequently, it can be captured by ESPs, fabric filters, or wet or dry scrubbers. However, Hg0 is highly volatile and insoluble in water and is thus not readily removed by typical air pollution–control devices. The relative concentration of chloride and bromide that naturally occurs in the coal dictates the form of mercury that is present. In general, bromide is lower in lignite and sub-bituminous coal—3 mg/L and 1–2 mg/L, respectively—than in bituminous coal—20 mg/L (Buschmann, et al, 2005). Therefore, the addition of bromide-containing salts (usually calcium bromide) to the coal combustion unit can convert the mercury into the more water-soluble Hg2+ form. This soluble mercury is better removed by the wet scrubbers used to clean flue gases.
Although mercury in the wastewater can be removed prior to discharge into a receiving stream, the added bromide is not typically removed and ends up being discharged. A US Department of Energy (USDOE) National Energy Technology Laboratory (NETL) report (Benson et al, 2007) documented the correlation between bromide in or added to the coal and the concentration of bromide in the FGD wastewater, referred to as “liquor” in their study. The NETL results (Figure 2) show that after a couple of weeks, the bromide concentration in the FGD liquor was equal to the concentration added to the coal.
In tests of 14 full-scale, coal-fired power plants using calcium bromide to oxidize elemental mercury, more than 90% of the mercury was oxidized with the addition of 25–300 mg/L bromide by weight of coal (Chang et al, 2008). This range is wide because of the coal’s natural abundance of chlorine and bromine, giving the coal varied natural performance for oxidizing mercury. Using this information, it is possible to calculate the amount of bromide that could be discharged as a function of the amount of energy produced by the power plant, as described in the calculations shown in the following paragraph.
A power plant with a 1-MW capacity operated 24 hours a day, 365 days a year would produce 8,760,000 KW·h/year. According to the US Energy Information Administration (USEIA, 2013a), it takes 1.07 lb of coal to produce 1 KW·h of electricity. This means that for each MW of electrical power plant capacity, a coal-fired power plant would require 9,373,200 lb coal/year, or 25,680 lb/d. Using the range of 25–300 mg/L for bromide noted in Chang et al (2008), the amount of bromide added to the system each day per MW of power is estimated as follows:
For coal with 25 mg/L bromide
25,680
lb coal
day × MW
× 25 lb CaBr2106 lb coal
×
2 mol Br
1 mol CaBr2 ×
1 mol CaBr2
199.9 g
×
79.9 g
1 mol Br
= 0.51
lb Brday × MW
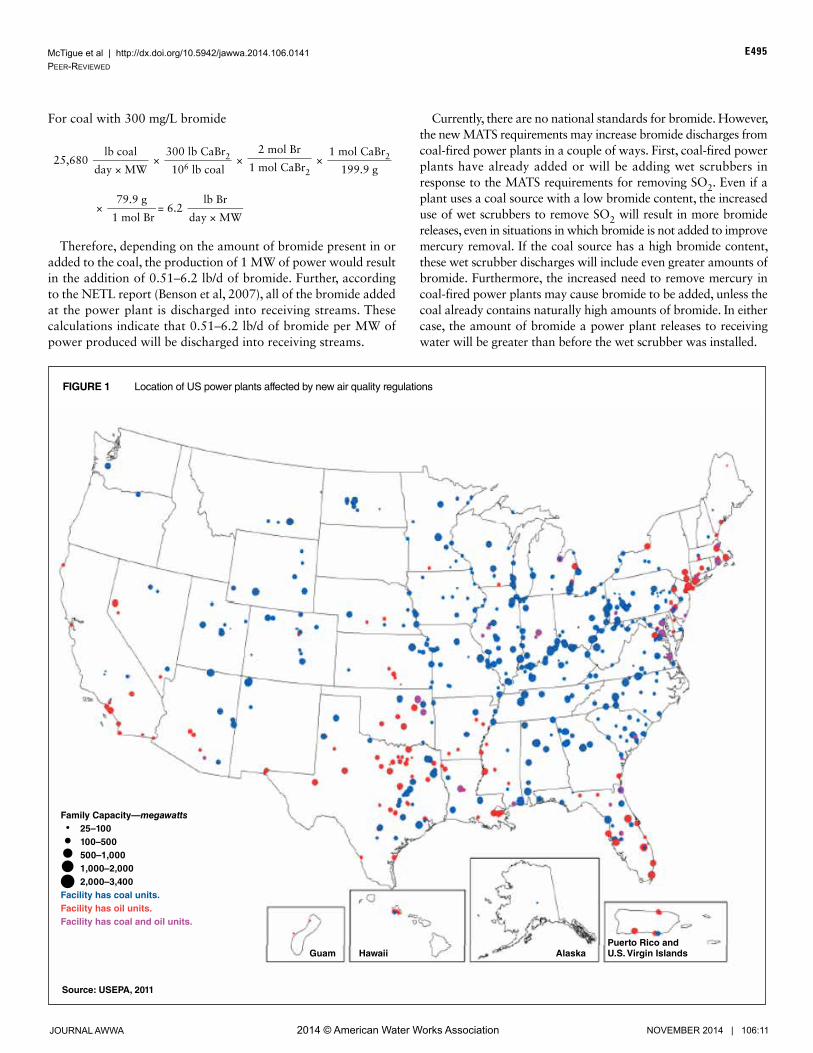
McTigue et al | http://dx.doi.org/10.5942/jawwa.2014.106.0141Peer-Reviewed
E495
2014 © American Water Works AssociationJOURNAL AWWA NOVEMBER 2014 | 106:11
For coal with 300 mg/L bromide
25,680
lb coal
day × MW
× 300 lb CaBr2106 lb coal
×
2 mol Br1 mol CaBr2
× 1 mol CaBr2
199.9 g
×
79.9 g 1 mol Br
= 6.2
lb Br
day × MW
Therefore, depending on the amount of bromide present in or added to the coal, the production of 1 MW of power would result in the addition of 0.51–6.2 lb/d of bromide. Further, according to the NETL report (Benson et al, 2007), all of the bromide added at the power plant is discharged into receiving streams. These calculations indicate that 0.51–6.2 lb/d of bromide per MW of power produced will be discharged into receiving streams.
Currently, there are no national standards for bromide. However, the new MATS requirements may increase bromide discharges from coal-fired power plants in a couple of ways. First, coal-fired power plants have already added or will be adding wet scrubbers in response to the MATS requirements for removing SO2. Even if a plant uses a coal source with a low bromide content, the increased use of wet scrubbers to remove SO2 will result in more bromide releases, even in situations in which bromide is not added to improve mercury removal. If the coal source has a high bromide content, these wet scrubber discharges will include even greater amounts of bromide. Furthermore, the increased need to remove mercury in coal-fired power plants may cause bromide to be added, unless the coal already contains naturally high amounts of bromide. In either case, the amount of bromide a power plant releases to receiving water will be greater than before the wet scrubber was installed.
FIGURE 1 Location of US power plants affected by new air quality regulations
Family Capacity—megawatts 25–100 100–500 500–1,000 1,000–2,000 2,000–3,400Facility has coal units.Facility has oil units.Facility has coal and oil units.
Guam Hawaii AlaskaPuerto Rico andU.S. Virgin Islands
Source: USEPA, 2011
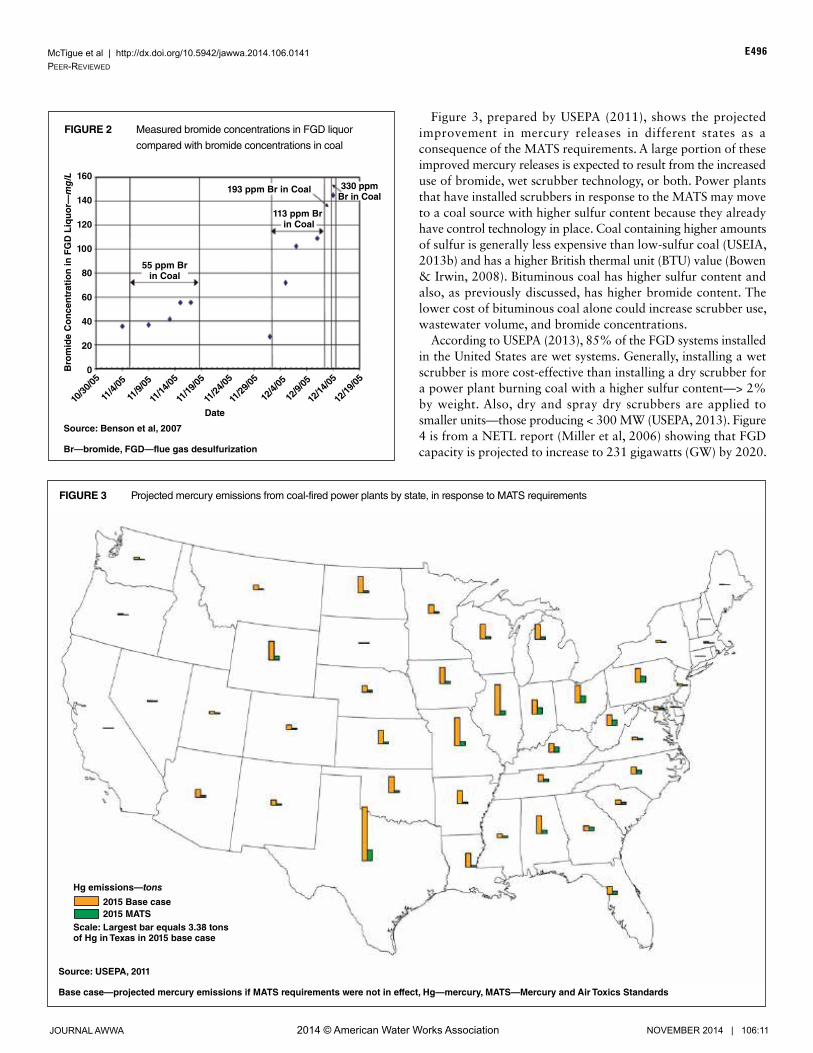
McTigue et al | http://dx.doi.org/10.5942/jawwa.2014.106.0141Peer-Reviewed
E496
2014 © American Water Works AssociationJOURNAL AWWA NOVEMBER 2014 | 106:11
Figure 3, prepared by USEPA (2011), shows the projected improvement in mercury releases in different states as a consequence of the MATS requirements. A large portion of these improved mercury releases is expected to result from the increased use of bromide, wet scrubber technology, or both. Power plants that have installed scrubbers in response to the MATS may move to a coal source with higher sulfur content because they already have control technology in place. Coal containing higher amounts of sulfur is generally less expensive than low-sulfur coal (USEIA, 2013b) and has a higher British thermal unit (BTU) value (Bowen & Irwin, 2008). Bituminous coal has higher sulfur content and also, as previously discussed, has higher bromide content. The lower cost of bituminous coal alone could increase scrubber use, wastewater volume, and bromide concentrations.
According to USEPA (2013), 85% of the FGD systems installed in the United States are wet systems. Generally, installing a wet scrubber is more cost-effective than installing a dry scrubber for a power plant burning coal with a higher sulfur content—> 2% by weight. Also, dry and spray dry scrubbers are applied to smaller units—those producing < 300 MW (USEPA, 2013). Figure 4 is from a NETL report (Miller et al, 2006) showing that FGD capacity is projected to increase to 231 gigawatts (GW) by 2020.
Bro
mid
e C
on
cen
trat
ion
in F
GD
Liq
uo
r—m
g/L
Date10
/30/05
11/4/
05
11/9/
05
11/14
/05
11/19
/05
11/24
/05
11/29
/05
12/4/
05
12/9/
05
12/14
/05
12/19
/05
330 ppmBr in Coal
113 ppm Br in Coal
193 ppm Br in Coal
55 ppm Brin Coal
160
140
120
100
80
60
40
20
0
FIGURE 2 Measured bromide concentrations in FGD liquor
compared with bromide concentrations in coal
Source: Benson et al, 2007
Br—bromide, FGD—flue gas desulfurization
FIGURE 3 Projected mercury emissions from coal-fired power plants by state, in response to MATS requirements
Source: USEPA, 2011
Base case—projected mercury emissions if MATS requirements were not in effect, Hg—mercury, MATS—Mercury and Air Toxics Standards
Hg emissions—tons
Scale: Largest bar equals 3.38 tonsof Hg in Texas in 2015 base case
2015 Base case2015 MATS

McTigue et al | http://dx.doi.org/10.5942/jawwa.2014.106.0141Peer-Reviewed
E497
2014 © American Water Works AssociationJOURNAL AWWA NOVEMBER 2014 | 106:11
If 90% of the FGD processes installed continue to be wet scrubbers, then 208 GW of the electrical power–generating capacity in 2020 will make use of wet scrubbers. One vendor promoting the use of bromide injection for mercury control claims that a combined total of 8,000 MW of US utility coal-fired boilers use its technology (McIlvaine Company, 2012).
As discussed previously, bromide is present in the coal burned and is often added as calcium bromide in the FGD process. As the use of FGD increases, the amount of bromide that is ultimately released to receiving water may increase dramatically, resulting in adverse effects on downstream drinking water plants.
Consequently, the new air emissions regulation designed to lower mercury emissions may result in increased bromide discharges to drinking water sources as power plants change technology or coal sources in an effort to meet the requirements. Drinking water utilities may, in turn, experience difficulty in meeting regulatory requirements and may see an increase in the production of brominated DBPs, which may pose greater health risks to consumers than analogous chlorinated DBPs.
Bromine disinfectants, also referred to as bromine biocides, are also used as an alternative to chlorine for cooling tower disinfection. Regulations have made it particularly difficult to use chlorine to control biological fouling in cooling towers. However, discharges of power plant cooling water containing bromine are controlled by National Pollutant Discharge Elimination System (NPDES) permits, which restrict discharges of bromine compounds to no more than 2 h/d. This could result in a bromide spike and thus a DBP spike in the distribution system of a downstream WTP.
POTENTIAL EFFECT OF HYDRAULIC FRACTURING ON WATER QUALITY
Unconventional development of natural gas sources, also known as hydraulic fracturing, or “fracking,” made up 23% of US natural gas production in 2010. This percentage is increasing each year and is expected to reach 49% by 2035 (USDOE, 2012). Hydraulic fracturing introduces water (millions of gallons per well) to the shale formation in order to increase permeability, and thus this water has the potential to return to the surface with the gas. From 10 to 80% of the injected water may return to the surface as wastewater. The wastewater from the entire process includes both “flowback” and “produced water.” Flowback is the fracturing fluid that quickly returns to the surface; produced water is the fracturing fluid that takes longer to return to the surface (Robart, 2012).
Both flowback and produced water are enriched with materials from the shale formation—e.g., minerals, brines, hydrocarbons, and naturally occurring radioactive material. The longer the fluid takes to return to the surface, the greater the concentration of formation materials it contains (Hayes, 2009). Management of flowback is usually done as part of on-site operations through minimization, recycling, and reuse. Management of produced water may also include treatment followed by surface water discharges, such as at publicly owned wastewater treatment plants (known as publicly owned treatment works, or POTWs) or centralized waste treatment plants (CWTs). Existing CWTs are exempt from the 2008 regulations that include restrictions on discharges of total
dissolved solids (TDS). This exemption could result in elevated TDS concentrations, including the release of elevated bromide and chloride concentrations found in flowback and produced water.
Table 1 shows the ranges of bromide concentration, the average wastewater flow, and the receiving watershed for a number of Pennsylvania facilities that treat hydraulic fracturing wastewater and discharge it to surface water. Significant quantities of bromide are being introduced to receiving water by these facilities. The West Virginia Department of Environmental Protection also collected 13 produced water samples containing bromide concentrations ranging from 1,290 to 525,000 µg/L, with an average concentration of 185,000 µg/L.
For example, the Josephine brine treatment facility (Table 1), located on the Conemaugh River within the Allegheny watershed, reported discharging 155,000 gpd of treated hydraulic fracturing wastewater containing bromide concentrations of 601,000–8,290,000 µg/L. However, a full understanding of the magnitude of the flow and concentration of this effluent requires knowledge of the flow of the receiving stream. The closest US Geological Survey (USGS) gauge station (USGS 03041500) to the brine facility’s discharge location on the Conemaugh River measured an average flow of 1,629 ft3/s. This means that the brine effluent makes up 0.015% of the total river flow, diluting the bromide concentration by the same fraction. With that dilution factor, the bromide concentration added to the river at the discharge location is approximately 88–1,220 µg/L. As discussed previously, the bromide concentrations in US rivers reported by Amy et al in 1995 averaged around 60 µg/L. Because 1995 predates the ongoing boom in shale gas development, those concentrations could be considered the background concentration. This means the lower limit of the Josephine facility’s effluent bromide concentration is more than double the background concentration and the upper limit increased 20-fold.
POTENTIAL EFFECT OF OTHER INDUSTRIES ON WATER QUALITY
Other industries could also discharge wastewater effluent with elevated bromide concentrations. Any industry with emissions
FIGURE 4 Projected increase in US coal-fired wet FGD capacity
Source: Miller et al, 2006
FGD—flue gas desulfurization
Tota
l FG
D C
apac
ity—
GW
250
200
150
100
50
02004 2010 2015 2020
Year

McTigue et al | http://dx.doi.org/10.5942/jawwa.2014.106.0141Peer-Reviewed
E498
2014 © American Water Works AssociationJOURNAL AWWA NOVEMBER 2014 | 106:11
containing mercury and sulfur oxides could have or will have wet scrubber installations, and thus their effluent streams could be a new source of bromide in receiving streams.
Brominated flame retardants are used in a variety of consumer products, and several of those are produced in large quantities. The use of flame retardants has grown dramatically over the past 30 years in response to concerns related to the increasing use of flammable plastics and textiles. Many concerns about these compounds focus on their persistence in the environment and bioaccumulation. Although the flame retardants themselves are unlikely to form DBPs as a result of their inherent environmental persistence, effluent streams from the facilities that produce and use these compounds (i.e., textile mills) could be a possible source of bromide in receiving streams.
ANALYZING POTENTIAL EFFECTS ON DRINKING WATER SOURCES
There are no current standards for bromide in drinking water or receiving water, because in its unreacted form, bromide has no known health effects associated with ingestion. Drinking water utilities have not traditionally monitored their source water for bromide, and in most cases industries are not required to report concentrations of bromide discharged to receiving water.
In order to determine the potential number of drinking water utilities that could be affected by bromide discharges resulting from wet scrubber installations at coal-fired plants, a number of databases and tools were used.
According to the USEIA, 332 electric utilities used coal during the period 2002–2011 (USEIA, 2011). This number includes electricity production only by public entities and not by independent power producers or the commercial and industrial sectors. These sectors operated an additional 257 coal-fired facilities during 2011, but they are generally much smaller than those owned by electric utilities. Of the 332 public entities identified, 302 have NPDES permits. With the use of the latitude and longitude information provided in the NPDES permits for these plants, a map was created in a software program for
analyzing geospatial data (Figure 5). Along with latitude and longitude, the database for these power plants also contains the plant nameplate capacity (USEIA, 2011), the NPDES permit number (USEPA, 2013), the hydrologic unit code (USEPA, 2013), the FGD type and year of installation (USEIA, 2011), and the current sulfur content of the coal used (USEIA, 2013c). This information was used to identify bodies of water potentially at risk for bromide contamination.
Most of the power plants using coal are east of the Mississippi River (Figure 5). They are typically located on or near a large body of surface water. Also, high densities of coal-fired power plants are located on the borders of Ohio, West Virginia, Kentucky, and Indiana, along the Ohio River.
Of the 302 identified coal-fired electric utility power plants with NPDES permits, 118 had wet scrubber installations (Figure 5, part A), 39 had dry scrubber installations, and eight used coal with a high sulfur content (> 2%), making these plants good candidates for installing a wet scrubber.
The database of the Safe Drinking Water Information System (SDWIS) was then used to map community water systems that use surface water. The SDWIS database contains information on all community surface drinking WTPs in the United States, including the location, public water system identification number, population served, and contact information. The database included 8,370 surface WTPs serving a population exceeding 500.
The surface WTPs and the 118 coal-fired power plants with wet scrubbers were plotted in the same software program1 (Figure 5, part B) with layers for streams, canals, rivers, and other bodies of water. This plot was prepared to display power plants whose wastewater effluent could contain bromide. Then with knowledge of stream flow directions, NPDES hydrologic unit codes for the power plants, and visual confirmation of drinking WTP locations, 96 surface WTPs were identified as being downstream from 57 coal-fired power plants with wet scrubbers (Figure 6). The effluent from one power plant could affect multiple WTP intakes.
Figure 7 shows how potentially affected facilities were identified with the use of databases of the power plant and WTP locations.
TABLE 1 Bromide concentrations at Pennsylvania CWTs and POTWs treating Marcellus Shale wastewater
Name of FacilityType of Treatment
Facility
Bromide Concentrationµg/L *† Date
Plant flowgal/d‡Minimum Maximum Minimum Maximum
Pennsylvania Brine Treatment’s Josephine facility CWT 601,000 8,290,000 5/25/2011 12/21/2011 155,000
Pennsylvania Brine Treatment’s Franklin facility CWT 364,000 770,000 8/2/2011 5/9/2011 300,000
Minard Oil Run Company’s Dent treatment facility CWT 606,000 657,000 10/6/2011 2/9/2012 16,000
Brockway Area Sewage Authority POTW 2,320 19,200 12/7/2011 11/21/2011 1,500,000
Ridgway Borough POTW 2,880 11,500 9/8/2011 7/21/2011 2,20,000
City of McKeesport POTW 119 600 10/20/2010 10/19/2010 11,500,000
Franklin Township of Greene County POTW < 0.016 20,910 11/7/2011 11/10/2010 1,250,000
CWT—centralized waste treatment, POTW—publicly owned treatment works (for treating wastewater)
*USEPA, 2013†Ferrar et al, 2013‡Environmental Law Clinic, 2009
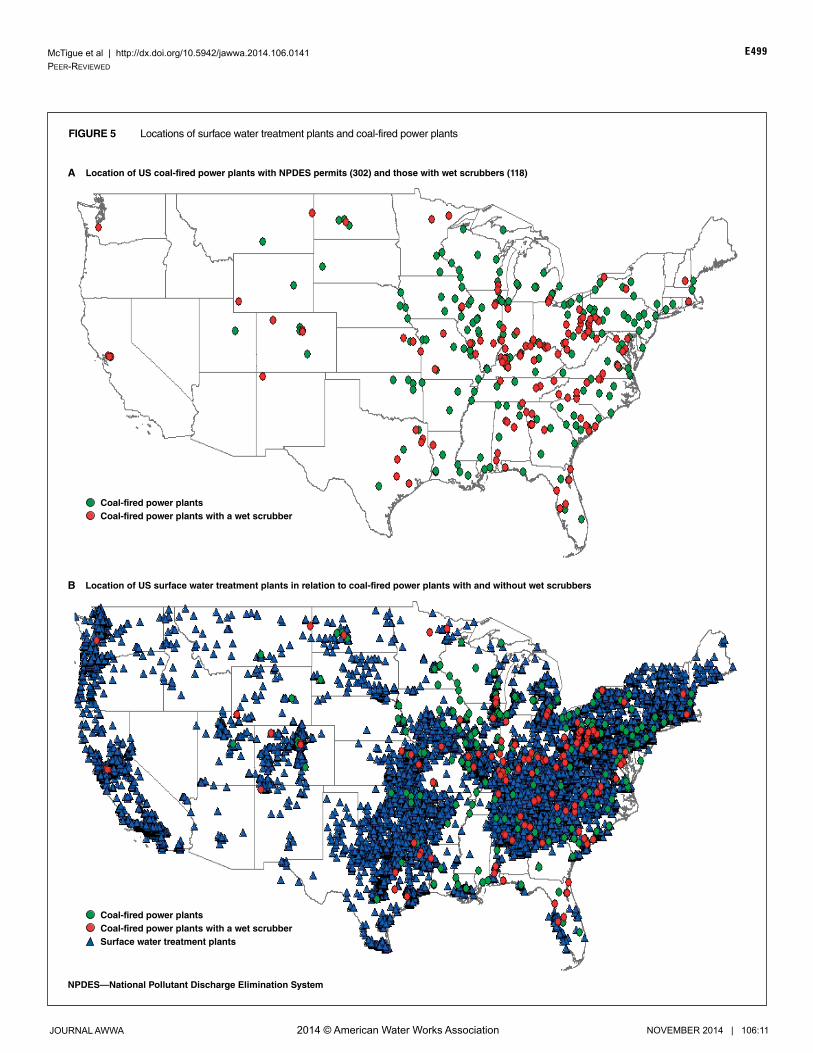
McTigue et al | http://dx.doi.org/10.5942/jawwa.2014.106.0141Peer-Reviewed
E499
2014 © American Water Works AssociationJOURNAL AWWA NOVEMBER 2014 | 106:11
FIGURE 5 Locations of surface water treatment plants and coal-fired power plants
Location of US coal-fired power plants with NPDES permits (302) and those with wet scrubbers (118)A
B Location of US surface water treatment plants in relation to coal-fired power plants with and without wet scrubbers
NPDES—National Pollutant Discharge Elimination System
Coal-fired power plantsCoal-fired power plants with a wet scrubber
Coal-fired power plantsCoal-fired power plants with a wet scrubberSurface water treatment plants

McTigue et al | http://dx.doi.org/10.5942/jawwa.2014.106.0141Peer-Reviewed
E500
2014 © American Water Works AssociationJOURNAL AWWA NOVEMBER 2014 | 106:11
Figure 7 shows the location of a power plant along with downstream rivers, streams, and drinking water treatment facilities using surface water. All of the facilities shown in Figure 7 use the same source whether it is WTP influent or power plant effluent.
The SDWIS database was used to determine whether these 96 downstream utilities had reported MCL violations of TTHMs or HAA5. Of the 96 WTPs identified, 25 had DBP MCL violations, and 17 of those had violations that occurred after wet scrubber installations. Of those 17, six WTPs experienced violations within a year of the installation. These numbers suggest that there may be a correlation between installation of the wet scrubber and increased DBP formation at downstream water plants, although many factors affect the formation of DBPs. To determine if these increases could be caused by power plant effluents, state regulators and utility personnel at these water plants were contacted for further information.
UTILITY EFFECTS FROM COAL-FIRED PLANT DISCHARGESPersonnel at 14 utilities and eight state primacy agencies were
contacted. Some of these utilities and primacy agencies reported no increase in DBPs. Four drinking water utilities were identified as having documented increases in brominated DBPs, along with increased source water bromide concentrations believed to be from wet scrubber installations at coal-fired power plants (Table 2). All
FIGURE 6 Coal-fired power plants with wet scrubbers in relation to downstream surface water treatment plants
Coal-fired power plants with wet scrubbers and upstream from water treatment plantsSurface water treatment plants downstream from power plant effluent discharges (although 96 of these plants were identified, not all of them could be shown on this map)
FIGURE 7 Example of the methodology used to identify water
plants located downstream of a coal-fired power plant
Coal-fired power plants with a wet scrubberSurface water treatment plantsWater bodies
10.5 1 2 3 4Miles
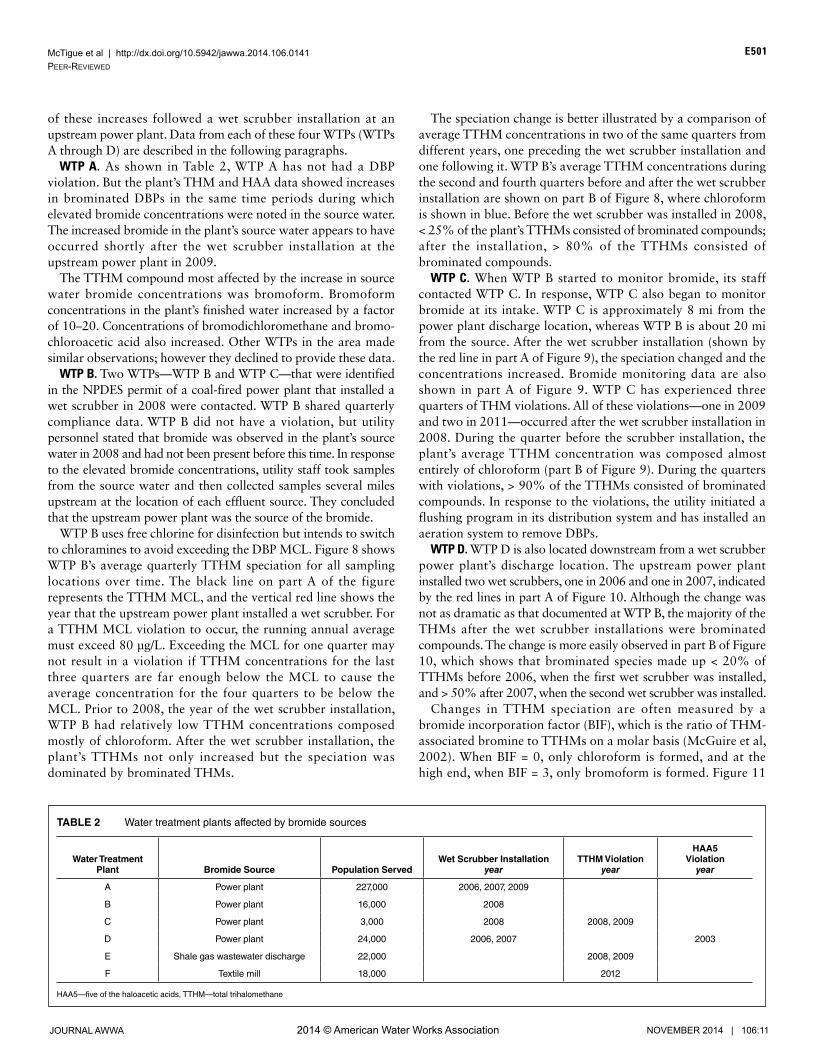
McTigue et al | http://dx.doi.org/10.5942/jawwa.2014.106.0141Peer-Reviewed
E501
2014 © American Water Works AssociationJOURNAL AWWA NOVEMBER 2014 | 106:11
of these increases followed a wet scrubber installation at an upstream power plant. Data from each of these four WTPs (WTPs A through D) are described in the following paragraphs.
WTP A. As shown in Table 2, WTP A has not had a DBP violation. But the plant’s THM and HAA data showed increases in brominated DBPs in the same time periods during which elevated bromide concentrations were noted in the source water. The increased bromide in the plant’s source water appears to have occurred shortly after the wet scrubber installation at the upstream power plant in 2009.
The TTHM compound most affected by the increase in source water bromide concentrations was bromoform. Bromoform concentrations in the plant’s finished water increased by a factor of 10–20. Concentrations of bromodichloromethane and bromo-chloroacetic acid also increased. Other WTPs in the area made similar observations; however they declined to provide these data.
WTP B. Two WTPs—WTP B and WTP C—that were identified in the NPDES permit of a coal-fired power plant that installed a wet scrubber in 2008 were contacted. WTP B shared quarterly compliance data. WTP B did not have a violation, but utility personnel stated that bromide was observed in the plant’s source water in 2008 and had not been present before this time. In response to the elevated bromide concentrations, utility staff took samples from the source water and then collected samples several miles upstream at the location of each effluent source. They concluded that the upstream power plant was the source of the bromide.
WTP B uses free chlorine for disinfection but intends to switch to chloramines to avoid exceeding the DBP MCL. Figure 8 shows WTP B’s average quarterly TTHM speciation for all sampling locations over time. The black line on part A of the figure represents the TTHM MCL, and the vertical red line shows the year that the upstream power plant installed a wet scrubber. For a TTHM MCL violation to occur, the running annual average must exceed 80 µg/L. Exceeding the MCL for one quarter may not result in a violation if TTHM concentrations for the last three quarters are far enough below the MCL to cause the average concentration for the four quarters to be below the MCL. Prior to 2008, the year of the wet scrubber installation, WTP B had relatively low TTHM concentrations composed mostly of chloroform. After the wet scrubber installation, the plant’s TTHMs not only increased but the speciation was dominated by brominated THMs.
The speciation change is better illustrated by a comparison of average TTHM concentrations in two of the same quarters from different years, one preceding the wet scrubber installation and one following it. WTP B’s average TTHM concentrations during the second and fourth quarters before and after the wet scrubber installation are shown on part B of Figure 8, where chloroform is shown in blue. Before the wet scrubber was installed in 2008, < 25% of the plant’s TTHMs consisted of brominated compounds; after the installation, > 80% of the TTHMs consisted of brominated compounds.
WTP C. When WTP B started to monitor bromide, its staff contacted WTP C. In response, WTP C also began to monitor bromide at its intake. WTP C is approximately 8 mi from the power plant discharge location, whereas WTP B is about 20 mi from the source. After the wet scrubber installation (shown by the red line in part A of Figure 9), the speciation changed and the concentrations increased. Bromide monitoring data are also shown in part A of Figure 9. WTP C has experienced three quarters of THM violations. All of these violations—one in 2009 and two in 2011—occurred after the wet scrubber installation in 2008. During the quarter before the scrubber installation, the plant’s average TTHM concentration was composed almost entirely of chloroform (part B of Figure 9). During the quarters with violations, > 90% of the TTHMs consisted of brominated compounds. In response to the violations, the utility initiated a flushing program in its distribution system and has installed an aeration system to remove DBPs.
WTP D. WTP D is also located downstream from a wet scrubber power plant’s discharge location. The upstream power plant installed two wet scrubbers, one in 2006 and one in 2007, indicated by the red lines in part A of Figure 10. Although the change was not as dramatic as that documented at WTP B, the majority of the THMs after the wet scrubber installations were brominated compounds. The change is more easily observed in part B of Figure 10, which shows that brominated species made up < 20% of TTHMs before 2006, when the first wet scrubber was installed, and > 50% after 2007, when the second wet scrubber was installed.
Changes in TTHM speciation are often measured by a bromide incorporation factor (BIF), which is the ratio of THM-associated bromine to TTHMs on a molar basis (McGuire et al, 2002). When BIF = 0, only chloroform is formed, and at the high end, when BIF = 3, only bromoform is formed. Figure 11
TABLE 2 Water treatment plants affected by bromide sources
Water Treatment Plant Bromide Source Population Served
Wet Scrubber Installationyear
TTHM Violationyear
HAA5Violation
year
A Power plant 227,000 2006, 2007, 2009
B Power plant 16,000 2008
C Power plant 3,000 2008 2008, 2009
D Power plant 24,000 2006, 2007 2003
E Shale gas wastewater discharge 22,000 2008, 2009
F Textile mill 18,000 2012
HAA5—five of the haloacetic acids, TTHM—total trihalomethane

McTigue et al | http://dx.doi.org/10.5942/jawwa.2014.106.0141Peer-Reviewed
E502
2014 © American Water Works AssociationJOURNAL AWWA NOVEMBER 2014 | 106:11
shows the BIF for the data discussed for water plants B, C, and D. At these three locations, the BIF increased after the wet scrubber installations. The DBPs not only shifted to more brominated species but, as shown by the bar heights, the mass of DBPs also increased.
As discussed earlier, some of the increase would be due to the difference in the molecular weight of bromide compared with that of chloride; substitution causes a higher concentration of DBPs on a mass basis. Some of the increase could also be due to the more reactive properties of bromide, with the precursor materials causing more DBP formation. Data from the three utilities were analyzed to assess these two factors. The results are reported as an increase in the median DBP concentration prior to and after the scrubber
installation. At WTP B, 43% of the mass increase in DBPs was due to bromide substitution, and 57% was due to an actual increase in DBP formation. At WTP C, 70% of the mass increase was due to bromide substitution, and 30% was due to increased DBP formation. At WTP D, 30% of the mass increase was caused by bromide substitution, and 70% was caused by increased DBP formation. Therefore, both factors play a role in increasing DBP formation when source water bromide concentrations rise.
UTILITY EFFECTS FROM DISCHARGES BY OTHER INDUSTRIESOther potential sources of bromide such as hydraulic fracturing
and textile production have been reported. Wilson and VanBriesen (2012) reported bromide concentrations in excess of 500 µg/L during
FIGURE 8 THM data from water treatment plant B
A Average quarterly TTHM concentrations at water treatment plant B from quarter 2 of 2006 to quarter 3 of 2013
Before Upstream Wet Scrubber Installation
MCL—maximum contaminant level, THM—trihalomethane, TTHM—total trihalomethane
After Upstream Wet Scrubber Installation
B THM speciation at water treatment plant B for the same quarters preceding and following 2008, the year the upstream wet scrubber was installed
0.0000
0.0200
0.0400
0.0600
0.0800
0.1000
0.1200
0.1400
5/3/
2006
8/1/
2006
11/8
/200
6
2/6/
2007
5/1/
2007
8/7/
2007
11/2
0/20
07
2/12
/200
8
5/20
/200
8
8/12
/200
8
11/1
8/20
08
2/24
/200
9
5/12
/200
9
8/18
/200
9
11/9
/200
9
2/17
/201
0
5/12
/201
0
8/18
/201
0
11/1
/201
0
2/1/
2011
5/2/
2011
8/1/
2011
11/1
/201
1
2/1/
2012
4/2/
2012
7/3/
2012
8/2/
2012
11/2
8/20
12
2/5/
2013
4/2/
2013
7/1/
2013
TH
M―
mg
/L
ChloroformBromoformBromodichloromethaneDibromochloromethaneTTHM MCLWet scrubber installation
ChloroformBromoformBromodichloromethaneDibromochloromethane
Quarter 4, 2006 Quarter 4, 2012Quarter 2, 2007 Quarter 2, 2013

McTigue et al | http://dx.doi.org/10.5942/jawwa.2014.106.0141Peer-Reviewed
E503
2014 © American Water Works AssociationJOURNAL AWWA NOVEMBER 2014 | 106:11
periods of low stream flow on the Allegheny River in 2008 and 2009. The authors correlated these increases with increased DBP violations. Between 2008 and 2011, 33 Western Pennsylvania drinking water systems exceeded THM MCLs (Frazier & Murray, 2011).
States et al (2012) reported that during 2010, seven WTPs using the Allegheny River as a source had effluent TTHM concentrations of 19–110 µg/L, with 12–55% composed of bromoform.
WTP E. WTP E was initially identified through use of the databases of coal-fired power plants and surface WTPs. Utility personnel contacted believe that hydraulic fracturing was the main cause of WTP E’s increased bromide and subsequent TTHM concentrations. Since 2008, WTP E’s source water has contained high TDS concentrations, so the utility has added groundwater
from backup wells for dilution. Utility personnel stated that these increases occurred around the time that hydraulic fracturing began nearby, and they believe fracturing has caused these changes. Nearby WTPs have also violated the TTHM MCL since 2008. Another city that received its water supply from WTP E exceeded the TTHM MCL in May 2013.
Average quarterly TTHM speciation at all WTP E sampling locations from 1999 to 2013 is shown in part A of Figure 12. According to utility staff, discharges of hydraulic fracturing wastewater in the area started in 2008. It is clear that the chlorinated portion (blue) of the utility’s TTHMs decreased after 2008 and that the brominated portion (all other colors) increased. This comparison is better shown in part B of Figure 12, in which
FIGURE 9 THM data from water treatment plant C
A TTHM concentrations at water treatment plant C from quarter 1 of 2006 to quarter 4 of 2012
Before Upstream Wet Scrubber Installation
MCL—maximum contaminant level, THM—trihalomethane, TTHM—total trihalomethane
After Upstream Wet Scrubber Installation
B THM speciation at water treatment plant C for the same quarters preceding and following 2008, the year the upstream wet scrubber was installed
ChloroformBromoformBromodichloromethaneDibromochloromethaneTTHM MCLWet scrubber installationBromide
ChloroformBromoformBromodichloromethaneDibromochloromethane
Quarter 2, 2008 Quarter 2, 2011Quarter 3, 2006 Quarter 3, 2011
0.0
02/23
/2006
09/20
/2006
02/14
/2007
09/19
/2007
02/20
/2008
09/18
/2008
02/18
/2009
09/24
/2009
02/25
/2010
09/08
/2010
03/10
/2011
09/07
/2011
07/31
/2012
08/13
/2012
08/28
/2012
09/10
/2012
09/24
/2012
10/08
/2012
10/23
/2012
11/05
/2012
11/19
/2012
12/03
/2012
12/17
/2012
0.1
0.2
0.3
0.4
0.5
0.6
0.7
0.0000
0.0200
0.0400
0.0600
0.0800
0.1000
0.1200
0.1400
0.1600
0.1800
Bro
mid
e―mg/L
TH
M―
mg
/L

McTigue et al | http://dx.doi.org/10.5942/jawwa.2014.106.0141Peer-Reviewed
E504
2014 © American Water Works AssociationJOURNAL AWWA NOVEMBER 2014 | 106:11
the first column represents samples collected before the effects of hydraulic fracturing and the second column represents samples collected after these effects. Before hydraulic fracturing discharges, brominated compounds made up 50% or less of WTP E’s TTHMs; after these discharges, they made up > 80%.
WTP F. WTP F was identified through contacts made during the project. In August 2012, WTP F had a THM violation that resulted in the utility calling its state primacy agency. The state worked with two point sources, both textile mills located about 100 mi upstream, where bromide was discharged from a chemical manufacturing process. This effect was initially noticed by WTP F’s water treatment personnel during the fourth quarter of 2011, which is consistent with the rise in TTHMs above the MCL in the third quarter of 2011, shown in part A of Figure 13. In addition, the speciation depicted in part B of Figure 13
shows a shift from 30% to 80% brominated THMs before and after the textile mill effect, respectively. In response to the elevated bromide concentrations, WTP F changed its treatment process, increasing the permanganate dosage in its reservoir, moving its powdered activated carbon feed to allow for longer contact time, decreasing the chlorine dosage used in prechlorination, and decreasing the chlorine dosage in the distribution system. The state also worked with the textile mills to reduce their discharges.
POSSIBLE WAYS TO LIMIT BROMIDE IN SOURCE WATERIn order to limit the discharge of toxics to a receiving body of
water, states must develop water quality standards, as mandated by the Clean Water Act (CWA). Water quality standards, which are provisions of state or federal law, consist of a designated use
FIGURE 10 THM data from water treatment plant D
A Average quarterly TTHM concentrations at water treatment plant D from quarter 2 of 2005 to quarter 4 of 2012
Before Upstream Wet Scrubber Installation
MCL—maximum contaminant level, THM—trihalomethane, TTHM—total trihalomethane
After Upstream Wet Scrubber Installation
B THM speciation at water treatment plant D for the same quarters preceding and following 2006 and 2007, when the upstream wet scrubbers were installed
ChloroformBromoformBromodichloromethaneDibromochloromethaneTTHM MCLWet scrubber installations
ChloroformBromoformBromodichloromethaneDibromochloromethane
Quarter 1, 2005 Quarter 1, 2008Quarter 4, 2005 Quarter 4, 2008
03/01
/2005
05/04
/2005
09/15
/2005
11/30
/2005
02/10
/2006
06/06
/2006
09/05
/2006
11/17
/2006
02/16
/2007
05/17
/2007
08/17
/2007
11/16
/2007
02/15
/2008
05/22
/2008
08/14
/2008
11/12
/2008
02/16
/2012
05/10
/2012
08/30
/2012
11/29
/2012
TH
M―
mg
/L
0
0.01
0.02
0.03
0.04
0.05
0.06
0.07
0.08
0.09

McTigue et al | http://dx.doi.org/10.5942/jawwa.2014.106.0141Peer-Reviewed
E505
2014 © American Water Works AssociationJOURNAL AWWA NOVEMBER 2014 | 106:11
or uses for the receiving water and water quality criteria for such water on the basis of the designated uses.
The USEPA website—water.epa.gov/scitech/swguidance/standards/wqsregs.cfm—describes the methods states can use to develop these standards.
As discussed previously, some states have attempted to limit the discharge of bromide through NPDES permits. Water quality standards can be narrative in nature, and permit writers can establish permit limits for protecting designated uses. But because bromide has not been defined as a “toxic pollutant,” according to the list contained in the CWA (section 307.a), or as a “pollutant,” including bromide limits in discharge permits has been difficult. Nevertheless, because the CWA was designed to “protect the designated use,” states may be able to develop a water quality standard for bromide that recognizes that the transformation of bromide within drinking WTPs into by-products with human health implications justifies limiting its discharge into a receiving body of water.
Although some states are not able to get restrictions on effluent bromide concentrations, some have been able to require monitoring
as part of a power plant’s NPDES permits. For example, a power plant in North Carolina that installed a wet scrubber in 2008 is required by its NPDES permit to take monthly grab samples that are analyzed for bromide. The permit also requires the plant to submit a semiannual status report on its effort to reduce bromide at the source of downstream WTPs. In the event of a TTHM MCL violation at either of two named WTPs located downstream or by any wholesale customer, the power plant is required within 14 days of the request to provide the latest available bromide monitoring data for incorporation into required public notices issued by the WTP(s).
CONCLUSIONSWith new bromide sources being introduced into drinking water
sources, it is important that downstream effects be considered. Water utilities need to be made aware of the potential effect of bromide on their distribution system TTHMs and HAAs. This article highlighted a number of instances in which utilities exceeded MCLs because of a shift to brominated DBP species. However, it is suspected that many utilities have experienced elevated DBP concentrations without exceeding MCLs but are unaware of the cause of this change.
FIGURE 11 Bromide incorporation factor for THM data from water treatment plants B, C, D and shown in Figures 8, 9, 10 and 11
BIF—bromide incorporation factor, BR—bromide, THM—trihalomethane, WTP—water treatment plant
0.00
0.50
1.00
1.50
2.00
2.50
3.00
01/01/04 12/31/08 12/31/13
BIF
—m
ol B
r/m
ol X
WTP B THM dataWTP C THM dataWTP D THM dataWet scrubber B installedWet scrubber C installedWet scrubbers D installed
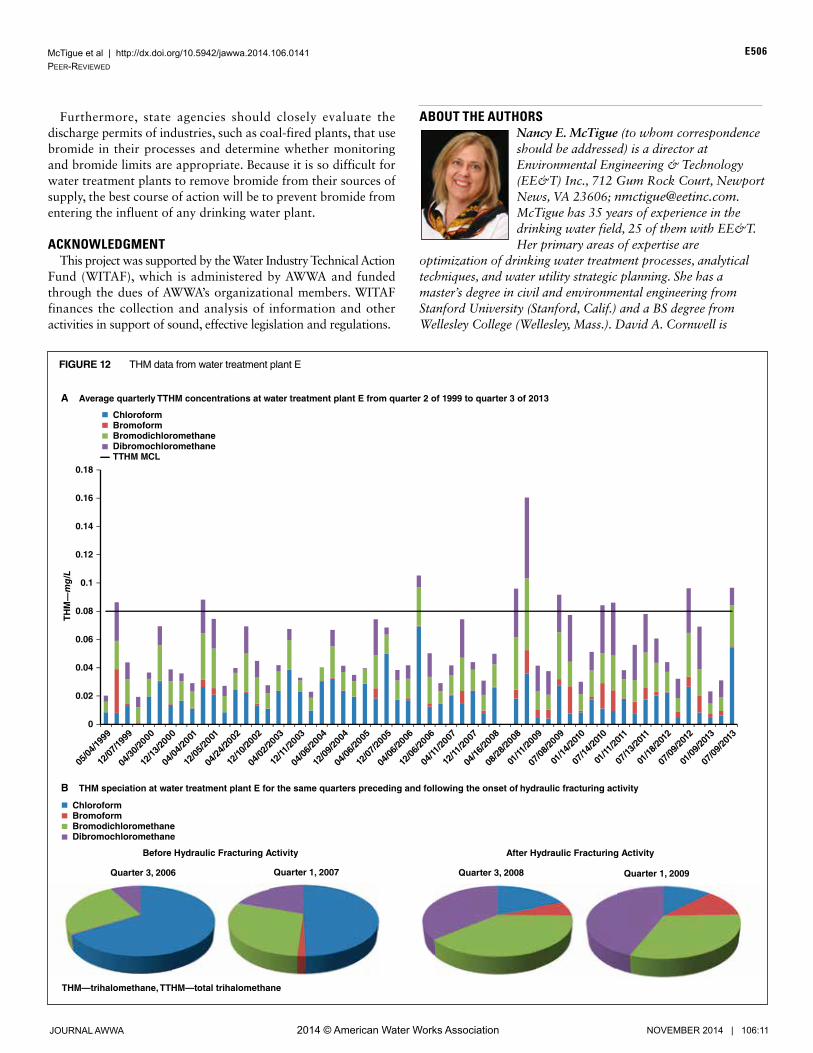
McTigue et al | http://dx.doi.org/10.5942/jawwa.2014.106.0141Peer-Reviewed
E506
2014 © American Water Works AssociationJOURNAL AWWA NOVEMBER 2014 | 106:11
Furthermore, state agencies should closely evaluate the discharge permits of industries, such as coal-fired plants, that use bromide in their processes and determine whether monitoring and bromide limits are appropriate. Because it is so difficult for water treatment plants to remove bromide from their sources of supply, the best course of action will be to prevent bromide from entering the influent of any drinking water plant.
ACKNOWLEDGMENTThis project was supported by the Water Industry Technical Action
Fund (WITAF), which is administered by AWWA and funded through the dues of AWWA’s organizational members. WITAF finances the collection and analysis of information and other activities in support of sound, effective legislation and regulations.
ABOUT THE AUTHORSNancy E. McTigue (to whom correspondence should be addressed) is a director at Environmental Engineering & Technology (EE&T) Inc., 712 Gum Rock Court, Newport News, VA 23606; [email protected]. McTigue has 35 years of experience in the drinking water field, 25 of them with EE&T. Her primary areas of expertise are
optimization of drinking water treatment processes, analytical techniques, and water utility strategic planning. She has a master’s degree in civil and environmental engineering from Stanford University (Stanford, Calif.) and a BS degree from Wellesley College (Wellesley, Mass.). David A. Cornwell is
FIGURE 12 THM data from water treatment plant E
A Average quarterly TTHM concentrations at water treatment plant E from quarter 2 of 1999 to quarter 3 of 2013
Before Hydraulic Fracturing Activity
THM—trihalomethane, TTHM—total trihalomethane
After Hydraulic Fracturing Activity
B THM speciation at water treatment plant E for the same quarters preceding and following the onset of hydraulic fracturing activity
ChloroformBromoformBromodichloromethaneDibromochloromethaneTTHM MCL
ChloroformBromoformBromodichloromethaneDibromochloromethane
Quarter 3, 2006 Quarter 3, 2008Quarter 1, 2007 Quarter 1, 2009
05/04
/1999
12/07
/1999
04/30
/2000
12/13
/2000
04/04
/2001
12/05
/2001
04/24
/2002
12/10
/2002
04/02
/2003
12/11
/2003
04/06
/2004
12/09
/2004
04/06
/2005
12/07
/2005
04/06
/2006
12/06
/2006
04/11
/2007
12/11
/2007
04/16
/2008
08/28
/2008
01/11
/2009
07/08
/2009
01/14
/2010
07/14
/2010
01/11
/2011
07/13
/2011
01/18
/2012
07/09
/2012
01/09
/2013
07/09
/2013
TH
M―
mg
/L
0
0.02
0.04
0.06
0.08
0.1
0.12
0.14
0.16
0.18
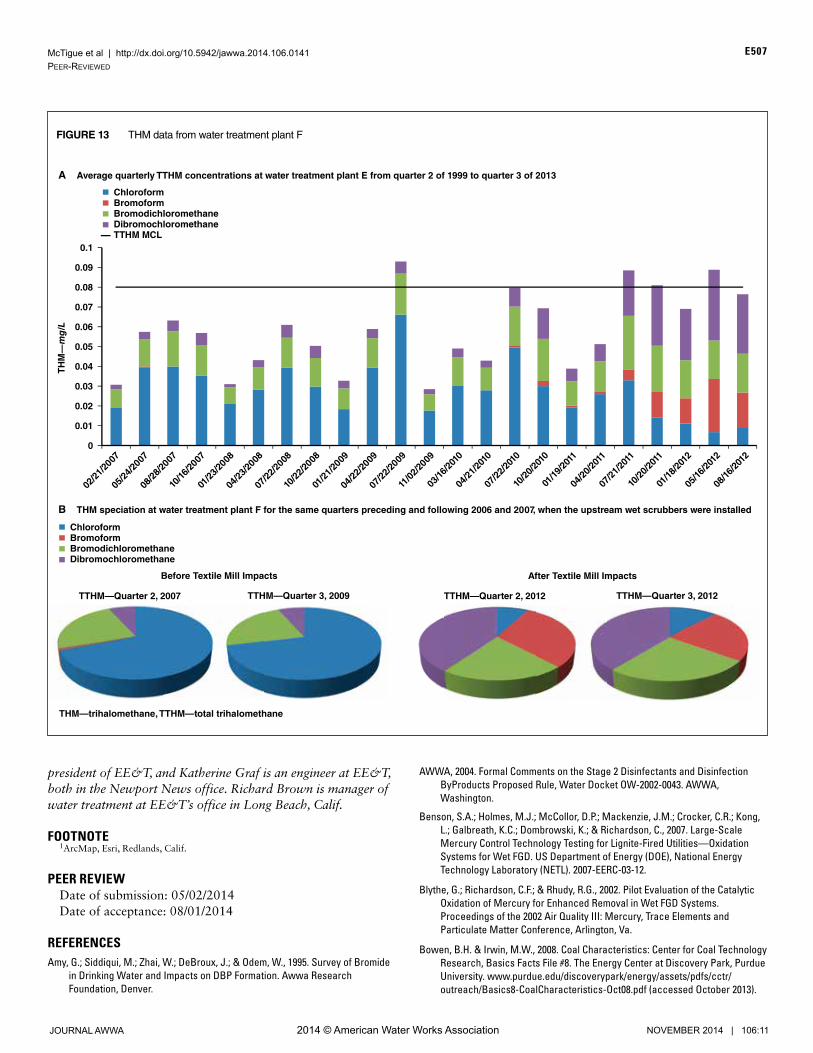
McTigue et al | http://dx.doi.org/10.5942/jawwa.2014.106.0141Peer-Reviewed
E507
2014 © American Water Works AssociationJOURNAL AWWA NOVEMBER 2014 | 106:11
president of EE&T, and Katherine Graf is an engineer at EE&T, both in the Newport News office. Richard Brown is manager of water treatment at EE&T’s office in Long Beach, Calif.
FOOTNOTE1ArcMap, Esri, Redlands, Calif.
PEER REVIEWDate of submission: 05/02/2014Date of acceptance: 08/01/2014
REFERENCESAmy, G.; Siddiqui, M.; Zhai, W.; DeBroux, J.; & Odem, W., 1995. Survey of Bromide
in Drinking Water and Impacts on DBP Formation. Awwa Research Foundation, Denver.
AWWA, 2004. Formal Comments on the Stage 2 Disinfectants and Disinfection ByProducts Proposed Rule, Water Docket OW-2002-0043. AWWA, Washington.
Benson, S.A.; Holmes, M.J.; McCollor, D.P.; Mackenzie, J.M.; Crocker, C.R.; Kong, L.; Galbreath, K.C.; Dombrowski, K.; & Richardson, C., 2007. Large-Scale Mercury Control Technology Testing for Lignite-Fired Utilities—Oxidation Systems for Wet FGD. US Department of Energy (DOE), National Energy Technology Laboratory (NETL). 2007-EERC-03-12.
Blythe, G.; Richardson, C.F.; & Rhudy, R.G., 2002. Pilot Evaluation of the Catalytic Oxidation of Mercury for Enhanced Removal in Wet FGD Systems. Proceedings of the 2002 Air Quality III: Mercury, Trace Elements and Particulate Matter Conference, Arlington, Va.
Bowen, B.H. & Irwin, M.W., 2008. Coal Characteristics: Center for Coal Technology Research, Basics Facts File #8. The Energy Center at Discovery Park, Purdue University. www.purdue.edu/discoverypark/energy/assets/pdfs/cctr/outreach/Basics8-CoalCharacteristics-Oct08.pdf (accessed October 2013).
FIGURE 13 THM data from water treatment plant F
A Average quarterly TTHM concentrations at water treatment plant E from quarter 2 of 1999 to quarter 3 of 2013
Before Textile Mill Impacts
THM—trihalomethane, TTHM—total trihalomethane
After Textile Mill Impacts
B THM speciation at water treatment plant F for the same quarters preceding and following 2006 and 2007, when the upstream wet scrubbers were installed
ChloroformBromoformBromodichloromethaneDibromochloromethaneTTHM MCL
ChloroformBromoformBromodichloromethaneDibromochloromethane
TTHM—Quarter 2, 2007 TTHM—Quarter 2, 2012TTHM—Quarter 3, 2009 TTHM—Quarter 3, 2012
02/21
/2007
05/24
/2007
08/28
/2007
10/16
/2007
01/23
/2008
04/23
/2008
07/22
/2008
10/22
/2008
01/21
/2009
04/22
/2009
07/22
/2009
11/02
/2009
03/16
/2010
04/21
/2010
07/22
/2010
10/20
/2010
01/19
/2011
04/20
/2011
07/21
/2011
10/20
/2011
01/18
/2012
05/16
/2012
08/16
/2012
TH
M―
mg
/L
0
0.01
0.02
0.03
0.04
0.05
0.06
0.07
0.08
0.09
0.1

McTigue et al | http://dx.doi.org/10.5942/jawwa.2014.106.0141Peer-Reviewed
E508
2014 © American Water Works AssociationJOURNAL AWWA NOVEMBER 2014 | 106:11
Bowen, H.J.M., 1979. Environmental Chemistry of the Elements. Academic Press, London.
Buschmann, J.; Lindau, L.; & Vosteen, B.W., 2005. The KNXTM Coal Additive Technology: A Simple Solution for Mercury Emissions Control. ALSTOM Power Inc. www.vosteen-consulting.de/downloads/2005_12_Vosteen_Consulting_KNX_TM_Coal_Additive_Technology_PowerGen_USA.pdf (accessed October 2013).
Bustard, C.J.; Renninger, S.; Chang, R.; Miller, R.; Monroe, L.; & Sjostrom, S., 2003. Results of Activated Carbon Injection for Mercury Control Upstream of a COHPAC Fabric Filter. 2003 Air &Waste Management Association/USEPA/USDOE/Electric Power Research Institute Power Plant Air Pollutant Control Mega Symposium, Washington.
Cantor, K.P.; Villanueva, C.M.; Silverman, D.T.; Figueroa, J.D.; Real, F.X.; Garcia-Closas, M.; Malats, N.; Chanock, S.; Yeager, M.; Tardon, A.; Garcia-Closas, R.; Serra, C.; Carrato, A.; Castaño-Vinyals, G.; Samanic, C.; Rothman, N.; & Kogevinas, M., 2010. Polymorphisms in GSTT1, GSTZ1, and CYP2E1 Disinfection By-products, and Risk of Bladder Cancer in Spain. Environmental Health Perspective, 118:11:1545. http://dx.doi.org/10.1289/ehp.1002206.
Chang, R.; Dombrowski, K.; & Senior, C., 2008. Near and Long Term Options for Controlling Mercury Emissions from Power Plants. Proceedings of the 2008 Power Plant Air Pollutant Control Mega Symposium, Baltimore.
Environmental Law Clinic, University of Pittsburgh School of Law. 2009. Wastewater Treatment Facilities. www.pennfuture.org/UserFiles/File/Marcellus_WaterTreatment_20090715.xls (accessed October 2013).
Ferrar, K.J.; Michanowicz, D.R.; Christen, C.L.; Mulcahy, N.; Malone, S.L.; & Sharma, R.K., 2013. Assessment of Effluent Contaminants From Three Facilities Discharging Marcellus Shale Wastewater to Surface Waters in Pennsylvania. Environmental Science & Technology, 47:7:3472.
Frazier, R.R. & Murray, A., 2011. Salts From Drilling, a Drinking Water Danger, Still Showing Up in Rivers. The Allegheny Front. Dec. 2, 2011.
Greune, A. & Knappe, D., 2013. Bromide Occurrence in North Carolina Surface Waters. Master’s thesis. North Carolina State University, Raleigh, N.C.
Hayes, T., 2009. Sampling and Analysis of Water Streams Associated With the Development of Marcellus Shale Gas. Report for the Marcellus Shale Coalition, Gas Technology Institute, Des Plaines, Ill.
Jolley, R.L., 1975. Chlorine-Containing Organic Constituents in Chlorinated Effluents. Journal of the Water Pollution Control Federation, 47:3:601.
Kellie, S.; Cao, Y.; Duan, Y.; Li, L.; Chu, P.; Mehta, A.; Carty, R.; Riley, J.T.; & Pan, W-P., 2005. Factors Affecting Mercury Speciation in a 100-MW Coal-Fired Boiler with Low-NOX Burners. Energy Fuels, 19:3:800. http://dx.doi.org/10.1021/ef049769d.
McGuire, M.J.; McLain, J.L.; & Obolensky, A., 2002. Information Collection Rule Data Analysis. Awwa Research Foundation & AWWA, Denver.
Mcilvaine Company, 2012. Big Market for Chemicals to Capture Mercury. Pollution Solutions. www.pollutionsolutions-online.com (accessed October 2013).
Miller C.E.; Feeley, T.J. III; Aljoe, W.W.; Lani, B.W.; Schroeder, K.T.; Kairies, C.; McNemar, A.T.; Jones, A.P.; & Murphy, J.T., 2006. Mercury Capture and Fate
Using Wet FGD at Coal-Fired Power Plants. netl.doe.gov/File%20Library/Research/Energy%20Analysis/Publications/MercuryCaptFateWetFGDatCFPP-WhitePaper-Final.pdf (accessed August 2014).
Office of Environmental Health Hazard Assssment (OEHHA), 2009. Cancer Potency Values. oehha.ca.gov/risk/pdf/TCDBcas061809.pdf (accessed October 2013).
Robart, C.J., 2012. Water Management Economics in the Development and Production of Shale Resources. International Association for Energy Economics (IAEE) Energy Forum. www.iaee.org/en/publications/fullnewsletter.aspx?id=21 (accessed August 2014).
States, S.; Cyprych, G.; Stoner, M.; Wydra, F.; Kuchta, J.; Monnell, J.; & Casson, L., 2012. Marcellus Shale Drilling and Brominated THMs in Pittsburgh, Pa., Drinking Water. Journal AWWA, 105:8:E432. http://dx.doi.org/10.5942/jawwa.2013.105.0093.
USDOE, 2012. Annual Energy Outlook 2012. Energy Information Administration. Energy Information Agency. www.eia.gov/forecasts/aeo (accessed October 2013).
US Energy Information Administration (USEIA), 2013a. How Much Coal, Natural Gas, or Petroleum Is Used to Generate a Kilowatt-Hour of Electricity? www.eia.gov/tools/faqs/faq.cfm?id=667&t=2 (accessed October 2013).
USEIA, 2013b. 2012 Brief: Coal Prices and Production in Most Basins Down in 2012. www.eia.gov/todayinenergy/detail.cfm?id=9570 (accessed October 2013).
USEIA, 2013c. Power Plant Operations Report: Instructions. Form EIA-923. www.eia.gov/electricity/data/eia923/; zip file 2013M:EIA-923(accessed October 2013).
USEIA, 2011. Form EIA-860. USDOE, Washington. www.eia.gov/electricity/data/eia860/; zip file 2011 (accessed October 2013).
USEPA, 2013. Key Documents About Mid-Atlantic Oil and Gas Extraction. www.epa.gov/region03/marcellus_shale (accessed October 2013).
USEPA, 2012. National Emissions Standards for Hazardous Air Pollutants from Coal- and Oil-Fired Electrical Generating Units (40 CFR 60 and 63). Federal Register, 77:32:9304.
USEPA, 2011. Regulatory Impact Analysis for the Final Mercury and Air Toxics Standards (EPA-452/R-11-011). www.epa.gov/mats/pdfs/20111221MATSfinalRIA.pdf (accessed October 2013).
USEPA, 2006. Stage 2 Disinfectants and Disinfection Byproducts Rule: National Primary and Secondary Drinking Water Regulations: Final Rule. Federal Register, 71:2:388.
Weinberg, H.S.; Krasner, S.W.; Richardson, S.D.; & Thruston, A.D., 2002. The Occurrence of Disinfection By-Products (DBPs) of Health Concern in Drinking Water: Results of a Nationwide DBP Occurrence Study. (EPA/600/R-02/068). http://epa.gov/athens/publications/reports/EPA_600_R02_068.pdf (accessed October 2013).
Wilson, J.M. & VanBriesen, J.M., 2012. Oil and Gas Produced Water Management and Surface Drinking Water Sources in Pennsylvania. Environmental Practice, 14:4:288. http://dx.doi.org/10.1017/S1466046612000427.

Appendix E June 10, 2016 technical memo titled “Data Collection and Estimation of Bromide
Loading from Coal-fired Power Plants”.
This document is a partial draft of ongoing work that is currently undergoing peer review. The final article will be presented to EPA once it is published.

June 10, 2016
AWWA Bromide Modeling Engineering Memorandum - 01 EE&T Project No. 5332
Subject: Data Collection and Estimation of Bromide Loading from Coal-fired Power Plants
INTRODUCTION:
The impact of increased brominated disinfectant by-products (DBPs) on drinking water
has been evaluated in previous studies (McTigue et al. 2014). Occurrence of these DBPs
correlates with bromide-containing waste discharges from coal-fired power plants and other
industrial sources. As per the 2015 AWWA study (Project no. 005327-301), currently 112 coal-
fired power plants across the U.S. impact 257 surface drinking water systems. As per this
database, most of the power plants are situated near the Ohio River basin.
EE&T is developing water quality models for parts of the Ohio River (Indiana,
Kentucky), parts of the Dan River (Virginia, North Carolina), and Lake Moultrie (South
Carolina) to evaluate the impact of bromide discharges from coal-fired power plants near these
waterbodies to downstream drinking water utilities. Of the 112 coal-fired power plants, 13 power
plants (11- Ohio River, 1- Dan River, and 1- Lake Moultrie) are considered for this study. Table
1 provides some general information on all of these 13 power plants.
Because the Ohio River basin contains most of the 112 coal-fired power plants expected
to impact drinking water systems, the majority current research with respect to evaluating
bromide loadings from power plants is focused on the Alleghany- Upper Ohio- Middle Ohio
region of the river. There is little in the literature to address impacts from bromide discharges on
the Lower Ohio region. Therefore, this study focuses on 11 power plants situated in this region to
provide a more complete picture of bromide discharges to the entire Ohio River system. In
addition to the Ohio River analysis, this research includes analysis of a smaller river (Dan River)
to investigate the dynamics of bromide in smaller watersheds.

In addition to the river analyses, this study includes analysis of the impact of bromide
discharges from power plants on a lake that is utilized as a surface water source for drinking
water. Transport of substances through lakes varies greatly with respect to rivers in that lakes
exhibit significant vertical gradients in temperature and other water variables. Lakes can often
become sinks for nutrients, toxicants, and other substances in incoming rivers, resulting in one of
the most significant water quality problems in water system- eutrophication.
This memorandum discusses the initial phase of development of the water quality model
with respect to data collection efforts for the three study sites (Ohio River, Dan River and Lake
Moultrie).
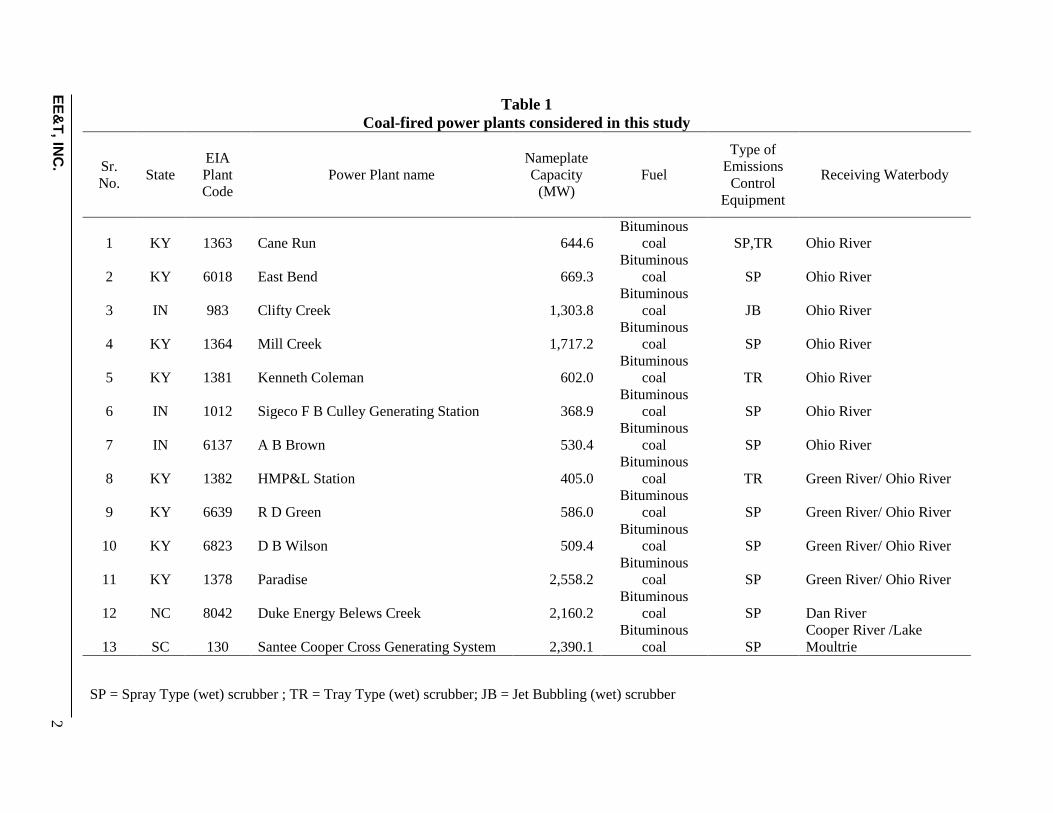
Table 1 Coal-fired power plants considered in this study
Sr. No.
State EIA Plant Code
Power Plant name Nameplate Capacity
(MW) Fuel
Type of Emissions
Control Equipment
Receiving Waterbody
1 KY 1363 Cane Run 644.6 Bituminous
coal SP,TR Ohio River
2 KY 6018 East Bend 669.3 Bituminous
coal SP Ohio River
3 IN 983 Clifty Creek 1,303.8 Bituminous
coal JB Ohio River
4 KY 1364 Mill Creek 1,717.2 Bituminous
coal SP Ohio River
5 KY 1381 Kenneth Coleman 602.0 Bituminous
coal TR Ohio River
6 IN 1012 Sigeco F B Culley Generating Station 368.9 Bituminous
coal SP Ohio River
7 IN 6137 A B Brown 530.4 Bituminous
coal SP Ohio River
8 KY 1382 HMP&L Station 405.0 Bituminous
coal TR Green River/ Ohio River
9 KY 6639 R D Green 586.0 Bituminous
coal SP Green River/ Ohio River
10 KY 6823 D B Wilson 509.4 Bituminous
coal SP Green River/ Ohio River
11 KY 1378 Paradise 2,558.2 Bituminous
coal SP Green River/ Ohio River
12 NC 8042 Duke Energy Belews Creek 2,160.2 Bituminous
coal SP Dan River
13 SC 130 Santee Cooper Cross Generating System 2,390.1 Bituminous
coal SP Cooper River /Lake Moultrie
SP = Spray Type (wet) scrubber ; TR = Tray Type (wet) scrubber; JB = Jet Bubbling (wet) scrubber
EE
&T
, INC
. 2

EE&T, INC. 4
Segment 1 of Ohio River Ci (initial/ambient Br concentration)
Br loading
from powerplant
Co (output Br concentration)
Mass Balance Diagram
MODEL USED: CE-QUAL W2
For this project, the CE-QUAL W2 Version 3.72 model was used to model the sources
loads of bromide in parts of the Ohio River, Dan River and Lake Moultrie. CE-QUAL W2 is a
water quality and hydrodynamic model for two dimensional (longitudinal-vertical) simulation of
basic water quality parameters relevant to eutrophication processes such as temperature, nutrient,
algae, dissolved organic matter for rivers, estuaries, lakes, reservoirs, and river basins systems.
CE-QUAL W2 is capable of modeling generic water quality constituents with zero- or first-order
decay rates (i.e. rate of reaction is proportional to the concentration of the substance reacting) in
both stratified and non-stratified systems. .
The CE-QUAL W2 model is free for download at http://www.ce.pdx.edu/w2/. This
model uses simplified bathymetry (e.g. average width, constant depth, constant slope) to
represent the water body being modeled. Figure 1 shows a simplified mass-balance diagram for
the model application.
Figure 1 Mass balance diagram
RIVER DATA
Table 2 describes all of the data required to run the CE-QUAL-W2 model and the source
of the data. The topographic and streamflow data for the Ohio River in Indiana and Kentucky
has been downloaded. Data for the other waterbodies (Dan River and Lake Moultrie) is being

EE&T, INC. 5
researched upon currently. The U.S. Energy Information Administration (EIA) website was used
to access information regarding the current operable coal-fired power plants across the U.S.
Table 2
Data (input parameters) for model application
Sr. No.
Data Type Input Data Required
or optional
Status Data Source
1 Geometric
Data
Topo map
R
Downloaded http://geospatial.ohiodnr.gov/data-metadata/search-by-category
Volume-area elevation table To be calculated Computational grid To be calculated Bathymetric data To be calculated
2 Initial
Conditions
Starting and ending time R To be calculated Temperature and concentration R Inflows/outflows O Restart O Waterbody type R Downloaded http://nhd.usgs.gov/wbd.html
Ice thickness O
3 Boundary Conditions
Inflows - O Downloaded http://waterdata.usgs.gov/nwis/sw
Upstream inflows
Tributary inflows
Distributed tributary inflows
Precipitation
Internal inflows
Outflows- O Downloaded http://waterdata.usgs.gov/nwis/sw
Downstream outflows
Lateral withdrawals
Evaporation
Internal outflows
Head Boundary Conditions - O External
Internal
Surface Boundary Conditions- R Available Surface heat exchange [ lat, long, air temp, dew point temp, wind speed & dir , cloud cover]
https://www.ncdc.noaa.gov/cdo-web/datasets
Solar radiation absorption
Wind stress
https://www.ncdc.noaa.gov/cdo-web/datasets
Gas exchange
4 Hydraulic Parameters
Dispersion/ diffusion coefficients R Available
Literature review - Principles of Surface Water Quality Modeling and Control Bottom friction R
5 Kinetic Parameters
Appendix C O Available CE-QUAL W2 Manual
6 Calibration Data
2 sets of data R To be obtained
R – Required; O – Optional

EE&T, INC. 6
BROMIDE LOADING EVALUATION
Bromide loading from power plant discharges results from two primary sources: 1)
bromide naturally present in coal, and 2) bromide added to coal (in the form of calcium bromide
salts) to facilitate oxidation of mercury in the flue gas stream to comply with Clean Air Act
requirements. Bromide may also be added to wet scrubbers (in the form of sodium bromide
salts) to control biofouling, but this is still currently being research and is not considered as a
source in this study.
Example calculations for bromide loading from one of the power plants (Cane Run
Power Plant) considered in this study is presented in the section below as an example. This
procedure will be extended to the other 12 power plants for calculating the bromide loading
resulting from their discharges.
Bromide Naturally Present in Coal
Halogens (Bromide, Chloride and Iodide) are naturally present in coal in varying
amounts. The amount of bromide content in coal tends to vary based on the rank of coal (USGS
2012). Although data on bromine content in coal are limited and are generally not reported by
specific rank of coal, (Vassilev et al. 2000) the bromine to chlorine ratio is relatively constant in
different coal ranks at 0.02 Br/Cl. Since data on the chlorine content by coal rank is more
extensively available, the bromide content of coal used for this study was calculated based on the
coal rank and chlorine content, using the 0.02 Br/Cl ratio.
The Cane Run power plant in Kentucky (owned by Louisville Gas & Electric Co.)
situated less than half a mile from the Ohio River, discharges the wastewater from its cooling
towers into the Ohio River. The plant utilizes spray type (SP) and tray type (TR) wet scrubbers
as part of its emissions control equipment. The primary source of fuel used at Cane Run power
plant is bituminous coal. The chlorine content of this type of coal varies from 400 ppm to 2,900
ppm with an average chlorine content of 550 ppm. Assuming a bromine/chlorine ratio of 0.02,
the bromine content in coal was calculated with minimum, average, and maximum values of 8
ppm, 11ppm, and 58 ppm.
Based on the estimated bromine content in coal, the bromide content in the Cane Run
discharge into the Ohio River resulting from naturally occurring coal was calculated. Coal

EE&T, INC. 7
consumption data for the Cane Run power plant was obtained from the U.S. Energy Information
Administration (EIA) Form 923 for the year 2014. Cane Run has currently three operable coal-
fired units using bituminous coal. The coal consumption data for all of the units for each month
were totaled to provide monthly coal consumption and then divided by the number of days in
each month to determine average daily coal consumption. These data were reported on a “wet-
basis” and converted to dry-basis assuming average moisture content of 6.5 percent [NETL
2012].
Based on literature review, 90.2 percent of bromide in dry coal is in the gas phase post-
combustions and makes it to the FGD system (Peng et al. 2013). Capture of this 90.2 percent
bromide in the flue gas stream was assumed to be at 77 percent (minimum), 84 percent
(average), and 100 percent (maximum) [Meij, 1994]. These data and assumptions were utilized
to compute the average daily bromide load in kg/day (refer to the sample calculations below).
Bromide Addition (In the form of Calcium Bromide Salts) to Coal in Boiler Units
The USEPA issued a more stringent regulation with regards to mercury emissions from
coal-fired power plants in 2011 known as MATS (Mercury and Air Toxic Standards) [US EPA
2011MATS]. To comply with these regulations, various new technologies are being
implemented that facilitate oxidation of mercury in the flue gas stream. One of the most effective
methods to promote mercury oxidation is the addition of Calcium Bromide salts (CaBr2) to the
coal either prior to combustion, in the boiler units or upstream of scrubbers. The concentration of
CaBr2 added as bromide depends on a number of factors such as the type of coal used and the
type of emissions control equipment used in the power plant. The average range of Br
concentration for bituminous coal considered in this study is 250-350 ppm (Dombrowski et. al
2010).
Bromide Addition (In the form of Sodium Bromide Salts) in Scrubber Units
Bromide is added to scrubber units in power plants as Sodium Bromide salts to control
biofouling issues. The amount of Bromide added to the scrubbers units is currently being
researched upon and hence is not included in the loading calculations.

EE&T, INC. 8
Sample Calculations: Loading from Bromide Present in Coal (for Cane Run Power Plant)
1. Chlorine content in coal: 400 ppm
2. Bromine to Chlorine ratio: 0.02
3. Bromine content in coal: 8 ppm
4. Bromine utilized in FGD system: 90.20% = 7.22 ppm
5. Bromine capture in the flue gas stream: 77% of 90.20% utilized = 5.56 ppm
6. Coal consumption at Cane Run plant in January 2014 = 119.89 million-kg (wet basis)
(Form 923)
7. Average daily coal consumption at Cane Run in January 2014:
119.89 × 10⁶ kg
month×
month31 days
=3.86 × 10⁶ kg coal (wet basis)
day
8. Average moisture content of coal (based on bituminous range 1- 12%) = 6.5 %
9. Daily coal consumption (dry–basis):
3.86 × 10⁶ kg coal (wet basis)
day ×
(100 − 6.5)100
= 3.62 × 10⁶ kg coal (dry basis)
day
10. Estimated Bromide loading:
5.55 ppm ×1
106 kgkg
×3.62× 10⁶ kg coal (dry basis)
day=20.09
kgday
Br
Thus loading from natural Br content in coal = 20.09 kg/day Br

EE&T, INC. 9
Sample Calculations: Loading from Bromide addition in form of CaBr2 salts (for Cane Run
Power Plant)
1. Bromine capture in the flue gas stream: 77%
2. CaBr2 addition as Br in the boiler = 300 ppm
3. Coal consumption at Cane Run plant in January 2014 = 119.89 million-kg (wet basis)
(Form 923)
4. Average daily coal consumption at Cane Run in January 2014:
119.89 × 10⁶ kg
month×
month31 days
=3.86 × 10⁶ kg coal (wet basis)
day
5. Average moisture content of coal (based on bituminous range 1- 12%) = 6.5 %
6. Daily coal consumption (dry–basis):
3.86 × 10⁶ kg coal (wet basis)
day ×
(100 − 6.5)100
= 3.62 × 10⁶ kg coal (dry basis)
day
7. Estimated Bromide loading:
77%× �� 300 ppm× 1
106kgkg�×3.62× 10⁶
kg coal (dry basis)day
�
=835.30 kg
day Br in dry coal
Therefore, total loading of bromide from the Cane Run Power Plant discharge is:
Loading from added Br content = 835.30 kg/day Br
Total Br loading = 20.09 + 835.30 = 855.39 kg/day Br

EE&T, INC. 10
REFERENCES
Bowen, B. H.; Irwin, M. W. Coal Characteristics; CCTR Basic Facts File #8; West Lafayette, Indiana, 2008.
Chang, R. et al. 2008. Near and Long Term Options for Controlling Mercury Emissions from Power Plants. Proceedings of the Power Plant Air Pollutant Control “Mega” Symposium, Baltimore, MD, August 25-28, 2008
Dombrowski, K.; Paradis, J.; Corporation, U. R. S.; Blvd, A.; Looney, B.; Sibley, A. F.; Services, S. C.; Box, P. O.; Chang, R. Evaluation of Mercury Control Technologies at a Power Plant without SCR Firing Eastern Bituminous Coal; URS Power Technical Paper; Paper #77; San Francisco, CA.
Kolker, A.; Quick, J. C. Mercury and Halogens in Coal. In Mercury Control: for Coal- 616 Derived Gas Streams; Granite, E. J., Pennline, H. W., Senior, C., Eds.; Wiley-VCH 617 Verlag GmbH & Co.: Weinheim, Germany, 2015; pp 13–44.
Lowrie, R. L. SME Mining Reference Handbook; Society for Mining, Metallurgy, and Exploration, Inc.: Littleton, Colorado, 2002.
Meij, R. Trace element behavior in coal-fired power plants. Fuel Process. Technol. 1994, 572 39 (1-3), 199–217.
McTigue, N. E.; Cornwell, D. A.; Graf, K.; Brown, R. Occurrence and consequences of increased bromide in drinking water sources. J. Am. Water Works Assoc. 2014, 106, 492– 481508.
National Energy Technology Laboratory. Quality Guidelines for Energy System Studies: Detailed Coal Specifications; DOE/NETL-401/012111; 2012.
Peng, B.-X.; Li, L.; Wu, D.-S. Distribution of bromine and iodine in thermal power plant. 563 J. Coal Sci. Eng. 2013, 19 (3), 387–391.
U.S. Energy Information Administration. Form EIA-923 detailed data.
US EIA. 2013a. How Much Coal, Natural Gas, or Petroleum Is Used to Generate a Kilowatt-hour of Electricity? Web. http://www.eia.gov/tools/faqs/faq.cfm?id=667&t=2.
US EPA. 2011 Basic Information about Mercury and Air Toxics Standards Web https://www.epa.gov/mats/basic-information-about-mercury-and-air-toxics-standards Accessed June 10, 2016
U.S. Geological Survey Mercury and Halogens in Coal- Their Role in Determining Mercury Emissions From Coal Combustion; 2012