postsecondary institutions and cost of attendance in 2017 ... · postsecondary institutions and...
TRANSCRIPT
U.S. DEPARTMENT OF EDUCATIONNCES 2018-060
Postsecondary Institutions and Cost of Attendance in 2017–18; Degrees and Other Awards Conferred, 2016–17; and 12-Month Enrollment, 2016–17
First Look (Preliminary Data)


Postsecondary Institutions and Cost of Attendance in 2017–18; Degrees and Other Awards Conferred, 2016–17; and 12-Month Enrollment, 2016–17 First Look (Preliminary Data) MAY 2018 Scott A. Ginder Janice E. Kelly-Reid Farrah B. Mann RTI International
NCES 2018-060 U.S. DEPARTMENT OF EDUCATION

U.S. Department of Education Betsy DeVos Secretary
Institute of Education Sciences Thomas Brock Commissioner for Education Research Delegated Duties of the Director
National Center for Education Statistics James L. Woodworth Commissioner
Administrative Data Division Ross Santy Associate Commissioner
The National Center for Education Statistics (NCES) is the primary federal entity for collecting, analyzing, and reporting data related to education in the United States and other nations. It fulfills a congressional mandate to collect, collate, analyze, and report full and complete statistics on the condition of education in the United States; conduct and publish reports and specialized analyses of the meaning and significance of such statistics; assist state and local education agencies in improving their statistical systems; and review and report on education activities in foreign countries.
NCES activities are designed to address high-priority education data needs; provide consistent, reliable, complete, and accurate indicators of education status and trends; and report timely, useful, and high-quality data to the U.S. Department of Education, the Congress, the states, other education policymakers, practitioners, data users, and the general public. Unless specifically noted, all information contained herein is in the public domain.
We strive to make our products available in a variety of formats and in language that is appropriate to a variety of audiences. You, as our customer, are the best judge of our success in communicating information effectively. If you have any comments or suggestions about this or any other NCES product or report, we would like to hear from you. Please direct your comments to
NCES, IES, U.S. Department of Education Potomac Center Plaza 550 12th Street SW Washington, DC 20202
May 2018
The NCES Home Page address is http://nces.ed.gov. The NCES Publications and Products address is http://nces.ed.gov/pubsearch.
This publication is only available online. To download, view, and print the report as a PDF file, go to the NCES Publications and Products address shown above.
This report was prepared for the National Center for Education Statistics under Contract No. ED-IES-13-C-0056 with RTI International. Mention of trade names, commercial products, or organizations does not imply endorsement by the U.S. Government.
Suggested Citation Ginder, S.A., Kelly-Reid, J.E., and Mann, F.B. (2018). Postsecondary Institutions and Cost of Attendance in 2017–18; Degrees and Other Awards Conferred, 2016–17; and 12-Month Enrollment, 2016–17: First Look (Preliminary Data) (NCES 2018-060). U.S. Department of Education. Washington, DC: National Center for Education Statistics. Retrieved [date] from http://nces.ed.gov/pubsearch.
Content Contact Aurora D’Amico (202) 502-7334 [email protected]

iii
Acknowledgments The authors would like to recognize the contributions of the postsecondary institutions and their representatives who provided the data upon which this report is based. This report would not have been possible without their invaluable contributions.
iv
Contents
Page
Acknowledgments ........................................................................................................................ iii
List of Tables ..................................................................................................................................v
Introduction ....................................................................................................................................1 IPEDS 2017–18 ............................................................................................................................1 Institutional Characteristics, Cost of Attendance, and Tuition and Fees ......................................2 Completions ..................................................................................................................................2 12-Month Enrollment ...................................................................................................................2
Selected Findings ............................................................................................................................3
Tables ..............................................................................................................................................4
Appendix A: Data Collection Procedures ............................................................................... A-1
Appendix B: Glossary of Terms ...............................................................................................B-1

v
List of Tables
Page 1. Number and percentage distribution of Title IV institutions, by control of institution,
level of institution, and region: United States and other U.S. jurisdictions, academic year 2017–18 ........................................................................................................................4
2. Average costs (in constant 2017–18 dollars) associated with attendance for full-time, first-time degree/certificate-seeking undergraduates at Title IV institutions operating on an academic year calendar system, and percentage change, by level of institution, type of cost, control of institution, residency, and student housing: United States, academic years 2015–16 and 2017–18 ................................................................................5
3. Number and percentage of awards conferred and students receiving awards at Title IV degree-granting institutions, by control of institution, level of institution, gender, race/ethnicity, and level of award: United States, 2016–17 ....................................6
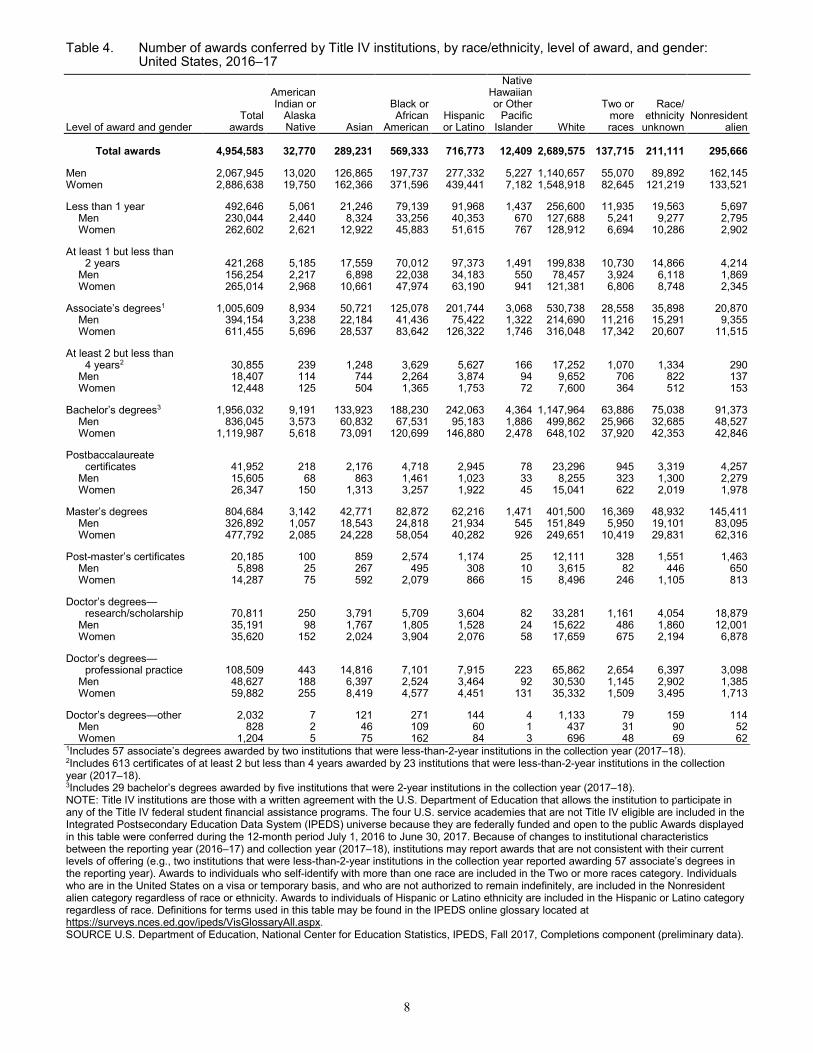
4. Number of awards conferred by Title IV institutions, by race/ethnicity, level of award, and gender: United States, 2016–17.........................................................................8
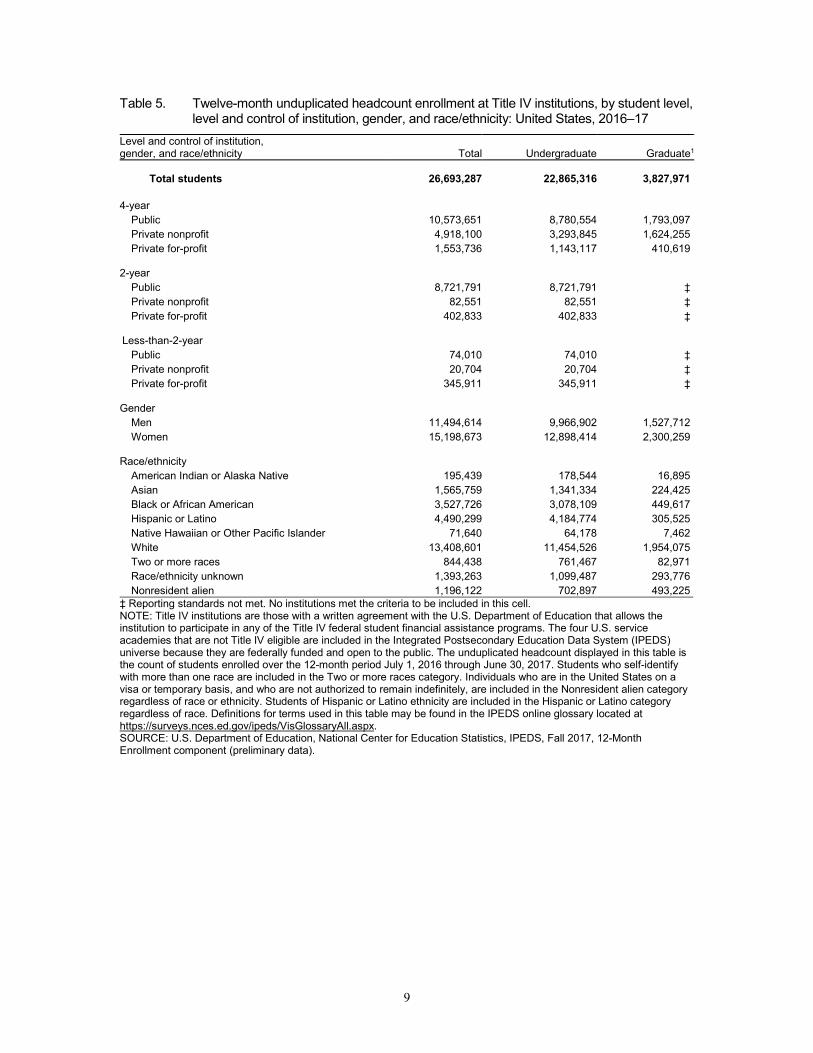
5. Twelve-month unduplicated headcount enrollment at Title IV institutions, by student level, level and control of institution, gender, and race/ethnicity: United States, 2016–17................................................................................................................................9
6. Twelve-month full-time-equivalent enrollment at Title IV institutions, by student level and institution sector: United States, 2016–17 ..........................................................10

1
Introduction The Integrated Postsecondary Education Data System (IPEDS) collects institution-level data from postsecondary institutions in the United States (50 states and the District of Columbia) and other United States jurisdictions.1 This First Look presents findings from the preliminary data of the IPEDS fall 2017 data collection, which included three survey components: Institutional Characteristics, Completions, and 12-Month Enrollment. Data for all components were collected through the IPEDS web-based data collection system.
The Institutional Characteristics component collected basic information on the characteristics of institutions for the academic year 2017–18. The Completions component collected data on the number of degrees and certificates awarded by level of award, field of study, race/ethnicity, and gender between July 1, 2016 and June 30, 2017. The 12-Month Enrollment component collected the unduplicated count of students enrolled and the instructional activity of institutions for the 12-month period July 1, 2016 to July 30, 2017. A brief summary of the fall 2017–18 survey components is included in this report, and data collection procedures are summarized in appendix A. Detailed information about the study methodology can be found at http://nces.ed.gov/pubsearch/pubsinfo.asp?pubid=2018195.
This First Look provides users with access to IPEDS data soon after the close of data collection. This report is based upon preliminary data that have not been extensively reviewed or edited. Provisional data containing fully reviewed, edited, and imputed data will be released approximately 3 months after the preliminary data. Final data, including revisions to the provisional data submitted by institutions after the close of data collection, will be available during the next collection year (2018-19).
The purpose of this report is to introduce new data through tables containing descriptive information such as totals, averages, and percentages. The findings presented here demonstrate the range of information available through IPEDS; they include only a sample of the information collected and are not meant to emphasize any particular issue. While only a few of the data included in the fall 2017 collection are displayed in this First Look, all data from the fall 2017 collection are publicly available through the IPEDS “Use the Data” page, found at http://nces.ed.gov/ipeds/Home/UseTheData.
IPEDS 2017–18
Participation in IPEDS was required for institutions and administrative offices that participated in Title IV federal student financial aid programs such as Federal Pell Grants or Direct Stafford Loans during the 2017–18 academic year.2 A total of 6,642 Title IV institutions and 73 administrative offices (central or system offices) in the United States and other United States
1 The other United States jurisdictions are American Samoa, the Commonwealth of the Northern Mariana Islands, the Federated States of Micronesia, Guam, the Marshall Islands, Palau, Puerto Rico, and the U.S. Virgin Islands. 2 Institutions participating in Title IV programs are accredited by an agency or organization recognized by the Secretary of the U.S. Department of Education, have a program of more than 300 clock hours or 8 credit hours, have been in business for at least 2 years, and have a signed Program Participation Agreement with the Office of Postsecondary Education, U.S. Department of Education.
2
jurisdictions were expected to participate in the fall collection. The data in table 1 include all 6,642 institutions in the United States and other United States jurisdictions, and tables 2 through 6 focus on the 6,502 of these institutions that are in the United States.
Detailed definitions of terms used in this report are available in the glossary (appendix B).
Institutional Characteristics, Cost of Attendance, and Tuition and Fees
The Institutional Characteristics (IC) component of IPEDS collects and maintains information used to classify postsecondary institutions based on a variety of characteristics. IC data include institution level (4-year, 2-year, less-than-2-year), control (public, private nonprofit, private for-profit), and sector (level crossed with control), which allow classification within general categories. Additional data collected (not all of which are reported here) include types of programs offered (e.g., occupational, academic, continuing professional), opportunities for distance education, levels of degrees and awards, calendar system, admission requirements, and student charges.
The IC component collects data on tuition and fees (by level of program, i.e., undergraduate and graduate) and room and board charges. In addition, the broader cost of attendance is also collected for full-time, first-time degree/certificate-seeking undergraduate students. Cost of attendance is the total amount institutions estimate that undergraduate-level full-time, first-time degree/certificate-seeking students will pay to attend college before financial aid is considered. This includes tuition and fees, books and supplies, room and board, and certain other designated expenses such as transportation. These estimates are the average amounts used by financial aid offices to determine a student’s financial aid.
Completions
The Completions component collects data on the number of degrees and certificates officially conferred3 in postsecondary education programs by level of degree (associate’s, bachelor’s, master’s, and doctor’s) and by length of program for sub-baccalaureate and postbaccalaureate certificates. Doctor’s degrees are further disaggregated into three subcategories: research/ scholarship, professional practice, and other doctor’s degrees. Data are collected on the race/ethnicity and gender of recipients and their programs of study. In addition, the unduplicated count of students receiving the reported number of degrees or certificates is reported by gender, race/ethnicity, age, and award level. The data from this component reflect all formal awards (i.e., degrees, diplomas, certificates) received or conferred between July 1, 2016 and June 30, 2017.
12-Month Enrollment
The data from the 12-Month Enrollment component reflects unduplicated headcount enrollment and instructional activity data at each institution for the 12-month period July 1, 2016 through June 30, 2017. The unduplicated headcount is collected by race/ethnicity, gender, and student level (undergraduate or graduate) for students enrolled during the reporting period.
3 Completions where the requirements for the award have been satisfied but the award has not yet been conferred by the postsecondary institution are not included.

3
Selected Findings • During the 2017–18 academic year, there were 6,642 Title IV institutions in the United States
and other U.S. jurisdictions. Of this total, 2,902 were classified as 4-year institutions, 1,932 were 2-year institutions, and the remaining 1,808 were less-than-2-year institutions (table 1).
• Average tuition and required fees for full-time, first-time degree/certificate-seeking undergraduates at 4-year institutions increased across all institutional controls except private for-profit institutions from 2015–16 to 2017–18 (table 2). After adjusting for inflation,4 public institutions reported a roughly 2 percent increase for in-state students (to approximately $8,300) and for out-of-state students (to approximately $18,700). Private nonprofit institutions reported an increase of approximately 3 percent (to about $28,000). Private for-profit institutions reported average tuition and required fees of approximately $16,200 for 2017–18, which represents a decrease of over 1 percent when compared with the inflation-adjusted figure from 2015–16.
• Of the roughly 3.3 million students receiving degrees or certificates at 4-year Title IV degree-granting institutions, more than 58 percent received a bachelor’s degree (table 3). This percentage varied by control of institution, with approximately 64 percent of the 2.0 million students at public institutions receiving a bachelor’s degree, roughly 53 percent of the 1.1 million students at private nonprofit institutions receiving a bachelor’s degree, and approximately 41 percent of the 277,000 students at private for-profit institutions receiving a bachelor’s degree.
• Across all Title IV institutions, about 5.0 million awards were conferred to students of varying race/ethnicities in 2016–17 (table 4). Of the three largest race/ethnicity groups, White students were conferred the most awards (2.7 million), followed by Hispanic or Latino students (717,000 awards), and Black or African American students (569,000 awards).
• Institutions reported a 12-month unduplicated headcount enrollment totaling approximately 26.7 million individual students (table 5). Of these, roughly 22.9 million were undergraduates and approximately 3.8 million were graduate students.
• Institutions reported a 12-month full-time-equivalent enrollment totaling about 16.2 million students (table 6). Of these, roughly 14.1 million were undergraduates and approximately 2.0 million were graduate students.
4 Table 2 is reported in 2017–18 dollars. Percentage changes in these tables reflect changes over and above changes due to inflation. Refer to appendix A for details.

4
Tables
Table 1. Number and percentage distribution of Title IV institutions, by control of institution, level of institution, and region: United States and other U.S. jurisdictions, academic year 2017–18
Level of institution and region
Number of institutions Percent of institutions
Total Public Private
Total Public Private
Nonprofit For-profit Nonprofit For-profit
Total institutions 6,642 1,973 1,878 2,791 100.0 100.0 100.0 100.0 Total U.S. institutions 6,502 1,955 1,826 2,721 97.9 99.1 97.2 97.5 Level of institution
4-year 2,902 760 1,643 499 43.7 38.5 87.5 17.9 U.S. 2,836 751 1,597 488 42.7 38.1 85.0 17.5 Other U.S. jurisdictions 66 9 46 11 1.0 0.5 2.4 0.4
2-year 1,932 978 159 795 29.1 49.6 8.5 28.5 U.S. 1,905 969 154 782 28.7 49.1 8.2 28.0 Other U.S. jurisdictions 27 9 5 13 0.4 0.5 0.3 0.5
Less-than-2-year 1,808 235 76 1,497 27.2 11.9 4.0 53.6 U.S. 1,761 235 75 1,451 26.5 11.9 4.0 52.0 Other U.S. jurisdictions 47 0 1 46 0.7 0.0 0.1 1.6
Region
New England 373 104 154 115 5.6 5.3 8.2 4.1 Mid East 1,069 274 415 380 16.1 13.9 22.1 13.6 Great Lakes 957 266 292 399 14.4 13.5 15.5 14.3 Plains 556 188 185 183 8.4 9.5 9.9 6.6 Southeast 1,646 541 393 712 24.8 27.4 20.9 25.5 Southwest 708 241 109 358 10.7 12.2 5.8 12.8 Rocky Mountains 258 81 42 135 3.9 4.1 2.2 4.8 Far West 930 255 236 439 14.0 12.9 12.6 15.7 U.S. service academies 5 5 0 0 0.1 0.3 0.0 0.0 Other U.S. jurisdictions 140 18 52 70 2.1 0.9 2.8 2.5
NOTE: Title IV institutions are those with a written agreement with the U.S. Department of Education that allows the institution to participate in any of the Title IV federal student financial assistance programs. The four U.S. service academies that are not Title IV eligible are included in the Integrated Postsecondary Education Data System (IPEDS) universe because they are federally funded and open to the public. Percentages in the columns of this table use the corresponding count in the Total institutions row as the denominator. Data are not imputed. The item response rates for all cells in this table are 100 percent. The New England region includes Connecticut, Maine, Massachusetts, New Hampshire, Rhode Island, and Vermont. The Mid East region includes Delaware, the District of Columbia, Maryland, New Jersey, New York, and Pennsylvania. The Great Lakes region includes Illinois, Indiana, Michigan, Ohio, and Wisconsin. The Plains region includes Iowa, Kansas, Minnesota, Missouri, Nebraska, North Dakota, and South Dakota. The Southeast region includes Alabama, Arkansas, Florida, Georgia, Kentucky, Louisiana, Mississippi, North Carolina, South Carolina, Tennessee, Virginia, and West Virginia. The Southwest region includes Arizona, New Mexico, Oklahoma, and Texas. The Rocky Mountains region includes Colorado, Idaho, Montana, Utah, and Wyoming. The Far West region includes Alaska, California, Hawaii, Nevada, Oregon, and Washington. The other U.S. jurisdictions are American Samoa, the Commonwealth of the Northern Mariana Islands, the Federated States of Micronesia, Guam, the Marshall Islands, Palau, Puerto Rico, and the U.S. Virgin Islands. Detail may not sum to totals because of rounding. Definitions for terms used in this table may be found in the IPEDS online glossary located at https://surveys.nces.ed.gov/ipeds/VisGlossaryAll.aspx. SOURCE: U.S. Department of Education, National Center for Education Statistics, IPEDS, Fall 2017, Institutional Characteristics component (preliminary data).

5
Table 2. Average costs (in constant 2017–18 dollars) associated with attendance for full-time, first-time degree/certificate-seeking undergraduates at Title IV institutions operating on an academic year calendar system, and percentage change, by level of institution, type of cost, control of institution, residency, and student housing: United States, academic years 2015–16 and 2017–18
Type of cost, control of institution, residency, and student housing
4-year 2-year Less-than-2-year
2015–16 2017–18 Percent change 2015–16 2017–18
Percent change 2015–16 2017–18
Percent change
Tuition and required fees
Public In-district1 $8,115 $8,309 2.4 $3,489 $3,600 3.2 $7,263 $7,437 2.4 In-state 8,138 8,336 2.4 4,118 4,235 2.8 7,263 7,437 2.4 Out-of-state 18,317 18,674 2.0 8,004 8,186 2.3 8,322 8,578 3.1
Private nonprofit2 27,108 27,963 3.2 14,360 14,572 1.5 14,639 14,667 0.2 Private for-profit2 16,442 16,200 -1.5 15,003 14,749 -1.7 16,669 17,106 2.6
Books and supplies Public 1,322 1,284 -2.9 1,456 1,447 -0.6 1,060 1,123 5.9 Private nonprofit 1,225 1,192 -2.7 1,423 1,380 -3.0 1,607 1,683 4.7 Private for-profit 1,414 1,293 -8.5 1,659 1,489 -10.3 1,141 1,055 -7.5
Room and board Public
On campus 9,865 10,096 2.3 6,501 6,700 3.1 4,316 6,036 39.8 Off campus (not with family) 9,777 9,857 0.8 8,255 8,409 1.9 8,236 8,265 0.3
Private nonprofit On campus 10,162 10,391 2.3 8,783 9,110 3.7 ‡ ‡ ‡ Off campus (not with family) 9,727 9,940 2.2 9,763 9,657 -1.1 7,437 7,289 -2.0
Private for-profit On campus 10,168 10,550 3.8 9,312 9,241 -0.8 ‡ ‡ ‡ Off campus (not with family) 8,515 8,373 -1.7 8,640 8,428 -2.5 9,974 9,843 -1.3
Other expenses3 Public
On campus 3,411 3,360 -1.5 3,314 3,288 -0.8 1,275 1,200 -5.9 Off campus (not with family) 3,893 3,804 -2.3 4,062 4,001 -1.5 4,499 4,071 -9.5 Off campus (with family) 4,093 3,957 -3.3 4,063 4,030 -0.8 4,322 3,810 -11.8
Private nonprofit On campus 2,923 2,887 -1.2 3,513 3,405 -3.1 ‡ ‡ ‡ Off campus (not with family) 3,658 3,597 -1.6 4,616 4,846 5.0 2,689 3,021 12.4 Off campus (with family) 3,867 3,811 -1.4 4,656 4,659 0.1 1,821 2,193 20.5
Private for-profit On campus 4,169 4,494 7.8 3,124 3,654 17.0 ‡ ‡ ‡ Off campus (not with family) 4,568 4,371 -4.3 5,251 5,243 -0.2 5,190 4,606 -11.2 Off campus (with family) 4,339 3,993 -8.0 4,613 4,523 -2.0 4,126 4,394 6.5
‡ Reporting standards not met. No institutions met the criteria to be included in this cell. 1For public institutions, “in-district” refers to the charges paid by a student who lives in the locality surrounding the institution, such as county. 2For private institutions that reported varying tuitions by residency, out-of-state tuition and required fees were used in the averages displayed in this table. 3“Other expenses” refers to the amount of money needed by a student to cover expenses such as laundry, transportation, and entertainment. NOTE: Title IV institutions are those with a written agreement with the U.S. Department of Education that allows the institution to participate in any of the Title IV federal student financial assistance programs. The four U.S. service academies that are not Title IV eligible are included in the Integrated Postsecondary Education Data System (IPEDS) universe because they are federally funded and open to the public. However, the U.S. service academies are not included in this table. Amounts are institutional averages as reported by the institution, not average amounts paid by students (i.e., charges are not weighted by enrollment). Percentage change was computed using unrounded average costs. The time points displayed in this table were chosen to demonstrate the range of data available from IPEDS for trend analysis, not to emphasize any particular period of change. The 2,371 institutions that follow a calendar system that differs by program or allow continuous enrollment are not included. All amounts from 2015–16 were converted to 2017–18 dollars using the average Consumer Price Index values for the 12-month periods ending in October 2015 and October 2017. Data from both time points in this table are from the same source. Definitions for terms used in this table may be found in the IPEDS online glossary located at https://surveys.nces.ed.gov/ipeds/VisGlossaryAll.aspx. SOURCE: U.S. Department of Education, National Center for Education Statistics, IPEDS, Fall 2017, Institutional Characteristics component (preliminary data).

6
Table 3. Number and percentage of awards conferred and students receiving awards at Title IV degree-granting institutions, by control of institution, level of institution, gender, race/ethnicity, and level of award: United States, 2016–17
Level of institution,1 gender, race/ethnicity, and level of award
All institutions
Public Private
Nonprofit For-profit Awards Students Awards Students Awards Students Awards Students
Number Per-cent Number
Per-cent Number
Per-cent Number
Per-cent Number
Per-cent Number
Per-cent Number
Per-cent Number
Per-cent
All Institutions 4,705,453 100.0 4,351,580 100.0 3,204,892 100.0 2,881,437 100.0 1,113,032 100.0 1,087,785 100.0 387,529 100.0 382,358 100.0
4-year institutions Total 3,435,780 100.0 3,316,309 100.0 2,064,519 100.0 1,973,353 100.0 1,090,014 100.0 1,066,215 100.0 281,247 100.0 276,741 100.0 Gender
Men 1,440,840 41.9 1,386,371 41.8 899,083 43.5 857,591 43.5 445,657 40.9 434,585 40.8 96,100 34.2 94,195 34.0 Women 1,994,940 58.1 1,929,938 58.2 1,165,436 56.5 1,115,762 56.5 644,357 59.1 631,630 59.2 185,147 65.8 182,546 66.0
Race/ethnicity American Indian or Alaska
Native 17,614 0.5 16,900 0.5 11,152 0.5 10,584 0.5 4,352 0.4 4,250 0.4 2,110 0.8 2,066 0.7 Asian 217,044 6.3 208,641 6.3 139,261 6.7 132,893 6.7 65,818 6.0 63,906 6.0 11,965 4.3 11,842 4.3 Black or African American 349,040 10.2 339,652 10.2 184,881 9.0 177,997 9.0 101,464 9.3 99,814 9.4 62,695 22.3 61,841 22.3 Hispanic or Latino 405,250 11.8 387,938 11.7 274,300 13.3 259,369 13.1 92,434 8.5 90,615 8.5 38,516 13.7 37,954 13.7 Native Hawaiian or Other
Pacific Islander 7,943 0.2 7,626 0.2 3,862 0.2 3,619 0.2 2,302 0.2 2,251 0.2 1,779 0.6 1,756 0.6 White 1,899,861 55.3 1,834,316 55.3 1,167,266 56.5 1,116,720 56.6 611,184 56.1 598,244 56.1 121,411 43.2 119,352 43.1 Two or more races 98,928 2.9 94,947 2.9 64,107 3.1 60,968 3.1 27,546 2.5 26,861 2.5 7,275 2.6 7,118 2.6 Race/ethnicity unknown 164,219 4.8 159,179 4.8 63,334 3.1 60,428 3.1 72,798 6.7 71,258 6.7 28,087 10.0 27,493 9.9 Nonresident alien 275,881 8.0 267,110 8.1 156,356 7.6 150,775 7.6 112,116 10.3 109,016 10.2 7,409 2.6 7,319 2.6
Certificates Less than 1 year 89,594 2.6 77,843 2.3 71,604 3.5 60,115 3.0 4,750 0.4 4,579 0.4 13,240 4.7 13,149 4.8 At least 1 but less than
4 years 50,672 1.5 49,174 1.5 26,669 1.3 25,387 1.3 6,764 0.6 6,630 0.6 17,239 6.1 17,157 6.2 Postbaccalaureate or post-
master’s 61,978 1.8 60,183 1.8 32,643 1.6 31,678 1.6 25,361 2.3 24,555 2.3 3,974 1.4 3,950 1.4
Degrees Associate’s degrees 291,497 8.5 283,970 8.6 191,928 9.3 185,420 9.4 44,868 4.1 44,146 4.1 54,701 19.4 54,404 19.7 Bachelor’s degrees 1,956,003 56.9 1,931,387 58.2 1,275,756 61.8 1,255,476 63.6 566,374 52.0 562,147 52.7 113,873 40.5 113,764 41.1 Master’s degrees 804,684 23.4 799,990 24.1 374,387 18.1 372,297 18.9 360,352 33.1 357,963 33.6 69,945 24.9 69,730 25.2 Doctor’s degrees 181,352 5.3 180,978 5.5 91,532 4.4 91,438 4.6 81,545 7.5 81,265 7.6 8,275 2.9 8,275 3.0
See notes at end of table.

7
Table 3. Number and percentage of awards conferred and students receiving awards at Title IV degree-granting institutions, by control of institution, level of institution, gender, race/ethnicity, and level of award: United States, 2016–17—Continued
Level of institution,1 gender, race/ethnicity, and level of award
All institutions
Public Private
Nonprofit For-profit Awards Students Awards Students Awards Students Awards Students
Number Per-cent Number
Per-cent Number
Per-cent Number
Per-cent Number
Per-cent Number
Per-cent Number
Per-cent Number
Per-cent
2-year institutions
Total 1,269,673 100.0 1,035,271 100.0 1,140,373 100.0 908,084 100.0 23,018 100.0 21,570 100.0 106,282 100.0 105,617 100.0 Gender
Men 541,560 42.7 428,056 41.3 500,350 43.9 387,574 42.7 6,403 27.8 6,010 27.9 34,807 32.7 34,472 32.6 Women 728,113 57.3 607,215 58.7 640,023 56.1 520,510 57.3 16,615 72.2 15,560 72.1 71,475 67.3 71,145 67.4
Race/ethnicity American Indian or Alaska
Native 12,193 1.0 9,900 1.0 10,607 0.9 8,344 0.9 330 1.4 308 1.4 1,256 1.2 1,248 1.2 Asian 61,177 4.8 48,202 4.7 56,757 5.0 43,806 4.8 581 2.5 571 2.6 3,839 3.6 3,825 3.6 Black or African American 173,121 13.6 146,846 14.2 139,746 12.3 114,154 12.6 7,326 31.8 6,807 31.6 26,049 24.5 25,885 24.5 Hispanic or Latino 253,000 19.9 199,835 19.3 222,087 19.5 169,101 18.6 2,911 12.6 2,806 13.0 28,002 26.3 27,928 26.4 Native Hawaiian or Other
Pacific Islander 3,449 0.3 2,816 0.3 2,764 0.2 2,149 0.2 122 0.5 109 0.5 563 0.5 558 0.5 White 676,665 53.3 553,177 53.4 628,736 55.1 506,277 55.8 10,272 44.6 9,589 44.5 37,657 35.4 37,311 35.3 Two or more races 32,556 2.6 26,148 2.5 29,522 2.6 23,148 2.5 553 2.4 532 2.5 2,481 2.3 2,468 2.3 Race/ethnicity unknown 39,286 3.1 33,320 3.2 32,819 2.9 26,911 3.0 533 2.3 515 2.4 5,934 5.6 5,894 5.6 Nonresident alien 18,226 1.4 15,027 1.5 17,335 1.5 14,194 1.6 390 1.7 333 1.5 501 0.5 500 0.5
Certificates
Less than 1 year 305,137 24.0 256,294 24.8 277,404 24.3 228,630 25.2 5,205 22.6 5,148 23.9 22,528 21.2 22,516 21.3 At least 1 but less than
4 years 250,452 19.7 236,162 22.8 193,038 16.9 179,082 19.7 6,113 26.6 5,897 27.3 51,301 48.3 51,183 48.5 Postbaccalaureate or post-
master’s ‡ ‡ ‡ ‡ ‡ ‡ ‡ ‡ ‡ ‡ ‡ ‡ ‡ ‡ ‡ ‡ Degrees Associate’s degrees 714,055 56.2 662,511 64.0 669,931 58.7 618,479 68.1 11,695 50.8 11,638 54.0 32,429 30.5 32,394 30.7 Bachelor’s degrees2 29 # 29 # ‡ ‡ ‡ ‡ 5 # 5 # 24 # 24 # Master’s degrees ‡ ‡ ‡ ‡ ‡ ‡ ‡ ‡ ‡ ‡ ‡ ‡ ‡ ‡ ‡ ‡ Doctor’s degrees ‡ ‡ ‡ ‡ ‡ ‡ ‡ ‡ ‡ ‡ ‡ ‡ ‡ ‡ ‡ ‡
# Rounds to zero. ‡ Reporting standards not met. No institutions met the criteria to be included in this cell. 1Institutions are classified as 4-year or 2-year based on the highest level of awards offered in the collection year (2017–18). 2Five institutions that were 2-year institutions during the collection year (2017–18) awarded 29 bachelor’s degrees during 2016–17. NOTE: Title IV institutions are those with a written agreement with the U.S. Department of Education that allows the institution to participate in any of the Title IV federal student financial assistance programs. The four U.S. service academies that are not Title IV eligible are included in the Integrated Postsecondary Education Data System (IPEDS) universe because they are federally funded and open to the public. Awards displayed in this table were conferred during the 12-month period July 1, 2016 to June 30, 2017. No data from less-than-2-year institutions are included in this table because they were non-degree-granting in the collection year. Because of changes to institutional characteristics between the reporting year (2016–17) and collection year (2017–18), institutions may report awards that are not consistent with their current levels of offering (e.g., two institutions that were less-than-2-year institutions in the collection year reported awarding 57 associate’s degrees in the reporting year). Percentages in the columns of this table use the corresponding count in the appropriate total row of each section as the denominator. Awards to individuals who self-identify with more than one race are included in the Two or more races category. Individuals who are in the United States on a visa or temporary basis, and who are not authorized to remain indefinitely, are included in the Nonresident alien category regardless of race or ethnicity. Awards to individuals of Hispanic or Latino ethnicity are included in the Hispanic or Latino category regardless of race. Detail may not sum to totals because of rounding. Definitions for terms used in this table may be found in the IPEDS online glossary located at https://surveys.nces.ed.gov/ipeds/VisGlossaryAll.aspx. SOURCE: U.S. Department of Education, National Center for Education Statistics, IPEDS, Fall 2017, Completions component (preliminary data).
8
Table 4. Number of awards conferred by Title IV institutions, by race/ethnicity, level of award, and gender: United States, 2016–17
Level of award and gender Total
awards
American Indian or
Alaska Native Asian
Black or African
American Hispanic or Latino
Native Hawaiian or Other
Pacific Islander White
Two or more races
Race/ ethnicity
unknown Nonresident
alien
Total awards 4,954,583 32,770 289,231 569,333 716,773 12,409 2,689,575 137,715 211,111 295,666 Men 2,067,945 13,020 126,865 197,737 277,332 5,227 1,140,657 55,070 89,892 162,145 Women 2,886,638 19,750 162,366 371,596 439,441 7,182 1,548,918 82,645 121,219 133,521 Less than 1 year 492,646 5,061 21,246 79,139 91,968 1,437 256,600 11,935 19,563 5,697
Men 230,044 2,440 8,324 33,256 40,353 670 127,688 5,241 9,277 2,795 Women 262,602 2,621 12,922 45,883 51,615 767 128,912 6,694 10,286 2,902
At least 1 but less than
2 years 421,268 5,185 17,559 70,012 97,373 1,491 199,838 10,730 14,866 4,214 Men 156,254 2,217 6,898 22,038 34,183 550 78,457 3,924 6,118 1,869 Women 265,014 2,968 10,661 47,974 63,190 941 121,381 6,806 8,748 2,345
Associate’s degrees1 1,005,609 8,934 50,721 125,078 201,744 3,068 530,738 28,558 35,898 20,870
Men 394,154 3,238 22,184 41,436 75,422 1,322 214,690 11,216 15,291 9,355 Women 611,455 5,696 28,537 83,642 126,322 1,746 316,048 17,342 20,607 11,515
At least 2 but less than
4 years2 30,855 239 1,248 3,629 5,627 166 17,252 1,070 1,334 290 Men 18,407 114 744 2,264 3,874 94 9,652 706 822 137 Women 12,448 125 504 1,365 1,753 72 7,600 364 512 153
Bachelor’s degrees3 1,956,032 9,191 133,923 188,230 242,063 4,364 1,147,964 63,886 75,038 91,373
Men 836,045 3,573 60,832 67,531 95,183 1,886 499,862 25,966 32,685 48,527 Women 1,119,987 5,618 73,091 120,699 146,880 2,478 648,102 37,920 42,353 42,846
Postbaccalaureate
certificates 41,952 218 2,176 4,718 2,945 78 23,296 945 3,319 4,257 Men 15,605 68 863 1,461 1,023 33 8,255 323 1,300 2,279 Women 26,347 150 1,313 3,257 1,922 45 15,041 622 2,019 1,978
Master’s degrees 804,684 3,142 42,771 82,872 62,216 1,471 401,500 16,369 48,932 145,411
Men 326,892 1,057 18,543 24,818 21,934 545 151,849 5,950 19,101 83,095 Women 477,792 2,085 24,228 58,054 40,282 926 249,651 10,419 29,831 62,316
Post-master’s certificates 20,185 100 859 2,574 1,174 25 12,111 328 1,551 1,463
Men 5,898 25 267 495 308 10 3,615 82 446 650 Women 14,287 75 592 2,079 866 15 8,496 246 1,105 813
Doctor’s degrees—
research/scholarship 70,811 250 3,791 5,709 3,604 82 33,281 1,161 4,054 18,879 Men 35,191 98 1,767 1,805 1,528 24 15,622 486 1,860 12,001 Women 35,620 152 2,024 3,904 2,076 58 17,659 675 2,194 6,878
Doctor’s degrees—
professional practice 108,509 443 14,816 7,101 7,915 223 65,862 2,654 6,397 3,098 Men 48,627 188 6,397 2,524 3,464 92 30,530 1,145 2,902 1,385 Women 59,882 255 8,419 4,577 4,451 131 35,332 1,509 3,495 1,713
Doctor’s degrees—other 2,032 7 121 271 144 4 1,133 79 159 114
Men 828 2 46 109 60 1 437 31 90 52 Women 1,204 5 75 162 84 3 696 48 69 62
1Includes 57 associate’s degrees awarded by two institutions that were less-than-2-year institutions in the collection year (2017–18). 2Includes 613 certificates of at least 2 but less than 4 years awarded by 23 institutions that were less-than-2-year institutions in the collection year (2017–18). 3Includes 29 bachelor’s degrees awarded by five institutions that were 2-year institutions in the collection year (2017–18). NOTE: Title IV institutions are those with a written agreement with the U.S. Department of Education that allows the institution to participate in any of the Title IV federal student financial assistance programs. The four U.S. service academies that are not Title IV eligible are included in the Integrated Postsecondary Education Data System (IPEDS) universe because they are federally funded and open to the public Awards displayed in this table were conferred during the 12-month period July 1, 2016 to June 30, 2017. Because of changes to institutional characteristics between the reporting year (2016–17) and collection year (2017–18), institutions may report awards that are not consistent with their current levels of offering (e.g., two institutions that were less-than-2-year institutions in the collection year reported awarding 57 associate’s degrees in the reporting year). Awards to individuals who self-identify with more than one race are included in the Two or more races category. Individuals who are in the United States on a visa or temporary basis, and who are not authorized to remain indefinitely, are included in the Nonresident alien category regardless of race or ethnicity. Awards to individuals of Hispanic or Latino ethnicity are included in the Hispanic or Latino category regardless of race. Definitions for terms used in this table may be found in the IPEDS online glossary located at https://surveys.nces.ed.gov/ipeds/VisGlossaryAll.aspx. SOURCE U.S. Department of Education, National Center for Education Statistics, IPEDS, Fall 2017, Completions component (preliminary data).
9
Table 5. Twelve-month unduplicated headcount enrollment at Title IV institutions, by student level, level and control of institution, gender, and race/ethnicity: United States, 2016–17
Level and control of institution, gender, and race/ethnicity Total Undergraduate Graduate1
Total students 26,693,287 22,865,316 3,827,971
4-year
Public 10,573,651 8,780,554 1,793,097 Private nonprofit 4,918,100 3,293,845 1,624,255 Private for-profit 1,553,736 1,143,117 410,619
2-year Public 8,721,791 8,721,791 ‡ Private nonprofit 82,551 82,551 ‡ Private for-profit 402,833 402,833 ‡
Less-than-2-year Public 74,010 74,010 ‡ Private nonprofit 20,704 20,704 ‡ Private for-profit 345,911 345,911 ‡
Gender Men 11,494,614 9,966,902 1,527,712 Women 15,198,673 12,898,414 2,300,259
Race/ethnicity
American Indian or Alaska Native 195,439 178,544 16,895 Asian 1,565,759 1,341,334 224,425 Black or African American 3,527,726 3,078,109 449,617 Hispanic or Latino 4,490,299 4,184,774 305,525 Native Hawaiian or Other Pacific Islander 71,640 64,178 7,462 White 13,408,601 11,454,526 1,954,075 Two or more races 844,438 761,467 82,971 Race/ethnicity unknown 1,393,263 1,099,487 293,776 Nonresident alien 1,196,122 702,897 493,225
‡ Reporting standards not met. No institutions met the criteria to be included in this cell. NOTE: Title IV institutions are those with a written agreement with the U.S. Department of Education that allows the institution to participate in any of the Title IV federal student financial assistance programs. The four U.S. service academies that are not Title IV eligible are included in the Integrated Postsecondary Education Data System (IPEDS) universe because they are federally funded and open to the public. The unduplicated headcount displayed in this table is the count of students enrolled over the 12-month period July 1, 2016 through June 30, 2017. Students who self-identify with more than one race are included in the Two or more races category. Individuals who are in the United States on a visa or temporary basis, and who are not authorized to remain indefinitely, are included in the Nonresident alien category regardless of race or ethnicity. Students of Hispanic or Latino ethnicity are included in the Hispanic or Latino category regardless of race. Definitions for terms used in this table may be found in the IPEDS online glossary located at https://surveys.nces.ed.gov/ipeds/VisGlossaryAll.aspx. SOURCE: U.S. Department of Education, National Center for Education Statistics, IPEDS, Fall 2017, 12-Month Enrollment component (preliminary data).

10
Table 6. Twelve-month full-time-equivalent enrollment at Title IV institutions, by student level and institution sector: United States, 2016–17
Institution sector Total Undergraduate Graduate
Total students 16,157,570 14,110,223 2,047,347
Public 4-year 7,363,681 6,383,391 980,290 Public 2-year 3,810,655 3,810,655 ‡ Public less-than-2-year 42,935 42,935 ‡
Private nonprofit 4-year 3,467,803 2,609,958 857,845 Private nonprofit 2-year 57,255 57,255 ‡ Private nonprofit less-than-2-year 14,538 14,538 ‡
Private for-profit 4-year 857,684 648,472 209,212 Private for-profit 2-year 305,463 305,463 ‡ Private for-profit less-than-2-year 237,556 237,556 ‡ ‡ Reporting standards not met. No institutions met the criteria to be included in this cell. NOTE: Title IV institutions are those with a written agreement with the U.S. Department of Education that allows the institution to participate in any of the Title IV federal student financial assistance programs. The four U.S. service academies that are not Title IV eligible are included in the Integrated Postsecondary Education Data System (IPEDS) universe because they are federally funded and open to the public. Data in this table cover the period from July 1, 2016 to June 30, 2017. The full-time-equivalent (FTE) enrollment displayed in this table is calculated from institutions’ instructional activity over a 12-month period. For institutions following a quarter calendar system, 45 undergraduate credit hours is considered one undergraduate FTE and 36 graduate credit hours is considered one graduate FTE. For institutions following a semester, trimester, 4-1-4, or other academic year calendar system, 30 undergraduate credit hours is considered one undergraduate FTE and 24 graduate credit hours is considered one graduate FTE. For all calendar systems (both academic year-based systems and continuous enrollment systems), 900 undergraduate contact hours is considered one undergraduate FTE. Definitions for terms used in this table may be found in the IPEDS online glossary located at https://surveys.nces.ed.gov/ipeds/VisGlossaryAll.aspx. SOURCE: U.S. Department of Education, National Center for Education Statistics, IPEDS, Fall 2017, 12-Month Enrollment component (preliminary data).

A-1
Appendix A: Data Collection Procedures
The fall 2017 data collection was entirely web-based; data were collected between September 6, 2017, and October 18, 2017. Data were provided by “keyholders,” i.e., institutional representatives appointed by institutional chief executives, who were responsible for ensuring that survey data submitted by the institution were correct and complete. No problems were noted during the fall 2017 data collection. The Integrated Postsecondary Education Data System (IPEDS) help desk was available to assist respondents with reporting the necessary data.
The IPEDS universe is established during the fall collection period. During the 2017–18 academic year, there were 6,715 Title IV institutions and administrative offices1 in the United States and the other jurisdictions of the United States, such as Puerto Rico.2 For 2017–18, some 448 postsecondary institutions were reported exclusively by a parent institution3 and are not included in the universe counts. The four U.S. service academies that are not Title IV eligible are included in the IPEDS universe because they are federally funded and open to the public.4
Because the Title IV institutions that are the focus of IPEDS are required to participate in IPEDS, the response rates in the fall 2017 IPEDS collection were high, rounding to 100 percent. Of the 6,715 Title IV entities (institutions and administrative offices), 3 responses were missing for the Institutional Characteristics component, 3 responses from the Completions component and 5 responses from the 12-Month Enrollment component.5
The National Center for Education Statistics (NCES) statistical standards require that the potential for nonresponse bias for all institutions be analyzed for sectors for which the response rate is less than 85 percent. Because response rates were nearly 100 percent for each survey
1 Title IV institutions and administrative offices include 6,689 institutions and 73 administrative (central or system) offices. The central and system offices are required to complete the Institutional Characteristics component in the fall, the Human Resources component in the spring, and the Finance component in the spring (if they have their own separate budget). 2 The other U.S. jurisdictions surveyed in IPEDS are American Samoa, the Commonwealth of the Northern Mariana Islands, the Federated States of Micronesia, Guam, the Marshall Islands, Palau, Puerto Rico, and the U.S. Virgin Islands. 3 A parent institution reports data for another institution, known as the child institution. 4 The four U.S. service academies that are not Title IV eligible are the U.S. Naval Academy, the U.S. Military Academy, the U.S. Coast Guard Academy, and the U.S. Air Force Academy. One academy, the U.S. Merchant Marine Academy, is Title IV eligible. Data for all five institutions are included in the tables and counts of institutions unless otherwise indicated. 5 All 6,715 Title IV institutions and administrative offices were expected to respond to the Institutional Characteristics component. For the Completions component, all 6,642 institutions were expected to respond. A total of seven institutions (five that were new to IPEDS and two that did not enroll postsecondary students during the reference period) were not required to respond to the 12-Month Enrollment component but did respond to the Completions component. Hence, 6,635 institutions were expected to respond to the 12-Month Enrollment component.

A-2
component, no such analysis was necessary. However, because response rates were not 100 percent, imputed values will be included as part of the provisional data, when they are released.
Table 2 is presented in constant 2017–18 dollars. To convert the 2015–16 tuition, required fees, books and supplies, room and board, and other expenses data to 2017–18 dollar amounts, the average Consumer Price Index for All Urban Consumers (CPI-U)6 values for the 12-month periods ending in October 2015 and October 2017 were used. The ratio of the average CPI-U for the 12-month period ending in October 2017 to the average CPI-U ending in October 2015 was multiplied by the 2015–16 dollar amounts to calculate the constant 2017–18 dollar amounts. These amounts were then used in the calculations shown in the table.
6 CPI-U values were obtained from http://www.bls.gov/cpi/home.htm.

B-1
Appendix B: Glossary of Terms
2-year institution: Any postsecondary institution that offers programs of at least 2 but less than 4 years’ duration, as well as occupational and vocational schools with programs of at least 1,800 hours and academic institutions with programs of less than 4 years. Does not include bachelor’s-degree-granting institutions where the baccalaureate program can be completed in 3 years.
4-year institution: Any postsecondary institution that offers programs of at least 4 years’ duration or programs at or above the baccalaureate level, as well as schools that offer postbaccalaureate certificates only and those that offer graduate programs only. Also includes freestanding medical, law, or other professional schools.
academic year: The period of time generally extending from September to June; usually equated to 2 semesters or trimesters, 3 quarters, or the period covered by a 4-1-4 calendar system.
associate’s degree: An award that normally requires at least 2 but less than 4 years of full-time-equivalent college work.
bachelor’s degree: An award (baccalaureate or equivalent degree, as determined by the Secretary, U.S. Department of Education) that normally requires at least 4 but not more than 5 years of full-time-equivalent college-level work. This includes all bachelor’s degrees conferred in a 5-year cooperative (work-study) program. A cooperative plan provides for alternate class attendance and employment in business, industry, or government; thus, it allows students to combine actual work experience with their college studies. This also includes bachelor’s degrees for which the normal 4 years of work are completed in 3 years.
board charges: Charges assessed students for an academic year for meals.
child institution: An institution that has its data reported by another institution, known as the parent institution.
collection year: The academic year in which IPEDS data were collected. Most Institutional Characteristics, Salaries, Fall Staff, Fall Enrollment, Employees by Assigned Position, and Admissions data are collected for the current year; Completions, 12-Month Enrollment, Student Financial Aid, Academic Libraries, and Finance data collections cover the prior year. Graduation Rates and Outcome Measures data cover cohorts from prior years that completed college by August 31 of the most recent fall.
control (of institution): A classification of whether an institution is operated by publicly elected or appointed officials (public control) or by privately elected or appointed officials and derives its major source of funds from private sources (private nonprofit or private for-profit control).
cost of attendance: The amount of tuition and fees, room and board, books and supplies, and other expenses that a full-time, first-time degree/certificate-seeking student can expect to pay to go to college for an academic year. Costs reported by the institutions are those amounts used by the financial aid office to determine student financial need.
degree: An award conferred by a college, university, or other postsecondary education institution as official recognition for the successful completion of an undergraduate or graduate program of study.

B-2
doctor’s degree: The highest award a student can earn for graduate study. The doctor’s degree classification includes such degrees as Doctor of Education, Doctor of Juridical Science, Doctor of Public Health, and the Doctor of Philosophy (Ph.D.) in any field. There are three categories of doctor’s degrees: doctor’s degrees—professional practice, which is conferred upon completion of a program providing the knowledge and skills for the recognition, credential, or license required for professional practice; doctor’s degrees—research/scholarship, which is a Ph.D. or other doctor’s degree that requires advanced work beyond the master’s level, including preparation and defense of a dissertation based on original research, or the planning and execution of an original project demonstrating substantial artistic or scholarly achievement; and doctor’s degrees—other, which includes all other doctor’s degrees that do not meet the definition of the other categories.
instructional activity: The total number of credit and contact hours all students are engaged in during the specified period.
less-than-2-year institution: This group includes any postsecondary institution that offers programs of less than 2 years’ duration below the baccalaureate level, as well as occupational and vocational schools with programs that do not exceed 1,800 contact hours.
level of institution: A classification of whether an institution’s programs are of at least 4 years’ duration or beyond a baccalaureate level (4-year institution), at least 2 but less than 4 years (2-year institution), or less than 2 years (less-than-2-year institution).
master’s degree: An award that requires the successful completion of a program of study of generally 1 or 2 full-time-equivalent academic years of work beyond the bachelor’s degree. Some of these degrees, such as those in Theology (M.Div., M.H.L./Rav) that were formerly classified as “first-professional,” may require more than 2 full-time-equivalent academic years of work.
nonresident alien: A person who is not a citizen or national of the United States and who is in this country on a visa or temporary basis and does not have the right to remain indefinitely.
Office of Postsecondary Education (OPE): Office within the U.S. Department of Education that formulates federal postsecondary education policy and administers programs that address critical national needs in support of its mission to increase access to quality postsecondary education.
other expenses: The amount of money (estimated by the financial aid office) needed by a student to cover expenses such as laundry, transportation, and entertainment.
parent institution: An institution that reports data for another institution, known as the child institution.
postsecondary education: The provision of a formal instructional program whose curriculum is designed primarily for students beyond the compulsory age for high school. This includes programs whose purpose is academic, vocational, and continuing professional education, and excludes avocational and adult basic education programs.
postsecondary institution: An institution that has as its sole purpose, or one of its primary missions, the provision of postsecondary education. For IPEDS, this institution must be open to the public.
Program Participation Agreement (PPA): A written agreement between a postsecondary institution and the Secretary of Education. This agreement allows institutions to participate in any of the Title IV student assistance programs other than the State Student Incentive Grant (SSIG) and the National Early Intervention Scholarship and Partnership (NEISP) programs. The PPA conditions the initial and continued participation of an eligible institution in any Title IV program upon compliance

B-3
with the General Provisions regulations, the individual program regulations, and any additional conditions specified in the program participation agreement that the Department of Education requires the institution to meet. Institutions with such an agreement are referred to as Title IV institutions.
race/ethnicity: Categories developed in 1997 by the Office of Management and Budget that are used to describe groups to which individuals belong or identify with, or belong in the eyes of the community. The categories do not denote scientific definitions of anthropological origins. The designations are used to categorize U.S. citizens, resident aliens, and other eligible noncitizens.
Individuals are asked to first designate ethnicity as
• Hispanic or Latino; or • not Hispanic or Latino.
Second, individuals are asked to indicate all races that apply among the following:
• American Indian or Alaska Native; • Asian; • Black or African American; • Native Hawaiian or Other Pacific Islander; and • White. For reporting purposes, students who identify with more than one race are included in the Two or more races category.
resident alien (and other eligible noncitizens): A person who is not a citizen or national of the United States but who has been admitted as a legal immigrant for the purpose of obtaining permanent resident alien status and who holds one of the following: an alien registration card (Form I-551 or I-151), a Temporary Resident Card (Form I-688), or an Arrival-Departure Record (Form I-94) with a notation that conveys legal immigrant status such as Section 207 Refugee, Section 208 Asylee, Conditional Entrant Parolee, or Cuban-Haitian.
required fees: Fixed sum charged to students for items not covered by tuition and required of such a large proportion of all students that the student who does not pay the charge is an exception.
room charges: The charges for an academic year for rooming accommodations for a typical student sharing a room with one other student.
sector: One of nine institutional categories resulting from dividing the universe according to control and level. Control categories are public, private nonprofit, and private for-profit. Level categories are 4 years and higher (4-year), at least 2 but less than 4 years (2-year), and less than 2 years (less-than-2-year). For example, public 4-year institutions.
Title IV institution: An institution that is accredited by an agency or organization recognized by the Secretary of the U.S. Department of Education, has at least one program of more than 300 clock hours or 8 credit hours, has been in business for at least 2 years, and has a signed Program Participation Agreement with the Office of Postsecondary Education, U.S. Department of Education.
unduplicated headcount enrollment: The sum of students enrolled for credit with each student counted only once during the reporting period, regardless of when the student enrolled.