potassium channel modulators for the treatment of ...2 autoimmune disorders during normal immune...
TRANSCRIPT

1
Potassium channel modulators for the treatment of autoimmune disorders

2
Autoimmune disorders During normal immune responses white blood cells protect the
body from antigens such as bacteria, viruses, toxins, cancer cells• The cellular immune system attacks infected cells with CD4 (helper)
and CD8 (cytotoxic) T cells• The humoral system responds to bacteria and viruses by instigating
attack by immunoglobulins produced by B cells In patients with an autoimmune disorder the immune system
cannot distinguish between foreign antigens and healthy tissue, resulting in destruction of tissue or abnormal growth patterns
Many different organ or tissue types may be affected• Blood vessels, connective tissue, nerves, joints, muscles, skin
More than 80 discrete autoimmune disorders have been identified The aggregate prevalence of AI disorders is ~5000 per 100,000
• Incidence is higher in women than men Different AI disorders have different molecular phenotypes

3
Autoimmune phenotypesEffector memory T cells and class switched B cells predominate
Disease Target organ Autoreactive lymphocyte
Psoriasis Skin CD45RO+CD45RA- CCR7- TEM cells
Grave disease Thyroid IgD-IgG+ memory B cells
Rheumatoid arthritis Joints CD28nullCD45RA-CCR7- TEM cells
Hashimoto disease ThyroidCD45RA- memory T cells
IgD-IgG+ memory B cells
Vitiligo Skin, mucous membranes CD45RO+ memory T cells
Crohns disease Digestive tract CD45RO+CD28null memory T cells
Type I diabetes
mellitusPancreas
CD28 costimulation-independent memory T-
cells
Multiple sclerosis CNS
CD28 costimulation-independent
CD45RO+CD45RA-CCR7- TEM cells
IgD-CD27+ class-switched memory B cells

4
Prevalence of AI disorders
0
200
400
600
800
1000
1200
1400
1600
Psor
iasi
sGr
ave
dise
ase
Rheu
mat
oid
arth
ritis
Hash
imot
o's
dise
ase
Vitil
igo
IBD
Type
I di
abet
es (a
dults
)
Pern
icio
us a
nem
ia
Glom
erul
onep
hriti
s
Mul
tiple
scl
eros
is
Syst
em lu
pus
eryt
hem
atos
is
Prim
ary
syst
emic
vas
culit
is
Addi
son
Dise
ase
Sjog
ren
dise
ase
Mya
sthe
nia
grav
isPo
lym
yosi
tis
Prim
ary
bilia
ry c
irrho
sis
Syst
emic
scl
eros
is
Weg
ener
gra
nulo
mat
osis
Uvei
tis
Prevalence of Autoimmune Diseases(cases/100,000)
Third most common category of disease, after cancer and heart disease, affecting 4% of the population
Global market reached $34Bn in 2010 and is expected to reach $55-77Bn by 2016 (CAGR ~10%)
14 drugs at or near blockbuster status (7 >$3Bn)

5
Leading product classes
• Large molecule therapies predominate• Intra venous dosing is required for the majority• Significant opportunity for a novel, orally bioavailable, small molecule approach

6
The autoimmune pipeline
Biologics still predominateOpportunity for new targets providing small molecule therapeutics

7
T cell machinery overview
• Antigen presenting cell activates the T cell receptor• PLC releases IP3 which activates the IP3 receptor to release Ca2+ from the ER• T cell and B cell activation and proliferation are dependent on Ca2+
• Maintenance of this process depends on ion channel activity

8
Ion channels in T cellsAntigen
presenting cell
T cell
KCa3.1Kv1.3
Orai1
STIM1
IP3R
TRPM7
Clswell
• Ca2+ depletion in the ER leads to association of Orai1 and STIM1 to form the CRAC channel• Ca2+ influx through CRAC depolarises the T cell• K+ channels are recruited to the immune synapse and activated to induce repolarisation, maintaining the driving force for Ca2+ influx• Elevated intracellular Ca2+ drives transcription factors such as nuclear factor of activated T cells
Selective block of K+ channels leads to membrane depolarisation, inhibits Ca2+ influx and shuts down cytokine production and immune cell proliferation

9
Role of ion channels in T cells
At the level of the immune synapse, ion channels regulate local ionic concentrations, assembly of molecular aggregates that form signalling complexes and trans-synaptic signalling
At the level of the whole T cell, ion channels regulate membranepotential, Ca2+ influx, K+ efflux and Cl- efflux, leading to changes in gene expression, motility and cell volume
Expression of Ca2+ and K+ channels can vary greatly following activation and differentiation, and may form a positive feedback loop sensitising T cells to produce a larger Ca2+ signal following repeat challenge with the same antigen
At the level of the whole animal, manipulating ion channel currents in T cells could provide relief from inappropriate acute T cell activation (KCa3.1, CRAC) or chronic inflammatory and autoimmunedisorders (Kv1.3) – why this differentiation?
10
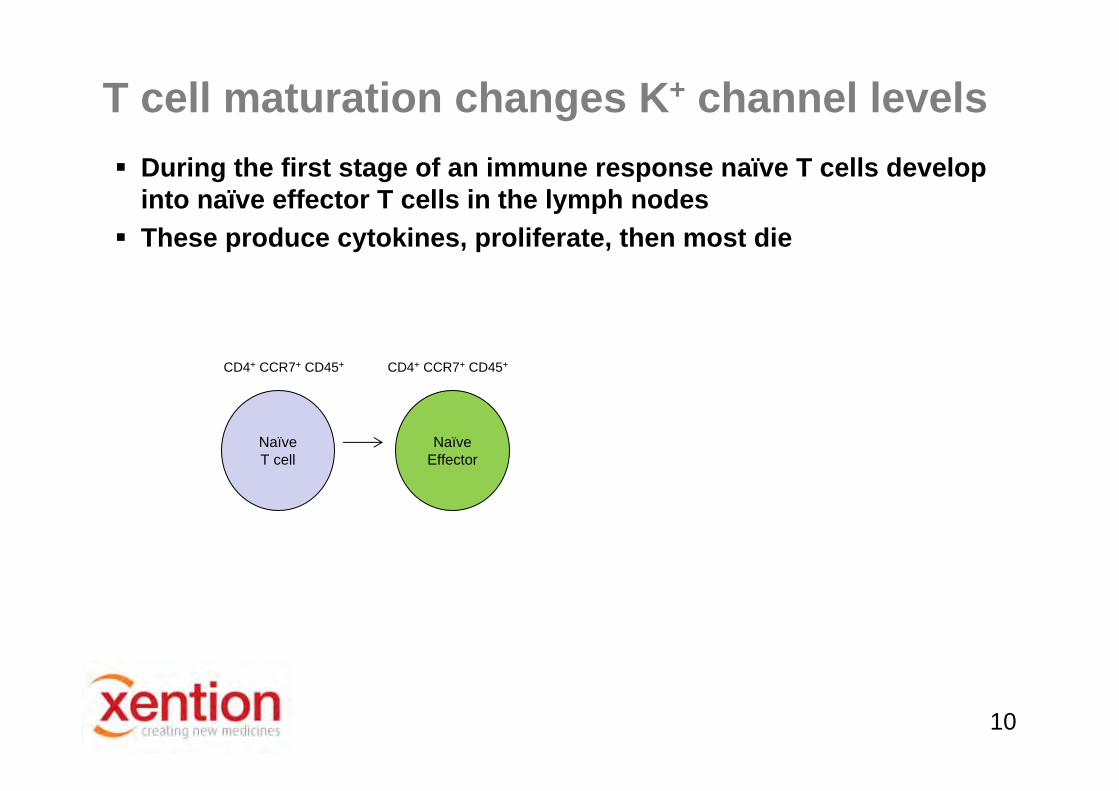
T cell maturation changes K+ channel levels During the first stage of an immune response naïve T cells develop
into naïve effector T cells in the lymph nodes These produce cytokines, proliferate, then most die
Naïve Effector
Naïve T cell
CD4+ CCR7+ CD45+ CD4+ CCR7+ CD45+

11
T cell maturation changes K+ channel levels Some naïve effector T cells differentiate into long-lived central
memory T cells When activated by an antigen these produce cytokines and
proliferate, then most die
Naïve Effector
Naïve T cell
Centralmemory
CentralmemoryCD4+ CCR7+ CD45+ CD4+ CCR7+ CD45+
CD4+ CCR7+ CD45- CD4+ CCR7+ CD45-

12
T cell maturation changes K+ channel levels Repeated antigen stimulation, as in autoimmune disorders and
chronic infections, causes TCM cells to differentiate into TEM cells These do not need to home to the lymph nodes for activation
Naïve Effector
Naïve T cell
Centralmemory
Centralmemory
Effector memory
Effector memory
CD4+ CCR7+ CD45+ CD4+ CCR7+ CD45+
CD4+ CCR7+ CD45- CD4+ CCR7+ CD45-
Quiescent Activated
CD4+ CCR7- CD45- CD4+ CCR7- CD45-

13
T cell maturation changes K+ channel levels These different types of T cells have different patterns of
potassium channel expression Membrane potential in activated TEM cells is dominated by Kv1.3
Naïve Effector
Naïve T cell
Centralmemory
Centralmemory
Effector memory
Effector memory
CD4+ CCR7+ CD45+ CD4+ CCR7+ CD45+
CD4+ CCR7+ CD45- CD4+ CCR7+ CD45-
Quiescent Activated
CD4+ CCR7- CD45- CD4+ CCR7- CD45-
Kv1.3 > KCa3.1; KCa3.1 dominatesKv1.3 < KCa3.1; KCa3.1 dominatesKv1.3 >>> KCa3.1; Kv1.3 dominates
14
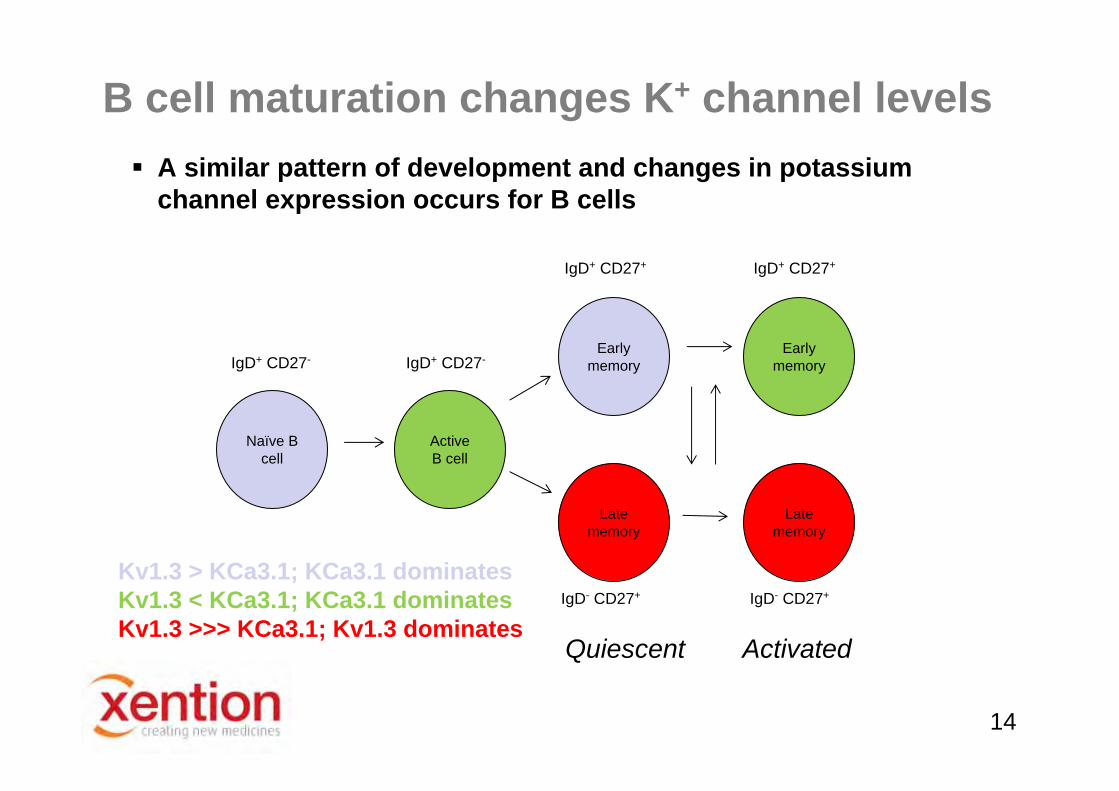
B cell maturation changes K+ channel levels A similar pattern of development and changes in potassium
channel expression occurs for B cells
Active B cell
Naïve B cell
Early memory
Early memory
Late memory
Late memory
Quiescent Activated
Kv1.3 > KCa3.1; KCa3.1 dominatesKv1.3 < KCa3.1; KCa3.1 dominatesKv1.3 >>> KCa3.1; Kv1.3 dominates
IgD+ CD27- IgD+ CD27-
IgD+ CD27+ IgD+ CD27+
IgD- CD27+ IgD- CD27+
15
Targeting ion channels for AI disorders
Ion channel expression patterns in different T cell subsets changes with activation and differentiation
Targeting KCa3.1 or CRAC channels will suppress differentiation of naïve T cells and B cells and suppress all immune responses
• Currently in early lead optimisation with CRAC inhibitors Targeting Kv1.3 channels will suppress only terminally
differentiated T cells and B cells, suppressing chronic and autoimmune responses
• Advanced lead Kv1.3 inhibitors• Indicated for MS, rheumatoid arthritis, psoriasis, other AI disorders

16
Kv1.3 as a drug target
The functional channel is composed of 4 α subunits encoded by KCNA3
Kv1.3 expression is almost entirely confined to immune cells
Inhibited by a number of potent and selective toxins - e.g. ShK (and derivatives) & ADWX-1
Toxin and small molecule Kv1.3 blockers have been shown to reduce T cell and B cell proliferation and cytokine production
Substantial validation in human disease

17
The role of Kv1.3 in Multiple SclerosisCNS infiltrating T cells express high levels of Kv1.3
MS is characterized by CNS cell infiltrates of activated T cells and macrophages
These display an effector memory phenotype in post-mortem examination
Kv1.3 expression is elevated in these cells
18
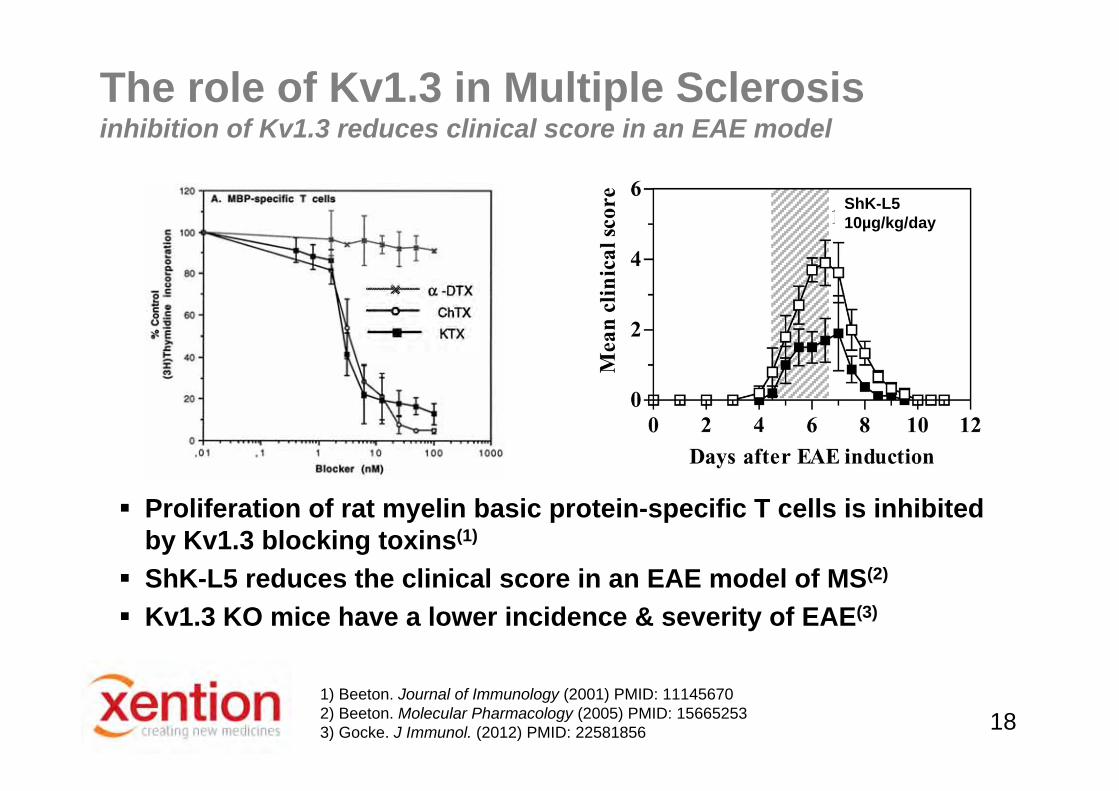
The role of Kv1.3 in Multiple Sclerosisinhibition of Kv1.3 reduces clinical score in an EAE model
1) Beeton. Journal of Immunology (2001) PMID: 111456702) Beeton. Molecular Pharmacology (2005) PMID: 156652533) Gocke. J Immunol. (2012) PMID: 22581856
Proliferation of rat myelin basic protein-specific T cells is inhibited by Kv1.3 blocking toxins(1)
ShK-L5 reduces the clinical score in an EAE model of MS(2)
Kv1.3 KO mice have a lower incidence & severity of EAE(3)
ShK-L510µg/kg/day
19
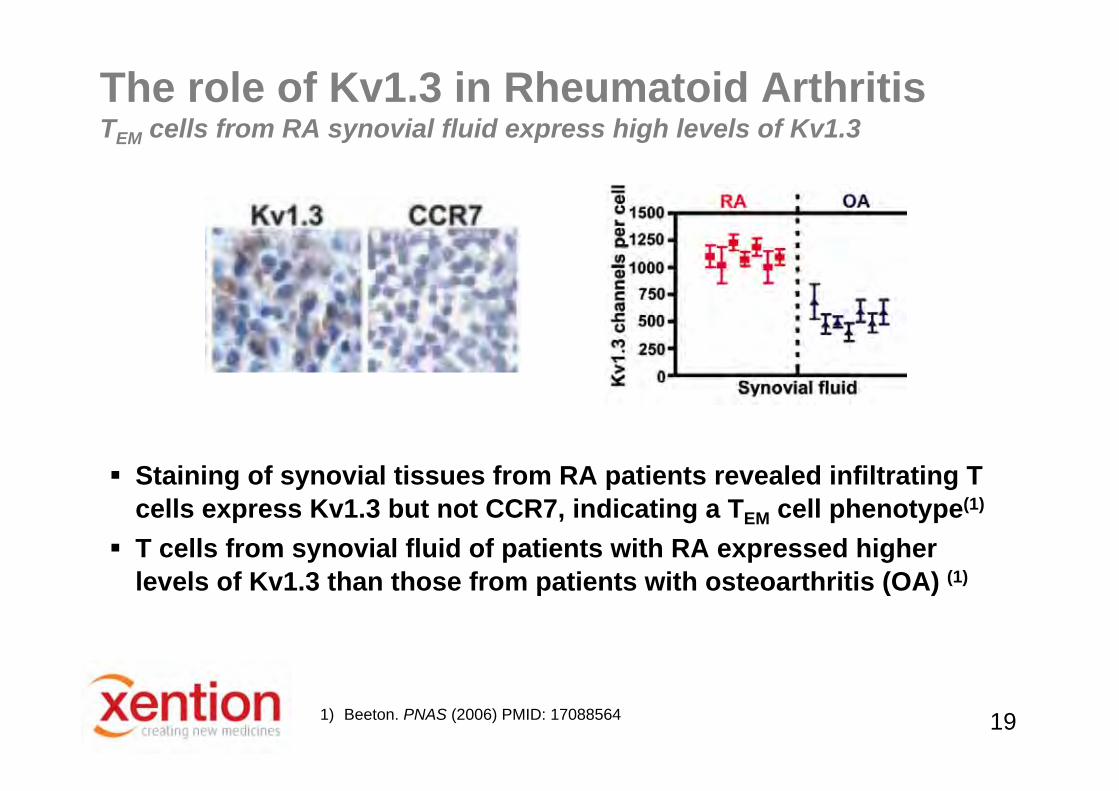
Staining of synovial tissues from RA patients revealed infiltrating T cells express Kv1.3 but not CCR7, indicating a TEM cell phenotype(1)
T cells from synovial fluid of patients with RA expressed higherlevels of Kv1.3 than those from patients with osteoarthritis (OA) (1)
1) Beeton. PNAS (2006) PMID: 17088564
The role of Kv1.3 in Rheumatoid ArthritisTEM cells from RA synovial fluid express high levels of Kv1.3

20
ShK-186 (SL5) reduced the number of joints affected in a pristane-induced model of RA(1)
The role of Kv1.3 in Rheumatoid Arthritisinhibition of Kv1.3 reduces disease severity in a RA model
1) Beeton. PNAS (2006) PMID: 17088564

21
Kv1.3 Inhibitor pharmacology Toxins
• Charybdotoxin, margatoxin• Sea anemone family of toxins: ShK, ShK-L5,
Antibodies• E314 has high affinity, is selective, and produces functional inhibition
Natural product small molecules and analogues• Khellinones, correolides, Psora family of compounds
Drug like small molecules• Scaffolds identified by several groups; few combine potency, selectivity
and sustained oral exposure

22
Objective is a potent, selective, orally bioavailable small molecule with a PK profile that provides sustained Kv1.3 inhibition
• Essential to sustain T cell suppression for long periods in order to achieve a significant therapeutic effect
Starting points identified by HTS, computational approaches, and re-profiling of a substantial internal Kv1.x dataset
Screening using information-rich electrophysiology assays • Target, gene family and cardiac safety screening conducted on the
same automated patch clamp platform Progression into T cell electrophysiology and proliferation assays,
in vivo testing in psoriasis, multiple sclerosis and rheumatoid arthritis assays
Discovery of small molecule Kv1.3 inhibitors

23
Kv1.3 QPatch assay is reliable & pharmacologically validated
Seal and whole-cell parameters determine success rate & data quality
Automated patch clamp screening
QPatch G
Ionworks M
24
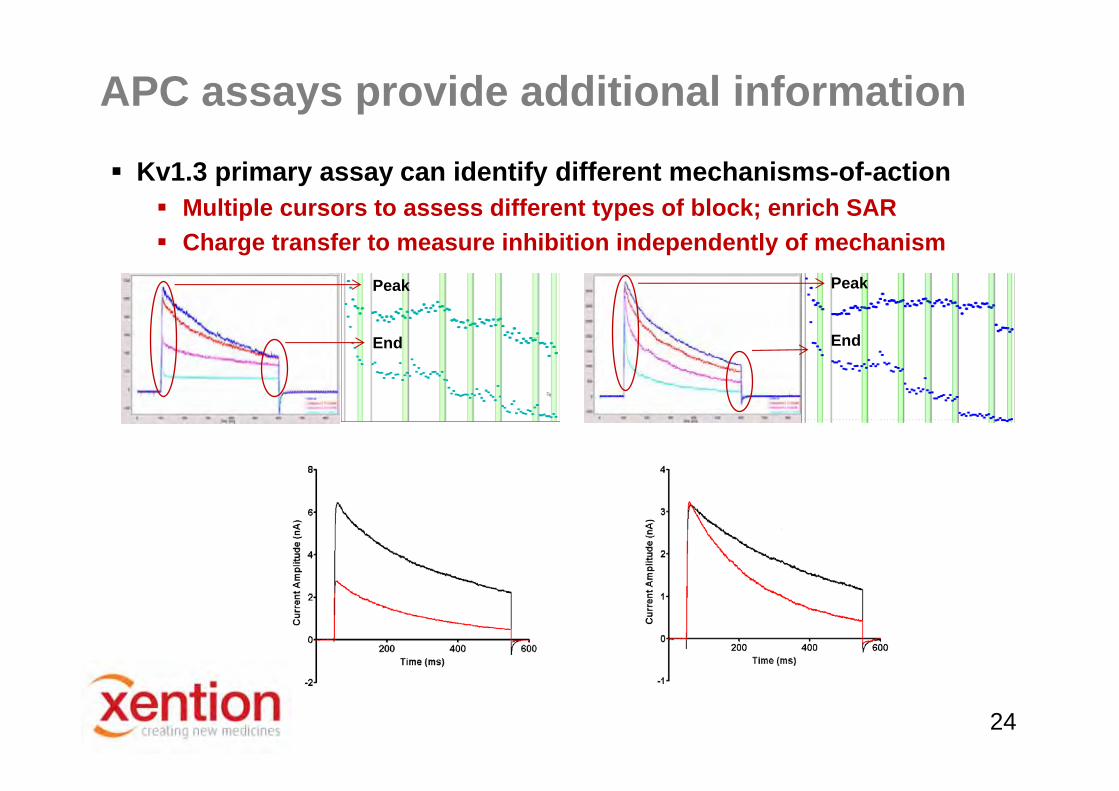
Kv1.3 primary assay can identify different mechanisms-of-action Multiple cursors to assess different types of block; enrich SAR Charge transfer to measure inhibition independently of mechanism
APC assays provide additional information
Peak
End
Peak
End

25
2R9R --> Rat, Chimeric, Kv2.1 Voltage Sensor, 2.40A (2007)
1J95 --> Kcsa Bacterial 2A79 --> Kv1.2 Rat, Open Channel, 2.90A (2005)
Structural information is available

26
Computational models support SARUpper part of water cavityLigands optimized against hydrogen bonding interactions
Lower part of water cavityLigands optimized against hydrophobic contacts
HTVS• Model is sufficiently defined to allow virtual screening of large real and
virtual compound libraries
• Iterative in silico screening followed by real ‘wet’ electrophysiology rapidly refines the computational model
• Similar approach applied to Kv1.1/1.2 to identify novel hits with in vivo activity in a model of MS nerve damage

27
Current status
Multiple series of potent small molecule Kv1.3 inhibitors • Potency in the low nM range• Pharmacophores developed and validated for Kv1.3 and other gene
family members• Binding site hypothesis developed using homology models
Selective molecules identified • Gene family selectivity• Cardiac selectivity (hERG, Nav1.5, Cav1.2)
Good ADME properties Compounds inhibit human TEM cell Kv1.3 currents and proliferation Compounds are active in established in vivo models of
autoimmune disease

28
Lead compound overview
Ion Channel Selectivity In Vitro Assay In Vivo PK (p.o.)
Cmpd
IC50 Kv1.3(nM) hERG Nav1.5 Kv1.5 Sol
(μM)RLM(%)
DLM(%)
HLM(%)
Cmax (ng/ml)
T1/2(min)
Cl (ml/min)
VD(L/kg) %F
1 281 >50 >100 17 180 47 85 65 763 154 32 0.7 97
2 62 >150 >150 4 31 22 86 65 227 92 51 1 27
3 221 >50 >100 2 122 53 84 96 1575 36 37 0.8 55
4 80 >50 >300 28 136 64 75 93 249 65 36 1 29
5 12 >500 >2000 50 - - - - - - - - -
• Potent small molecule Kv1.3 inhibitors identified• Most examples have good physicochemical and ADME properties• SAR for gene family selectivity developed using electrophysiology data

29
Cmpd IC50 Kv1.3(nM)
hERGx Fold
Nav1.5x Fold
Kv1.5x Fold
Kv1.1x Fold
Kv1.2x Fold
6 140 >200 >200 17 11 >70
7 99 >100 >300 4 8 16
8 107 >280 - 2 3 4
9 53 >550 >550 28 27 31
10 12 >900 >2000 >50 49 80
11 141 >200 >200 >70 >70 >70
12 27 >250 >1000 >140 79 97
13 62 >450 >450 >40 20 25
14 72 >410 >410 43 40 24
15 69 >430 >430 61 24 38
16 90 >330 >330 8 17 11
17 193 >150 >150 12 11 13
18 81 >350 >350 11 20 31
Lead compound overviewGene family selectivity
SAR for gene family selectivity developed

30
Initial treatment with oxazolone triggers T cell activation and sensitisation
Kv1.3 blocker (po) significantly attenuated ear swelling following second oxazolone challenge
Similar magnitude of effect to that elicited by ShK (ip)
In vivo proof of conceptrat oxazolone-induced contact dermatitis (DTH) model

31
In vivo proof of conceptrat EAE model
Kv1.3 blocker produced a significant, dose proportional, attenuation of clinical score in this multiple sclerosis model
Kv1.3 blocker dose 3Kv1.3 blocker dose 2Kv1.3 blocker dose 1

32
Kv1.3 blocker produced a significant attenuation of arthritic symptoms
In vivo proof of conceptrat collagen-induced arthritis model
Kv1.3 Blocker 1Kv1.3 Blocker 2

33
PROPERTY TARGET STATUS
Potency <100nM
Kv1.x gene family selectivity >30-fold
Cardiac Selectivity >150-fold (hERG, Nav1.5, Cav1.2)
ADME Drug-like
Bioavailability Orally bioavailable
Ex Vivo Efficacy Human synovial TEM-cell proliferation assay
In Vivo Efficacy Disease relevant animal models (DTH, EAE and CIA)
Xention Kv1.3 programmeSummary
Many thanks to the research team at Xention

34
www.xention.com