potency assay development - c.ymcdn.comc.ymcdn.com/sites/ · pdf filecfse labeling...
TRANSCRIPT

Potency Assay DevelopmentRegulatory T-cell Function
Smita Ghanekar, Ph.D.BD Biosciences

Types of Treg
Naturally occurring Tregproduced by thymus as a functionally distinct and mature subpopulation of T cells
Inducible or “adaptive”Treg -induced from naïve T cells by antigenic stimulation in the periphery (extrathymic)
Naturally Occurring CD4+CD25+Treg
• Generation is developmentally controlled• Persist in the periphery with stable function• Natural presence in the immune system makes them a
good target for designing ways to treat or prevent immunological diseases
• Congenital deficiency results in impairment of self tolerance and immunoregulation that can lead to severe autoimmunity, immunopathology and allergy in humans

Treg: Potential Clinical Applications
Removal of Treg or blocking of their function to boost immune response using anti-CTLA-4, -CD25, -GITR mAbs
Cancer, Infectious disease
Suppression of Treg Function
Specific suppression of immune responses by transfer of Treg or enhancement of their function; ex vivo generation of regulatory cells using cytokines, pharmacological agents, or modified DCs
Organ Transplantation, Autoimmune disease, Allergy
Enhancement of Treg Function
Potential Therapeutic ApproachTarget Condition
Strategic Manipulation
of Treg
Fehervari and Sakaguchi, 2004

Current Treg Clinical Trials and INDs
Annual growth rate
Treg GVHD: 5-6 trials, 3 INDsTreg T1D: 2 INDsCancer Adoptive Therapy: 2 INDs (Treg depletion)
Indications of potential Treg therapy
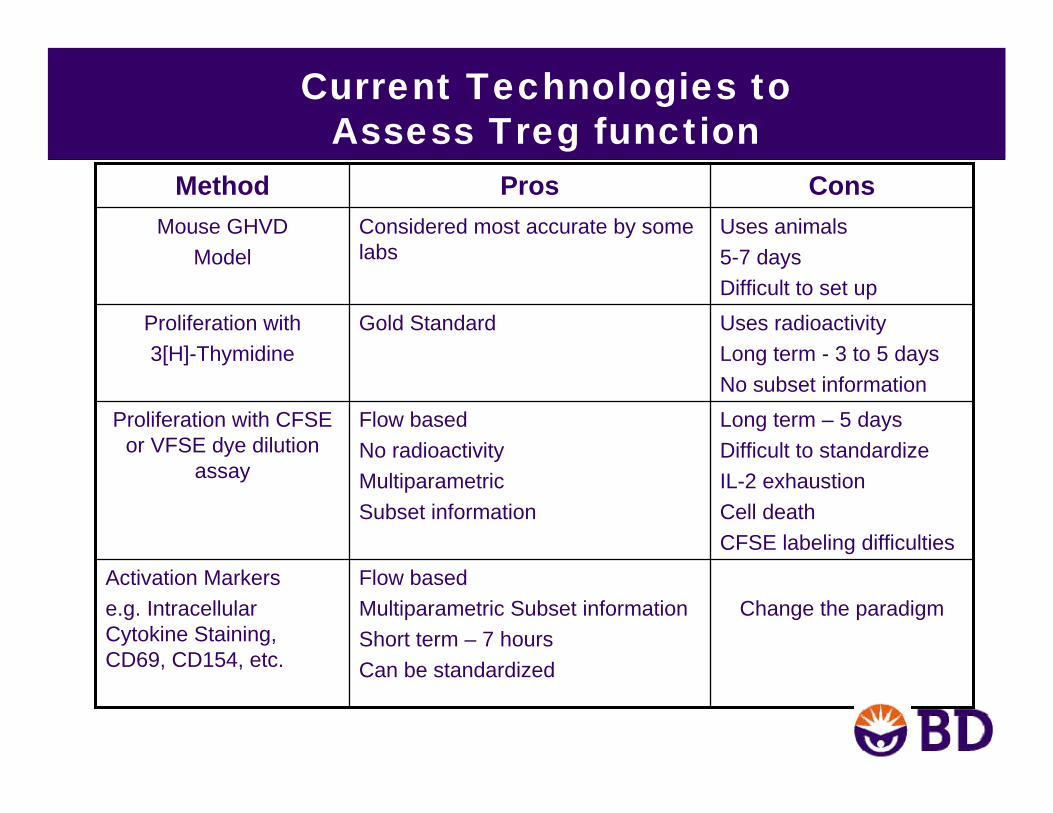
Current Technologies to Assess Treg function
Uses animals5-7 daysDifficult to set up
Considered most accurate by some labs
Mouse GHVDModel
Change the paradigmFlow based Multiparametric Subset informationShort term – 7 hoursCan be standardized
Activation Markerse.g. Intracellular Cytokine Staining, CD69, CD154, etc.
Long term – 5 daysDifficult to standardizeIL-2 exhaustionCell deathCFSE labeling difficulties
Flow basedNo radioactivityMultiparametricSubset information
Proliferation with CFSE or VFSE dye dilution
assay
Uses radioactivityLong term - 3 to 5 daysNo subset information
Gold StandardProliferation with3[H]-Thymidine
ConsProsMethod

Our Goals for Treg Functional Assay Development
• To develop an in vitro bioassay that is relevant to a desired in vivo function
• Our assay is a direct measurement of biological activity of the cellular product
• For many cell therapy products, the phenotype of a cell is used as a surrogate
• Challenges

Treg FunctionSuppression of Proliferation
• Conventional suppression assay• Five-day proliferation assay
• Time consuming• Difficult to reproduce• May produce false-positive results
• Depletion of IL-2• Apoptosis of rapidly dividing cells
11.2%85.1%

BD FastImmune Human Regulatory T Cell Function Kit
• Research Use Only GMP Product• Measures suppression of activation markers
expressed by responder T cells• CD154• CD69
• Reduced expression in the presence of Treg• 96-well plate format• Short term: 7-hour activation

BD FastImmune Human Regulatory T Cell Function Kit
• Optimized antibody cocktail for staining• CD4 FITC • CD25 PE• CD3 PerCP-Cy5.5
• Activation markers• CD154 APC• CD69 PE-Cy™7
• Detailed assay and staining procedures• Gating strategy for analysis

BD FastImmune Human Regulatory T Cell Function Kit
• Assay Configuration• Autologous unstimulated PBMCs• Autologous unstimulated PBMCs + Treg
• Different ratios of responders: Treg• CD3/CD28 stimulated PBMCs• CD3/CD28 stimulated PBMCs + Treg
• Different ratios of responders: Treg• Treg alone• Autologous unstimulated PBMCs (for instrument
setup)

Sort CD4+CD25++CD127dim/- CD45RA+ cells
Expand in culture for 13 Days
Co-culture Treg and autologous PBMC at various ratios (e.g. 1 Treg : 1 PBMC)
Activate for 7 hours with stimulus (SEB,CD3/CD28 beads)in presence of CD154
Perform Surface Staining with CD3, CD4, CD69, CD25
Assess reduction in frequency of CD69 and/or CD154 positiveresponder cells in presence of Treg
Treg Suppression AssayHow the Assay Works

Treg-mediated suppression of CD154 and CD69expression in PBMC stimulated with CD3/CD28
CD4- CD4+CD25-
CD4+CD154
CD4+CD69
Unstim PBMC Stim* PBMC Treg+ stim PBMC (0.5:1)
0.6%
MFI=541
1.0%
MFI=1529
20.5%
MFI=6387
28.5%
MFI=4750
8.9%
MFI=3287
12.4%
MFI=3766
*Stimulated with CD3+CD28 beads at 0.25 beads:1 PBMC

% Suppression of activation can be calculated using the following formulas:
1. For the suppression of marker frequency:100-[(%Positive in presence of Treg / %Positive in absence of Treg) x100]
For example, using the numbers from the figures above, for CD4+CD154:100-[(8.9/20.5)x100] = 56.6% suppression
2. For the suppression of marker expression level:100-[(MFI in presence of Treg / MFI in absence of Treg) x100]
For example, using the numbers from the figures above, for CD4+CD154:100-[(3287/6387)x100] = 48.5% suppression
Calculating Percent Suppression
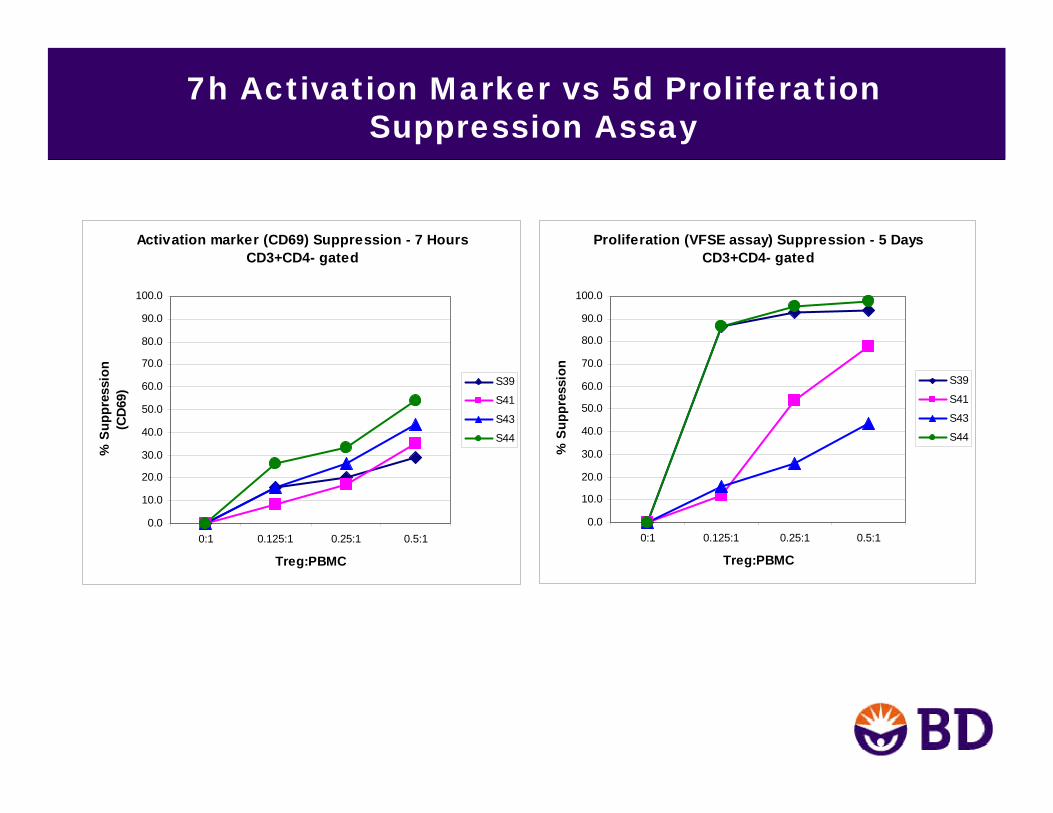
7h Activation Marker vs 5d Proliferation Suppression Assay
Proliferation (VFSE assay) Suppression - 5 DaysCD3+CD4- gated
0.0
10.0
20.0
30.0
40.0
50.0
60.0
70.0
80.0
90.0
100.0
0:1 0.125:1 0.25:1 0.5:1
Treg:PBMC%
Sup
pres
sion
S39
S41
S43
S44
Activation marker (CD69) Suppression - 7 HoursCD3+CD4- gated
0.0
10.0
20.0
30.0
40.0
50.0
60.0
70.0
80.0
90.0
100.0
0:1 0.125:1 0.25:1 0.5:1
Treg:PBMC
% S
uppr
essi
on(C
D69
)
S39
S41
S43
S44
Challenges
• Cellular product manufacturing
• Factors/sources that influence assay variability
• Well-defined reagents
• Instrumentation calibration
• Following detailed SOP

Suppression Assay ReproducibilityEffect of Treg Expansion Conditions on
Suppressive Function
35.6221.37% CD154 Sup. @ 0.25:1
36.2521.20% CD69 Sup. @ 0.25:1
66.8068.10%FoxP3
50ml18mlVolume
126.0x10650.5x106Total Cell Number
Harvest: (Day 14)
50ml in 2xT75 flasks*18.0ml in 6 well of 6*Day 12
16.8ml in T75 flask6.0ml in 2 well of 6*Day 9 (restimulated)
9.0ml to 9 well of 24*2.0 ml in 2 well of 24*Day 7 (rapamycin removed)
1.5ml to 3 well of 24*350 μl in 2 well of 96*Day 5
add 300 μl media+ rIL2add 50 μl media + rIL2Day 2
450 μl in 1 well of 24200 μl in 1 well of 96Day 0
CD45RA+CD45RA+Sorted as
All cells @ 2.5x10⁵/ml
Condition 2Condition 1Sort #32
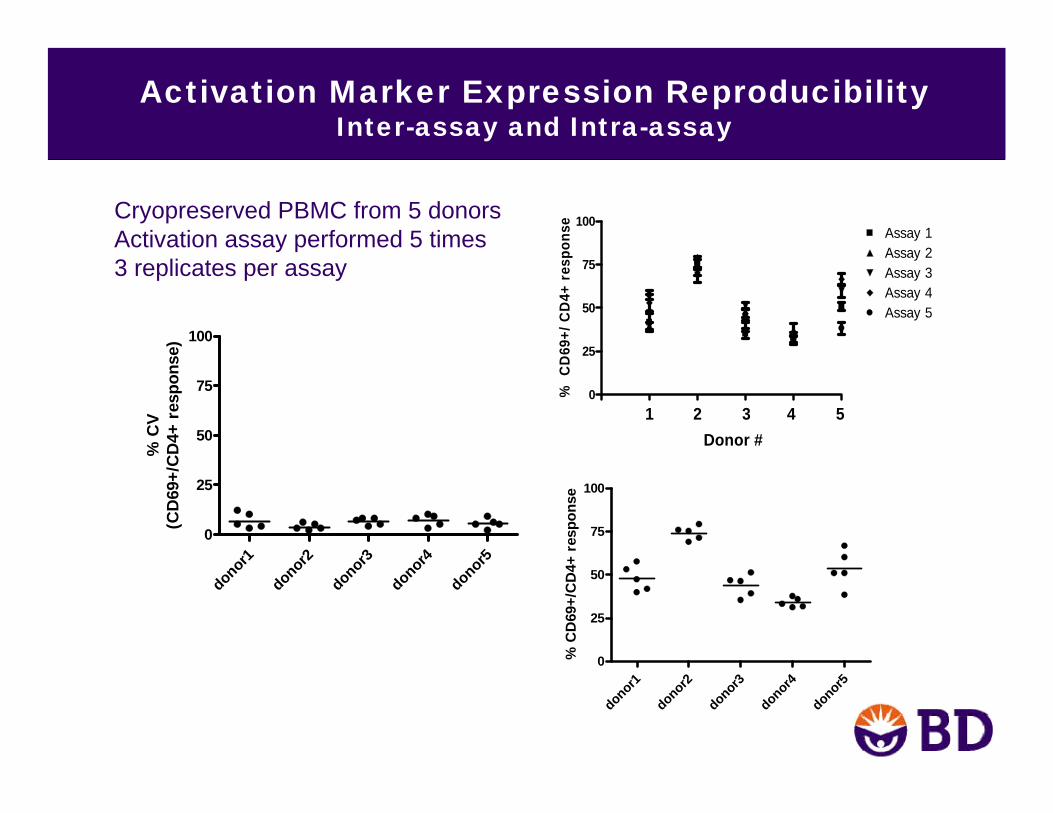
Activation Marker Expression ReproducibilityInter-assay and Intra-assay
donor1
donor2
donor3
donor4
donor5
0
25
50
75
100
% C
V(C
D69
+/C
D4+
res
pons
e)
donor1
donor2
donor3
donor4
donor5
0
25
50
75
100
% C
D69
+/C
D4+
res
pons
e
0
25
50
75
100Assay 1Assay 2Assay 3Assay 4Assay 5
1 2 3 4 5Donor #
% C
D69
+/ C
D4+
res
pons
eCryopreserved PBMC from 5 donorsActivation assay performed 5 times3 replicates per assay

Beta Test SitesSummary
•All test sites seemed very happy with the assay once they got it to work.
•Why the assay didn’t initially work at some test sites – Did not follow the protocol!
•What was done differently-Different ActivatorsDifferent platesDifferent activation timesDifferent cell numbersDifferent gating strategyDifferent mediaDifferent staining cocktailsQuality of cryopreserved PBMC post-thaw

Optimal Activation Conditions
Activators tested:• soluble CD3 + CD28/49d costim.• CD2/CD2R• SEB+CD3/CD28 beads• CD3/CD28 beads
Looking for good CD69 and CD154 expression without loss of CD3 resolution

Loss of CD3 Resolution with Activation
Unstim CD2/CD2RSEB+CD3/28
CD3/28 0.25:1CD3/28 0.5:1CD3/28 1:1

Activation with CD3/CD28 beads
0.010.020.030.040.050.060.070.080.090.0
100.0
Unstim 1:1 0.5:1 0.25:1
Bead:PBMC
%C
D69
Expr
essi
on
D1D2D3
0.010.020.030.040.050.060.070.080.090.0
100.0
Unstim 1:1 0.5:1 0.25:1
Bead:PBMC%
CD
154
Expr
essi
on
D1D2D3
CD69 CD154
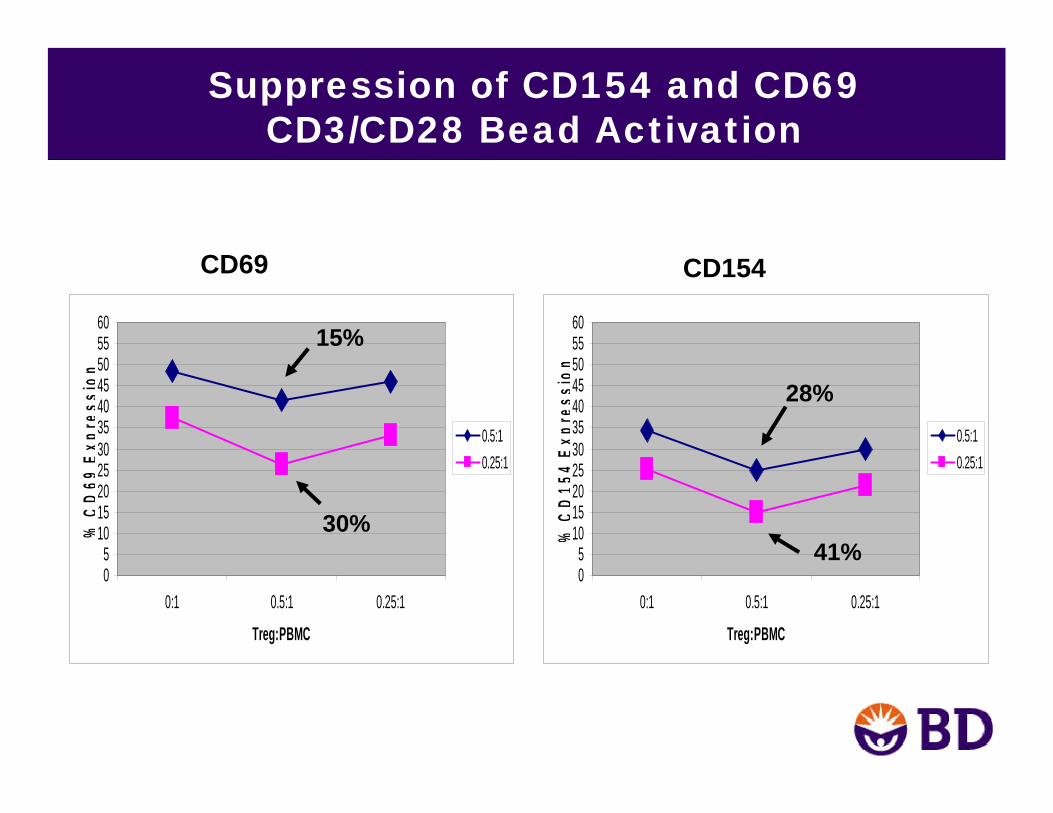
Suppression of CD154 and CD69CD3/CD28 Bead Activation
05
1015202530354045505560
0:1 0.5:1 0.25:1
Treg:PBMC
%C
D69
Expr
essi
on
0.5:10.25:1
05
1015202530354045505560
0:1 0.5:1 0.25:1
Treg:PBMC
%C
D15
4Ex
pres
sion
0.5:10.25:1
CD69 CD154
28%
41%
15%
30%
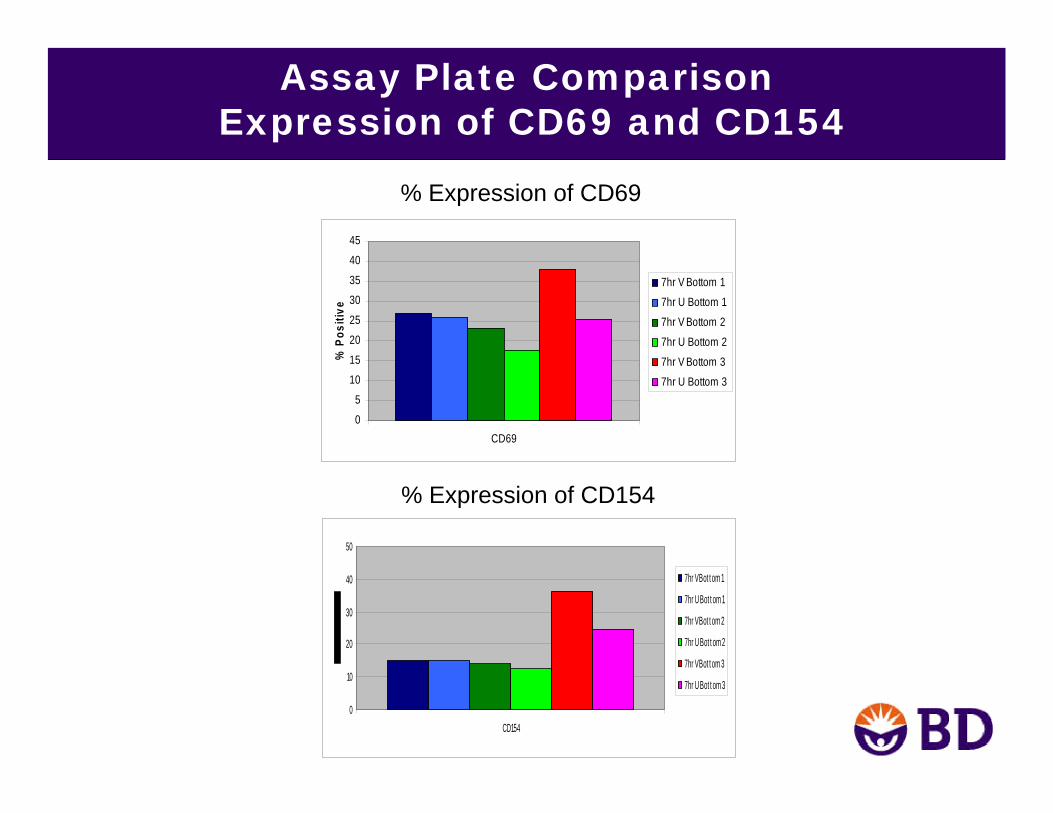
Assay Plate ComparisonExpression of CD69 and CD154
0
10
20
30
40
50
CD154
7hr V Bot t om 1
7hr U Bot t om 1
7hr V Bot t om 2
7hr U Bot t om 2
7hr V Bot t om 3
7hr U Bot t om 3
% Expression of CD154
0
5
1015
20
25
3035
40
45
CD69
% P
ositi
ve
7hr V Bottom 17hr U Bottom 1
7hr V Bottom 2
7hr U Bottom 2
7hr V Bottom 37hr U Bottom 3
% Expression of CD69

Polypropylene V-Bottom vsPolypropylene U-Bottom
CD154 SuppressionCD4+ T cellsDonor 2 (S34)
0102030405060708090
100
0.5:1 0.25:1 0.125:1
7hr V Bottom 7hr U Bottom
CD69 SuppressionCD4+ T cellsDonor 2 (S34)
0102030405060708090
100
0.5:1 0.25:1 0.125:1
Treg to PBMC%
Sup
pres
sion
7hr V Bottom 7hr U Bottom
% S
uppr
essi
on
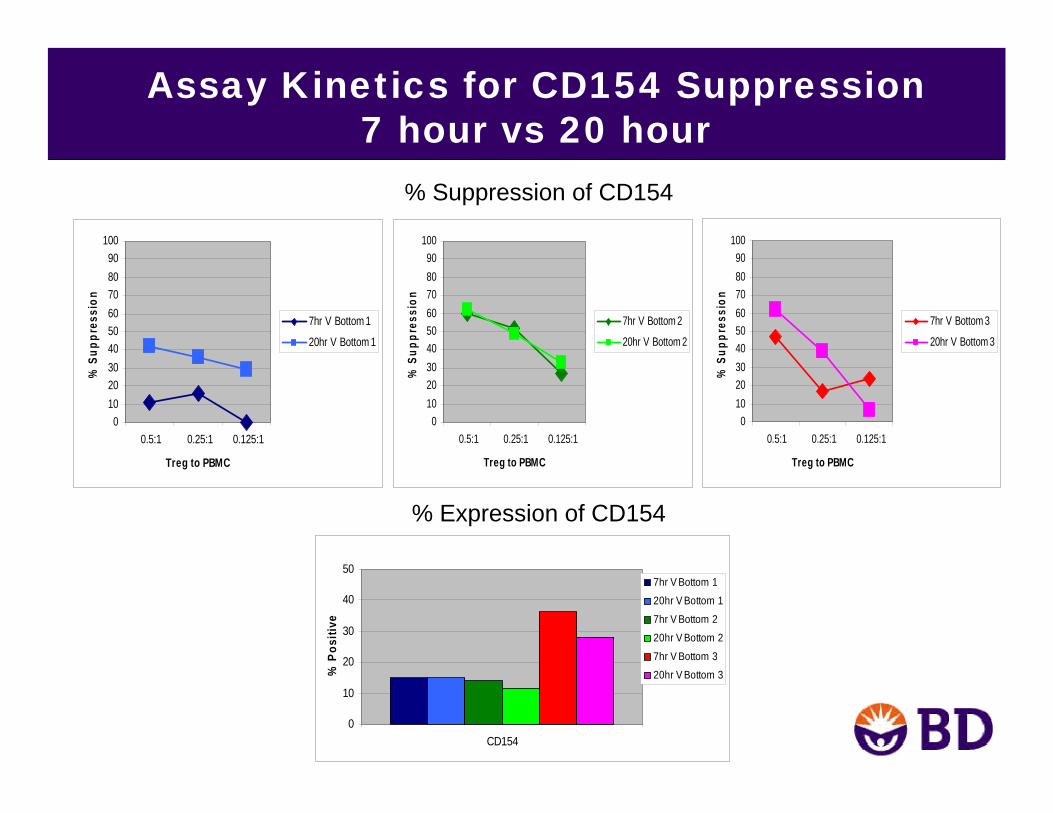
Assay Kinetics for CD154 Suppression7 hour vs 20 hour
0
10
20
30
40
50
CD154
% P
ositi
ve
7hr V Bottom 120hr V Bottom 1
7hr V Bottom 220hr V Bottom 2
7hr V Bottom 320hr V Bottom 3
0102030405060708090
100
0.5:1 0.25:1 0.125:1
Treg to PBMC
% S
uppr
essi
on
7hr V Bottom 3
20hr V Bottom 3
0102030405060708090
100
0.5:1 0.25:1 0.125:1
Treg to PBMC
% S
uppr
essi
on
7hr V Bottom 2
20hr V Bottom 2
0102030405060708090
100
0.5:1 0.25:1 0.125:1
Treg to PBMC
% S
uppr
essi
on
7hr V Bottom 1
20hr V Bottom 1
% Expression of CD154
% Suppression of CD154

Assay Kinetics for CD69 Suppression 7 hour vs 20 hour
0
5
10
15
20
25
30
35
40
45
CD69
% P
ositi
ve
7hr V Bottom 1
20hr V Bottom 17hr V Bottom 2
20hr V Bottom 2
7hr V Bottom 3
20hr V Bottom 3
0102030405060708090
100
0.5:1 0.25:1 0.125:1
Treg to PBMC
% S
uppr
essi
on
7hr V Bottom 1
20hr V Bottom 1
0102030405060708090
100
0.5:1 0.25:1 0.125:1
Treg to PBMC
% S
uppr
essi
on
7hr V Bottom 2
20hr V Bottom 2
0102030405060708090
100
0.5:1 0.25:1 0.125:1
Treg to PBMC
% S
uppr
essi
on
7hr V Bottom 3
20hr V Bottom 3
% Expression of CD69
% Suppression of CD69

Different Responder Cell Numbers in Activation Plate
CD154 CD69
Donor 1CD4+ CD154
0.0010.0020.0030.0040.0050.0060.0070.0080.0090.00
100.00
0:1 0.125:1 0.25:1 0.5:1
Treg:PBMC
% S
uppr
essi
on
5x10⁵ PBMC2.5x105 PBMC
CD4+ CD69
0.0010.0020.0030.0040.0050.0060.0070.0080.0090.00
100.00
0:1 0.125:1 0.25:1 0.5:1
Treg:PBMC
% S
uppr
essi
on
5x10⁵ PBMC2.5x105 PBMC
CD4+CD154
0.0010.0020.0030.0040.0050.0060.0070.0080.0090.00
100.00
0:1 0.125:1 0.25:1 0.5:1
Treg:PBMC
% S
uppr
essi
on
5x10⁵ PBMC2.5X105 PBMC
CD4+CD69
0.0010.0020.0030.0040.0050.0060.0070.0080.0090.00
100.00
0:1 0.125:1 0.25:1 0.5:1
Treg:PBMC
% S
uppr
essi
on5x105 PBMC2.5X105 PBMC
Donor 2

Excluding Treg from Suppression Analysis
Treg:PBMC = 0.5:1, n=19
Narrow Wide0
102030405060708090
100
CD25 gate
% S
uppr
essi
on
CD3+/CD4+/CD154 CD3+/CD4+/CD69
Narrow Wide0
102030405060708090
100
CD25 gate
% S
uppr
essi
on
P=0.0226 P=0.0414
46.5% 35.7% 36.6% 26.8%
Unstim/Unstained Unstim/Stained Stim/StainedA. C.B.PBMC Treg
narrow wide
9.3%

Conclusions
•Different stimulation times may result in variable suppression outcomes – still recommend 7 hours but, if decide to go longer, should pick one time and always use that time throughout a study.
•Different plates result in different suppression activity – highly recommended use polypropylene V-bottom plates. Polystyrene doesn’t work!
•Different responder cell numbers in the assay may result in different suppression amounts – appears to vary by donor. Should try to always use the same number of cells throughout a study.
•Different CD25 gating methods may result in different suppression outcomes - recommend the narrow CD25- gating strategy .
•Need to Follow the Protocol!!!

CD154 expression estimates liver graft rejection risk
Ashokkumar et al., 2009: Allospecific CD154+ T Cells Associate with Rejection Risk After Pediatric Liver Transplantation. Am J Transplantation 9:179

CD154 expression estimates liver graft rejection risk
Rejector Non-Rejector
Ashokkumar et al., 2009: Allospecific CD154+ T Cells Associate with Rejection Risk After Pediatric Liver Transplantation. Am J Transplantation 9:179
Threshold IR > 1.13
Acknowledgements
• Joyce Ruitenberg• Angelica Igano• Christopher Boyce• Ravi Hingorani• Tim Fong• Jurg Rohrer• Skip Maino