potential for using anaerobic settling tanks to optimize ... · web viewpotential for using...
TRANSCRIPT

Potential for using anaerobic settling tanks to optimize denitrification in an ecologically-engineered wastewater treatment system
Liz Fabis, Anna Brunner, Ed Anderson
Abstract
The Living Machine at Oberlin College is a wetland-based wastewater treatment system that is ecologically engineered and to removes harmful nutrients, organic matter, and pathogens found in human waste. A major design goal is for Nitrate, which is harmful to human health and aquatic ecosystems (EPA 2007), is to be removed from the Living Machine through denitrification, which transforms nitrate into nitrogen gas and water. Denitrification requires an anaerobic environment and a carbon energy source. The Living Machine’s last stage, an artificial anaerobic wetland, lacks the carbon needed for effective denitrification, resulting in higher nitrate concentration in the effluent than desired (Haineswood and Morse 2003). The Recycling through the anaerobic tanks exhibit potential to increase the Living Machine’s denitrification efficiency. To test our hypothesis, we added 4.1 kg KNO3 to the anaerobic settling tanks, increasing concentrations of each ion by 4 mM. After measuring the tanks’ nitrate and potassium concentrations over a two-week period, we calculated that denitrification accounted for 80% of the observed nitrate reduction in AN1, demonstrating that these tanks have the ability to denitrify recycled effluent. However, measures of biological oxygen demand and ammonium indicate that the additional nitrate caused an increase in ammonification in the anaerobic tanks [you don’t actually know this. What you DO know is that it caused an increase in the surface concentration of NH4 – existing NH4 may simply have been released from the sediments as a result of mixing via nitrogen bubbles], which increased nitrification and thus nitrate concentrations in the closed aerobic tanks downstream. Recycling effluent into the anaerobic tank may actually increase effluent nitrate concentrations. However, mMore research with lower concentrations of introduced nitrate must be conducted before any plan to use the anaerobic tanks for denitrification can be implemented.
[Good clear abstract]
Introduction
The Living Machine at Oberlin College is an ecologically engineered wastewater treatment system designed to remove organic matter, nutrients, and pathogens harmful to human health and the health of downstream water systems. Water from the bathrooms of the A.J. Lewis Center moves through a series of tanks, each containing organisms and conditions that provide specific wastewater treatment functions (Fig. 1) [mention that water is recycled from the Living Machine through the toilets]. Different environments facilitate different activities: primary treatment removes inorganic and solid material; secondary treatment removes labile organic matter; and tertiary treatment removes nitrogen and phosphorous as well as human pathogens (Drinan 2001).
The removal of nitrogen requires several steps utilizing different types of bacteria (Operations and Maintenance Manual 1998). Upon entering the system’s anaerobic settling tanks (AN1 and 2), organic nitrogen, present in human waste, is converted to ammonium ((NH4) by ammonification. Water then flows into the closed aerobic tanks (CA1 and 2), where nitrification converts the ammonium to nitrate (NO3). Water then travels through …[describe OA tanks in one sentence and then clarifier]. Later In the final treatment stage ofin the Living Machine, an artificial wetland is supposed to remove the nitrate through denitrification, a chemical process that converts nitrate to harmless nitrogen gas, which makes up a majority of Earth’s atmosphere: C6H12O6 + 4NO3 6CO2 + H2O +

2N2 + energy. The artificial wetland has the necessary anaerobic environment to convert nitrate to harmless nitrogen gas, but an earlier study suggests that it lacks sufficient organic carbon for the reaction to take place (Haineswood and Morse 2003). As a result, the effluent has higher nitrate levels than desired, averaging about 20 mg/L NO3-N (Turner 2004).
High levels of nitrate can cause algal blooms in aquatic ecosystems and “blue baby” syndrome in humans, so it is important that wastewater treatment systems adequately decrease nitrate concentrations (Camargo and Alonso 2006; US EPA 2007). Camargo and Alonso concluded that levels of total nitrogen less than 0.5 to 1.0 mg/L could prevent most aquatic ecosystems from experiencing eutrophication from inorganic nitrogen pollution. A similar ecologically engineered wastewater treatment system, the Marion, Massachusetts artificial wetland, reported effluent NOx-N concentrations of 1.7 mg/L (Hamersley and Howes 2002). Though the Living Machine is currently a semi-closed system and does not release effluent out into the municipalitya natural body of water, it strivesa goal of Oberlin College is for it to be serve as a model for ecologically engineered wastewater treatment systems [Note that it DOES overflow into the municipal sewer system – typically about 30% of the water]. Improving the Machine’s ability to remove nitrate is therefore desirable.
One way wastewater treatment plants remove nitrate is by utilizing a recycling loop that sends water that has undergone nitrification back through “an anoxic reactor at the beginning of the tank” where a source of carbon is present (Operations and Maintenance Manual 1998). Such recycling and feedback is a typical aim of ecologically engineered systems, to best take advantage of the different conditions offered by each subsystem (Todd 1996). However, this type of recycling does not currently occur within the Living Machine. Though Turner (2004) concluded that the AN1 tank would be more effective at denitrification than the marsh, no studies of the Living Machine to date have comprehensively examined the AN tanks’ potential for denitrification.
To test the ability of the AN tanks to denitrify high concentrations of introduced nitrate, we added potassium nitrate (KNO3) to the AN tanks and observed changes in concentration of both NO3
- and K+ over time. We hypothesized that the AN tanks would rapidly consume nitrate because of the ideal environment for denitrification, but suspected the addition of nitrate could possibly result in adverse consequences. One potential consequence is a phenomenon known as “popping” or “pop-ups,” where nitrogen gas produced through denitrification in the bottom sludge causes particulate matter and high nutrient bottom water to float circulate to the surface, introducing more carbon- and nitrogen-rich material into the water (Ramalho 1983). To monitor downstream tanks for adverse effects of our experiment, we took measurements of biological oxygen demand (BOD5), which quantifies the amount of labile nitrogenous ammonium and carbonaceous material present in the water, and measured ammonium concentrations in the AN1 and CA2 tanks.FIG. 1. Flow of wastewater through the Living Machine. Tanks that concern our experiment are both anaerobic
(AN1 and AN2), one close aerobic (CA2), and the clarifier.
Flow Anaerobic Open Aerobic
ClarifierArtificialWetland
EffluentHolding
Tank
UV FilterPressure
Booster Tank
Restrooms
Recycling Line
ClosedAerobic

Materials and Methods
Samples were taken from AN1, AN2, and CA2 (Fig. 1). The surface water in these tanks is visibly heterogeneous in floating solids abundance. Samples from AN1 and AN2 were therefore taken after mixing the surface of each tank with the sampling pole to reduce the effect of within-tank variability [probably worth mentioning here that your preliminary analysis indicated that nitrate concentration was, indeed, heterogeneous in surface water, I think even after mixing – this is important info for future researchers]. We purposefully tried not to disrupt the bottom sludge so as to diminish increasing particular matter and BOD5
[useful to measure depth of tank and depth of sludge – sludge can be measured with a “sludge judge” which we use in the clarifier. I believe you sampled at multiple locations within the surface to ensure representative average sample. If this is so, it is important to mention]. Samples from AN1, AN2, and CA2 were first filtered through cheesecloth to remove particulates. BOD5 and CBOD5 measurements were started immediately after sampling, using standard methods from the Standard Methods for the Examination of Water and Wastewater (Clesceri et al., 1998) [dilution factor?]. NBOD5 was obtained determined from the difference between BOD5 and CBOD5. Samples for other measurements were filtered through a glass fiber filter and stored at -20 C for later nutrient useanalysis. Potassium and nitrate concentrations were measured on a Dionex ion chromatograph (Clesceri et al., 1998). Ammonium concentration was measured with an Orion probe (Clesceri et al., 1998).
Initial samples were taken on 10/31, 11/5, and 11/6 prior to KNO3 addition. These samples were used to establish baseline concentrations and appropriate dilution factors for later measurements. On 11/6, we added 2.05 kg of technical grade KNO3 in solution to AN1, and an additional 2.05 kg also in solution to AN2. Each tank was stirred at the surface to obtain a uniform concentration after the addition. Samples were taken immediately and then approximately 1, 2, 4, and 8 hours later. Daily samples were taken from 11/7 through 11/16. BOD5 measurements were taken starting on 11/6 and 11/16. We measured nitrate concentrations of all samples on the IC using an anion column [for a publication it would be important to report the precise column and eluent procedure used]. Ammonium concentration was measured in AN1 and CA2 for initial samples and every other day after the KNO3 addition. Potassium concentration was measured by IC using a cation column, using the samples not consumed by ammonium measurement.
[You need to describe the method by which you separated out loss of nitrate from the tanks that occurred due to dilution from the loss of nitrate that occurred due to denitrification. Specifically how did you use K+ as a passive tracer?]
Results
Nitrate is removed from the AN tanks primarily by denitrification. After the initial addition of KNO3 on 11/6, AN1 and AN2 have a spike in both K+ and NO3
- concentrations as expected (Fig. 2a, b). In AN1, both ions decrease in an exponential manner. However, NO3
- decays at a much higher rate, with an exponential decay rate constant of .027 hr -1, while K+ has a much smaller rate constant of .0057 hr -1 (Table 1). Since K+ is not directly involved in any chemical cycling within the anaerobic environment [would be useful to include a citation here], it is biologically inert and its removal from a given tank can be attributed dilution and flow. NO3
- will also be removed by outflow in the same manner, so the difference between the decay constants for each ion represents the effect of denitrification. Calculating that difference, we see that 80% of the nitrate removal from AN1 is due to denitrification. In AN2 the situation is complicated by the high-concentration inflow from AN1, but we can qualitatively see the same overall trend.

TABLE 1. Best fit exponential decay constants for [K+] and [NO3-] increases in AN1. Functions are of the form
[X] = A e(-B*t).
In CA2, nitrate levels increase more than can be accounted for by outflow of NO3 [?] from the AN tanks. After the initial KNO3 addition to the AN tanks, NO3
- concentration in the CA2 tank
increases more rapidly than K+ concentration (Fig. 2c). If NO3 is considered alone, tThis result is surprising considering that NO3
- is always present at a lower concentration than K+ in AN2 [logic of this sentence is not clear. In prior sentence you are discussing relative rates of change and here you are talking about one concentration vs the other.]. Water flowing into CA2 will then have less NO3
-, so we would expect to see higher K+ concentrations. This large nitrate increase can therefore not be accounted for by flow alone.
NO3 total K total NO3
denitrificationNO3 flow
A 4.0 mM 3.7 mM 4.0 mM 4.0 mMB .027 hr-1 .0057 hr-1 .021 hr-1 .0057 hr-1
Percent total 79% 21%
Table 1. Best-fit functions for AN1

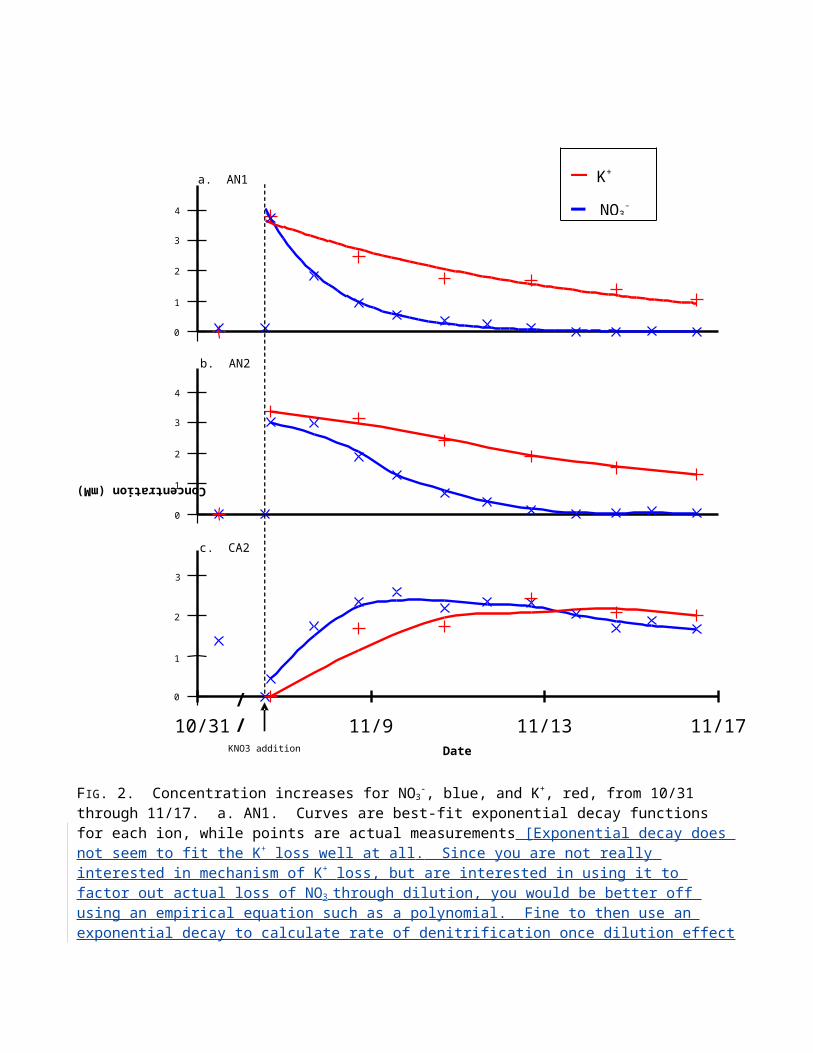
FIG. 2. Concentration increases for NO3-, blue, and K+, red, from 10/31 through 11/17. a. AN1. Curves are
best-fit exponential decay functions for each ion, while points are actual measurements [Exponential decay does not seem to fit the K+ loss well at all. Since you are not really interested in mechanism of K+ loss, but are interested in using it to factor out actual loss of NO3
through dilution, you would be better off using an empirical equation such as a polynomial. Fine to then use an exponential decay to calculate rate of denitrification once dilution effect is factored out] . b. AN2. Curves represent moving averages of each ion. c. CA2. Curves represent moving averages.
Ammonium and BOD5 increased in the AN tanks as an indirect result of denitrification. BOD5 levels approximately doubled over the course of our experiment (Fig. 3). All noted differences were statistically significant, except for NBOD5 in AN2 [You can’t really do statistics here since you have
10/31 11/9 11/13 11/17Date
1
4
2
3
a. AN1
c. CA2
b. AN2
0
1
4
2
3
0
1
3
2
0
KNO3 addition
Concentration (mM)
//
— K+
— NO3-

analytical replication rather than actual replication (i.e. what you are doing pseudoreplication)]. One triplicate of BOD5 data for AN2 from 11/16 showed no change, creating a discrepancy, and so this negative value was left out of our calculations. We concluded that this lack of change was due to air bubbles in the samples. A BOD5 test was run on 11/10 and was thrown out on 11/15 due to air bubble contamination.
0
20
40
60
80
CBOD AN1 NBOD AN1 CBOD AN2 NBOD AN2
Conc
entr
atio
n (m
g/L)
BeforeAfter
FIG. 4. Before and after CBOD5 and NBOD5 for AN1 and AN2. Both CBOD5 and NBOD5 increase in concentration over time. All are statistically significant except for NBOD5 for AN2. Error bars are calculated from standard error among analytical replicates [it is useful to include these error bars, but they provide information about the quality of your analytical replication – i.e. how well you can reproduce your measurements rather than information about variability among actual experimental replicates (which we unfortunately do not have in our LM system)]. “Before” measurements were recorded on 11/6 and “After” measurements were recorded on 11/16.
After the KNO3 addition on 11/6, we measured a steady increase in ammonium levels (Fig. 4), consistent with the increased NBOD5. In the anaerobic conditions of the AN tanks, we can rule out the conversion of the added nitrogen from a nitrate species to an ammonium species [actually, you can probably rule this out in all of the tanks]. The increase can be accounted for by “pop-ups” from the sludge. This, in turn, causes BOD5 and ammonium rich matter from the sludge to float to the surface [this seems like a sensible conclusion here, but this mechanism is distinct from the “increase in ammonification” you invoke in your abstract]. We also observed an increase in turbidity and floating solids over the course of our experiment, consistent with this explanation. [Good]
[You could have used your NBOD measures in you’re AN tanks to calculate a rate of NH4 production and then used this to estimate the addition of “new” nitrogen as a function of the popping. This would
have allowed you to more directly assess whether the added N in the CA tanks could be explained as a function of the changes in the biological activity of the AN tanks]
FIG. 4 Ammonium concentration over time in the AN1 and CA2 tanks. Ammonium levels increase in the anaerobic tank at a faster rate than in the closed aerobic tank. Average lines are calculated running averages.
Nitrification in the CA tanks can account for the larger than expected nitrate increase. The dominant transformations of nitrogen in the CA tanks include ammonification and nitrification. [Say a bit more about why you think ammonification might also be increasing in the CA tanks. I think the mechanism you might be invoking here is that you have more nitrogen containing organic matter entering the CA tanks from the AN tanks than you normally would as a result of the”popping” effect. But you need to explain this] Any organic nitrogen from the AN tanks would be converted to ammonium, and then all ammonium would be converted to nitrate [some of this may be occurring in the AN tanks, but in this case you measure this as ammonium in the AN tanks. The unknown addition is an increase that may occur in organic nitrogen entering the CA tanks. I think that a very careful analysis of your data (which would have to take recycling into account) could be used to isolate new organic nitrogen added]. By this mechanism, the ammonium indirectly released by denitrification would result in a nitrate increase in CA2. This accounts for the greater than expected increase in nitrate seen in CA2.
Conclusion
10/31
0
1
2
3
4
5
6
7
8
10/31 11/06 11/08 11/10 11/12 11/14 11/16 Date
AN 1 CA2
Conc
entra
tion
(mM)
//

Our measurements show that a significant amount of denitrification occurred can occur in the AN tanks. However, our experiment suggests recycling could possibly increase, rather than decrease, the amount of nitrate in the effluent. The production of nitrogen gas caused by denitrification in the sludge increased the ammonium in the AN tanks. This increase led to more nitrification in the CA tanks, and thus a greater amount of nitrate in the system. We can conclude that introducing high concentrations of nitrate to the AN tanks will ultimately increase nitrate in the Living Machine.
However, our experiment added orders of magnitude more nitrate than what would be introduced in a recycling loop [It would be useful for you to mention typical concentrations of nitrate in the clarifier and then discuss magnitude of nitrate that would be added with a range of recycling flow rates]. It is possible that the system was overwhelmed by the high concentration of nitrate, which led to excess nitrate settling into the bottom sludge, where the “pop-ups” occurred. The introduction of smaller amounts of nitrate may be fully consumed by denitrifying bacteria before it enters the bottom sludge [good]. In addition, a future study may want to examine the impact of increased flow to the anaerobic tanks. Any recycling loop would add more water in addition to more nitrate, increasing the flow through the Machine. We did not manipulate water input during our experiment [good]. A third possible future study would examine the effects of stirring the anaerobic tanks. It is possible that the increase in BOD and ammonium may have increased not due to “pop-ups,” but due to our stirring technique releasing matter from the bottom sludge [good]. Again, a recycling loop would feed into the anaerobic tanks in a less disruptive way.
From this study, we cannot recommend effluent recycling through the AN tanks. While we observed a clear denitrification potential, we can’t say whether the possible benefits will outweigh the negative effects of such a loop. The effects of introducing lower nitrate concentrations, increased water flow, and our study’s own potential sources of error must be examined in greater detail. An alternative to recycling flow back through the anaerobic tanks may be to install a tank between the artificial wetland and effluent holding tank that contains anoxic waters and a synthetic source of carbon to further denitrify the wastewater. This alternative would avoid the complications of popping that we experienced in our project, and future research may examine how such a tank would be constructed. [Probably not necessary to have another tank. In some other wetland treatment systems, including other LM systems, acetate is added directly to marshes as an organic carbon source for denitrification]
Very nice conclusion.
We affirm that we have adhered to the Honor Code in this assignment
Anna BrunnerLiz FabisEd Anderson

Work Cited
Camargo, J.A., and A. Alonso. 2006. Ecological and toxicological effects of inorganic nitrogen pollution in aquatic ecosystems: a global assessment. Environment International 32: 831-849.
Clesceri, L.S., A.E. Greenberg, and A.D. Eaton, eds. 1998 Standard Methods for the Examination of Water and Wastewater, 20th edition. United Book Press Inc., Baltimore, Maryland.
Drinan, J.E. 2001. Water and Wastewater Treatment: A Guide for the Nonengineering Professional. Lewis Publishers, Boca Raton, Florida.
Haineswood, T., and N. Morse. 2003. Low organic carbon limits denitrification in the marsh of an ecologically engineered wastewater treatment facility at Oberlin College. Unpublished report.
Hamersley, M.R., and B.L. Howes. 2002. Control of denitrification in a septage-treating artificial wetland: the dual role of particulate organic carbon. Water Research 36: 4415-4427.
Operations and Maintenance Manual. 1998. Living Machine for Oberlin College, Oberlin, OH.
Ramalho, R.S. 1983. Introduction to Wastewater Treatment Processes, Second Edition. Academic Press, New York, New York.
Turner. 2004. Nitrogen dynamics and metabolism in a greenhouse-wetland wastewater treatment system: the Oberlin College Living Machine. Unpublished report.
Todd, J. and B. Josephson. 1996. The design of living technologies for waste treatment. Ecological Engineering 6: 109-136.
U.S. EPA. 2007. Nitrates and Nitrites. Toxicity and Exposure Assessment for Children’s Health.

Appendix 1. Division of Labor
Literature search: Liz, Anna, and EdNarrowing down topic: Liz, Anna, and EdMeeting with John Petersen throughout the project: Liz, Anna, and EdSampling from all tanks: Liz, Anna, and Ed (various days)BOD DO measurements and buffer 10/31: Liz and AnnaBOD DO measurements and cleaning 11/5: AnnaBOD DO measurements and buffer 11/6: LizBOD DO measurements and buffer 11/10: Anna and EdBOD DO measurements and cleaning 11/11: AnnaBOD DO measurements and buffer 11/16: Liz and AnnaBOD DO measurements and cleaning 11/21: EdAmmonium Orion run 12/1: Liz and AnnaAmmonium run material cleaning 12/1: AnnaFiltering samples to freeze throughout the project: Liz, Anna, and EdIC run 11/2: EdIC run 11/6: EdIC run 11/7: EdIC run 11/19: EdIC run 12/4: EdFinal clean-up (frozen samples and bucket of hazardous waste cheesecloths): EdAmmonium graph I: LizNitrate graph I: LizAmmonium graph II: AnnaCBOD and NBOD graph: AnnaNitrate and potassium graph: EdProject proposal abstract and title: Anna (with Liz and Ed edits)Project proposal introduction: Liz (with Anna and Ed edits)Project proposal material and methods: Anna (with Liz and Ed edits)Project proposal results and conclusion: Ed (with Liz and Anna edits)Project proposal time line: Anna (with Liz and Ed edits)Poster manipulation: LizPoster Living Machine figure manipulation: LizPoster introduction: Anna (with Liz and Ed edits)Poster methods and results: Ed (with Liz and Anna edits)Poster conclusion: Anna (with Liz and Ed edits)Compilation of data and graphs: AnnaPaper abstract: Anna (with Liz and Ed edits)Paper introduction: Liz (with Anna and Ed edits)Paper methods: Anna (with Liz and Ed edits)Paper results: Ed (with Anna and Liz Edits)Paper graph and figure legends: Anna (with Liz and Ed edits)Paper division of labor: Anna (with Liz and Ed edits)
We all feel like we did relatively equal amounts of work, with certain people specializing in certain project area (ex: Ed did IC work, Liz and Anna did most BOD work and all ammonium measurements)
1. Title

>Clearly indicates what you did and ideally what you found. Y2. Abstract (250 word max)>Summarizes what you did, how you did it, what you found, and why it is important. Y3. Introduction/Background>Sets context by describing the overall problem that research addresses and appropriately situates this in larger ecological and societal context. Y>Cites relevant primary and secondary literature to support arguments (minimum of four citations). Y>Problem statement establishes gap in knowledge, need for research, and describes how your research fills gap. Y>Clearly states mechanistic hypotheses explaining what you expected to observe and why. Y4. Methods (revised from proposal)>Describes what you did in sufficient detail that someone could repeat your experiment. See comments in text>Answers what, where, when, and how you made your measurements. Y>Includes diagrams, maps of sampling, tables, timelines as appropriate (only if appropriate).OK>References literature where appropriate (who’s procedure did you follow?). Y5. Results:>Includes text, tables, graphs & figures that describe but do not explain results. Y>Explains calculations. Y>Indicates statistical significance. See comments>Does not present same data in both tables and graphs. Y6. Analysis & Discussion:>Interprets and critically analyzes your findings. Y>Explores connections between your findings and those of other studies (agreement, disagreement, relevance). Might have done a bit more to assess your results in light of work of others.>Addresses the usefulness and limitations of the methods you used. Y>Addresses limitations of findings and suggests further research that might extend or more conclusively addresses your initial hypotheses and findings. Y, excellent7. Literature cited:>Uses format of the journals Ecology or American Naturalist. Y>Does not use footnotes. Y8. Figures and figure legends: (tables, graphs, conceptual models, etc. that appear in introduction, results, and analysis & discussion sections) Y>Text legend below each figure describes content in sufficient detail that reader can understand what the figure represents without reference to text in manuscript . Y>Symbol legend within the frame of each graphic indicates what different color bars, lines or shapes represent. Y>Figures are numbered sequentially in the order in which they appear in the paper. Y>Every figure that appears in paper is directly referenced within the paper. Y>Units are indicated either within the figures (often in the x and y axis labels) or in the text legend. Y9. Appendix 1: Division of labor: >Describes role of each group member in developing and implementing the project.[Very clear description of who did what. Very helpful10. General comments:
Liz, Anna and Ed:
I have made extensive comments within the body of your text. I think there is more that you could have done with the data, particularly with respect to estimating rates of added ammonium release in the

AN tank and then using this to consider the relative importance of new ammonium and new organic nitrogen as contributors to the increased N in the CA tanks. But the fact is that this was a particularly ambitious project and you folks really were over the top in terms of the effort you put into this study. This was a highly successful study and your analysis and write up are generally excellent. I have learned quite a bit that I did not know about the nitrogen dynamics of the LM from this work. Like any good research, your results and conclusions raise a host of new questions and possibilities for further research.
Your poster was informative and generally well organized. Your presentation was well organized, but might have benefited from additional rehearsal. Anna, you were a bit focused on your notes. Ed, you were clearly thinking and organizing your presentation on your feet; in the time constraints of a poster presentation it is preferable to have the wording down. Liz, your presentation was particularly clear with good eye contact. In their comments, your fellow class members indicated a need for clearer explanation of goals and hypotheses.